Embed Size (px)
Citation preview

1

2

3

Geo-enable the enterprise- The power of location
- There is a wealth of decision-support information hidden in your data that you cannot ever see when you look at it in systems like Excel, SharePoint, SAP
- This the information about location- Where are things happening?- Why are things happening there?- What is different about here vs. there
- The power of the ArcGIS platform- Content
- Maps- Data about locations
- Analysis
4

Esri Location Analytics core capabilities:
Mapping visualization• See your data on maps in innovative ways, far beyond simple “dots on a map”
solutions.• Answers the “Where” question
Spatial analytics• Why?• Bi-directional communication between the map and other key business data
enables analysis based on location.
Geographic information enrichment• External spatial data including demographics, lifestyle, business, and weather.• Here
(This slide really sets the stage for the demo)
5

Map Visualization is about putting your data on a map and letting it speak.It is visual analytics where patterns become apparent when you see your data on a map
More than dots on a map:- Clustered points – identify - Heat maps- Color coded thematic maps- Graduated sizes- Custom boundaries
6

Spatial analytics enables you to delve deeper into spatial patterns in your dataTo answer questions like:- Find me the customers within 30 miles of an event I am planning so that I can
market it to them: Select and Find nearby- Where do I locate a warehouse based on customer locations and sales per
customer: Find hot spots
7

ArcGIS includes a living atlas to the world, with beautiful and authoritative maps on hundreds of topics, including demographics, businesses, consumer lifestyles, and natural hazards.
You can use this information to enrich the maps you create- enrich your data, like your spreadsheets- Illustrate characteristics of your location using rich infographics
The benefit: by getting a more complete picture of your market you can make much more informed decisions.
8

Quickly and securely share the maps you create across business systems and devices.
Use this capability to collaborate and break down silos across your organization.
Deploy Esri’s mapping solutions in the cloud, on-premises, or a hybrid of both.
9

BI – microstrategyCRM – Dynamics CRMERP – SAPCMS – sharepoint and cognos
10

Democratizing and accessible
11

12

13

14

15

16

17
18

• ArcGIS provides access to a huge wealth of geographic information about places and areas
• It does this in a number of ways, for example through maps, map layers, InfoGraphics and reports
• ArcGIS also provides the ability to enrich your own data with this geographic information
19

Demographic Map Services
Overview: Esri intends to publish a set of demographic maps and data layers that can be used to create color-coded maps using a variety of demographic attributes that are available for different geographies. The maps would be symbolized by one attribute with standard symbology by default but users could modify the renderer to display different attribute or symbology and save as separate layers in a web map. The maps will be available to users with an ArcGIS Online subscription. Maps would include:
USA Demographics: set of over 4,000 variables available up to 11 levels of geographyCanada Demographics: set of over 2,000 variables available up to 10 levels of geographyFrance Demographics: set of over 100 variables available at up to 5 levels of geography
Similar country demographic maps (e.g. Germany, Spain, etc.) would be published for a few dozen other countries where data is currently available. There are expected to be approximately 45 countries available for the initial release in March, with several more to be added later.We may choose to consolidate these map services as group layers in a smaller set of regional services (e.g. Europe Demographics) for the sake of service efficiency and performance.
USA DemographicsMaps presenting multiple levels of geography:
CountryStateCongressional DistrictCountyDMACounty SubdivisionZIP CodeCensus TractCBSABlock Group
Maps include over 4,000 current year and projected year variables for each level of geographyWill be built initially using 2012/2017 demographics, tapestry, and consumer expenditure data.Map service will likely need to reference separate FGDB datasets that each contain up to 2,000 attributes.
Maps are configured so that users can view either:All Scale Levels by Multiple Geography: zoom in from national view displaying states to detailed local view displaying block groups. The default levels of geography to be displayed as visible are the ones in bold above (e.g. state, county, zip code).Multiple Scale Levels for a Single Geography: select a single geography (e.g. counties) and view across multiple scale levels.
Some geography levels (e.g. ZIP Codes, block groups) may only be available out a minimum scale less than national coverage (e.g. statewide).The geography levels will be available at multiple levels of generalization to support use at different scale levels.
France DemographicsMaps presenting multiple levels of geography:
Country1st Order Admin (e.g. Province)2nd Order Amin (e.g. County)Postal
Maps include over 100 current year variables for each level of geographyMaps may be combined with similar demographic data for other countries in the regionMaps are configured so that users can view either multiple geographies or single geography like described above.
Boundary Maps
Overview: Esri intends to publish a set of boundary map services that can be used to create color-coded maps using user-provided attributes or as simple boundary layers that would be displayed on top of a basemap (e.g. imagery) or operational layer (e.g. federal lands) for reference purposes. The maps would be symbolized with boundary layer symbology by default but users could modify the renderer to display different symbology and save as separate layers in a web map. The maps will be available to users with an ArcGIS Online subscription.
The plan is to re-purpose the demographic map services to be used to display the corresponding boundaries. Esri will create boundary map service items symbolizing the polygonal data used in the demographic map services as boundary layers with labels. Users will also be able to symbolize the polygonal data using their own data and the unique codes (e.g. FIPS code for US states and counties) available with the polygonal data. This will ensure that the boundary layers are consistent with the demographic data that is published, and reduce the need for additional maps to be published.
Map Items
Esri will create several dozen unique map items on ArcGIS Online (arcgis.com) that display different demographic attributes (e.g. median income, population density, median age, etc.) and boundary data (e.g. states, counties, zip codes). The map items will be used to persist different renderings of the demographic maps described above, rendering based on different attributes and with different classifications and symbology. The map items will be available for users to add to web maps and use in various ArcGIS applications.
20

21

22

The Preformatted demographic and lifestyle reports are available today via Business Analyst and Community Analyst.
In most countries we’ll have at least one report
In the USA and Canada we’ll have many more.
By July the reports will be available via other apps and will be accessible to developers via our APIs.
23

All of the solutions will integrate seamlessly with ArcGIS Online and Portal for ArcGIS,
so that you can access all the content, groups and basemaps from your organization
And so that you can securely save the maps you create back to ArcGIS Online or to your Portal
24
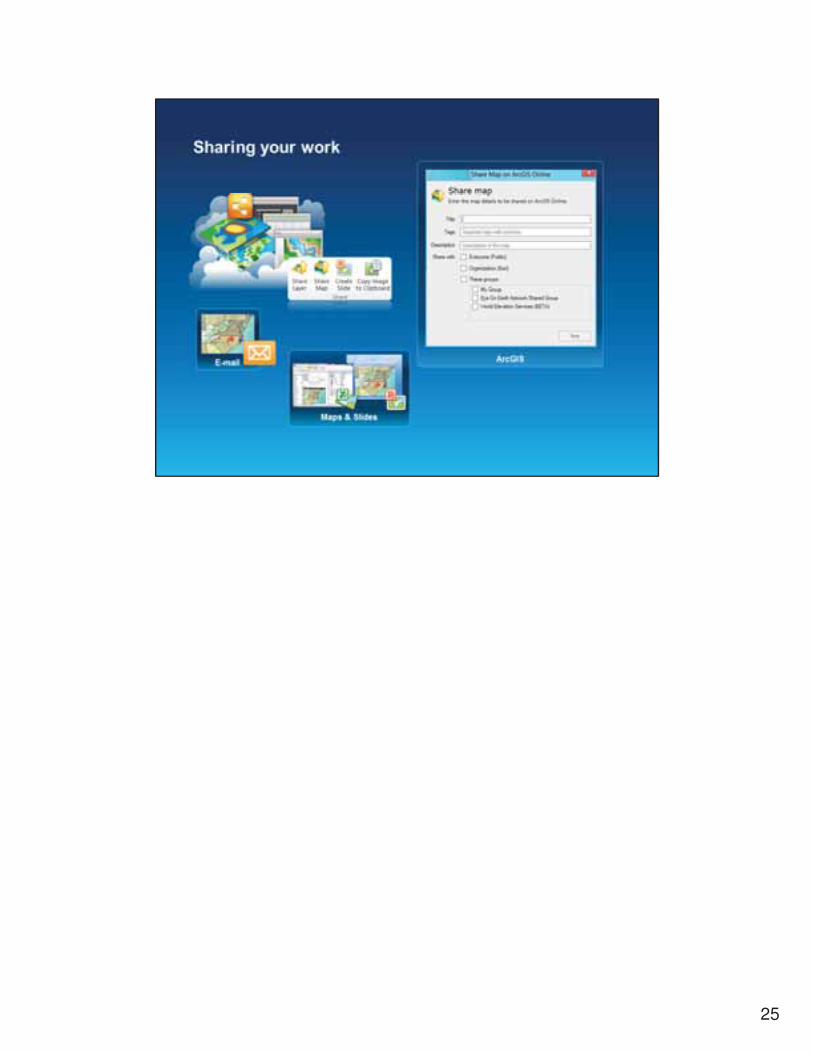
25

Share
26

27

15-20 minutes
28

29

Descriptive and Predictive Analytics
Discover the pattern: Where do things occur? Where do I sell more?
Understand the pattern: What’s special about these places? Why do I sell more here and not here?
Predict patterns: What is changing about this place? What will this place look like in the future?
Find and locate: Now that I know I do well in places like these, find me more places that fit these criteria
30

31

Fall 2013
32

33

PLEASE INCLUDE THIS SLIDE
Presenters:
Offering ID – this is in your presenters schedule or the printed agenda (not in the online agenda
this year)- please be sure to update the slide with both IDs if you have more than one
session
For attendees: Here are the instructions for users to access the system.
The UC surveys can be accessed from:1. My UC Homepage > Evaluate sessions2. www.esri.com/ucsurveysessions
The MyUC login is on the back of their badges.
The session can be found through:1. My planner listings on survey search page2. Using the Search based on:
• Topic, Date, workshop type and event• Offering ID – this is in your schedule or the printed agenda (not in the online
agenda this year)
There are 6 quick multiple choice questions plus a space for commentsThursday: 952/1402Friday: 952/2195
34

35