Embed Size (px)
Citation preview

Armien EdwardsChief EngineerEskom - SO&PSouth Africa
Eskom Wide Area Monitoring System

2
Enabling Technologies
•GPS technology
•IP Based Telecommunications networks
•Highly accurate IEDs in substations–Phasor Measurement Units
-
ディジタルセンサ(CVT) CB,LS制御 機器監視センサーDigital Sensor(CVT ) CB,LScontrol
GISIntelligentSwitchgear
ITV(((( ))))
【【【【 】】】】
WAN
IED

3
Synchronised Phasor Measurements
4
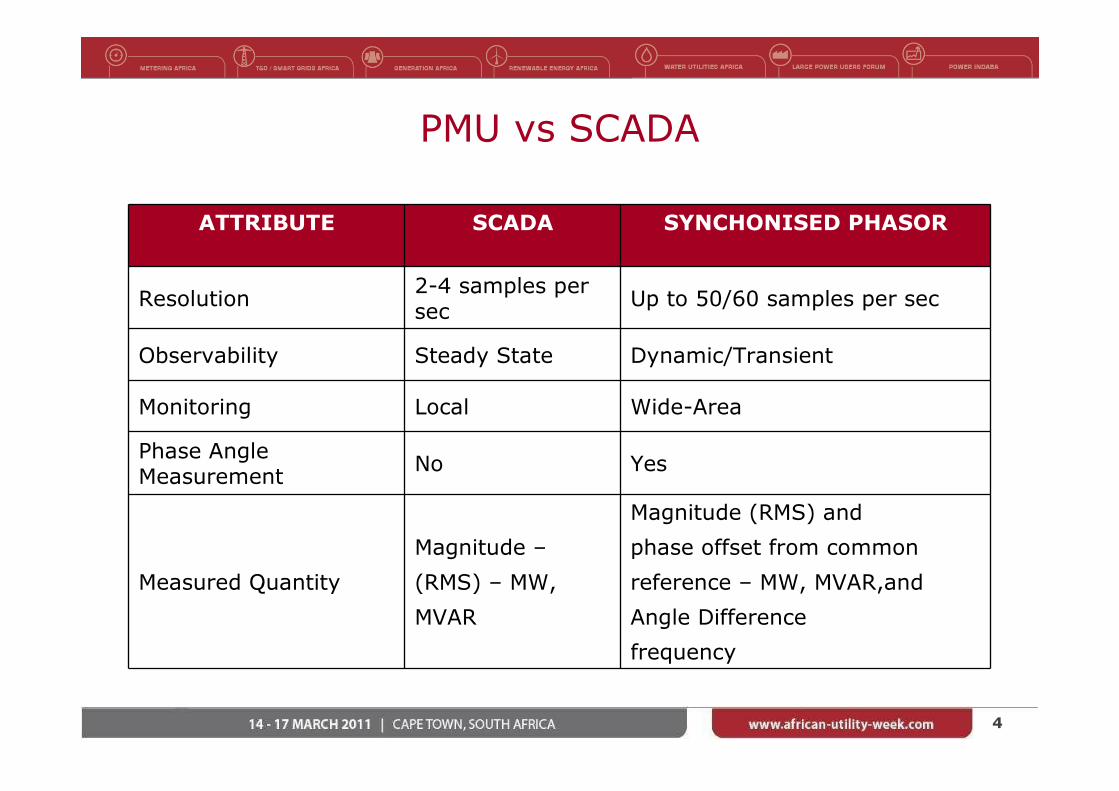
PMU vs SCADA
ATTRIBUTE SCADA SYNCHONISED PHASOR
Resolution2-4 samples per sec
Up to 50/60 samples per sec
Observability Steady State Dynamic/Transient
Monitoring Local Wide-Area
Phase Angle Measurement
No Yes
Measured Quantity
Magnitude –
(RMS) – MW,
MVAR
Magnitude (RMS) and
phase offset from common
reference – MW, MVAR,and
Angle Difference
frequency

5
PMU vs SCADA
Pegasus Busbar Voltage (PMU vs SCADA Data)
360000
370000
380000
390000
400000
410000
06:3
0:00
.000
06:3
0:07
.720
06:3
0:15
.440
06:3
0:23
.160
06:3
0:30
.880
06:3
0:38
.600
06:3
0:46
.320
06:3
0:54
.040
06:3
1:01
.760
06:3
1:09
.480
06:3
1:17
.200
06:3
1:24
.920
06:3
1:32
.640
06:3
1:40
.360
06:3
1:48
.080
06:3
1:55
.800
06:3
2:03
.520
06:3
2:11
.240
06:3
2:18
.960
06:3
2:26
.680
06:3
2:34
.400
06:3
2:42
.120
06:3
2:49
.840
06:3
2:57
.560
06:3
3:05
.280
06:3
3:13
.000
06:3
3:20
.720
06:3
3:28
.440
06:3
3:36
.160
06:3
3:43
.880
06:3
3:51
.600
06:3
3:59
.320
06:3
4:07
.040
06:3
4:14
.760
06:3
4:22
.480
06:3
4:30
.200
06:3
4:37
.920
06:3
4:45
.640
06:3
4:53
.360
Time
Vo
ltag
e (V
)
PMU Data
SCADA Data

6
System Overview for WAMS
Wide Area Ethernet in the Substation
PMUData
Storage
EIA232 or 485
PMUEthernet
PC37.118
PhasorData Conc.
EthernetPC37.118
EthernetC37.118 Local
Operation
NationalOperations
Other Utilities
Substation IP Access
Security Issues
DedicatedIP Network
DedicatedIP Network
Internetor
VPN

7
Wide Area Monitoring Applications for the Control Centre

8
Situational Awareness
Global display-an alarm overview display

9
Model Validation
Frequency
MW
MW

10
Power system oscillations
Power swings of up to 100MW
11
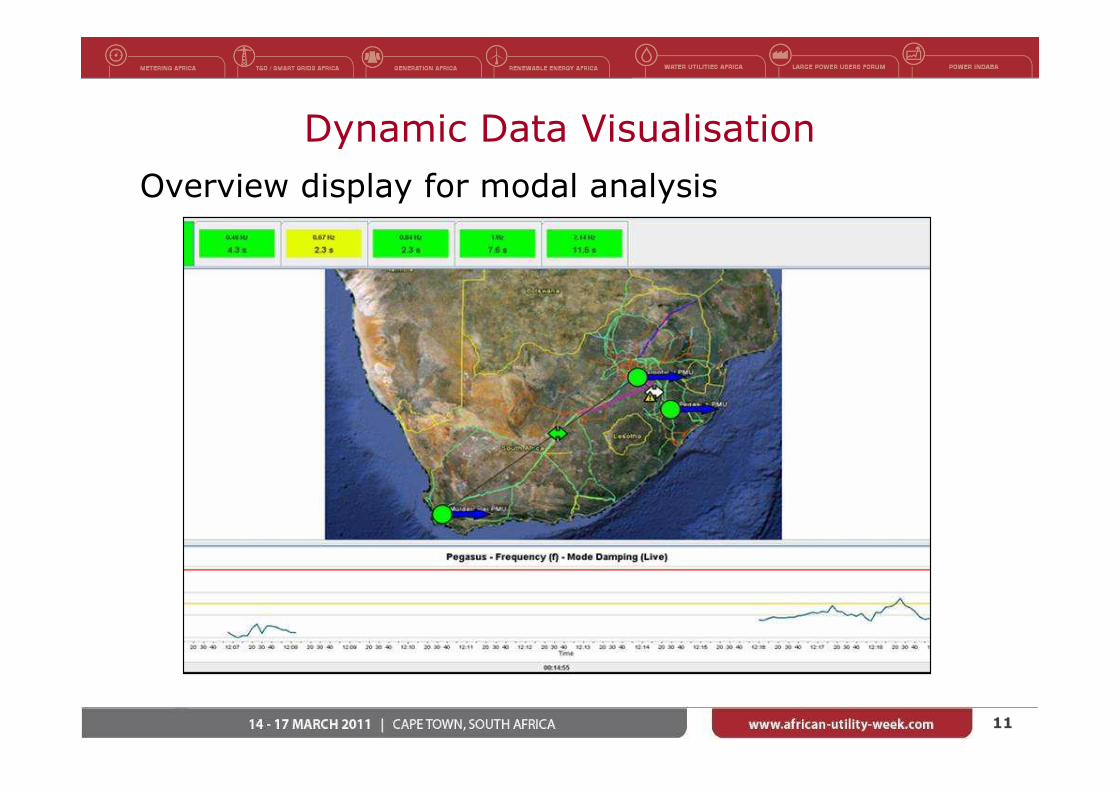
Dynamic Data Visualisation
Overview display for modal analysis

12
Small Signal Stability Analysis

13
Small Signal Stability Analysis
Poor damping of the 0.93Hz mode
14
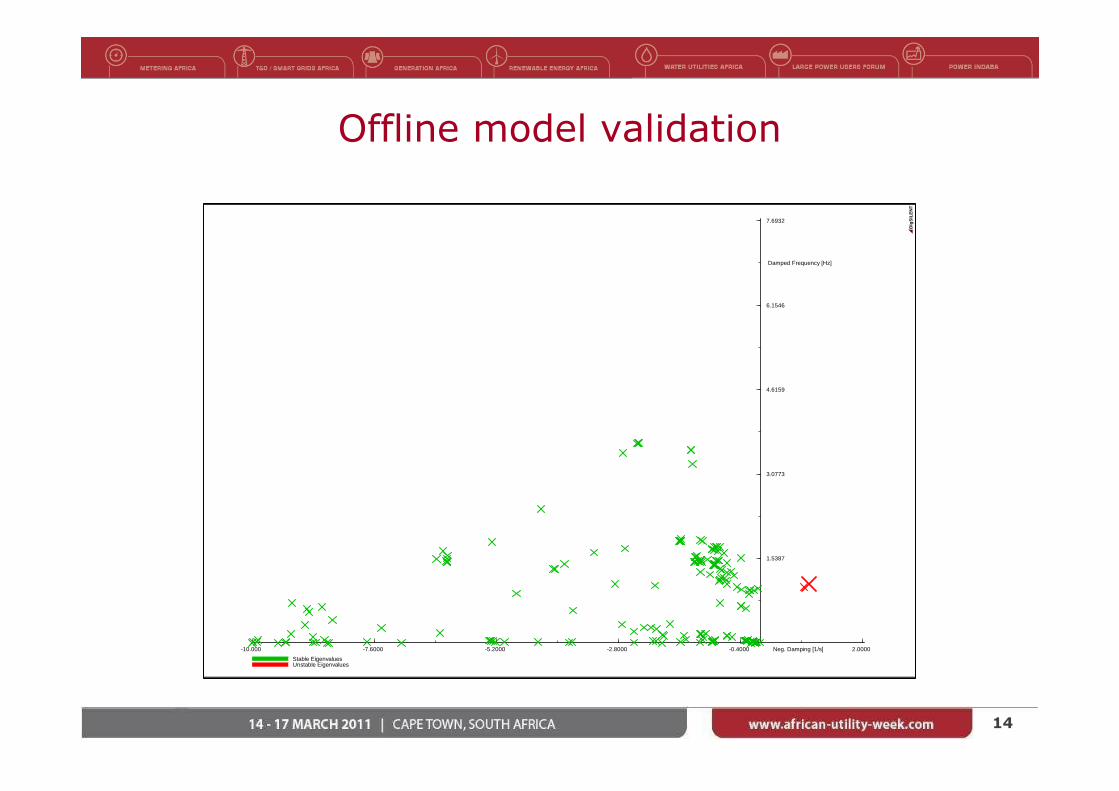
Offline model validation
2.0000-0.4000-2.8000-5.2000-7.6000-10.000 Neg. Damping [1/s]
7.6932
6.1546
4.6159
3.0773
1.5387
Damped Frequency [Hz]
Stable EigenvaluesUnstable Eigenvalues
DIg
SIL
EN
T

15
Eskom WAMS Project
16
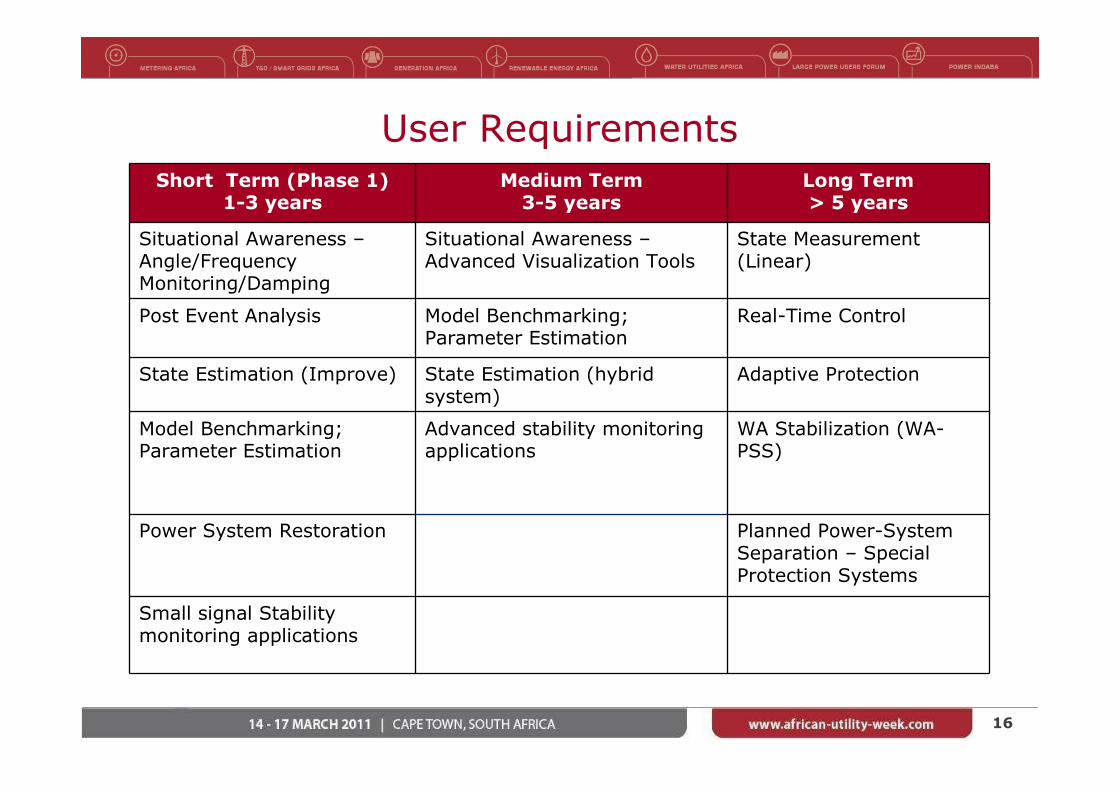
User Requirements
Short Term (Phase 1)1-3 years
Medium Term3-5 years
Long Term> 5 years
Situational Awareness –Angle/Frequency Monitoring/Damping
Situational Awareness –Advanced Visualization Tools
State Measurement (Linear)
Post Event Analysis Model Benchmarking; Parameter Estimation
Real-Time Control
State Estimation (Improve) State Estimation (hybrid system)
Adaptive Protection
Model Benchmarking; Parameter Estimation
Advanced stability monitoring applications
WA Stabilization (WA-PSS)
Power System Restoration Planned Power-System Separation – Special Protection Systems
Small signal Stability monitoring applications

17
PMU Locations• Feeders key to the interconnection between grid regions
• Nodes that exhibit large shifts in power anglebased on a loss of generation, load and change in topology
• Areas of interest from a load modellingperspective
• Areas of the grid with known dynamic stabilityissues
• Areas that can form frequency islands
• Areas of the grid prone to voltage collapse
• Nodes beneficial for the current state estimator improvement and a future linear state estimator

18
PMU Locations

19
System Architecture
20
Conclusions• Synchronised phasor technology is an essential component of a ‘smart’ transmission grid
• Application benefits can be realised with immediate effect
• New visualisation and analysis tools provides the ability to operate the power system confidently under stressed conditions
• Although an independent system today, it will eventually migrate into the standard substation SCADA architecture