Embed Size (px)
Citation preview

ERT 207
ANALYTICAL CHEMISTRY
SIGNIFICANT FIGURES AND STANDARD DEVIATION
LECTURE 4
13 JAN 2011
MISS NOORULNAJWA DIYANA YAACOB

Significant FiguresSignificant figures – all known digits, plus the first uncertain
digit.In significant figure convention:
We first determine the number of significant figures in our data (measurements).
We use that knowledge to report an appropriate number of digits in our answer.
Significant figure convention is not a scientific law!Significant figure convention is a set of guidelines to ensure
that we don’t over- or underreport the precision of results – at least not too badly…
2

Rules for Counting Significant Figures - Overview
1. Nonzero integers
2. Zeros
leading zeros
captive zeros
trailing zeros
3. Exact numbers

Rules for Counting Significant Figures - Details
Nonzero integers always count as significant figures.
3456 has
4 sig figs.

Rules for Counting Significant Figures - Details
Zeros Leading zeros do not count as
significant figures.
0.0486 has
3 sig figs.
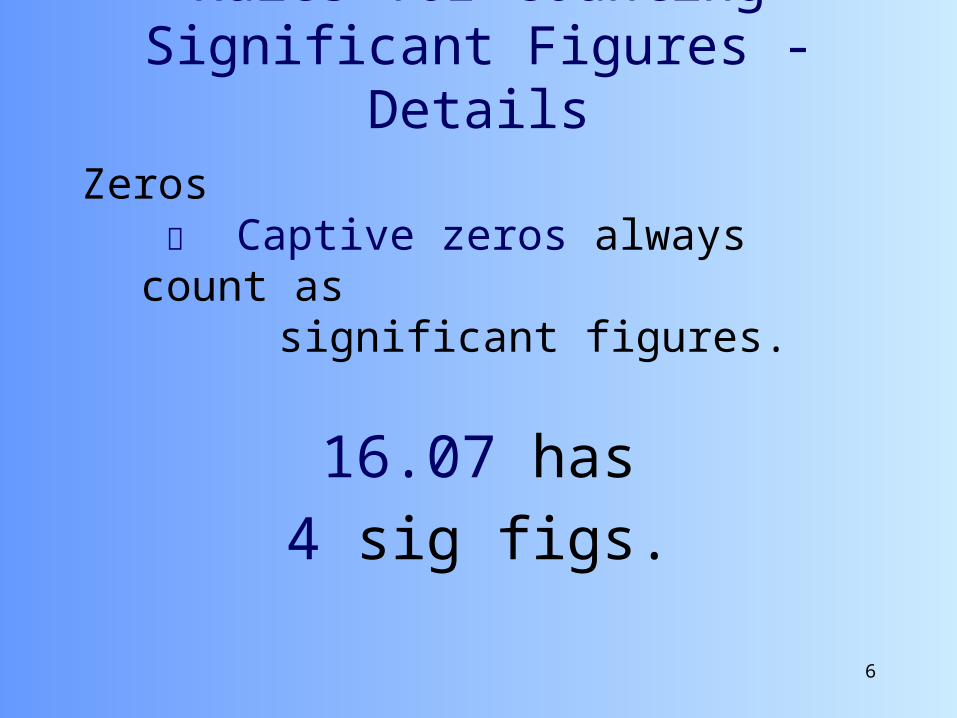
Rules for Counting Significant Figures - Details
Zeros Captive zeros always count as
significant figures.
16.07 has
4 sig figs.
Rules for Counting Significant Figures - Details
Zeros Trailing zeros are significant only
if the number contains a decimal point.
9.300 has
4 sig figs.
Rules for Counting Significant Figures - Details
Exact numbers have an infinite number of significant figures.
Independent of measuring device:1 apple, 10 students, 5 cars….
2πr The 2 is exact and 4/3 π r2 the 4 and 3 are exact
From Definition: 1 inch = 2.54 cm exactlyThe 1 and 2.54 do not limit the significant figures

100. has 3 sig. fig. = 1.00 x 10²
100 has 1 sig. fig. = 1 x 10²

Rules For Rounding
1. In a series of calculations, carry the extra digits through to the final result, then round.
2. If the digit to be removed:A. Is less than 5, then no change e.g. 1.33 rounded to 2
sig. fig = 1.3
B. Is equal or greater than 5, the preceding digit increase by 1 e.g. 1.36 rounded to 2 sig. fig = 1.4
11
3. If the last digit is 5 and the second last digit is an even number, thus the second last digit does not change.
Example, 73.285 73.284. If the last digit is 5 and the second last digit is an
odd number, thus add one to the last digit. Example, 63.275 63.28

Rules for Significant Figures in Mathematical Operations
Multiplication and Division: # sig figs in the result equals the number in the least precise measurement used in the calculation.
6.38 2.0 =
12.76 13 (2 sig figs)

13
Example : Give the correct answer for the following operation to the maximum number of significant figures.
1.0923 x 2.07
14
Solution:
1.0923 x 2.07 = 2.261061 2.26
The correct answer is therefore 2.26 based on the key number (2.07).
Rules for Significant Figures in Mathematical Operations
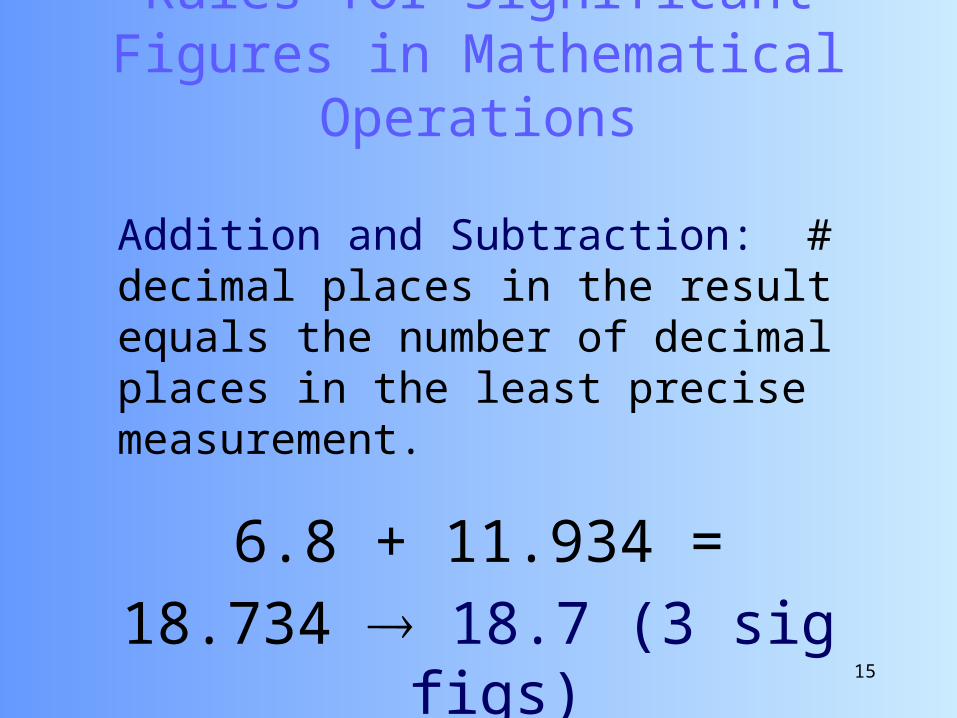
Addition and Subtraction: # decimal places in the result equals the number of decimal places in the least precise measurement.
6.8 + 11.934 =
18.734 18.7 (3 sig figs)
16
Example : Give the answer for the following operation to the maximum number of significant figures: 43.7+ 4.941 + 13.13

43.7
4.941
+ 13.13
61.771 61.8
answer is therefore 61.8 based on the key number (43.7).

Rules Exponential
The exponential can be written as follows. Example, 0.000250 2.50 x 10⁻⁴

Rules for logarithms and antilogarithms
Log (3.1201)
mantissa
characteristics
The number of significant figures on the right of the decimal point of the log result is the sum of the significant figures in mantissa and characteristic

Rules for Counting Significant Figures.
Example 1
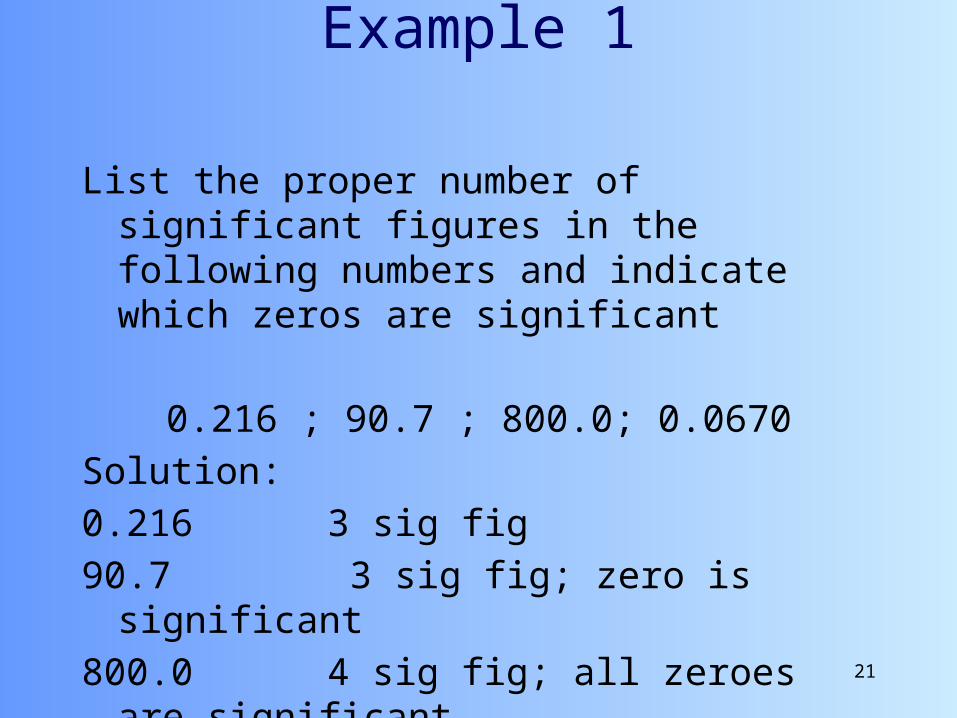
List the proper number of significant figures in the following numbers and indicate which zeros are significant
0.216 ; 90.7 ; 800.0; 0.0670
Solution:
0.216 3 sig fig
90.7 3 sig fig; zero is significant
800.0 4 sig fig; all zeroes are significant
0.0670 3 sig fig; 0nly the last zero is significant
Standard Deviation
The standard deviation is calculated to indicate the level of precision within a set of data. Abbreviations include sdev, stdev, s and s.
s is called the population standard deviation – used for “large” data sets.
s is the sample standard deviation – used for “small” data sets.

STANDARD DEVIATION
The most important statictics.
Recall back: Sample standard deviation.
For N (number of measurement) < 30

For N > 30,
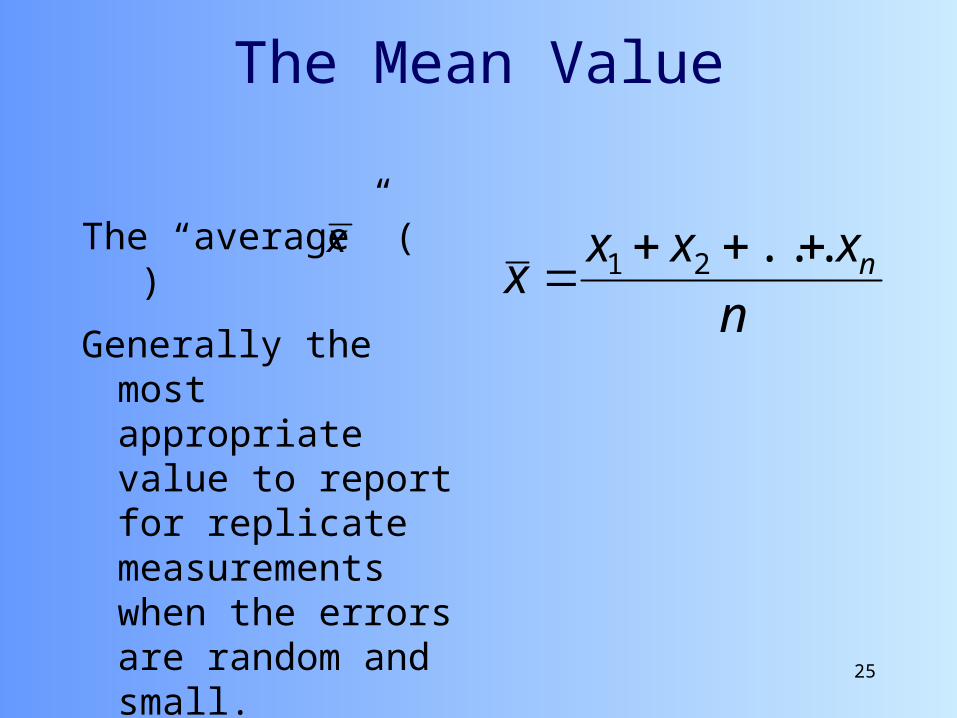
The Mean Value
The “average” ( )
Generally the most appropriate value to report for replicate measurements when the errors are random and small.
n
xxxx n
...21
25
x
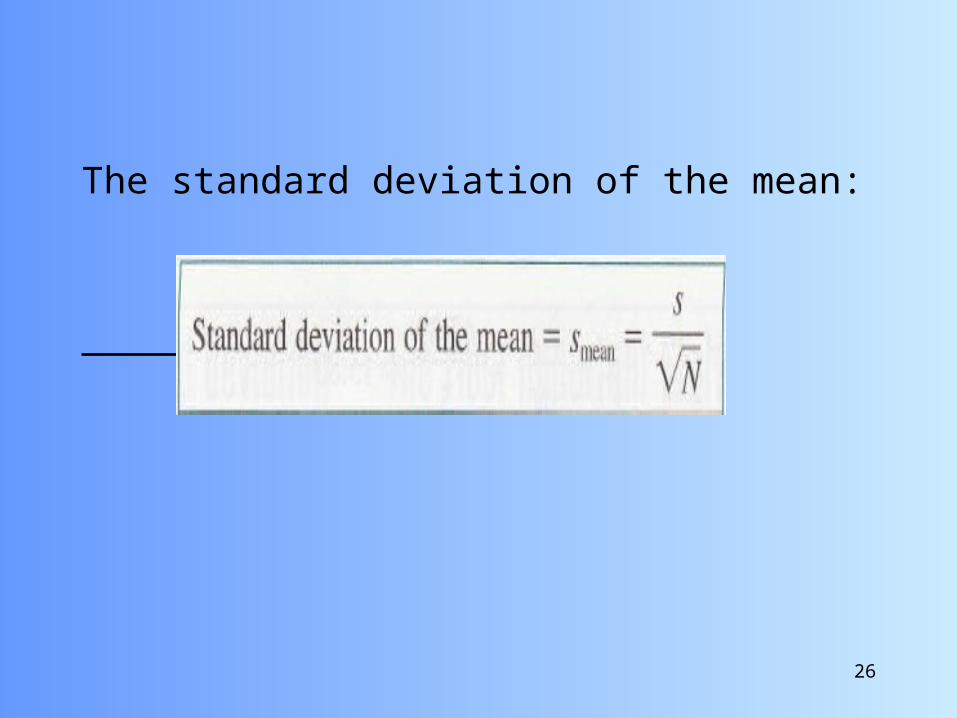
The standard deviation of the mean:
26
The standard deviation of the mean is sometimes referred to as the standard error
The standard deviation is sometimes expressed as the relative standard deviation (rsd) which is just the standard deviation expressed as a fraction of the mean; usually it is given as the percentage of the mean (% rsd), which is often called the coefficient of variation

Relative Standard Deviation (rsd)
Dimensionless, but expressed in the same units as the value
Coefficient of variation (or variance), CV, is the percent rsd:
x
srsd
x
xrsd
%100x
sCV
28
or
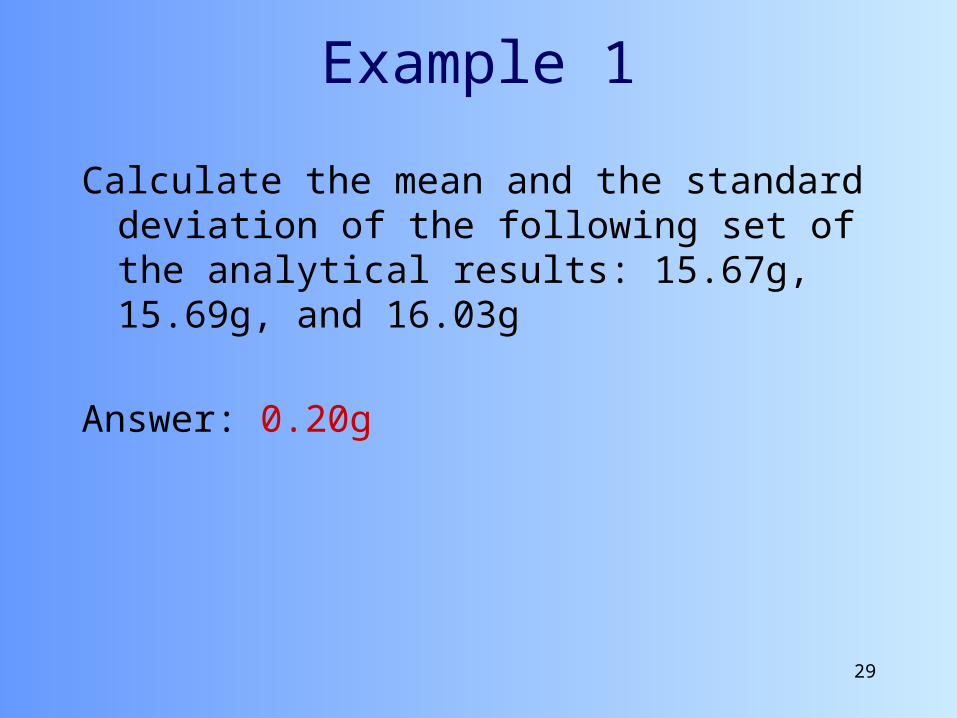
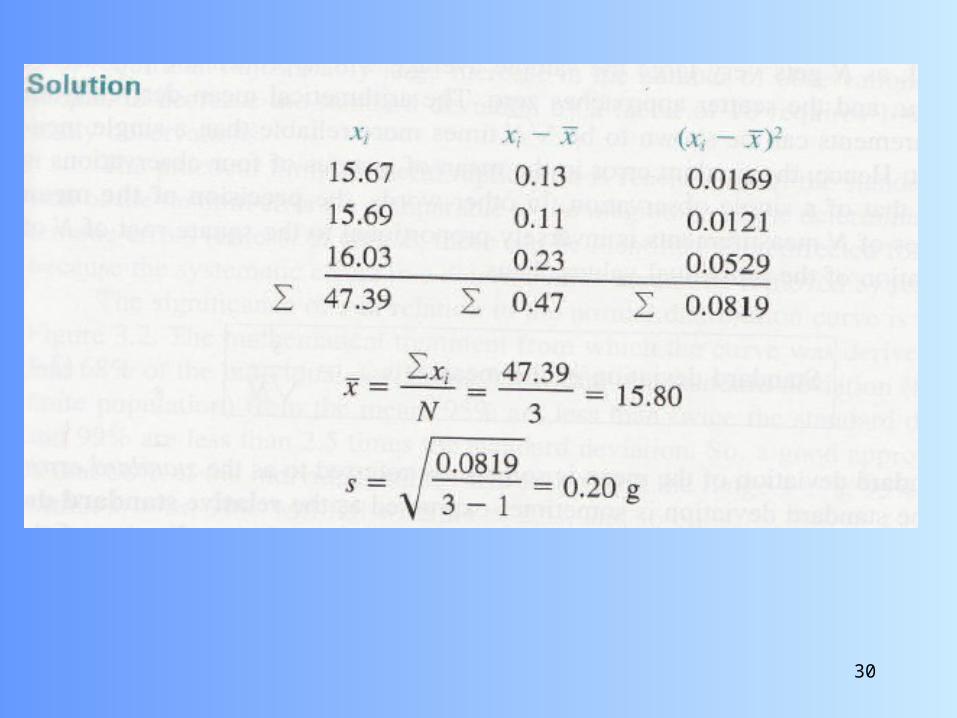
Example 1
Calculate the mean and the standard deviation of the following set of the analytical results: 15.67g, 15.69g, and 16.03g
Answer: 0.20g

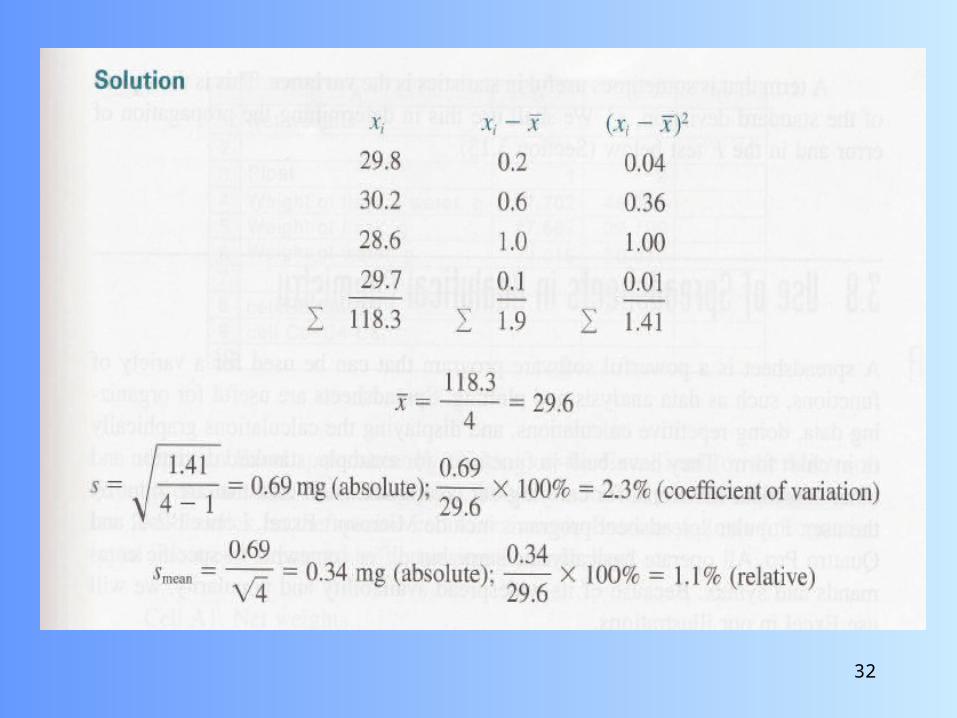
Example 2
The following replicate weighing were obtained: 29.8, 30.2, 28.6, and 29.7mg. Calculate the standard deviation of the individual values and the standard deviation of the mean. Express these as absolute (units of the measurement) and relative (% of the measurement) values.

Median and RangeMedian is the middle value of a
data set
If there is an even number of data, then it is the average of the two central values
Useful if there is a large scatter in the data set – reduces the effect of outliers
Use if one or more points differ greatly from the central value
Range is the difference between the highest and lowest point in the data set.
33
Mean and Median
Median
Mean
Range
Range

Median and Range
For example:
6.021, 5.969, 6.062, 6.034, 6.028, 5.992
Rearrange: 5.969, 5.992, 6.021, 6.028, 6.034, 6.062
Median = (6.021+6.028)/2 = 6.0245 = 6.024
Range = 6.062-5.969 = 0.093
34