Embed Size (px)
Citation preview

t
Governance trends and practices at US companies: a review of small- and mid-sized companies
Ernst & Young Corporate Governance Center
May 2013


Contents3 Section I: introduction
4 Key � ndings
7 Methodology
9 Section II: governance structure, organization and composition
9 Timing of annual meetings
10 Director elections
10 Staggered boards vs. annual elections
10 Majority voting vs. plurality voting requirements
11 Independent board leadership
12 Board and key committees
12 Size
12 Independence
13 Age and tenure
13 Total board service
14 Gender
15 Meeting frequency
17 Section III: board compensation
17 Compensation of independent directors
18 Compensation at boards with independent chairs
21 Section IV: executive compensation
21 CEO compensation
23 Composition of Named Executive Of� cers
23 NEO compensation
23 Compensation consultants
24 Section V: bene� cial owners
24 Section VI: investor views
24 Director elections
25 Say-on-say proposals
26 Shareholder-sponsored proposals
29 Section VII: appendix
29 Timing of annual meetings
30 Board structure, organization and composition
34 Key committee structure, organization and composition
42 Executive compensation
49 Bene� cial ownership
50 Investor views through shareholder proposals


3Governance trends and practices at US companies: a review of small- and mid-sized companies | ey.com/governance
IntroductionThe Society of Corporate Secretaries & Governance Professionals (the Society) and the Ernst & Young Corporate Governance Center (EY CGC) present governance trends and practices at US companies: a review of small- and mid-sized companies, which offers an overview of trends in corporate governance practices on a wide range of topics.
This data-intensive report is based on actual company practices and board composition as disclosed in proxy statements � led with the Securities and Exchange Commission (SEC). It covers companies in the Russell 3000 index, and data is from EY CGC’s proprietary Corporate Governance Database.
This report is unique in that it focuses on the governance practices of small- and mid-cap companies – an area in which little attention has been given and limited data is available. Often companies of all sizes are held to the governance standards and practices of the largest companies. These standards, which do not take into account size or industry, may not always be appropriate for all companies.
This publication is a reference guide and tool for understanding the governance and compensation practices of companies based on size and industry and, where appropriate, considering the historical landscape. The publication is intended to be a resource guide for companies – in particular, corporate secretaries, general counsels and other individuals serving in a corporate governance function.
The report is organized as follows:
• Section I: an overview of key � ndings and methodology
• Sections II to VI: governance trends, including board structures, composition and compensation, as well as executive compensation, ownership structures, and investor views, focusing primarily on break out by market capitalization
• Section VII: an appendix that includes detailed benchmarking data broken out by market cap groupings and industry sectors.
Boards and management need to be aware of, and take into account, emerging governance practices — at the same time, they need to consider a company’s particular circumstances.
Section I

4 Ernst & Young LLP | All rights reserved | © 2013
Key findingsThis review of governance practices and trends at small- and mid-cap companies – including as compared to both large-cap companies and all companies in the Russell 3000 – provides unique insights into how corporate governance has changed for these companies during the � ve-year period between 2007 and 2012. These changes occurred against a backdrop of demands for greater transparency and access to more accurate and relevant information by regulators, legislators, investors and other stakeholders. The rate of change varies by company size and, in some cases, industry. Key � ndings of the study include:
Strengthening of board oversight and accountability• There is signi� cant ongoing transformation in the
structure of director elections as companies move from staggered to annual elections for the full board, and implement majority voting requirements (versus plurality voting). However, the pace of change is much slower among smaller companies.
• The number of small- and mid-cap companies with annual elections is at about 50% and 60%, respectively, compared to about 85% for large-cap companies. These smaller companies vastly outnumber the larger companies—making the trend less de� ned when considering all companies.
• More than 50% of mid-cap companies, and less than 20% of small-cap companies, now have majority voting while nearly 85% of large-cap companies have moved to this structure to date.
• At the same time, companies increasingly are putting into place independent board leadership structures. While most companies already had some form of independent board leadership in 2007, it is becoming even more prevalent.
• Boards are increasingly favoring the use of independent board chairs and lead directors, resulting in a diminishing use of presiding directors.
• Small-cap companies are most likely to have an independent board chair; large companies prefer an independent lead director.
Board composition decisions shaped by efforts to balance existing, more seasoned directors with new perspectives, even as board and key committee sizes decline• Board composition is a high priority as companies
navigate the challenging economic, competitive and regulatory landscape under close scrutiny by stakeholders.
• Overall board independence is up at all market cap levels. That, combined with a decline in board sizes, may indicate that boards have become more independent by not replacing non-independent directors when they step down.
• The average age and tenure of directors are increasing.
• Small-cap companies tend to have smaller boards, and they also tend to be slightly younger.
• Audit committee members tend to be slightly younger, and have less tenure than members of other committees.
• There was little change in gender diversity, with the overall level of diversity at around 11%. About a quarter of mid-cap, and 45% of small-cap companies have no women directors.
Market cap breakdown highlights differences in executive compensation• Data shows that compensation values and practices
vary signi� cantly based on size and industry. In the last three years, from 2010 to 2012, total pay has increased for named executive of� cers (NEOs).
• Total compensation increased more rapidly for CEOs than for all other NEOs and the difference in change between CEOs and other NEOs was more pronounced for large-cap companies than for small- and mid-cap companies.
• The biggest nominal difference in pay between large-cap companies and small- and mid-cap companies is the value of equity compensation and non-equity incentive plan payouts. While smaller companies have increased their use of stock awards and non-equity incentives since 2010, they tend to not use stock options or maintain a pension plan for their executives. At mid- and large-cap companies, stock awards represent the largest portion of pay, followed by non-equity incentives.
• A smaller percentage of small-cap companies provide change in control or termination payouts to their CEOs compared to mid- and large-cap companies.
Investors more influential on corporate governance• Through shareholder proposal submissions and strong
voting support, investors are driving change and prioritizing governance reform in board structure, takeover protections and board composition to enhance board accountability to shareholders. However, larger companies are much more likely to receive shareholder proposals.

5Governance trends and practices at US companies: a review of small- and mid-sized companies | ey.com/governance
• At the same time, the advent of mandatory say-on-pay (SOP) requirements has provided shareholders with an important channel for voicing concerns over executive pay — both directly in terms of support levels for the proposals and indirectly by expanding communication and engagement on compensation topics.
• Overall, investors have registered low opposition to directors in board elections following a spike in 2009. It appears that the ability of investors to vote on SOP proposals is the main driver behind the sharp reversal in the trend of rising levels of opposition to director nominees.
• When there is opposition to director candidates, small- and mid-cap company directors tend to see higher opposition votes on average.
• Investor support on SOP proposals is high and largely consistent.
• Investors who submit shareholder proposals are beginning to expand somewhat the focus of their attention from the largest companies to small- and mid-cap companies, where shareholder proposals have historically tended to receive higher levels of voting support. While small- and mid-cap companies receive fewer shareholder proposals, their share of total proposals received increased from 2007 to 2012.

Key differences in governance practices of smaller companies, 2012
Small-cap Mid-cap Large-cap
Director elections (% of companies)
Annual elections for all directors 51% 62% 84%
Majority voting requirements in director elections 19% 52% 84%
Independent board leadershipPercent of companies with independent leadership 79% 87% 90%
Most prevalent leadership structure board chair lead director lead director
Board composition and organization (averages)Board size 8.3 9.7 11.2
Women directors (% of board) 9% 13% 17%
Independent directors (% of board) 77% 80% 84%
Total number of boards served 1.5 1.8 2.1
Frequency of key committee meetings (meetings/year)• Audit• Comp• Nom
7.15.53.3
7.96.04.0
8.96.44.8
CEO compensation Option awards* no yes yes
Pension plan* no no yes
Deferred compensation plan* no yes yes
Change in control payouts (% of companies providing) 74% 86% 84%
Investor viewsPercent of all director nominees receiving >20% opposition
7% 3% 2%
Proportion of companies with a shareholder proposal on their ballot
3% 16% 52%
Proportion of total shareholder proposals voted 14% 25% 61%
Average vote support for all shareholder proposals 45% 44% 31%
*Indicates if more than half the data sample uses the form of compensation.
How the governance practices of small-cap companies differ• Evenly split on annual elections vs. staggered
boards
• Majority voting in director elections is not common practice
• More likely to have an independent board chair than lead or presiding director
• Directors less likely to serve on other public company boards
• Smaller board sizes and key committees tend to meet less often
• Signi� cantly less likely to include a woman onthe board
• Less pronounced increase in CEO pay
• CEO compensation less likely to include use of options, pension programs or deferred compensation plans
• Greater percentage of director nominees receive votes against
• Fewer shareholder proposals � led at fewer companies, but these proposals see higher average voting support
6 Ernst & Young LLP | All rights reserved | © 2013

Industry sector Small-cap Mid-cap Large-cap All companies
Aerospace and defense 23 9 6 38
Airlines 10 6 1 17
Asset management 39 9 3 51
Automotive 47 18 9 74
Banking and capital markets 233 31 21 285
Biotechnology 84 17 10 111
Chemicals 31 11 8 50
Construction 26 8 n/a 34
Consumer products 99 39 26 164
Diversified industrial products 153 56 15 224
Govt, public sector and not-for-profit 13 1 n/a 14
Hospitality and leisure 48 14 7 69
Insurance 63 34 16 113
Media and entertainment 54 16 13 83
Mining and metals 57 14 4 75
Oil and gas 92 39 25 156
Other transportation 34 10 5 49
Pharmaceuticals 138 25 16 179
Power and utilities 37 38 17 92
Prof firms and services 101 19 2 122
Provider care 34 9 3 46
Real estate 99 50 11 160
Retail and wholesale 121 38 20 179
Technology 277 80 36 393
Telecommunications 37 9 5 51
All companies 1,950 600 279 2,829
7Governance trends and practices at US companies: a review of small- and mid-sized companies | ey.com/governance
MethodologyThis report takes a data intensive look at governance and compensation practices of companies that were constituents of the Russell 3000 index at the time of their annual meeting in 2012, and where appropriate, 2007.1 The data is based on information as disclosed in proxy statements � led with the SEC for the respective year.
The companies are grouped in two ways:
1. Three market capitalization bands
a. Small-cap companies: market capitalization below $2 billion
b. Mid-cap companies: market capitalization between $2 billion and $10 billion
c. Large-cap companies: market capitalization over $10 billion
2. Twenty-� ve industry sectors2
Number of companies by market capitalization and industry sector in 2012


9Governance trends and practices at US companies: a review of small- and mid-sized companies | ey.com/governance
Governance structure, organization and compensationTiming of annual meetingsThe timing of annual meetings is driven by regulatory requirements connected to the � ling of Form 10-K for the � scal year end, as well as state law and corporate charters and bylaws. Approximately 80% of all annual meetings occur during April, May or June (proxy season). Generally, the largest companies hold their meetings earlier; in April 2012, 12% and 15% of small- and mid-cap companies, respectively, held their annual meetings compared to nearly a quarter of large-cap companies.
Annual meetings occurred slightly later during the year in 2012 than in 2007. Small- and mid-cap companies saw a signi� cant increase in meetings held in June, while the biggest shift among large-cap companies occurred from April into May. Smaller companies may elect to hold meetings later given staf� ng constraints, the potential need to outsource more of the material preparation and the trend of increasing disclosure requirements.
Market cap Meetings during season (% of total)
April May June
1st half 2nd half 1st half 2nd half 1st half 2nd halfSmall-cap 79% 1% 11% 22% 25% 15% 4%
Mid-cap 78% 1% 14% 28% 24% 10% 3%
Large-cap 80% 3% 21% 26% 22% 7% 2%
All companies 81% 1% 13% 24% 24% 13% 4%
Concentration of annual meetings during proxy season in 2012
Market cap Meetings during season (% of total)
April May June
1st half 2nd half 1st half 2nd half 1st half 2nd halfSmall-cap 73% 1% 12% 20% 24% 11% 5%
Mid-cap 78% 1% 14% 29% 25% 6% 3%
Large-cap 81% 2% 29% 24% 19% 6% 1%
All companies 75% 1% 15% 23% 24% 9% 4%
Concentration of annual meetings during proxy season in 2007
Annual meetings by calendar month in 2012
Market cap Total meetings Jan Feb Mar Apr May Jun July Aug Sep Oct Nov Dec
Small-cap 1,950 2% 3% 2% 12% 47% 19% 3% 4% 2% 2% 3% 2%
Mid-cap 600 3% 3% 3% 16% 52% 13% 2% 2% 1% 1% 4% 1%
Large-cap 279 3% 1% 4% 23% 48% 9% 1% 2% 1% 3% 4% 0%
All companies 2,829 2% 3% 2% 14% 48% 17% 2% 3% 2% 2% 3% 2%
Annual meetings by calendar month in 2007
Market cap Total meetings Jan Feb Mar Apr May Jun July Aug Sep Oct Nov Dec
Small-cap 1,630 3% 4% 3% 13% 44% 16% 3% 3% 2% 3% 3% 2%
Mid-cap 674 3% 3% 2% 15% 54% 8% 3% 3% 2% 2% 3% 1%
Large-cap 339 2% 2% 3% 31% 43% 7% 2% 1% 2% 2% 3% 1%
All companies 2,643 3% 3% 3% 16% 46% 13% 3% 3% 2% 2% 3% 2%
Section II

10 Ernst & Young LLP | All rights reserved | © 2013
Director electionsThere has been signi� cant transformation in the structure of director elections as companies move away from staggered boards to annual elections and implement majority voting. For many companies, larger companies in particular, these changes have been driven by investors through the submission of shareholder proposals, which tend to receive high levels of voting support (see Shareholder-sponsored proposals below). Investors have recently begun to focus on small- and mid-cap companies.
Staggered boards vs. annual elections More than half of small-cap and more than 60% of mid-cap companies elect all directors annually as opposed to holding staggered board elections.3 This is a signi� cant change from 2007, when staggered boards were more prominent.
Majority voting vs. plurality voting requirementsFrom 2007 to 2012, the proportion of small-cap companies with majority voting provisions in director elections has grown from 7% to 19% and the proportion of mid-cap companies has jumped dramatically from 18% to 52%.4 Companies overall are implementing majority voting requirements at a quick pace.
The ongoing transformation of director elections is being driven by investors through shareholder proposals — in the form of proposal submissions and strong voting support. As investors expand their focus from larger to smaller companies, these changesare increasing.
Market cap 2007 2012Small-cap 43% 51%
Mid-cap 46% 62%
Large-cap 61% 84%
All companies 46% 56%
Companies electing all directors annually
Market cap 2007 2012Small-cap 7% 19%
Mid-cap 18% 52%
Large-cap 36% 84%
All companies 13% 33%
Companies with majority voting in director elections

11Governance trends and practices at US companies: a review of small- and mid-sized companies | ey.com/governance
Independent board leadershipMost companies already had some form of independent board leadership in place in 2007, and this practice has continued to grow. Small-cap companies experienced the greatest growth in independent board leadership, and show a preference for independent board chairs. Mid- and large-cap companies tend to favor lead directors.5
Smaller companies favor the use of independent board chairs, followed by lead directors. They are least likely to have a presiding director.
Market cap 2007 2012
Independent board chair
Lead director
Presiding director
Total Independent board chair
Lead director
Presiding director
Total
Small-cap 28% 24% 15% 67% 37% 35% 7% 79%
Mid-cap 20% 33% 26% 79% 30% 46% 11% 87%
Large-cap 11% 37% 34% 82% 18% 53% 19% 90%
All companies 24% 28% 20% 72% 33% 39% 9% 81%
Independent board leadership structures

12 Ernst & Young LLP | All rights reserved | © 2013
Independence Board and key committee independence levels are high. Companies with lower independence levels tend to include controlled companies, those recently becoming public and founder/family-led businesses — and they tend to be small- and mid-cap companies.
Market cap 2007 2012
Board Audit Comp Nom Board Audit Comp Nom
Small-cap 8.8 3.7 3.6 3.7 8.3 3.5 3.5 3.5
Mid-cap 9.9 4.0 3.8 4.0 9.7 3.9 3.8 3.9
Large-cap 11.8 4.4 4.2 4.4 11.2 4.3 4.1 4.3
All companies 9.5 3.8 3.8 3.9 8.9 3.7 3.6 3.5
Board and key committee size
Market cap Board Audit Compensation Nominating
2007 2012 2007 2012 2007 2012 2007 2012
Small-cap 74% 77% 100% 100% 98% 98% 98% 98%
Mid-cap 78% 80% 100% 100% 99% 99% 98% 99%
Large-cap 81% 84% 100% 100% 99% 100% 100% 100%
All companies 76% 78% 100% 100% 98% 98% 98% 98%
Level of independence among boards and key committees
Board and key committeesBoard composition is a high priority as companies work to navigate the challenging economic, competitive and regulatory landscape, while operating under closer scrutiny from a variety of stakeholders. Directors are charged with providing forward-looking strategy and rigorous oversight, and the right mix of skills, experience and diversity enables the board to better address the company’s speci� c circumstances and support its business strategy.
There was signi� cant board turnover post-Sarbanes Oxley as boards demanded an increase in the number of independent directors, particularly those with the skill sets needed to serve on audit committees. Recently, however, a slowdown in the number of directors joining boards combined with a decline in board sizes has meant that changes in board composition are more gradual.
All companies must have audit committees. Although most companies have separate compensation committees in place, they will be required to do so effective at their 2014 annual meeting based on revisions to the listing rules approved by the SEC in early 2013.6 Some companies — 4% and 2% of small- and mid-cap companies, respectively — have not created separate committees of the board managing nominating functions.
SizeThe average board size for small-cap companies is 8.3 members, and for mid-cap companies it is higher at 9.7 members. The number of directors serving on the board and the size of key committees (audit, compensation and nominating) are declining.7

13Governance trends and practices at US companies: a review of small- and mid-sized companies | ey.com/governance
Age and tenureDuring the � ve years between 2007 to 2012, the average age of a director increased by about 1.5 years, and average tenure increased by about half a year at small- and mid-cap companies.8
Total board serviceMost directors serve on only one public company board, and directors of small-cap companies are least likely to serve on multiple public company boards.9 The level of outside board service has not changed signi� cantly since 2007, though there has been a small increase in the number of directors serving on three or more public company boards.
Industry also impacts the level of other board service. Directors of companies in the banking and capital markets sector are least likely to serve on multiple boards, while directors of aerospace and defense, automotive, airlines and chemicals companies are most likely (see Appendix: Board structure, organization and composition).
Average director age has increased.
Audit committee members tend to be slightly younger and have less tenure than the members of other committees; nominating committee members, the opposite.
Age and tenure of key committee members in 2012
Market cap Small-cap Mid-cap Large-cap All companies
Age Tenure Age Tenure Age Tenure Age Tenure
Audit 62.0 8.0 62.4 8.1 62.8 7.9 62.1 7.9
Compensation 62.1 8.0 62.8 9.0 63.6 9.0 62.4 8.6
Nominating 62.4 9.0 63.3 9.3 64.0 9.3 62.7 8.9
Market cap 2007 2012
Age Tenure Age Tenure
Small-cap 59.0 8.2 60.6 8.6
Mid-cap 60.0 8.3 61.5 8.8
Large-cap 60.5 7.8 62.2 8.7
All companies 59.4 8.2 61.1 8.7
Age and tenure for boards of all companies
Total board service of CEO, non-CEO directors
Market cap CEO Non-CEO All directors
2007 2012 2007 2012 2007 2012Small-cap 1.3 1.3 1.5 1.6 1.5 1.5
Mid-cap 1.5 1.5 1.7 1.9 1.7 1.8
Large-cap 1.7 1.7 1.9 2.1 1.9 2.1
All companies 1.3 1.4 1.6 1.7 1.6 1.7
Distribution of directors with multiple board service
Number of boards served
2007 2012
Small-cap Mid-cap Large-cap All Small-cap Mid-cap Large-cap All
1 71% 56% 42% 62% 65% 49% 36% 58%
2 19% 26% 32% 23% 21% 29% 32% 25%
3+ 10% 19% 27% 15% 13% 22% 32% 17%

14 Ernst & Young LLP | All rights reserved | © 2013
GenderThere was little change in gender diversity on boards from 2007 to 2012. Women now represent only 9% and 13% of small- and mid-cap company board members, respectively, up one to two percentage points since 2007. Women represent only 11% of directors on boards and 12% on average for key committees (see Appendix: Key committee organization and composition). Behind these averages are wide variation; on a per company basis, the proportion of women directors can range from 0% to close to 60%.
The commitment to diversity is stronger among larger companies — more than 90% of large-cap companies have at least one female director on their boards. This compares to only 55% of small- and 77% of mid-cap companies that have one or more female directors.
Gender diversity of boards
Market cap 2007 2012Small-cap 8% 9%
Mid-cap 11% 13%
Large-cap 15% 17%
All companies 10% 11%
Gender diversity of key committees
Market cap Audit Comp Nom
Small-cap 10% 10% 11%
Mid-cap 15% 14% 15%
Large-cap 19% 18% 21%
All companies 10% 11% 13%
Distribution of women directors on boards in 2012
Women directors Small-cap Mid-cap Large-cap All companies
No women directors 45% 23% 7% 37%
One women director 36% 38% 25% 35%
Two women directors 14% 27% 44% 20%
Three or more women directors 5% 11% 23% 8%
Nearly a quarter of mid-cap companies, and 45% of small-cap companies, have no women on their boards. Limited turnover on boards impedes the ability for them to become more gender diverse.

15Governance trends and practices at US companies: a review of small- and mid-sized companies | ey.com/governance
Meeting frequencyThe average number of meetings held by boards and key committees has largely stayed constant since 2007, with the exception of audit committees where the number of meetings declined.10 The average number of board meetings for small- and mid-cap companies is about eight per year. The actual number of meetings held varies based on company-speci� c circumstances (e.g., the number of meetings may be higher for companies undergoing a restructuring or internal organizational changes). Key committees of large-cap companies tend to meet more frequently. In addition, companies in the banking and capital markets sectors tend to have higher than average meeting numbers (see Appendix: Board structure, organization and composition).
There is a wide range in the number of meetings held by boards and the key committees, but overall, boards and audit committees tend to meet more frequently (between 4 to 12 meetings) than the compensation and nominating committees.
Distribution of frequency of meetings held by board and key committees in 2012
Maximum and minimum number of meetings held by boards and key committees
Number of meetings Board Audit Comp Nom
3 or fewer 1% 1% 20% 48%
4 to 8 62% 66% 67% 50%
9 to 12 26% 27% 11% 2%
13 or more 12% 5% 3% 0%
Average number of meetings held by boards and key committees
Market cap 2007 2012
Board Audit Comp Nom Board Audit Comp Nom
Small-cap 8.4 8.3 5.2 3.1 8.4 7.1 5.5 3.3
Mid-cap 8.4 8.9 5.7 3.6 7.8 7.9 6.0 4.0
Large-cap 8.6 10.0 6.3 4.7 8.4 8.9 6.4 4.8
All companies 8.5 8.7 5.5 3.4 8.3 7.5 5.7 3.6
Market cap Board Audit Compensation Nominating
Max Min Max Min Max Min Max MinSmall-cap 38 2 23 1 51 0 32 0
Mid-cap 31 2 30 2 22 0 15 0
Large-cap 22 4 22 2 17 1 12 0
All companies 38 2 30 2 51 0 32 0


17Governance trends and practices at US companies: a review of small- and mid-sized companies | ey.com/governance
Board compensationCompensation of independent directorsPay for independent directors has increased over the years in connection with their expanded responsibilities.11 Between 2007 and 2012, boards of small-cap companies experienced an increase in pay of nearly 33%. The table to the right includes the average total pay for all independent directors regardless of their position on the board. On an industry basis, independent directors at small- and mid-cap banking and capital markets companies received low average pay; in many instances these represent regional banks with larger-than-average board sizes.
Industry sectors Small-cap Mid-cap Large-cap All companiesAerospace and defense $151 $174 $344 $199
Airlines $142 $144 $240 $152
Asset management $115 $291 $217 $165
Automotive $146 $200 $223 $173
Banking and capital markets $83 $157 $237 $107
Biotechnology $167 $239 $356 $202
Chemicals $133 $179 $237 $163
Construction $156 $206 n/a $170
Consumer products $127 $199 $242 $171
Diversified industrial products $131 $189 $230 $158
Govt, public sector and NFP $113 $349 n/a $129
Hospitality and leisure $154 $239 $235 $181
Insurance $141 $211 $242 $183
Media and entertainment $133 $202 $232 $169
Mining and metals $156 $206 $287 $178
Oil and gas $159 $249 $323 $218
Other transportation $136 $184 $251 $169
Pharmaceuticals $159 $248 $266 $187
Power and utilities $116 $170 $229 $164
Prof firms and services $163 $184 $233 $169
Provider care $172 $262 $286 $202
Real estate $114 $158 $167 $133
Retail and wholesale $138 $215 $224 $170
Technology $168 $259 $313 $206
Telecommunications $184 $274 $246 $210
All companies 2012 $138 $207 $258 $171
All companies 2007 $104 $165 $220 $142
Independent director compensation by market cap and industry ($ in thousands)
Section III

18 Ernst & Young LLP | All rights reserved | © 2013
Market cap 2007 2012
Independent board chair
Other independent
directors
Multiple of chair pay
Independent board chair
Other independent
directors
Multiple of chair pay
Small-cap $151 $92 1.6 $196 $133 1.5
Mid-cap $272 $144 1.9 $312 $206 1.5
Large-cap $429 $176 2.4 $409 $241 1.7
All companies $193 $111 1.7 $230 $156 1.5
Board pay at companies with an independent board chair structure ($ in thousands)Compensation at boards with independent chairsAverage board pay has increased for both independent directors and independent chairs; however, the increase has been greater for non-chair directors. This ratio varies signi� cantly from industry to industry.

19Governance trends and practices at US companies: a review of small- and mid-sized companies | ey.com/governance
Industry sectors Independent board chair Other independent directors Multiple of chair payAerospace and defense $245 $157 1.6
Airlines $256 $151 1.7
Asset management $202 $160 1.3
Automotive $234 $155 1.5
Banking and capital markets $153 $87 1.7
Biotechnology $228 $165 1.4
Chemicals $243 $149 1.6
Construction $225 $150 1.5
Consumer products $250 $156 1.6
Diversified industrial products $196 $131 1.5
Govt, public sector and NFP $118 $154 0.8
Hospitality and leisure $311 $160 1.9
Insurance $289 $176 1.6
Media and entertainment $185 $135 1.4
Mining and metals $226 $158 1.4
Oil and gas $254 $175 1.4
Other transportation $254 $139 1.8
Pharmaceuticals $227 $174 1.3
Power and utilities $274 $157 1.7
Prof firms and services $235 $165 1.4
Provider care $293 $189 1.5
Real estate $188 $128 1.5
Retail and wholesale $244 $158 1.5
Technology $258 $195 1.3
Telecommunications $256 $170 1.5
All companies $230 $156 1.5
Pay at companies with an independent board chair structure ($ in thousands)


21Governance trends and practices at US companies: a review of small- and mid-sized companies | ey.com/governance
Median CEO total pay ($ in thousands)13
The biggest nominal difference in pay between large-cap companies and small- and mid-cap companies is the grant date value of equity compensation and non-equity incentive plan payouts.
Marketcap
Year Salary Bonus Stock awards
Option awards
Non-equity incentives
Change in pension value
All other comp
Total
Small-cap
2012 $555 $0 $412 $0 $224 $0 $30 $2,088
2011 $510 $0 $226 $0 $203 $0 $26 $1,853
2010 $500 $0 $145 $0 $88 $0 $28 $1,549
Mid-cap
2012 $863 $0 $1,996 $600 $1,024 $0 $87 $6,269
2011 $835 $0 $1,624 $572 $1,122 $0 $77 $5,638
2010 $800 $0 $1,142 $614 $742 $0 $81 $4,829
Large-cap
2012 $1,145 $0 $4,292 $2,146 $2,107 $112 $178 $12,572
2011 $1,098 $0 $3,972 $1,924 $2,179 $102 $192 $11,564
2010 $1,074 $0 $2,902 $1,838 $1,564 $290 $176 $10,258
Marketcap
Year Salary Bonus Stock awards
Option awards
Non-equity incentives
Change in pension value
All other comp
Total
Small-cap
2012 27% 0% 20% 0% 11% 0% 1% $2,088
2011 28% 0% 12% 0% 11% 0% 1% $1,853
2010 32% 0% 9% 0% 6% 0% 2% $1,549
Mid-cap
2012 14% 0% 32% 10% 16% 0% 1% $6,269
2011 15% 0% 29% 10% 20% 0% 1% $5,638
2010 17% 0% 24% 13% 15% 0% 2% $4,829
Large-cap
2012 9% 0% 34% 17% 17% 1% 1% $12,572
2011 9% 0% 34% 17% 19% 1% 2% $11,564
2010 10% 0% 28% 18% 15% 3% 2% $10,258
Median CEO pay elements as a percentage of total pay (%)
Executive compensationCEO compensationOverall, smaller companies compensate their CEOs quite differently than larger companies. Salary generally represents a greater portion of total pay for a CEO at a small-cap company (about 30%) than for a CEO at a mid- or large-cap company (about 10-15%).12 These smaller companies tend to not use stock options or maintain a pension plan for their executives. Smaller companies have, however, increased their use of stock awards and non-equity incentives since 2007. At mid- and large-cap companies, stock awards represent the largest portion of pay, followed by non-equity incentives.
Across all market caps, companies are no longer using discretionary bonuses as a mechanism for awarding CEO performance.
Section IV

22 Ernst & Young LLP | All rights reserved | © 2013
Marketcap
Year Pension value Deferred comp value
Change in control payout
Termination payout
Small-cap
2012 $0 $0 $2,750 $1,033
2011 $0 $0 $2,438 $1,024
2010 $0 $0 $2,209 $1,019
Mid-cap
2012 $0 $75 $11,415 $3,654
2011 $0 $100 $12,092 $3,690
2010 $0 $88 $10,003 $3,280
Large-cap
2012 $420 $1,780 $21,857 $6,176
2011 $607 $1,863 $21,338 $7,026
2010 $1,282 $1,676 $18,826 $7,052
CEO potential median post-employment pay ($ in thousands)
Percentage of companies providing change in control or termination related payouts
Payout Small-cap Mid-cap Large-cap
2010 2011 2012 2010 2011 2012 2010 2011 2012
Change in control 69% 70% 74% 81% 81% 86% 78% 79% 84%
Termination 57% 58% 60% 65% 65% 66% 63% 63% 63%
The median value of potential payouts to CEOs for termination of employment in connection with a change in control situation or other termination (including without cause or normal retirement) is signi� cantly higher for large- and mid-cap companies.14 A smaller percentage of small-cap companies provide change in control or termination payouts to their CEOs compared to mid- and large-cap companies. Overall, companies are increasingly more likely to provide for change in control related payouts than for payouts related to retirement.

23Governance trends and practices at US companies: a review of small- and mid-sized companies | ey.com/governance
Composition of Named Executive OfficersA review of the NEOs as listed in summary compensation tables shows that more than 95% of companies include a CFO among these positions. About one-third of companies — across all market cap bands — have a general counsel serving as an NEO.
NEO compensation Total pay increased for nearly every NEO from 2010 to 2012. The increase in pay came as the economy, and corporate pro� ts, rebounded from the � nancial crisis and recession of the last decade. Total pay increased more rapidly for CEOs than for other NEOs, with the difference in change between CEOs and non-CEOs being more pronounced for large-cap companies than for small- and mid-cap companies.
The ratio of pay for CEOs relative to pay for other NEOs is lower for small-cap companies. In 2012, CEOs of small-cap companies were paid 2.3 times that of other NEOs compared to 2.8 times and 2.9 times for mid- and large-cap companies, respectively. The ratios are similar for CEO to CFO pay, where small-cap companies CEOs are paid at a 2.4 times multiple, and mid- and large-cap CEOs are paid at a 3.0 times and 3.1 times multiple, respectively.
Compensation consultants Use/disclosure of compensation consultantsAlmost all mid-cap companies and three quarters of small-cap companies now engage a compensation consultant to assist with executive compensation matters. Many companies may now feel it necessary to retain a compensation consultant given the existence of mandatory say-on-pay (SOP) shareholder votes.
Percentage of companies with NEOs serving in selected positions
Payout Small-cap Mid-cap Large-cap
2010 2011 2012 2010 2011 2012 2010 2011 2012
CFO 94% 94% 96% 97% 96% 97% 97% 96% 98%
General Counsel 31% 32% 35% 35% 35% 37% 32% 35% 33%
Median NEO total compensation ($ in thousands)
Position Small-cap Mid-cap Large-cap
2010 2011 2012 2010 2011 2012 2010 2011 2012
CEO $1,549 $1,853 $2,088 $4,829 $5,638 $6,269 $10,258 $11,564 $12,572
CFO $660 $778 $863 $1,618 $1,928 $2,006 $3,348 $3,576 $4,016
General Counsel $671 $801 $797 $1,461 $1,564 $1,658 $2,743 $2,906 $3,248
All NEOs (average) $923 $1,105 $1,198 $2,355 $2,886 $3,086 $5,098 $5,757 $6,151
All NEOs ex-CEOs (average)
$707 $852 $914 $1,743 $2,088 $2,210 $3,743 $4,085 $4,306
Companies disclosing use of a compensation consultant
Market cap 2010 2011 2012
Small-cap 63% 70% 76%
Mid-cap 83% 87% 92%
Large-cap 90% 91% 93%
All companies 70% 76% 81%
Concentration of compensation consultants
Summary data 2010 2011 2012
Number of consultants used by more than 10% of companies
2 2 3
Number of consultants used by more than 2% of companies
11 13 12
Percent of companies using one of the 10 most identified consultants
73% 70% 72%
Percent of companies using one of the 5 most identified consultants
52% 52% 50%
Total number of different consultants used in a single year
125 135 130
Concentration of named compensation consultantsFrom 2010 to 2012, there appeared to be no material change in the market share or concentration of compensation consultants.15 The market appears to be quite fragmented, with few barriers to entry. For example, at least 125 different consultants were utilized by companies in each of these years.

24 Ernst & Young LLP | All rights reserved | © 2013
Ownership by directors and of� cers and signi� cant shareholders
Summarydata
2007 2012
Small-cap
Mid-cap Large-cap
All companies
Small-cap
Mid-cap Large-cap
All companies
Director and officer holdings
17% 10% 5% 13% 16% 7% 5% 13%
Average number of significant (5%) shareholders
4 3 2 3 4 4 2 4
Average holding of significant shareholders
13% 11% 9% 12% 13% 10% 9% 12%
Average holding of largest significant shareholder
19% 15% 12% 17% 20% 14% 11% 17%
Investor viewsDirector electionsOverall, investors have registered high support for directors in board elections.17 The ability for investors to vote on SOP proposals appears to have reversed the trend of rising levels of opposition to director nominees, which spiked in 2009 and 2010. In 2012, compensation was no longer the primary driver of opposition votes.
Section V
Section VI
Overall support for directors is high, but where there is opposition, small- and mid-cap company directors have, on average, received higher opposition votes.
Beneficial ownersSmaller companies have higher levels of director and of� cer ownership and higher numbers of signi� cant shareholders owning 5% or more of the stock.16 In addition, these signi� cant shareholders own more of the stock on average. Between 2007 and 2012, small-cap companies saw a small increase in the average holding of the largest signi� cant shareholder.
Trends in opposition to board nominees (% of all nominees)
Opposition level 2007 2008 2009 2010 2011 2012More than 20% 4.8% 5.5% 9.8% 8.0% 5.1% 5.4%
More than 40% 0.8% 1.0% 2.1% 1.8% 1.0% 1.0%
More than 50% 0.2% 0.2% 0.6% 0.6% 0.3% 0.4%
Director opposition by market cap in 2012 (% of nominees by market cap)
Opposition level Small-cap Mid-cap Large-cap All companies
More than 20% 7.1% 3.4% 1.6% 5.4%
More than 40% 1.2% 0.7% 0.5% 1.0%
More than 50% 0.4% 0.4% 0.2% 0.4%

25Governance trends and practices at US companies: a review of small- and mid-sized companies | ey.com/governance
Market cap <50% 50-59% 60-69% 70-79% 80-89% 90-100%Small-cap 3% 2% 3% 7% 11% 74%
Mid-cap 2% 3% 3% 6% 11% 75%
Large-cap 2% 3% 3% 5% 11% 75%
All companies 2% 3% 3% 6% 11% 75%
Support for SOP proposals by threshold and market cap in 2012
Industry sector Small-cap Mid-cap Large-cap All companiesAerospace and defense 93% 87% 78% 89%
Airlines 93% 93% 96% 93%
Asset management 89% 86% 97% 89%
Automotive 94% 96% 92% 94%
Banking and capital markets 92% 88% 91% 91%
Biotechnology 83% 89% 86% 85%
Chemicals 91% 91% 93% 91%
Construction 82% 93% n/a 85%
Consumer products 91% 93% 95% 92%
Diversified industrial products 90% 91% 89% 90%
Govt, public sector and NFP 92% n/a n/a 92%
Hospitality and leisure 92% 85% 88% 90%
Insurance 89% 93% 93% 91%
Media and entertainment 91% 93% 84% 90%
Mining and metals 91% 89% 87% 91%
Oil and gas 91% 90% 87% 90%
Other transportation 94% 93% 95% 94%
Pharmaceuticals 89% 92% 88% 90%
Power and utilities 90% 93% 89% 91%
Prof firms and services 91% 91% 95% 91%
Provider care 89% 82% 97% 88%
Real estate 92% 94% 87% 92%
Retail and wholesale 94% 85% 96% 92%
Technology 90% 89% 88% 90%
Telecommunications 92% 89% 95% 92%
All companies 91% 91% 90% 91%
Support levels for SOP proposals by industry in 2012
Say-on-say proposalsInvestor support for SOP proposals was high in 2012, averaging 91% for all companies, and less than 3% of the proposals received support of less than 50%. Overall support levels are consistent among the different market cap groups, as is the distribution of SOP support levels by threshold. Small- and mid-cap companies saw slightly higher average support for their SOP proposals, but industry also appears to have an impact.

26 Ernst & Young LLP | All rights reserved | © 2013
Proposal topic All companies Small-cap Mid-cap Large-cap
Avg support (%)
Voted(#)
Avg support (%)
Voted(#)
Avg support (%)
Voted(#)
Avg support (%)
Voted(#)
De-stagger board/adopt annual director elections 81% 51 85% 8 80% 26 80% 17
Provide for shareholder approval of poison pill 66% 5 64% 2 n/a n/a 67% 3
Eliminate supermajority vote requirements 65% 18 62% 3 68% 5 65% 10
Implement majority voting requirement in director elections 63% 37 69% 14 60% 10 59% 13
Lower requirements for special meetings/written consent 44% 36 38% 3 53% 5 43% 28
Limit post-employment pay 42% 5 n/a n/a 49% 3 31% 2
Adopt independent board chair 37% 55 44% 9 41% 9 34% 37
Provide for proxy access 29% 10 13% 1 26% 3 34% 6
Limit executive compensation 29% 27 10% 3 33% 11 31% 13
Enhance sustainability disclosure/management 28% 17 25% 2 29% 8 28% 7
Top 10 highest supported shareholder proposal topics in 2012*
*For topics where there were at least 5 proposals voted
Shareholder-sponsored proposalsWhile large-cap companies continue to receive most of the shareholder proposals, the proportion of shareholder proposals received by small- and mid-cap companies has increased, from 9% of all proposals in 2007 to 14% in 2012 for small- cap companies, and from 21% to 25% for
mid-cap companies. However, the proportion of small-cap companies that actually receive shareholder proposals remains low at 3%. This compares to 16% of mid-cap companies and 52% of large-cap companies that received shareholder proposals in 2012.
Investors are prioritizing governance changes in board structure, takeover protections and board composition to increase board accountability to shareholders.
Market cap 2007 2012
Proportion of companies
receiving proposals
Number of total proposals voted
Proportion of total proposals
voted
Average voting support
Proportion of companies
receiving proposals
Number of total proposals voted
Proportion of total proposals
voted
Average voting support
Small-cap 3% 60 10% 39% 3% 68 14% 45%
Mid-cap 14% 133 21% 36% 16% 125 25% 44%
Large-cap 49% 439 69% 28% 52% 302 61% 31%
All companies 100% 632 100% 31% 100% 495 100% 36%
Shareholder proposals voted at all companies

Shareholder proposals voted at small- and mid-cap companies tend to receive higher support levels on average.18


29Governance trends and practices at US companies: a review of small- and mid-sized companies | ey.com/governance
Section VIIAppendixTiming of annual meetings
Total meetings Jan Feb Mar Apr May June July Aug Sep Oct Nov DecAerospace and defense 38 3% 8% 11% 21% 39% 3% 3% 3% 0% 5% 5% 0%
Airlines 17 0% 0% 0% 0% 53% 29% 0% 12% 6% 0% 0% 0%
Asset management 51 2% 6% 4% 20% 33% 20% 6% 4% 0% 2% 2% 2%
Automotive 74 4% 1% 4% 20% 45% 9% 3% 3% 4% 3% 0% 4%
Banking and capital markets 285 2% 3% 0% 38% 43% 8% 1% 1% 1% 0% 2% 0%
Biotechnology 111 2% 2% 0% 5% 42% 34% 4% 2% 1% 5% 1% 3%
Chemicals 50 6% 4% 4% 22% 46% 6% 0% 2% 0% 6% 0% 4%
Construction 34 6% 6% 3% 3% 59% 9% 3% 0% 0% 3% 6% 3%
Consumer products 164 2% 5% 3% 12% 40% 12% 2% 6% 2% 5% 7% 2%
Diversified industrial products 224 4% 6% 4% 19% 43% 10% 3% 3% 2% 2% 3% 1%
Govt, public sector and NFP 14 14% 0% 7% 0% 57% 0% 0% 7% 0% 7% 7% 0%
Hospitality and leisure 69 3% 3% 3% 12% 48% 17% 0% 3% 0% 3% 4% 4%
Insurance 113 0% 0% 0% 21% 68% 9% 1% 1% 0% 0% 0% 0%
Media and entertainment 83 1% 0% 2% 5% 57% 18% 2% 2% 6% 2% 4% 0%
Mining and metals 75 1% 4% 0% 15% 55% 13% 1% 3% 3% 1% 1% 3%
Oil and gas 156 2% 1% 2% 8% 61% 19% 3% 0% 1% 0% 3% 1%
Other transportation 49 0% 2% 0% 16% 53% 20% 2% 0% 4% 0% 2% 0%
Pharmaceuticals 179 2% 1% 2% 7% 44% 26% 3% 4% 3% 2% 4% 2%
Power and utilities 92 2% 1% 2% 20% 70% 2% 0% 0% 0% 2% 1% 0%
Prof firms and services 122 1% 2% 2% 10% 44% 22% 2% 2% 4% 5% 5% 1%
Provider care 46 0% 2% 0% 4% 65% 24% 2% 0% 0% 0% 2% 0%
Real estate 160 1% 1% 2% 9% 69% 14% 3% 0% 1% 0% 1% 0%
Retail and wholesale 179 4% 4% 2% 6% 35% 30% 5% 4% 2% 2% 2% 4%
Technology 393 3% 2% 4% 7% 39% 19% 3% 8% 3% 3% 7% 3%
Telecommunications 51 0% 0% 0% 8% 57% 31% 0% 0% 0% 0% 2% 2%
2012 annual meeting dates by month and industry

30 Ernst & Young LLP | All rights reserved | © 2013
Board structure, organization and composition
Industry sectors Director elections Independent board leadership Board composition (average) Organization (avg)
Annualelections
for all
Majority voting
Board chair
Lead director
Presiding director
Total Board independence
Age Board tenure
Women directors
Total boards
Board size
Meetings
Aerospace and defense 39% 17% 30% 43% 13% 87% 76% 65 11 7% 2 9 6
Airlines 70% 10% 60% 30% 0% 90% 79% 60 9 7% 2 9 9
Asset management 49% 28% 18% 38% 10% 67% 68% 59 6 8% 2 7 8
Automotive 51% 23% 34% 45% 6% 85% 76% 61 9 8% 2 9 8
Banking and capital markets 47% 13% 40% 36% 5% 81% 79% 61 10 11% 1 10 11
Biotechnology 37% 20% 51% 27% 5% 83% 79% 60 8 9% 2 8 8
Chemicals 32% 19% 23% 61% 13% 97% 80% 61 8 9% 2 9 7
Construction 46% 19% 27% 50% 8% 85% 75% 62 8 7% 2 8 8
Consumer products 58% 19% 21% 34% 13% 69% 74% 61 10 14% 2 8 7
Diversified industrial products 48% 14% 41% 31% 8% 80% 78% 62 9 7% 2 8 7
Govt, public sector and NFP 54% 15% 38% 46% 0% 85% 76% 58 7 12% 1 9 7
Hospitality and leisure 60% 35% 25% 54% 4% 83% 77% 60 8 13% 2 9 9
Insurance 56% 40% 37% 24% 14% 75% 74% 62 9 10% 1 9 7
Media and entertainment 61% 13% 30% 31% 13% 74% 72% 59 9 12% 2 9 8
Mining and metals 60% 23% 37% 28% 5% 70% 75% 60 7 5% 2 8 8
Oil and gas 52% 17% 29% 35% 13% 77% 75% 61 8 4% 2 8 9
Other transportation 62% 24% 26% 26% 3% 56% 73% 60 9 6% 2 7 7
Pharmaceuticals 43% 13% 57% 26% 2% 86% 79% 60 7 8% 2 8 9
Power and utilities 49% 24% 35% 49% 3% 86% 81% 61 8 17% 1 9 8
Prof firms and services 43% 20% 33% 35% 11% 78% 77% 60 9 11% 2 8 9
Provider care 35% 18% 21% 38% 3% 62% 73% 62 9 8% 2 8 8
Real estate 73% 26% 28% 43% 9% 81% 72% 61 8 8% 2 8 8
Retail and wholesale 60% 26% 37% 31% 8% 76% 75% 60 9 13% 2 8 7
Technology 48% 15% 39% 36% 4% 80% 77% 60 8 6% 2 8 9
Telecommunications 57% 27% 46% 22% 5% 73% 77% 58 7 7% 2 8 10
All small-cap companies 51% 19% 37% 35% 7% 79% 77% 61 9 9% 2 8 8
2012 board structure, organization and composition data — small-cap companies

31Governance trends and practices at US companies: a review of small- and mid-sized companies | ey.com/governance
2012 board structure, organization and composition data — mid-cap companies
Industry sectors Director elections Independent board leadership Board composition (average) Organization (avg)
Annualelections
Majority voting
Board chair
Lead director
Presiding director
Total Board independence
Age Board tenure
Women directors
Total boards
Board size
Meetings
Aerospace and defense 56% 44% 0% 33% 11% 44% 81% 63 8 7% 2 9 7
Airlines 67% 67% 17% 17% 33% 67% 72% 62 9 18% 2 11 8
Asset management 44% 78% 11% 78% 0% 89% 77% 62 10 17% 2 9 9
Automotive 56% 44% 33% 28% 6% 67% 80% 60 7 8% 2 10 7
Banking and capital markets 81% 48% 32% 55% 3% 90% 82% 62 9 17% 2 12 11
Biotechnology 41% 24% 18% 59% 0% 76% 84% 61 9 13% 2 9 8
Chemicals 27% 64% 18% 73% 9% 100% 86% 63 8 15% 2 10 7
Construction 63% 75% 13% 50% 13% 75% 84% 63 8 9% 2 9 7
Consumer products 64% 64% 23% 49% 13% 85% 81% 61 9 19% 2 10 8
Diversified industrial products 39% 45% 21% 54% 18% 93% 85% 62 9 12% 2 10 7
Govt, public sector and NFP 100% 0% 0% 100% 0% 100% 54% 57 4 31% 1 13 8
Hospitality and leisure 36% 36% 43% 29% 21% 93% 79% 60 9 14% 2 9 10
Insurance 44% 68% 29% 35% 9% 74% 83% 63 9 13% 2 10 7
Media and entertainment 88% 25% 19% 25% 13% 56% 72% 58 7 17% 2 11 8
Mining and metals 57% 50% 14% 64% 7% 86% 80% 63 9 10% 2 10 8
Oil and gas 59% 46% 21% 54% 15% 90% 78% 62 8 6% 2 9 8
Other transportation 60% 70% 10% 50% 30% 90% 73% 62 13 9% 2 9 8
Pharmaceuticals 68% 52% 60% 28% 4% 92% 80% 61 8 13% 2 9 9
Power and utilities 79% 55% 37% 45% 16% 97% 87% 63 9 18% 2 10 8
Prof firms and services 63% 84% 26% 53% 5% 84% 79% 60 9 16% 2 9 9
Provider care 89% 67% 33% 33% 22% 89% 75% 61 9 15% 2 9 11
Real estate 86% 36% 36% 42% 16% 94% 75% 63 10 12% 2 9 7
Retail and wholesale 63% 63% 29% 61% 11% 100% 78% 60 9 18% 2 10 7
Technology 65% 53% 43% 41% 8% 91% 78% 61 9 9% 2 9 8
Telecommunications 67% 56% 44% 44% 0% 89% 79% 59 6 13% 2 9 11
All mid-cap companies 62% 52% 30% 46% 11% 88% 80% 61 9 13% 2 10 8

32 Ernst & Young LLP | All rights reserved | © 2013
2012 board structure, organization and composition data — large-cap companies
Industry sectors Director elections Independent board leadership Board composition (average) Organization (avg)
Annualelections
Majority voting
Board chair
Lead director
Presiding director
Total Board independence
Age Board tenure
Women directors
Total boards
Board size
Meetings
Aerospace and defense 100% 100% 0% 100% 0% 100% 88% 64 8 19% 2 12 9
Airlines 100% 100% 0% 100% 0% 100% 92% 60 11 17% 3 12 6
Asset management 100% 100% 0% 67% 33% 100% 67% 64 10 9% 2 13 7
Automotive 67% 78% 0% 67% 22% 89% 82% 62 10 14% 2 12 7
Banking and capital markets 90% 90% 19% 67% 14% 100% 86% 63 8 19% 2 13 12
Biotechnology 70% 80% 40% 30% 30% 100% 87% 61 8 20% 2 10 8
Chemicals 38% 88% 13% 38% 38% 88% 85% 61 8 19% 2 11 7
Construction n/a n/a n/a n/a n/a n/a n/a n/a n/a n/a n/a n/a n/a
Consumer products 85% 77% 15% 35% 42% 92% 85% 61 8 22% 2 11 8
Diversified industrial products 87% 80% 7% 40% 27% 73% 86% 63 10 17% 2 11 8
Govt, public sector and NFP n/a n/a n/a n/a n/a n/a n/a n/a n/a n/a n/a n/a n/a
Hospitality and leisure 57% 57% 29% 43% 14% 86% 79% 61 10 15% 2 10 6
Insurance 88% 100% 31% 63% 6% 100% 88% 63 9 22% 2 12 10
Media and entertainment 85% 77% 0% 23% 38% 62% 77% 64 8 16% 2 12 9
Mining and metals 100% 50% 25% 50% 0% 75% 84% 64 9 9% 2 11 6
Oil and gas 80% 72% 16% 60% 20% 96% 84% 63 8 10% 2 10 9
Other transportation 100% 80% 0% 40% 40% 80% 85% 63 8 14% 2 13 6
Pharmaceuticals 81% 88% 6% 56% 19% 81% 88% 62 8 20% 2 11 7
Power and utilities 100% 82% 18% 71% 12% 100% 88% 63 8 16% 2 12 10
Prof firms and services 100% 100% 0% 100% 0% 100% 87% 63 10 18% 2 11 6
Provider care 100% 100% 33% 33% 33% 100% 91% 61 9 15% 2 11 12
Real estate 82% 91% 0% 64% 27% 91% 75% 62 10 14% 2 10 9
Retail and wholesale 90% 85% 20% 65% 5% 90% 80% 62 11 19% 2 11 6
Technology 81% 86% 33% 44% 6% 83% 83% 61 8 17% 2 10 8
Telecommunications 80% 100% 40% 40% 20% 100% 87% 61 10 21% 2 11 9
All large-cap companies 84% 84% 18% 53% 19% 90% 84% 62 9 17% 2 11 8

33Governance trends and practices at US companies: a review of small- and mid-sized companies | ey.com/governance
2012 board structure, organization and composition data — all companies
Industry sectors Director elections Independent board leadership Board composition (average) Organization (avg)
Annualelections
Majority voting
Board chair
Lead director
Presiding director
Total Board independence
Age Board tenure
Women directors
Total boards
Board size
Meetings
Aerospace and defense 53% 37% 18% 50% 11% 79% 79% 64 10 9% 2 9 7
Airlines 71% 35% 41% 29% 12% 82% 77% 60 9 11% 2 10 8
Asset management 51% 41% 16% 47% 10% 73% 69% 60 7 10% 2 8 8
Automotive 54% 35% 30% 43% 8% 81% 78% 61 9 9% 2 9 7
Banking and capital markets 54% 23% 38% 41% 5% 84% 80% 62 10 12% 1 11 11
Biotechnology 41% 26% 45% 33% 6% 85% 81% 61 8 11% 2 8 8
Chemicals 32% 40% 20% 60% 16% 96% 82% 63 8 12% 2 10 7
Construction 50% 32% 24% 50% 9% 82% 77% 63 8 8% 2 8 8
Consumer products 63% 39% 21% 38% 18% 77% 78% 61 9 16% 2 9 7
Diversified industrial products 49% 26% 33% 37% 12% 83% 80% 62 9 9% 2 9 7
Govt, public sector and NFP 57% 14% 36% 50% 0% 86% 75% 58 7 13% 2 9 7
Hospitality and leisure 55% 38% 29% 48% 9% 86% 78% 61 8 14% 2 9 9
Insurance 57% 57% 34% 33% 12% 78% 79% 62 9 13% 2 10 8
Media and entertainment 70% 25% 23% 29% 17% 69% 73% 60 8 14% 2 9 8
Mining and metals 61% 29% 32% 36% 5% 73% 77% 61 8 6% 2 8 8
Oil and gas 58% 33% 25% 44% 15% 83% 77% 62 8 6% 2 8 9
Other transportation 65% 39% 20% 33% 12% 65% 74% 61 10 8% 2 8 7
Pharmaceuticals 50% 25% 53% 29% 4% 86% 80% 60 7 10% 2 8 9
Power and utilities 71% 48% 33% 51% 10% 93% 85% 62 8 18% 2 10 8
Prof firms and services 47% 31% 31% 35% 10% 76% 77% 60 9 12% 2 8 9
Provider care 50% 33% 24% 37% 9% 70% 75% 62 9 10% 2 9 9
Real estate 78% 34% 29% 44% 13% 86% 74% 62 9 10% 2 8 8
Retail and wholesale 64% 40% 34% 41% 8% 83% 76% 60 9 15% 2 9 7
Technology 55% 29% 39% 38% 5% 82% 78% 60 8 8% 2 8 8
Telecommunications 61% 39% 45% 27% 6% 78% 78% 59 7 10% 2 8 10
All companies 56% 33% 33% 39% 9% 82% 78% 61 9 11% 2 9 8

34 Ernst & Young LLP | All rights reserved | © 2013
Industry sectors Audit committee (average) Compensation committee (average)Size Meetings Independence Age Board
tenureWomen
directorsTotal
boardsSize Meetings Independence Age Board
tenureWomen
directorsTotal
boards
Aerospace and defense 4 6 99% 65 9 9% 2 4 5.2 97% 66 10 5% 2
Airlines 3 7 97% 59 8 7% 2 4 5.3 100% 62 9 15% 2
Asset management 4 6 100% 62 5 10% 2 3 4.4 100% 62 6 9% 2
Automotive 4 7 100% 63 8 10% 2 4 5.0 96% 63 8 8% 2
Banking and capital markets 4 8 100% 62 9 13% 1 4 5.6 99% 63 10 12% 1
Biotechnology 3 6 100% 62 8 13% 2 3 5.8 99% 62 7 8% 2
Chemicals 4 7 100% 63 8 10% 2 4 5.0 99% 64 8 7% 2
Construction 4 6 100% 63 8 12% 2 4 5.5 100% 63 8 9% 2
Consumer products 4 7 100% 63 8 13% 2 4 4.9 99% 63 10 15% 2
Diversified industrial products 4 7 100% 63 9 9% 2 4 5.3 96% 62 9 9% 2
Govt, public sector and NFP 3 8 100% 60 7 12% 1 3 7.5 96% 59 7 13% 2
Hospitality and leisure 4 8 100% 63 8 10% 2 4 6.3 100% 62 8 15% 2
Insurance 4 8 100% 64 8 10% 2 4 5.0 98% 64 9 10% 2
Media and entertainment 3 7 100% 60 7 7% 2 3 5.0 96% 61 8 13% 2
Mining and metals 3 7 100% 62 7 6% 2 3 4.7 97% 62 7 5% 2
Oil and gas 4 7 99% 62 7 6% 2 4 5.0 97% 61 7 5% 2
Other transportation 3 7 100% 63 8 8% 2 3 6.5 98% 63 8 3% 2
Pharmaceuticals 3 7 100% 60 7 8% 2 3 5.9 99% 61 7 11% 2
Power and utilities 4 7 100% 62 8 17% 1 4 4.9 99% 62 9 19% 2
Prof firms and services 3 8 99% 62 8 10% 2 4 5.8 96% 61 8 11% 2
Provider care 4 6 100% 63 8 8% 2 4 5.5 96% 63 8 8% 2
Real estate 3 7 100% 63 7 12% 2 3 4.8 99% 64 8 9% 2
Retail and wholesale 4 7 100% 61 8 15% 2 4 5.7 98% 61 8 15% 2
Technology 3 8 100% 62 8 13% 2 3 6.3 98% 62 8 7% 2
Telecommunications 3 7 100% 60 6 8% 2 3 5.7 99% 59 7 6% 2
All small-cap companies 4 7 100% 62 8 10% 2 4 6 98% 62 8 10% 2
2012 key committee structure, organization and composition — small-cap companies
Key committee structure, organization and composition

35Governance trends and practices at US companies: a review of small- and mid-sized companies | ey.com/governance
Nominating committee (average)Size Meetings Independence Age Board
tenureWomen
directorsTotal
boards
4 3 95% 66 11 10% 2
4 3 100% 61 9 6% 2
3 3 96% 61 6 10% 2
4 3 97% 63 9 13% 2
4 4 99% 63 11 13% 1
4 3 100% 62 8 10% 2
3 4 99% 64 8 9% 2
4 3 99% 63 8 8% 2
4 3 99% 63 9 18% 2
4 4 96% 63 9 8% 2
4 4 100% 59 8 22% 1
4 4 100% 63 8 14% 2
3 4 95% 64 10 10% 1
3 3 98% 61 9 12% 2
3 3 97% 62 8 5% 2
4 3 98% 62 8 5% 2
4 3 99% 62 8 5% 2
3 3 99% 62 7 9% 2
4 3 99% 63 9 21% 2
3 3 96% 61 9 13% 2
3 3 96% 65 9 10% 2
3 3 99% 63 8 10% 2
3 4 98% 62 9 16% 2
3 3 99% 62 8 7% 2
3 3 95% 59 7 7% 2
4 3 98% 62 9 11% 2

36 Ernst & Young LLP | All rights reserved | © 2013
2012 key committee structure, organization and composition — mid-cap companies
Industry sectors Audit committee (average) Compensation committee (average)Size Meetings Independence Age Board
tenureWomen
directorsTotal
boardsSize Meetings Independence Age Board
tenureWomen
directorsTotal
boards
Aerospace and defense 4 7 100% 64 8 8% 2 4 5.3 97% 63 9 6% 2
Airlines 4 8 100% 62 6 29% 2 4 6.2 89% 65 11 19% 2
Asset management 4 8 100% 63 8 33% 2 4 6.9 100% 64 10 18% 2
Automotive 4 8 100% 60 6 6% 2 3 6.3 100% 62 6 6% 2
Banking and capital markets 4 10 100% 63 9 25% 2 4 6.6 99% 64 10 15% 2
Biotechnology 4 8 100% 61 9 9% 2 4 6.2 100% 61 9 12% 2
Chemicals 5 7 100% 63 9 23% 2 5 4.8 100% 66 9 8% 2
Construction 4 7 100% 64 7 5% 2 4 5.5 100% 64 8 9% 2
Consumer products 4 8 100% 62 8 25% 2 4 5.8 100% 62 9 25% 2
Diversified industrial products 4 8 100% 62 8 14% 2 4 5.1 100% 63 10 14% 2
Govt, public sector and NFP 4 11 100% 55 4 50% 2 3 22.0 100% 59 4 33% 1
Hospitality and leisure 4 9 100% 60 8 19% 2 4 5.7 100% 61 9 15% 2
Insurance 4 8 100% 64 8 15% 2 4 5.7 100% 64 9 18% 2
Media and entertainment 3 7 100% 60 6 12% 2 3 6.0 96% 60 7 11% 2
Mining and metals 4 9 100% 64 9 8% 2 4 6.5 95% 64 9 11% 2
Oil and gas 4 7 100% 63 8 7% 2 4 5.9 98% 64 8 7% 2
Other transportation 4 7 100% 62 10 14% 2 4 4.5 100% 61 11 8% 2
Pharmaceuticals 3 8 100% 64 9 11% 2 4 6.5 100% 62 8 15% 2
Power and utilities 4 6 100% 63 8 18% 2 4 5.8 100% 64 10 20% 2
Prof firms and services 4 7 100% 61 7 15% 2 4 5.9 100% 61 8 19% 2
Provider care 4 10 100% 60 7 19% 2 4 5.9 94% 63 9 19% 2
Real estate 4 7 100% 64 9 13% 2 4 4.8 100% 65 9 12% 2
Retail and wholesale 4 8 100% 61 7 21% 2 4 5.8 98% 62 9 21% 2
Technology 3 9 100% 62 8 10% 2 3 7.0 98% 62 9 9% 2
Telecommunications 3 8 100% 61 5 14% 2 3 8.0 100% 60 5 11% 2
All mid-cap companies 4 8 100% 62 8 15% 2 4 6 99% 63 9 14% 2

37Governance trends and practices at US companies: a review of small- and mid-sized companies | ey.com/governance
Nominating committee (average)Size Meetings Independence Age Board
tenureWomen
directorsTotal
boards
4 3 100% 63 8 15% 2
3 6 89% 65 11 17% 2
5 5 100% 64 9 11% 2
3 5 100% 62 7 25% 2
4 5 99% 64 10 16% 1
4 4 100% 62 9 12% 2
4 4 100% 64 10 15% 2
4 5 100% 64 8 19% 2
4 4 98% 64 9 10% 2
4 4 99% 63 11 13% 2
4 4 100% 63 4 20% 1
4 4 100% 62 9 17% 2
4 4 100% 63 9 12% 1
3 3 96% 57 7 18% 2
4 4 98% 64 9 16% 2
4 3 98% 65 10 16% 2
4 4 100% 63 11 6% 2
4 4 100% 62 8 17% 2
4 4 100% 64 10 21% 2
4 4 100% 61 8 16% 2
4 3 89% 63 10 18% 2
4 4 100% 64 10 10% 2
4 4 96% 62 10 23% 2
4 4 99% 63 9 12% 2
3 4 100% 60 6 15% 2
4 4 99% 63 9 15% 2

38 Ernst & Young LLP | All rights reserved | © 2013
2012 key committee structure, organization and composition — large-cap companies
Industry sectors Audit committee (average) Compensation committee (average)Size Meetings Independence Age Board
tenureWomen
directorsTotal
boardsSize Meetings Independence Age Board
tenureWomen
directorsTotal
boards
Aerospace and defense 5 10 100% 64 8 19% 2 5 6 100% 64 9 14% 2
Airlines 4 9 100% 60 10 0% 3 4 5 100% 60 10 50% 4
Asset management 4 9 100% 64 7 8% 2 5 6 100% 69 8 5% 2
Automotive 5 9 100% 63 9 9% 2 4 6 100% 63 10 24% 2
Banking and capital markets 5 12 100% 64 8 20% 2 5 9 100% 64 9 17% 2
Biotechnology 4 10 100% 61 8 22% 2 4 6 100% 62 8 17% 2
Chemicals 4 8 100% 61 8 20% 2 4 5 100% 63 9 16% 2
Construction n/a n/a n/a n/a n/a n/a n/a n/a n/a n/a n/a n/a n/a n/a
Consumer products 5 9 100% 62 8 21% 2 4 6 99% 62 9 25% 2
Diversified industrial products 4 8 100% 63 9 18% 2 4 6 100% 65 10 20% 2
Govt, public sector and NFP n/a n/a n/a n/a n/a n/a n/a n/a n/a n/a n/a n/a n/a n/a
Hospitality and leisure 3 9 100% 60 7 6% 2 4 6 100% 63 10 20% 2
Insurance 5 10 100% 63 8 23% 2 4 7 100% 65 8 15% 3
Media and entertainment 4 7 100% 64 7 19% 2 4 7 98% 65 8 16% 2
Mining and metals 5 6 100% 63 9 10% 2 5 5 100% 67 11 11% 2
Oil and gas 4 8 100% 64 8 12% 2 4 6 100% 64 8 13% 2
Other transportation 5 10 100% 63 7 26% 2 4 6 100% 63 8 16% 3
Pharmaceuticals 4 9 100% 63 8 19% 2 4 6 100% 64 8 27% 2
Power and utilities 5 8 100% 63 8 20% 2 5 7 100% 65 9 16% 2
Prof firms and services 4 8 100% 63 12 29% 2 5 6 100% 66 10 13% 2
Provider care 4 11 100% 61 8 0% 2 4 8 100% 61 11 29% 2
Real estate 3 7 100% 64 9 17% 2 3 8 100% 64 10 11% 2
Retail and wholesale 4 8 100% 62 8 25% 2 4 6 100% 63 12 19% 2
Technology 4 10 100% 62 7 19% 2 3 7 100% 62 7 17% 2
Telecommunications 4 10 100% 63 8 26% 2 4 7 100% 63 9 19% 2
All large companies 4 9 100% 63 8 19% 2 4 6 100% 64 9 18% 2

39Governance trends and practices at US companies: a review of small- and mid-sized companies | ey.com/governance
Nominating committee (average)Size Meetings Independence Age Board
tenureWomen
directorsTotal
boards
5 6 100% 64 10 20% 2
4 5 100% 64 8 25% 4
4 5 100% 71 10 22% 2
6 6 100% 64 10 20% 2
5 5 100% 65 10 23% 2
4 5 100% 62 8 28% 2
4 5 100% 63 8 21% 2
n/a n/a n/a n/a n/a n/a n/a
5 5 98% 63 9 25% 2
4 4 100% 64 10 22% 2
n/a n/a n/a n/a n/a n/a n/a
4 4 100% 64 11 23% 2
4 5 100% 65 11 34% 2
5 5 98% 63 8 21% 2
5 4 100% 66 10 11% 2
4 4 100% 65 8 13% 2
4 5 100% 66 9 8% 3
4 5 100% 64 9 20% 2
5 6 100% 64 9 24% 2
5 5 100% 65 9 0% 2
3 4 100% 64 13 22% 2
3 4 100% 64 11 14% 2
5 4 100% 64 10 28% 2
3 5 100% 63 9 16% 2
4 5 100% 63 11 25% 2
4 5 100% 64 9 21% 2

40 Ernst & Young LLP | All rights reserved | © 2013
2012 key committee structure, organization and composition — all companies
Industry sectors Audit committee (average) Compensation committee (average)Size Meetings Independence Age Board
tenureWomen
directorsTotal
boardsSize Meetings Independence Age Board
tenureWomen
directorsTotal
boards
Aerospace and defense 4 7 99% 65 9 10% 2 4 5 98% 65 10 7% 2
Airlines 4 7 98% 60 7 14% 2 4 6 96% 63 10 18% 2
Asset management 4 6 100% 62 6 14% 2 3 5 100% 63 7 11% 2
Automotive 4 7 100% 62 8 9% 2 4 5 97% 63 8 10% 2
Banking and capital markets 4 9 100% 62 9 15% 1 4 6 99% 63 10 13% 1
Biotechnology 3 7 100% 62 8 13% 2 3 6 99% 62 8 9% 2
Chemicals 4 7 100% 63 8 15% 2 4 5 99% 64 8 9% 2
Construction 4 6 100% 63 7 10% 2 4 6 100% 64 8 9% 2
Consumer products 4 7 100% 62 8 17% 2 4 5 99% 63 9 19% 2
Diversified industrial products 4 7 100% 63 8 10% 2 4 5 97% 63 9 11% 2
Govt, public sector and NFP 4 8 100% 60 7 15% 1 3 9 96% 59 7 15% 2
Hospitality and leisure 4 8 100% 62 8 11% 2 4 6 100% 62 8 16% 2
Insurance 4 8 100% 64 8 13% 2 4 5 99% 64 9 13% 2
Media and entertainment 3 7 100% 61 7 10% 2 3 6 97% 62 8 13% 2
Mining and metals 4 7 100% 62 7 7% 2 4 5 97% 63 8 7% 2
Oil and gas 4 7 100% 63 7 7% 2 4 5 96% 62 8 6% 2
Other transportation 4 8 100% 62 8 11% 2 3 6 99% 62 9 6% 2
Pharmaceuticals 3 7 100% 61 7 9% 2 3 6 99% 61 8 13% 2
Power and utilities 4 7 100% 63 8 18% 2 4 6 100% 63 9 19% 2
Prof firms and services 4 7 100% 61 8 11% 2 4 6 97% 61 8 12% 2
Provider care 4 7 100% 62 8 9% 2 4 6 96% 63 9 12% 2
Real estate 3 7 100% 63 8 12% 2 3 5 100% 64 9 10% 2
Retail and wholesale 4 7 100% 61 8 18% 2 4 6 98% 62 9 17% 2
Technology 3 8 100% 62 8 9% 2 3 6 98% 62 8 8% 2
Telecommunications 3 7 100% 60 6 11% 2 3 6 99% 59 7 8% 2
All companies 4 7 100% 62 8 12% 2 4 6 98% 62 9 12% 2

41Governance trends and practices at US companies: a review of small- and mid-sized companies | ey.com/governance
Nominating committee (average)Size Meetings Independence Age Board
tenureWomen
directorsTotal
boards
4 3 97% 65 10 13% 2
3 4 96% 63 10 10% 2
4 3 97% 62 7 12% 2
4 4 98% 63 9 13% 2
4 4 99% 63 10 14% 1
3 3 100% 62 8 13% 2
4 4 99% 64 9 11% 2
4 4 99% 63 8 9% 2
4 4 99% 63 9 20% 2
4 4 97% 63 10 12% 2
3 4 100% 59 8 22% 1
4 4 100% 63 8 15% 2
3 4 98% 64 10 16% 2
3 3 98% 61 8 14% 2
3 3 97% 63 8 7% 2
4 3 98% 63 8 7% 2
3 3 99% 63 9 7% 2
3 4 99% 62 8 12% 2
4 4 100% 63 10 22% 2
4 3 96% 61 9 13% 2
4 3 95% 64 9 12% 2
3 3 100% 64 9 10% 2
4 4 97% 62 9 17% 2
3 4 99% 62 8 9% 2
3 3 97% 60 7 10% 2
4 4 98% 63 9 13% 2

42 Ernst & Young LLP | All rights reserved | © 2013
Executive compensationMedian CEO pay by market cap and industry2012 median CEO pay — small-cap companies ($ in thousands)
Industry sector Current compensation Potential post-employment compensation
Salary Bonus Stock awards
Option awards
Non-equity incentives
Change in pension value
All other comp
Total Pension value
Deferred comp value
Change in control payout
Termination payout
Aerospace and defense $650 $0 $360 $0 $567 $0 $50 $2,313 $0 $0 $2,904 $1,047
Airlines $535 0 $748 $0 $260 $0 $51 $1,624 $0 $0 $3,932 $1,291
Asset management $441 0 $626 $0 $0 $0 $92 $2,776 $0 $0 $1,453 $1,476
Automotive $745 0 $385 $0 $518 $0 $72 $2,842 $0 $0 $5,828 $2,412
Banking and capital markets $500 0 $147 $0 $59 $0 $43 $1,269 $0 $0 $1,824 $1,007
Biotechnology $503 0 $115 $593 $203 $0 $9 $1,745 $0 $0 $2,037 $837
Chemicals $704 0 $608 $248 $466 $0 $83 $3,032 $0 $0 $6,454 $1,833
Construction $594 0 $625 $102 $243 $0 $34 $2,520 $0 $0 $2,515 $2,120
Consumer products $744 0 $418 $0 $299 $0 $41 $2,814 $0 $0 $4,951 $1,690
Diversified industrial products $566 0 $464 $60 $336 $0 $41 $1,875 $0 $0 $3,394 $999
Govt, public sector and NFP $540 0 $444 $116 $271 $0 $11 $2,201 $0 $0 $2,831 $2,165
Hospitality and leisure $707 0 $823 $240 $657 $0 34 $2,876 $0 $0 $5,213 $1,600
Insurance $779 0 $675 $0 $71 $0 60 $2,558 $0 $0 $2,876 $1,593
Media and entertainment $650 0 $305 $0 $257 $0 33 $2,317 $0 $0 $2,661 $750
Mining and metals $650 0 $650 $0 $531 $0 33 $2,456 $0 $0 $3,503 $1,879
Oil and gas $527 0 $920 $0 $202 $0 27 $2,595 $0 $0 $4,392 $1,006
Other transportation $545 0 $330 $0 $60 $0 24 $1,347 $0 $0 $372 $0
Pharmaceuticals $486 0 $244 $457 $176 $0 16 $1,854 $0 $0 $1,951 $921
Power and utilities $549 0 $447 $0 $350 $220 20 $2,243 $229 $0 $2,892 $0
Prof firms and services $650 0 $570 $83 $442 $0 21 $2,644 $0 $0 $4,332 $2,006
Provider care $657 0 $751 $0 $254 $0 25 $2,359 $0 $0 $3,735 $1,754
Real estate $540 0 $650 $0 $0 $0 28 $2,068 $0 $0 $3,724 $950
Retail and wholesale $618 0 $434 $0 $231 $0 34 $1,982 $0 $0 $2,273 $776
Technology $484 0 $611 $216 $203 $0 14 $2,252 $0 $0 $2,526 $784
Telecommunications $560 0 $797 $461 $306 $0 24 $2,727 $0 $0 $3,157 $2,461

43Governance trends and practices at US companies: a review of small- and mid-sized companies | ey.com/governance
Industry sector Current compensation Potential post-employment compensation
Salary Bonus Stock awards
Option awards
Non-equity incentives
Change in pension value
All other comp
Total Pension value
Deferred comp value
Change in control payout
Termination payout
Aerospace and defense $880 $0 $1,548 $658 $1,335 $668 $85 $6,231 $4,803 $123 $10,707 $6,048
Airlines $600 $0 $1,841 $0 $554 $9 $93 $3,825 $0 $0 $11,013 $0
Asset management $790 $0 $2,477 $285 $3,000 $0 $39 $12,422 $0 $0 $19,622 $0
Automotive $950 $0 $1,491 $961 $1,480 $54 $121 $6,475 $0 $410 $12,372 $11,753
Banking and capital markets $980 $0 $1,507 $0 $864 $50 $93 $5,978 $296 $121 $10,533 $0
Biotechnology $782 $0 $1,363 $1,693 $807 $0 $26 $4,986 $0 $25 $12,411 $5,345
Chemicals $894 $0 $3,009 $1,161 $1,471 $329 $260 $7,485 $754 $324 $20,074 $4,428
Construction $993 $0 $3,741 $45 $1,650 $2 $275 $8,423 $0 $805 $13,290 $3,105
Consumer products $1,000 $0 $2,350 $1,686 $1,260 $98 $207 $7,770 $577 $1,259 $19,260 $4,184
Diversified industrial products $956 $0 $2,385 $967 $1,198 $938 $115 $7,075 $3,241 $293 $16,481 $4,764
Govt, public sector and NFP $600 $0 $2,500 $0 $1,007 $0 $48 $4,156 $0 $0 $5,676 $3,445
Hospitality and leisure $998 $0 $1,155 $626 $1,454 $0 $168 $5,873 $0 $0 $7,472 $5,846
Insurance $984 $0 $1,903 $112 $1,205 $0 $207 $7,193 $0 $460 $12,151 $4,975
Media and entertainment $1,000 $0 $307 $0 $812 $0 $127 $9,289 $0 $0 $10,050 $8,683
Mining and metals $816 $0 $1,635 $587 $1,014 $0 $119 $6,215 $0 $234 $9,719 $3,665
Oil and gas $744 $0 $2,580 $0 $963 $0 $126 $5,824 $0 $284 $12,898 $1,370
Other transportation $589 $0 $833 $393 $1,474 $0 $27 $3,789 $0 $257 $6,958 $365
Pharmaceuticals $801 $0 $2,122 $1,387 $991 $0 $97 $5,815 $0 $32 $9,255 $2,526
Power and utilities $810 $0 $1,950 $0 $937 $987 $73 $4,928 $4,157 $1,039 $11,390 $1,394
Prof firms and services $800 $0 $2,704 $1,321 $1,107 $0 $87 $7,195 $0 $55 $12,101 $8,241
Provider care $1,066 $0 $4,711 $2,016 $2,345 $122 $167 $12,467 $856 $995 $21,842 $19,512
Real estate $706 $0 $1,632 $0 $845 $0 $40 $3,939 $0 $0 $9,053 $4,209
Retail and wholesale $997 $0 $1,722 $960 $1,188 $0 $78 $7,075 $0 $261 $13,347 $5,669
Technology $700 $0 $2,046 $901 $751 $0 $14 $6,051 $0 $0 $8,382 $2,151
Telecommunications $935 $0 $3,959 $583 $1,166 $0 $80 $8,219 $0 $0 $12,849 $3,223
2012 median CEO pay — mid-cap companies ($ in thousands)

44 Ernst & Young LLP | All rights reserved | © 2013
Industry sector Current compensation Potential post-employment compensation
Salary Bonus Stock awards
Option awards
Non-equity
incentives
Change in pension value
All other comp
Total Pension value
Deferred comp value
Change in control payout
Termination payout
Aerospace and defense $1,576 $1,800 7,716 $3,499 $3,514 $4,674 $738 $24,164 $18,481 $3,400 $27,205 $13,112
Airlines $1,263 $0 0 $5,372 $6,575 $0 $471 $13,681 $25,577 $0 $6,072 $0
Asset management $500 $0 7,505 $0 $2,650 $0 $97 $9,878 $0 $0 $0 $0
Automotive $1,386 $0 2,300 $2,137 $3,884 $2,598 $153 $15,244 $11,026 $831 $25,523 $1,914
Banking and capital markets $1,000 $0 5,169 $1,651 $1,568 $369 $159 $12,982 $2,367 $1,920 $19,794 $3,451
Biotechnology $1,102 $0 2,554 $3,087 $2,000 $0 $145 $9,385 $0 $2,296 $20,130 $6,351
Chemicals $1,173 $0 3,892 $2,935 $2,455 $3,180 $189 $13,146 $13,728 $2,789 $15,382 $2,228
Construction n/a n/a n/a n/a n/a n/a n/a n/a n/a n/a n/a n/a
Consumer products $1,250 $0 4,874 $2,205 $2,232 $1,630 $247 $12,234 $6,066 $2,114 $27,940 $6,799
Diversified industrial products $1,225 $0 3,599 $2,926 $2,500 $2,233 $447 $17,104 $11,426 $4,072 $33,167 $7,721
Govt, public sector and NFP n/a n/a n/a n/a n/a n/a n/a n/a n/a n/a n/a n/a
Hospitality and leisure $1,281 $0 1,429 $1,825 $2,982 $0 $235 $13,845 $0 $1,333 $59,193 $10,000
Insurance $1,050 $0 5,613 $2,996 $2,614 $231 $173 $14,286 $910 $1,123 $37,208 $20,737
Media and entertainment $2,000 $0 5,441 $4,101 $5,150 $227 $435 $26,436 $220 $3,826 $18,333 $41,973
Mining and metals $1,340 $0 2,857 $4,036 $1,478 $1,854 $199 $10,807 $11,289 $32 $35,142 $17,441
Oil and gas $1,337 $0 4,207 $2,585 $1,899 $285 $258 $15,229 $79 $2,248 $25,059 $9,097
Other transportation $1,023 $0 5,335 $451 $1,148 $1,517 $124 $12,917 $17,514 $809 $27,935 $0
Pharmaceuticals $1,354 $0 5,119 $2,931 $2,513 $1,448 $110 $14,021 $8,554 $1,389 $23,865 $8,987
Power and utilities $1,064 $0 3,715 $445 $1,535 $1,815 $147 $9,676 $8,682 $2,519 $16,544 $4,104
Prof firms and services $978 $0 4,810 $468 $2,112 $0 $42 $8,409 $0 $489 $3,851 $0
Provider care $1,116 $0 4,320 $2,313 $2,114 $0 $200 $8,516 $0 $5,133 $32,770 $33,961
Real estate $915 $0 4,000 $820 $959 $0 $39 $9,993 $0 $0 $20,092 $12,826
Retail and wholesale $1,206 $0 4,438 $2,423 $2,194 $20 $177 $11,365 $0 $2,060 $19,877 $10,437
Technology $898 $0 5,412 $1,579 $1,633 $0 $40 $11,725 $0 $0 $15,978 $4,362
Telecommunications $1,100 $0 4,707 $0 $1,815 $127 $481 $8,942 $2,791 $1,777 $22,478 $0
2012 median CEO pay — large-cap companies ($ in thousands)

45Governance trends and practices at US companies: a review of small- and mid-sized companies | ey.com/governance
Median compensation of NEOs by market cap and position
Market cap Position Salary Bonus Stock awards Option awards
Non-equity incentives
Change in pension value
All other comp Total
Small-cap CEO $555 $0 $412 $0 $224 $0 $30 $2,088
CFO $313 $0 $160 $0 $74 $0 $15 $863
GC $300 $0 $154 $17 $92 $0 $16 $797
All NEOS $360 $0 $252 $48 $122 $0 $30 $1,198
All NEOS ex-CEO $307 $0 $173 $34 $88 $0 $25 $914
Mid-cap CEO $863 $0 $1,996 $600 $1,024 $0 $87 $6,269
CFO $437 $0 $558 $164 $345 $0 $35 $2,006
GC $389 $0 $402 $160 $286 $0 $36 $1,658
All NEOS $523 $0 $933 $319 $509 $0 $72 $3,086
All NEOS ex-CEO $443 $0 $595 $195 $370 $0 $59 $2,210
Large-cap CEO $1,145 $0 $4,292 $2,146 $2,107 $112 $178 $12,572
CFO $620 $0 $1,179 $519 $656 34 $62 $4,016
GC $533 $0 $993 $372 $626 133 $68 $3,248
All NEOS $711 $0 $2,030 $882 $959 206 $134 $6,151
All NEOS ex-CEO $603 $0 $1,285 $520 $668 155 $97 $4,306
2012 median pay of NEOs by market cap and position ($ in thousands)

46 Ernst & Young LLP | All rights reserved | © 2013
Industry sector Current compensation
Salary Bonus Stock awards Option awards Non-equity incentives
Change in pension value
All other comp Total
Aerospace and defense $330 $0 $122 $0 $215 $9 $34 $980
Airlines $255 $10 $330 $0 $140 $0 $78 $748
Asset management $302 $114 $231 $0 $0 $0 $74 $1,358
Automotive $359 $0 $168 $0 $138 $0 $38 $874
Banking and capital markets $261 $0 $70 $0 $24 $0 $27 $583
Biotechnology $322 $0 $58 $218 $73 $0 $17 $865
Chemicals $335 $0 $168 $42 $160 $3 $47 $995
Construction $309 $0 $196 $52 $93 $0 $35 $864
Consumer products $370 $0 $164 $16 $138 $0 $37 $996
Diversified industrial products $289 $0 $143 $78 $123 $0 $27 $748
Govt, public sector and NFP $304 $0 $133 $103 $94 $0 $14 $808
Hospitality and leisure $356 $0 $310 $85 $228 $0 $36 $1,234
Insurance $354 $0 $240 $0 $102 $0 $43 $1,046
Media and entertainment $380 $2 $207 $33 $126 $0 $29 $1,218
Mining and metals $310 $0 $235 $27 $166 $2 $25 $1,056
Oil and gas $290 35 $396 $0 $45 $0 $25 $1,166
Other transportation $312 $0 $212 $0 $33 $0 $14 $822
Pharmaceuticals $293 $0 $88 $200 $82 $0 $17 $811
Power and utilities $278 $0 $138 $0 $105 $135 $20 $822
Prof firms and services $329 $0 $234 $72 $163 $0 $22 $1,071
Provider care $353 $0 $288 $0 $114 $0 $29 $1,022
Real estate $305 $13 $329 $0 $14 $0 $25 $954
Retail and wholesale $332 $0 $193 $29 $94 $0 $25 $939
Technology $286 $0 $266 $146 $83 $0 $17 $1,020
Telecommunications $285 $6 $254 $109 $90 $0 $16 $959
2012 median NEO pay (excluding CEOs) — small-cap companies ($ in thousands)
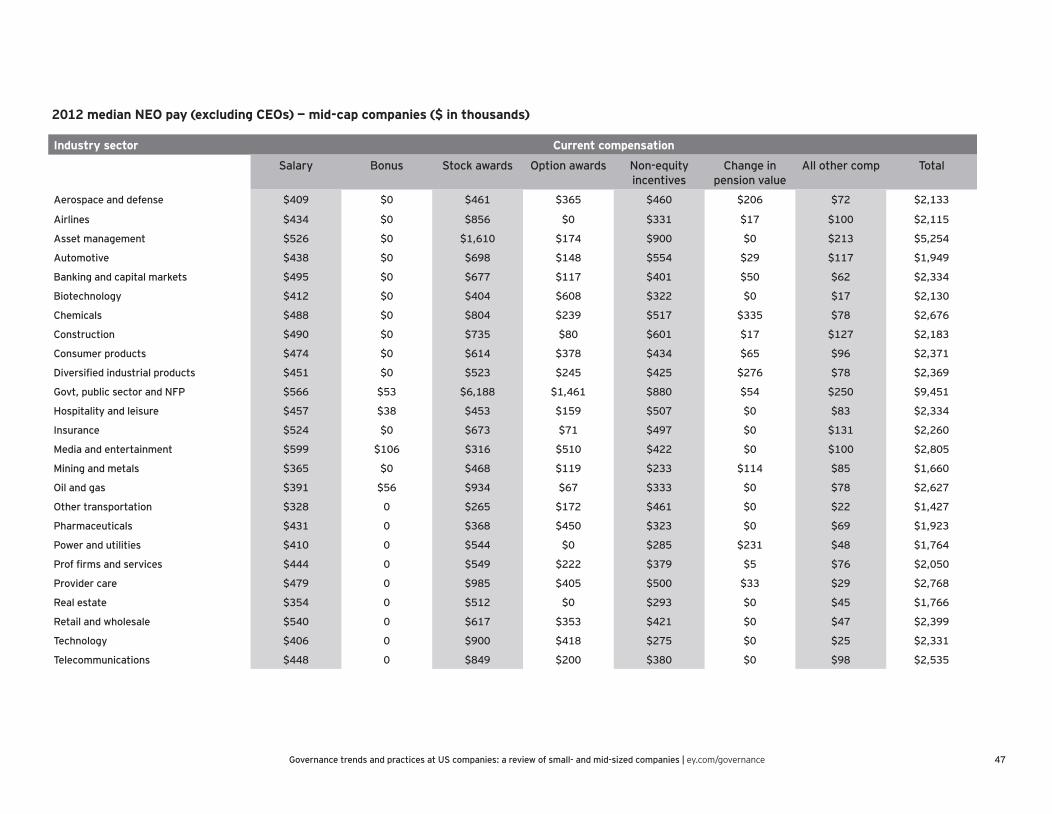
47Governance trends and practices at US companies: a review of small- and mid-sized companies | ey.com/governance
Industry sector Current compensation
Salary Bonus Stock awards Option awards Non-equity incentives
Change in pension value
All other comp Total
Aerospace and defense $409 $0 $461 $365 $460 $206 $72 $2,133
Airlines $434 $0 $856 $0 $331 $17 $100 $2,115
Asset management $526 $0 $1,610 $174 $900 $0 $213 $5,254
Automotive $438 $0 $698 $148 $554 $29 $117 $1,949
Banking and capital markets $495 $0 $677 $117 $401 $50 $62 $2,334
Biotechnology $412 $0 $404 $608 $322 $0 $17 $2,130
Chemicals $488 $0 $804 $239 $517 $335 $78 $2,676
Construction $490 $0 $735 $80 $601 $17 $127 $2,183
Consumer products $474 $0 $614 $378 $434 $65 $96 $2,371
Diversified industrial products $451 $0 $523 $245 $425 $276 $78 $2,369
Govt, public sector and NFP $566 $53 $6,188 $1,461 $880 $54 $250 $9,451
Hospitality and leisure $457 $38 $453 $159 $507 $0 $83 $2,334
Insurance $524 $0 $673 $71 $497 $0 $131 $2,260
Media and entertainment $599 $106 $316 $510 $422 $0 $100 $2,805
Mining and metals $365 $0 $468 $119 $233 $114 $85 $1,660
Oil and gas $391 $56 $934 $67 $333 $0 $78 $2,627
Other transportation $328 0 $265 $172 $461 $0 $22 $1,427
Pharmaceuticals $431 0 $368 $450 $323 $0 $69 $1,923
Power and utilities $410 0 $544 $0 $285 $231 $48 $1,764
Prof firms and services $444 0 $549 $222 $379 $5 $76 $2,050
Provider care $479 0 $985 $405 $500 $33 $29 $2,768
Real estate $354 0 $512 $0 $293 $0 $45 $1,766
Retail and wholesale $540 0 $617 $353 $421 $0 $47 $2,399
Technology $406 0 $900 $418 $275 $0 $25 $2,331
Telecommunications $448 0 $849 $200 $380 $0 $98 $2,535
2012 median NEO pay (excluding CEOs) — mid-cap companies ($ in thousands)

48 Ernst & Young LLP | All rights reserved | © 2013
2012 median NEO pay (excluding CEOs) — large-cap companies ($ in thousands)
Industry sector Current compensation
Salary Bonus Stock awards Option awards Non-equity incentives
Change in pension value
All other comp Total
Aerospace and defense $743 $501 $1,473 $946 $721 $1,078 $171 $6,548
Airlines $858 $0 $669 $708 $2,595 $1,192 $487 $6,509
Asset management $388 $0 $1,574 $0 $1,688 $0 $70 $5,789
Automotive $631 $0 $422 $524 $1,201 $934 $61 $4,928
Banking and capital markets
$719 $0 $3,031 $481 $758 $166 $83 $5,928
Biotechnology $583 $0 $1,104 $973 $428 $1 $66 $3,316
Chemicals $534 $10 $1,371 $477 $541 $562 $173 $4,091
Construction n/a n/a n/a n/a n/a n/a n/a n/a
Consumer products $699 $0 $1,219 $561 $640 $439 $140 $4,242
Diversified industrial products $585 $0 $823 $555 $495 $622 $130 $3,921
Govt, public sector and NFP n/a n/a n/a n/a n/a n/a n/a n/a
Hospitality and leisure $674 $0 $449 $667 $959 $0 $114 $3,771
Insurance $680 $0 $1,486 $606 $983 $251 $82 $4,893
Media and entertainment $1,006 $31 $1,689 $909 $1,520 $238 $93 $6,219
Mining and metals $591 $3 $986 $1,369 $590 $590 $100 $4,189
Oil and gas $597 $0 $1,241 $809 $756 $376 $110 $5,008
Other transportation $500 $0 $1,806 $138 $381 $449 $52 $3,726
Pharmaceuticals $716 $0 $1,250 $804 $933 $629 $128 $5,006
Power and utilities $554 $0 $929 $0 $556 $519 $72 $3,157
Prof Firms and services $772 $20 $2,872 $74 $1,057 $0 $10 $4,783
Provider care $549 $0 $3,054 $913 $688 $0 $82 $5,781
Real estate $415 $86 $1,183 $268 $318 $0 $28 $2,780
Retail and wholesale $703 $0 $1,276 $530 $898 $1 $129 $3,493
Technology $511 $0 $2,229 $403 $521 $0 $45 $4,261
Telecommunications $540 $0 $2,148 $0 $533 $151 $164 $4,026

49Governance trends and practices at US companies: a review of small- and mid-sized companies | ey.com/governance
Beneficial ownership
Industry sectors Average director and of� cer ownership
Number of 5% shareholders Average holding of largest 5% shareholder
Average holding of 5% shareholders
Small-cap
Mid-cap
Large-cap
All Small-cap
Mid-cap
Large-cap
All Small-cap
Mid-cap
Large-cap
All Small-cap
Mid-cap
Large-cap
All
Aerospace and defense 14% 5% 2% 10% 4 4 3 4 19% 15% 12% 17% 14% 8% 9% 12%
Airlines 13% 1% 8% 8% 6 4 2 5 17% 10% 7% 14% 10% 7% 6% 9%
Asset management 21% 7% 15% 18% 3 2 2 3 18% 9% 14% 16% 12% 7% 9% 11%
Automotive 18% 5% 2% 13% 4 3 2 4 21% 10% 12% 17% 13% 7% 8% 11%
Banking and capital markets 14% 5% 2% 12% 3 3 2 3 16% 10% 8% 14% 12% 8% 6% 11%
Biotechnology 13% 11% 3% 12% 4 4 3 4 16% 15% 8% 15% 11% 9% 7% 10%
Chemicals 17% 4% 1% 11% 4 3 2 4 20% 9% 7% 15% 14% 7% 6% 11%
Construction 15% 2% n/a 12% 4 4 n/a 4 15% 28% n/a 18% 11% 11% n/a 11%
Consumer products 23% 11% 5% 17% 4 3 2 4 25% 16% 14% 21% 16% 13% 10% 14%
Diversified industrial products 11% 5% 5% 9% 4 3 2 4 19% 10% 10% 16% 13% 8% 8% 11%
Govt, public sector and NFP 25% 100% n/a 30% 4 2 n/a 4 24% 51% n/a 26% 17% 50% n/a 19%
Hospitality and leisure 15% 8% 5% 12% 5 4 3 5 22% 13% 12% 19% 14% 9% 8% 12%
Insurance 17% 4% 5% 12% 4 4 2 4 26% 10% 13% 19% 17% 7% 10% 13%
Media and entertainment 36% 28% 13% 31% 4 4 2 4 39% 36% 33% 37% 27% 27% 28% 27%
Mining and metals 9% 3% 1% 8% 3 3 3 3 18% 14% 8% 17% 12% 13% 7% 12%
Oil and gas 14% 5% 4% 10% 4 3 2 4 22% 12% 9% 17% 15% 9% 7% 13%
Other transportation 18% 8% 5% 15% 4 3 3 3 23% 9% 9% 19% 17% 6% 7% 14%
Pharmaceuticals 18% 5% 1% 15% 5 4 2 4 16% 11% 7% 15% 12% 8% 6% 11%
Power and utilities 9% 2% 1% 4% 3 3 2 3 13% 8% 6% 10% 10% 7% 5% 8%
Prof Firms and services 19% 5% 6% 17% 5 4 1 5 20% 11% 8% 19% 14% 8% 8% 13%
Provider care 16% 13% 1% 15% 4 3 2 4 19% 22% 6% 19% 12% 21% 6% 14%
Real estate 10% 7% 5% 9% 4 5 4 4 14% 14% 9% 14% 9% 9% 7% 9%
Retail and wholesale 20% 12% 6% 17% 4 3 3 4 23% 17% 11% 20% 15% 13% 9% 14%
Technology 15% 8% 7% 13% 4 4 2 4 18% 16% 10% 17% 12% 12% 8% 12%
Telecommunications 17% 10% 4% 14% 4 4 2 4 23% 15% 7% 20% 14% 9% 7% 12%
2012 beneficial ownership data

50 Ernst & Young LLP | All rights reserved | © 2013
Investor views through shareholder proposals2012 vote results for shareholder-sponsored proposals
Industry sectors Small-cap Mid-cap Large-cap All companies
Average support
Number voted
Average support
Number voted
Average support
Number voted
Average support
Number voted
Aerospace and defense 84% 1 71% 2 32% 11 41% 14
Airlines 48% 1 30% 2 27% 2 33% 5
Asset management 43% 1 n/a n/a n/a n/a 43% 1
Automotive 24% 5 63% 3 41% 11 40% 19
Banking and capital markets 48% 9 53% 11 23% 30 34% 50
Biotechnology 5% 1 39% 3 44% 8 39% 12
Chemicals 13% 1 71% 3 40% 8 46% 12
Construction n/a n/a 35% 1 n/a n/a 35% 1
Consumer products 10% 3 45% 13 30% 23 33% 39
Diversified industrial products 52% 6 64% 8 32% 15 45% 29
Govt, public sector and NFP n/a n/a n/a n/a n/a n/a n/a n/a
Hospitality and leisure 35% 3 58% 3 36% 5 42% 11
Insurance n/a n/a 47% 4 16% 6 28% 10
Media and entertainment 16% 1 50% 3 31% 11 34% 15
Mining and metals 45% 1 35% 2 36% 2 37% 5
Oil and gas n/a n/a 46% 9 36% 38 38% 47
Other transportation n/a n/a 44% 1 26% 4 30% 5
Pharmaceuticals 77% 1 19% 7 33% 31 31% 39
Power and utilities 15% 2 33% 19 22% 22 27% 43
Prof firms and services 63% 6 40% 4 n/a n/a 54% 10
Provider care 58% 3 66% 2 39% 3 53% 8
Real estate 45% 7 28% 4 65% 4 46% 15
Retail and wholesale 36% 7 50% 10 22% 27 31% 44
Technology 67% 7 63% 4 33% 28 42% 39
Telecommunications 41% 2 26% 7 29% 13 29% 22

1The companies comprising the 2007 and 2012 data sets are not the same as they represent companies in the Russell 3000 index at the time of their 2012 and 2007 meetings. The speci� c set of companies covered in different sections of the report may vary based on the applicability of the topic to the company or availability of data (e.g., some companies may not compensate their employees directly).
2Ernst & Young de� ned industry groups.
3Data on classi� ed boards is based on the structure in place at the time of the 2007 and 2012 annual meetings. Amendments effective at the time of the meeting (assuming passage of proposal, if applicable) are considered. Boards in transition from staggered to annual elections for the full board are considered declassi� ed, though not all directors may yet be subject to annual elections.
4Data on majority voting policies in director elections is based on the structure in place at the time of the 2007 and 2012 annual meetings, based on proxy statement disclosures. These disclosures vary, and in some cases appear to contradict existing bylaw and/or voting options on proxy ballots (e.g., majority voting requirement combined with only option to vote for or withhold on the proxy ballot). Amendments effective at the time of the meeting (assuming passage of proposal, if applicable) are considered. Companies that have director resignation policies in connection with plurality voting standards, but have not amended their charter/bylaws to provide for majority voting, are not included.
5In cases where a board has two independent board chairs or lead or presiding directors, they are treated as one for the purpose of counting the number of companies with these structures in place.
6SEC Release No. 34-68640; File No. SR-NASDAQ-2012-109 and SEC Release No. 34-68639; File No. SR-NYSE-2012-49
7“Key committees” refers to the standing subcommittees of the board charged with the audit, compensation and nominating functions. Committees that comprise the full board are not considered to be separate subcommittees. In a limited number of cases, companies may combine the compensation and nominating functions into one committee; for purposes of this report these are treated as separate committees.
8Age generally is as of meeting date; may vary based on actual birth date. Tenure is based on the year of the annual meeting less the year the director joined the board.
9Board service includes membership on boards of publicly traded companies, including those outside of the US. Service on multiple funds within a family of funds is considered as a single board seat. Service on boards of foundations, non-pro� ts, universities or associations is not included.
10While nearly all companies provided disclosure on the number of meetings held, not all did. Board and key committee meeting counts include regular and special meetings, in-person and telephonic meetings; actions by written consent were excluded.
11Board pay is generally based on the amount disclosed in the “total” column of the Director Compensation Table, which includes cash fees for board and committee service, grant date value of equity compensation, and any other compensation paid. Data has not been included for any director new to the board and not yet compensated or who has elected not to receive compensation.
12Pay data is based on disclosures for three � scal years prior to the company’s annual meeting in 2012 or as available. For example, companies that recently became public may have fewer than three � scal years of data available. Data does not include companies which do not directly compensate the named executive of� cers,
nor does it include foreign private issuers which do not provide full disclosure on compensation practices. For the purpose of the study, only one individual is considered CEO for each company; in cases where a company has a “co-CEO” structure, the highest paid or the longest serving individual is considered CEO and the other individual is considered an “other NEO.” In cases where there is a change in the CEO or CFO during the � scal year, the individual who serves in that capacity for the greater part of the year is designated as the CEO or the CFO for that year.
13Executive compensation reported in median. Some companies may provide compensation in areas where the value at the median is reported as $0; $0 represents the midpoint of the data sample.
14Pension and deferred compensation generally are included in estimates of potential payouts under events such as a change in control and termination without cause, but practices may vary by company.
15Data re� ects the businesses as they stood during that year (i.e., does not take into account any acquisitions that may have taken place after the meeting date).
16Signi� cant shareholders include any owners of 5% or more of stock, including any insiders.
17Vote results are calculated based on votes cast for and against the proposal excluding abstentions and broker non-votes. For shareholder proposals, this is the standard for determining eligibility for resubmission of a proposal de� ned by the SEC and as a result the standard for assessing support for shareholder resolutions.
51Governance trends and practices at US companies: a review of small- and mid-sized companies | ey.com/governance

Ernst & YoungAssurance | Tax | Transactions | Advisory
About Ernst & Young Ernst & Young is a global leader in assurance, tax, transaction and advisory services. Worldwide, our 167,000 people are united by our shared values and an unwavering commitment to quality. We make a difference by helping our people, our clients and our wider communities achieve their potential.
Ernst & Young refers to the global organization of member firms of Ernst & Young Global Limited, each of which is a separate legal entity. Ernst & Young Global Limited, a UK company limited by guarantee, does not provide services to clients. For more information about our organization, please visit www.ey.com.
Ernst & Young LLP is a client-serving member firm ofErnst & Young Global and of Ernst & Young Americas operatingin the US.
About the Ernst & Young Corporate Governance Center (EYCGC)
The EYCGC offers balanced insights and data-rich content and analysis that foster alignment and bridges gaps among management, boards of directors and investors — raising awareness, creating understanding and serving as a conduit of information. The Center’s insights and content are supported through its proprietary corporate governance database, relationships with outside governance organizations and ongoing conversations with members of the investor and governance community.
ey.com/governance
© 2013 EYGM Limited.All Rights Reserved.
1304-1072920 NY
EYG no. CF0044
ED none
ContactAllie Monaco RutherfordCorporate Governance CenterErnst & Young LLP+1 202 327 [email protected]
David MartinSociety of Corporate Secretaries and Governance +1 212 681 [email protected]
About Society of Corporate Secretaries and Governance ProfessionalsFounded in 1946, the Society of Corporate Secretaries and Governance Professionals, Inc. (the “Society”) is a non-profit organization (Section 501(c)(6)) comprised principally of corporate secretaries and business executives in governance, ethics and compliance functions at public, private and not-for-profit organizations. Members are responsible for supporting their board of directors and executive management in matters such as board practices, compliance, regulation and legal matters, shareholder relations and subsidiary management.