Embed Size (px)
Citation preview
United StatesEnvironmental ProtectionAgency
Air
EPA-452/R-97-003December 1997
Mercury StudyReport to Congress
Volume I:Executive Summary
c7o032-1-1
Office of Air Quality Planning & Standardsand
Office of Research and Development

MERCURY STUDY REPORT TO CONGRESS
VOLUME I:
EXECUTIVE SUMMARY
December 1997
Office of Air Quality Planning and Standardsand
Office of Research and Development
U.S. Environmental Protection Agency
DEDICATION
The U.S. EPA scientists who authored this Report dedicate their efforts to the memory of theircolleague, Terry Clark. Terry began his career at the U.S. EPA in 1975, where he became a national, andthen an international expert in the atmospheric transport of acid rain and toxic trace gases. Terrydesigned the initial long-range transport analysis for the Mercury Study. The energy and creativity hebrought to his work sustained him even through the final months of his illness when he continued towork daily on this Report. His honesty, intelligence and generosity of spirit are greatly missed. TerryClark died on January 28, 1994.
i
TABLE OF CONTENTS
Page
U.S. EPA AUTHORS. . . . . . . . . . . . . . . . . . . . . . . . . . . . . . . . . . . . . . . . . . . . . . . . . . . . . . . . . . . . . . . . ii
SCIENTIFIC PEER REVIEWERS. . . . . . . . . . . . . . . . . . . . . . . . . . . . . . . . . . . . . . . . . . . . . . . . . . . . . . iii
WORK GROUP AND U.S. EPA REVIEWERS. . . . . . . . . . . . . . . . . . . . . . . . . . . . . . . . . . . . . . . . . . . vi
LIST OF TABLES AND FIGURES. . . . . . . . . . . . . . . . . . . . . . . . . . . . . . . . . . . . . . . . . . . . . . . . . . . . vii
LIST OF SYMBOLS, UNITS AND ACRONYMS. . . . . . . . . . . . . . . . . . . . . . . . . . . . . . . . . . . . . . . .viii
OVERVIEW . . . . . . . . . . . . . . . . . . . . . . . . . . . . . . . . . . . . . . . . . . . . . . . . . . . . . . . . . . . . . . . . . . . . . O-1
1. THE MERCURY STUDY REPORT TO CONGRESS. . . . . . . . . . . . . . . . . . . . . . . . . . . . . . . 1-1
2. MERCURY IN THE ENVIRONMENT . . . . . . . . . . . . . . . . . . . . . . . . . . . . . . . . . . . . . . . . . . 2-1
3. FINDINGS OF THE MERCURY STUDY REPORT TO CONGRESS. . . . . . . . . . . . . . . . . . 3-1Sources Contributing to Mercury in the Environment. . . . . . . . . . . . . . . . . . . . . . . . . . . . . . . . 3-1Inventory Approach and Uncertainties. . . . . . . . . . . . . . . . . . . . . . . . . . . . . . . . . . . . . . . . . . . . 3-4Anthropogenic Emissions Summary. . . . . . . . . . . . . . . . . . . . . . . . . . . . . . . . . . . . . . . . . . . . . 3-5Trends in Mercury Emissions. . . . . . . . . . . . . . . . . . . . . . . . . . . . . . . . . . . . . . . . . . . . . . . . . . . 3-5Trends in Mercury Use. . . . . . . . . . . . . . . . . . . . . . . . . . . . . . . . . . . . . . . . . . . . . . . . . . . . . . . . 3-7Assessment Approach for Fate and Transport of Mercury. . . . . . . . . . . . . . . . . . . . . . . . . . . . 3-8Assessment of Exposure. . . . . . . . . . . . . . . . . . . . . . . . . . . . . . . . . . . . . . . . . . . . . . . . . . . . . .3-20Human Health Effects of Methylmercury. . . . . . . . . . . . . . . . . . . . . . . . . . . . . . . . . . . . . . . .3-22How Much Methylmercury is Harmful to Humans?. . . . . . . . . . . . . . . . . . . . . . . . . . . . . . . .3-25Levels of Methylmercury Exposure Addressed by the U.S. Food and Drug Administration, World Health Organization and State Recommendations. . . . . . . . . . . . . . . . . . . . . . . . . . . .3-29Characterization of Risk to Human Populations. . . . . . . . . . . . . . . . . . . . . . . . . . . . . . . . . . .3-31How Much Methylmercury Exposure is Harmful to Wildlife and What Are the Effects? . . . 3-43
4. MANAGEMENT ALTERNATIVES . . . . . . . . . . . . . . . . . . . . . . . . . . . . . . . . . . . . . . . . . . . . 4-1Possible Control Strategies. . . . . . . . . . . . . . . . . . . . . . . . . . . . . . . . . . . . . . . . . . . . . . . . . . . . . 4-1Cost of Controls. . . . . . . . . . . . . . . . . . . . . . . . . . . . . . . . . . . . . . . . . . . . . . . . . . . . . . . . . . . . . 4-8Ongoing U.S. EPA Activities to Reduce Mercury in the Environment. . . . . . . . . . . . . . . . . .4-10International Activities. . . . . . . . . . . . . . . . . . . . . . . . . . . . . . . . . . . . . . . . . . . . . . . . . . . . . . .4-14
5. RESEARCH NEEDS. . . . . . . . . . . . . . . . . . . . . . . . . . . . . . . . . . . . . . . . . . . . . . . . . . . . . . . . . 5-1
ii
U.S. EPA AUTHORS
Principal Authors:
Martha H. KeatingOffice of Air Quality Planning and StandardsResearch Triangle Park, NC
Kathryn R. Mahaffey, Ph.D.National Center for Environmental Assessment-WashingtonOffice of Research and DevelopmentWashington, DC
Rita Schoeny, Ph.D.Office of WaterWashington, DC
Glenn E. RiceNational Center for Environmental Assessment-CincinnatiOffice of Research and DevelopmentCincinnati, OH
O. Russell BullockAtmospheric Sciences Modeling DivisionAir Resources LaboratoryNational Oceanic and Atmospheric AdministrationResearch Triangle Park, NCon assignment to the U.S. EPA National Exposure Research Laboratory
Robert B. Ambrose, Jr., P.E.Ecosystems Research DivisionNational Exposure Research LaboratoryAthens, GA
Jeff SwartoutNational Center for Environmental Assessment-CincinnatiOffice of Research and DevelopmentCincinnati, OH
John W. Nichols, Ph.D.Mid-Continent Ecology DivisionOffice of Research and DevelopmentDuluth, MN
SCIENTIFIC PEER REVIEWERS
iii
Dr. William J. Adams* Policy Office, Washington, DCKennecott Utah Corporation
Dr. Brian J. Allee Agency for Toxic Substances and DiseaseHarza Northwest, Incorporated Registry
Dr. Thomas D. Atkeson Dr. Rufus ChaneyFlorida Department of Environmental U.S. Department of AgricultureProtection
Dr. Donald G. Barnes* Lawrence Berkeley National LaboratoryU.S. EPA Science Advisory Board
Dr. Steven M. Bartell Medical College of WisconsinSENES Oak Ridge, Inc.
Dr. David Bellinger* University of CincinnatiChildren’s Hospital, Boston
Dr. Nicolas Bloom* Great Lakes Natural Resource CenterFrontier Geosciences, Inc. National Wildlife Federation for the
Dr. Mike BolgerU.S. Food and Drug Administration Dr. Lawrence J. Fischer*
Dr. Peter BotrosU.S. Department of Energy Dr. William F. FitzgeraldFederal Energy Technology Center University of Connecticut
Thomas D. BrownU.S. Department of Energy A. Robert Flaak*Federal Energy Technology Center U.S. EPA Science Advisory Board
Dr. Dallas Burtraw* Dr. Katharine FlegalResources for the Future National Center for Health Statistics
Dr. Thomas Burbacher* Dr. Bruce A. Fowler*University of Washington University of Maryland at BaltimoreSeattle
Dr. James P. Butler Biosupport, Inc.University of ChicagoArgonne National Laboratory Dr. Cynthia C. Gilmour*
Dr. Elizabeth CampbellU.S. Department of Energy Dr. Robert Goyer
Dr. Rick Canady
Dr. Joan Daisey*
Dr. John A. Dellinger*
Dr. Kim N. Dietrich*
Dr. Tim Eder
States of Michigan and Ohio
Michigan State University
Avery Point
Dr. Steven G. Gilbert*
The Academy of Natural Sciences

SCIENTIFIC PEER REVIEWERS (continued)
iv
National Institute of Environmental Health The Johns Hopkins UniversitySciences
Dr. George Gray National Center for Health StatisticsHarvard School of Public Health
Dr. Terry Haines University of CaliforniaNational Biological Service Berkeley
Dr. Gary Heinz* Dr. Malcolm MeaburnPatuxent Wildlife Research Center National Oceanic and Atmospheric
Joann L. Held U.S. Department of CommerceNew Jersey Department of EnvironmentalProtection & Energy Dr. Michael W. Meyer*
Dr. Robert E. Hueter*Mote Marine Laboratory Dr. Maria Morandi*
Dr. Harold E. B. Humphrey*Michigan Department of Community Health Dr. Paul Mushak
Dr. James P. Hurley*University of Wisconsin Dr. Christopher Newland*Madison Auburn University
Dr. Joseph L. Jacobson* Harvey NessWayne State University U.S. Department of Energy
Dr. Gerald J. KeelerUniversity of Michigan Dr. Jerome O. Nriagu*Ann Arbor The University of Michigan
Dr. Ronald J. Kendall*Clemson University William O’Dowd
Dr. Lynda P. Knobeloch* Federal Energy Technology CenterWisconsin Division of Health
Dr. Leonard Levin University of FloridaElectric Power Research Institute Gainesville
Dr. Steven E. Lindberg* Dr. Jozef M. PacynaOak Ridge National Laboratory Norwegian Institute for Air Research
Dr. Genevieve M. Matanoski* Dr. Ruth Patterson
Dr. Margaret McDowell
Dr. Thomas McKone*
Administration
Wisconsin Department of Natural Resources
University of Texas Science Center at Houston
PB Associates
Federal Energy Technology Center
Ann Arbor
U.S. Department of Energy
Dr. W. Steven Otwell*
SCIENTIFIC PEER REVIEWERS (continued)
v
Cancer Prevention Research Program Dr. Valerie Thomas*Fred Gutchinson Cancer Research Center Princeton University
Dr. Donald Porcella Dr. M. Anthony VerityElectric Power Research Institute University of California
Dr. Deborah C. Rice*Toxicology Research Center
Samuel R. Rondberg*U.S. EPA Science Advisory Board
Charles SchmidtU.S. Department of Energy
Dr. Pamela ShubatMinnesota Department of Health
Dr. Ellen K. Silbergeld*University of MarylandBaltimore
Dr. Howard A. Simonin*NYSDEC Aquatic Toxicant Research Unit
Dennis SmithU.S. Department of EnergyFederal Energy Technology Center
Dr. Ann Spacie*Purdue University
Dr. Alan H. SternNew Jersey Department of EnvironmentalProtection & Energy
Dr. David G. Strimaitis*Earth Tech
Dr. Edward B. SwainMinnesota Pollution Control Agency
Los Angeles
*With U.S. EPA’s Science Advisory Board, Mercury Review Subcommitte

vi
WORK GROUP AND U.S. EPA REVIEWERS
Core Work Group Reviewers: U.S. EPA Reviewers:
Dan Axelrad, U.S. EPA Robert Beliles, Ph.D., D.A.B.T.Office of Policy, Planning and Evaluation National Center for Environmental Assessment
Angela Bandemehr, U.S. EPARegion 5 Eletha Brady-Roberts
Jim Darr, U.S. EPA Cincinnati, OHOffice of Pollution Prevention and ToxicSubstances Dianne M. Byrne
Thomas Gentile, State of New York Research Triangle Park, NCDepartment of Environmental Conservation
Arnie Kuzmack, U.S. EPA National Center for Environmental AssessmentOffice of Water Research Triangle Park, NC
David Layland, U.S. EPA Matthew LorberOffice of Solid Waste and Emergency Response National Center for Environmental Assessment
Karen Levy, U.S. EPAOffice of Policy Analysis and Review Susan Braen Norton
Steve Levy, U.S. EPA Washington, DCOffice of Solid Waste and Emergency Response
Lorraine Randecker, U.S. EPA National Center for Environmental AssessmentOffice of Pollution Prevention and Toxic Cincinnati, OHSubstances
Joy Taylor, State of MichiganDepartment of Natural Resources
Washington, DC
National Center for Environmental Assessment
Office of Air Quality Planning and Standards
Annie M. Jarabek
Washington, DC
National Center for Environmental Assessment
Terry Harvey, D.V.M.
vii
LIST OF TABLES AND FIGURES
PageTables
2-1 Range of Mean Mercury Concentrations (ppm) for Major Fish Species in the U.S. in 36 States and DC, 1990-1995. . . . . . . . . . . . . . . . . . . . . . . . . . . . . . . . . . . . . . . . . . . . . . . . . . . 2-7
2-2 Mercury Concentration in Bivalve Mollusks from Mussel Watch Sites (1986-1993). . . . . . . . 2-82-3 Nationwide Geometric Mean Concentrations of Mercury in Bivalve Mollusks (1986-1993) . . 2-82-4 Trends in Mercury Concentrations in Bivalve Mollusks (1986-1993). . . . . . . . . . . . . . . . . . . 2-93-1 Best Point Estimates of National Mercury Emission Rates by Category. . . . . . . . . . . . . . . . . . 3-63-2 Models Used in the Report to Congress. . . . . . . . . . . . . . . . . . . . . . . . . . . . . . . . . . . . . . . . . . . 3-93-3 Modeled Mercury Mass Budget in Metric Tons for 1994-1995 Using the Specified Speciation
Profiles and 1989 Meteorology. . . . . . . . . . . . . . . . . . . . . . . . . . . . . . . . . . . . . . . . . . . . . . . .3-143-4 WHO Data on Mercury in Hair. . . . . . . . . . . . . . . . . . . . . . . . . . . . . . . . . . . . . . . . . . . . . . . .3-303-5 Body Weights and Fish Consumption Values Used in Exposure Modeling. . . . . . . . . . . . . .3-333-6 Mercury Concentrations in the Top Ten Types of Fish/Shellfish Consumed by U.S.
Residents. . . . . . . . . . . . . . . . . . . . . . . . . . . . . . . . . . . . . . . . . . . . . . . . . . . . . . . . . . . . . . . . . .3-353-7 Wildlife Criteria for Mercury. . . . . . . . . . . . . . . . . . . . . . . . . . . . . . . . . . . . . . . . . . . . . . . . . .3-444-1 Summary of Mercury Control Techniques for Selected Source Types. . . . . . . . . . . . . . . . . . . 4-24-2 Potential Mercury Emission Reductions and Costs for Selected Source Categories. . . . . . . . . 4-9
Figures
2-1 The Global Mercury Cycle. . . . . . . . . . . . . . . . . . . . . . . . . . . . . . . . . . . . . . . . . . . . . . . . . . . . . 2-22-2 Cycling of Mercury in Freshwater Lakes. . . . . . . . . . . . . . . . . . . . . . . . . . . . . . . . . . . . . . . . . . 2-32-3 Example Aquatic Food Web. . . . . . . . . . . . . . . . . . . . . . . . . . . . . . . . . . . . . . . . . . . . . . . . . . . . 2-43-1 Comparison of Estimated Current and Pre-Industrial Mercury Budgets and Fluxes. . . . . . . . . 3-23-2 Fate, Transport and Exposure Modeling Conducted in the Combined ISC-3 and RELMAP
Local Impact Analysis. . . . . . . . . . . . . . . . . . . . . . . . . . . . . . . . . . . . . . . . . . . . . . . . . . . . . . .3-113-3 Total Simulated Wet + Dry Deposition of Mercury in All Forms. . . . . . . . . . . . . . . . . . . . . .3-123-4 Distribution of Mercury Concentrations in U.S. EPA-Sampled Fish Tissue Throughout the
U.S. . . . . . . . . . . . . . . . . . . . . . . . . . . . . . . . . . . . . . . . . . . . . . . . . . . . . . . . . . . . . . . . . . . . . . .3-343-5 Distribution of Fish Consumption Rates of Various Populations. . . . . . . . . . . . . . . . . . . . . .3-38
viii
LIST OF SYMBOLS, UNITS AND ACRONYMS
ATSDR Agency for Toxic Substances and Disease RegistryBAF Bioaccumulation factorbw Body weightCAA Clean Air Act as Amended in 1990CH Hg Monomethylmercury3
(CH ) Hg Dimethylmercury3 2
CSFII U.S. Department of Agriculture's Continuing Surveys of Individual FoodConsumption
H S Hydrogen sulfide2
Hg Elemental mercury0
Hg(II) Mercuric ion (divalent mercury)HgS Mercuric sulfideU.S. EPA U.S. Environmental Protection AgencyU.S. FDA U.S. Food and Drug AdministrationGACT Generally available control technologyg GramHAP Hazardous Air Pollutantkg Kilogram (1,000 grams)km Kilometer (1,000 meters)MACT Maximum achievable control technologyMg Megagram (one million grams or one metric ton)NHANES National Health and Nutrition Examination SurveyORD U.S. EPA Office of Research and DevelopmentPBPK Physiologically-based pharmacokinetic pg Picogram (10 gram)-12
ppm Part per millionRfC Reference concentrationRfD Reference doseµg Microgram (10 gram)-6
WC Wildlife criterionWHO World Health OrganizationWHO/IPCS World Health Organization's International Programme for Chemical Safetyyr Year

O-1
OVERVIEW
This Mercury Study is a Report to Congress prepared by the U.S. Environmental ProtectionAgency. It fulfills the requirements of section 112(n)(1)(B) of the Clear Air Act, as amended in 1990. The Report provides an assessment of the magnitude of U.S. mercury emissions by source, the health andenvironmental implications of those emissions, and the availability and cost of control technologies. Asthe state-of-the-science for mercury is continuously and rapidly evolving, this Report should be viewedas a “snapshot” of our current understanding of mercury. This Report does not quantify the risk frommercury exposure because of scientific uncertainty in a number of important areas. The Report identifiesareas where further research is needed to provide a quantitative risk assessment.
Mercury cycles in the environment as a result of natural and human (anthropogenic) activities. The amount of mercury mobilized and released into the biosphere has increased since the beginning ofthe industrial age. Most of the mercury in the atmosphere is elemental mercury vapor, which circulatesin the atmosphere for up to a year, and hence can be widely dispersed and transported thousands of milesfrom likely sources of emission. Most of the mercury in water, soil, sediments, or plants and animals isin the form of inorganic mercury salts and organic forms of mercury (e.g., methylmercury). Theinorganic form of mercury, when either bound to airborne particles or in a gaseous form, is readilyremoved from the atmosphere by precipitation and is also dry deposited. Wet deposition is the primarymechanism for transporting mercury from the atmosphere to surface waters and land. Even after itdeposits, mercury commonly is emitted back to the atmosphere either as a gas or associated withparticles, to be re-deposited elsewhere. As it cycles between the atmosphere, land, and water, mercuryundergoes a series of complex chemical and physical transformations, many of which are not completelyunderstood.
Mercury accumulates most efficiently in the aquatic food web. Predatory organisms at the top ofthe food web generally have higher mercury concentrations. Nearly all of the mercury that accumulatesin fish tissue is methylmercury. Inorganic mercury, which is less efficiently absorbed and more readilyeliminated from the body than methylmercury, does not tend to bioaccumulate.
Mercury Emissions and Deposition in the U.S.
The best point estimate of annual anthropogenic U.S. emissions of mercury in l994-1995 is 158tons. Roughly 87 percent of these emissions are from combustion sources, including waste and fossilfuel combustion. Contemporary anthropogenic emissions are only one part of the mercury cycle. Releases from human activities today are adding to the mercury reservoirs that already exist in land,water, and air, both naturally and as a result of previous human activities. The flux of mercury from theatmosphere to land or water at any one location is comprised of contributions from the natural globalcycle including re-emissions from the oceans, regional sources, and local sources. Local sources couldalso include direct water discharges in addition to air emissions. Past uses of mercury, such as fungicideapplication to crops are also a component of the present mercury burden in the environment. Oneestimate of the total annual global input to the atmosphere from all sources including natural,anthropogenic, and oceanic emissions is 5,500 tons. Based on this, U.S. sources are estimated to havecontributed about 3 percent of the 5,500 tons in 1995.
A computer simulation of long-range transport of mercury suggests that about one-third (~ 52tons) of U.S. anthropogenic emissions are deposited, through wet and dry deposition, within the lower 48States. The remaining two-thirds (~ 107 tons) is transported outside of U.S. borders where it diffusesinto the global reservoir. In addition, the computer simulation suggests that another 35 tons of mercuryfrom the global reservoir is deposited for a total deposition of roughly 87 tons. Although this type of
O-2
modeling is uncertain, the simulation suggests that about three times as much mercury is being added tothe global reservoir from U.S. sources as is being deposited from it. What is not uncertain is thatadditional emissions to air will contribute to levels in the global reservoir, and concomitant deposition towater bodies.
The highest deposition rates from anthropogenic and global contributions for mercury arepredicted to occur in the southern Great Lakes and Ohio River valley, the Northeast and scattered areasin the South, with the most elevated deposition in the Miami and Tampa areas. The location of sources,the chemical species of mercury emitted and the climate and meterology are key factors in mercurydeposition. Humid locations have higher deposition than arid locations.
Public Health Impacts
Epidemics of mercury poisoning following high-dose exposures to methylmercury in Japan andIraq demonstrated that neurotoxicity is the health effect of greatest concern when methylmercuryexposure occurs to the developing fetus. Dietary methylmercury is almost completely absorbed into theblood and distributed to all tissues including the brain; it also readily passes through the placenta to thefetus and fetal brain. The reference dose (RfD) is an amount of methylmercury, which when ingesteddaily over a lifetime is anticipated to be without adverse health effects to humans, including sensitivesubpopulations. At the RfD or below, exposures are expected to be safe. The risk following exposuresabove the RfD is uncertain, but risk increases as exposures to methylmercury increase.
Extrapolating from the high-dose exposures that occurred in the Iraq incident, the U.S. EPAderived a RfD for methylmercury of 0.1 µg/kg bw/day. While the U.S. EPA has been advised byscientific reviewers to employ this RfD for this analysis, new data are emerging. Currently ongoing aretwo large epidemiology studies in the Seychelle Islands and in the Faroe Islands that were designed toevaluate childhood development and neurotoxicity in relation to fetal exposures to methylmercury infish-consuming populations. Because of various limitations and uncertainties in all of the available data,the U.S. EPA and other Federal agencies intend to participate in an interagency review of the human dataon methylmercury, including the most recent studies from the Seychelle Islands and the Faroe Islands. The purposes of this review are to refine the estimates of the level of exposure to mercury associatedwith subtle neurological endpoints and to further consensus between all of the Federal agencies. Afterthis process, the U.S. EPA will determine if a change in the RfD for methylmercury is warranted.
Fish consumption dominates the pathway for human and wildlife exposure to methylmercury. This study supports a plausible link between anthropogenic releases of mercury from industrial andcombustion sources in the United States and methylmercury in fish. However, these fish methylmercuryconcentrations also result from existing background concentrations of mercury (which may consist ofmercury from natural sources, as well as mercury which has been re-emitted from the oceans or soils)and deposition from the global reservoir (which includes mercury emitted by other countries). Given thecurrent scientific understanding of the environmental fate and transport of this element, it is not possibleto quantify how much of the methylmercury in fish consumed by the U.S. population is contributed byU.S. emissions relative to other sources of mercury (such as natural sources and re-emissions from theglobal pool). As a result, it cannot be assumed that a change in total mercury emissions will be linearlyrelated to any resulting change in methylmercury in fish, nor over what time period these changes wouldoccur. This is an area of ongoing study.
Critical elements in estimating methylmercury exposure and risk from fish consumption includethe species of fish consumed, the concentrations of methylmercury in the fish, the quantity of fishconsumed, and how frequently fish is consumed. The typical U.S. consumer eating fish from restaurants
O-3
and grocery stores is not in danger of consuming harmful levels of methylmercury from fish and is notadvised to limit fish consumption. The levels of methylmercury found in the most frequently consumedcommercial fish are low, especially compared to levels that might be found in some non-commercial fishfrom fresh water bodies that have been affected by mercury pollution. While most U.S. consumers neednot be concerned about their exposure to methylmercury, some exposures may be of concern. Thosewho regularly and frequently consume large amounts of fish -- either marine species that typically havemuch higher levels of methylmercury than the rest of seafood, or freshwater fish that have been affectedby mercury pollution -- are more highly exposed. Because the developing fetus may be the mostsensitive to the effects from methylmercury, women of child-bearing age are regarded as the populationof greatest interest. In this Report, an analysis of dietary surveys led the U.S. EPA to conclude thatbetween 1 and 3 percent of women of child-bearing age (i.e., between the ages of 15 and 44) eatsufficient amounts of fish to be at risk from methylmercury exposure, depending on the methylmercuryconcentrations in the fish. These consumers should be aware of the Food and Drug Administration andState fish advisories that suggest limiting the consumption of contaminated fish. Advisories in theUnited States have been issued by 39 states and some Tribes, warning against consumption of certainspecies of fish contaminated with methylmercury.
To the extent that concern is focused on high-end fish and seafood consumers, research is neededon the actual consumption patterns and estimated methylmercury exposure of this subpopulation. Inaddition, the findings from such research should be validated by analysis of hair samples from arepresentative sample of members of this subpopulation.
Environmental Impacts
The pattern of mercury deposition nationwide influences which eco-regions and eco-systems willbe more highly exposed. Piscivorous (fish-eating) birds and mammals are more highly exposed tomercury than any other known component of aquatic ecosystems. Adverse effects of mercury on fish,birds and mammals include death, reduced reproductive success, impaired growth and development, andbehavioral abnormalities.
Mercury contamination has been documented in the endangered Florida panther and the woodstork, as well as populations of loons, eagles, and furbearers such as mink and otter. These species are athigh risk of mercury exposure and effects because they either are piscivores or eat piscivores. Concentrations of mercury in the tissues of wildlife species have been reported at levels associated withadverse health effects in laboratory studies with the same species. However, field data are insufficient toconclude whether piscivorous wading birds or mammals have suffered adverse effects due to airbornemercury emissions. Modeling analyses conducted for this Report suggest that it is probable thatindividuals of some highly exposed wildlife subpopulations are experiencing adverse effects due toairborne mercury emissions.
Mercury Control Technologies
Mercury is widely used in industry because of its diverse properties and serves as a process orproduct ingredient in several industrial sectors, however, industrial demand for mercury has declined byabout 75 percent between l988 and l996, due largely to the elimination of mercury additives in paints andpesticides and the reduction of mercury in batteries. Most of the emissions of mercury are producedwhen waste or fuel containing mercury is burned. The U.S. EPA has already finalized emission limits formunicipal waste combustors and medical waste incinerators. As a result, by the year 2000, emissionsfrom these categories will decline at least 90 percent from 1995 levels. In addition, mercury emissionlimits have been proposed for hazardous waste incinerators.
O-4
The largest remaining identified source of mercury emissions are coal-fired utility boilers. Although a number of mercury control technologies are being evaluated for utility boilers, most are stillin the research stages, making it difficult to predict final cost-effectiveness as well as the time required toscale-up and commercialize the technologies. Because the chemical species of mercury emitted fromboilers varies from plant to plant, there is no single control technology that removes all forms of mercury. There remains a wide variation in the end costs of control measures for utilities and the possible impactof such costs on utilities. Preliminary estimates of national control costs for utility boilers (based on pilotscale data) are in the billions of dollars per year. Ongoing research, as well as research needs related tomercury controls for utilities, are described in the document.
Cost-effective opportunities to deal with mercury during the product life-cycle, rather than just atthe point of disposal, need to be pursued. A balanced strategy which integrates end-of-pipe controltechnologies with material substitution and separation, design-for-environment, and fundamental processchange approaches is needed. In addition, international efforts to reduce mercury emissions as well asgreenhouse gases will play an important role in reducing inputs to the global reservoir of mercury.

1-1
1. THE MERCURY STUDY REPORT TO CONGRESS
The Clean Air Act Amendments of 1990 (CAA) established section 112(n)(1)(B) which requiresthe United States Environmental Protection Agency (U.S. EPA) to study the impacts of mercury airpollution. In particular, section 112(n)(1)(B) specifies the following:
The Administrator shall conduct, and transmit to the Congress not later than 4 years afterthe date of enactment of the Clean Air Act Amendments of 1990, a study of mercuryemissions from electric utility steam generating units, municipal waste combustion units,and other sources, including area sources. Such study shall consider the rate and mass ofsuch emissions, the health and environmental effects of such emissions, technologieswhich are available to control such emissions, and the costs of such technologies.
The U.S. EPA designed the Mercury Study to address many different (but linked) types ofinformation:
� data on type, sources, and trends in emissions;
� evaluation of the atmospheric transport of mercury to locations distant from emissionsources;
� assessment of potential impacts of mercury emissions close to the source;
� identification of major pathways of exposure to humans and non-human biota;
� identification of the types of human health consequences of mercury exposure and theamount of exposure likely to result in adverse effects;
� evaluation of mercury exposure consequences for ecosystems and for non-humanspecies;
� identification of populations especially at risk from mercury exposure due to innatesensitivity or high exposure; and
� estimates of control technology efficiencies and costs.
The Report used the above types of information to assess the impact of emissions to air ofmercury from a variety of sources. This assessment included judgments as to the potential hazard tohumans and wildlife of methylmercury exposure which (as is described in succeeding sections) is largelythrough the consumption of contaminated fish.
There was no attempt in this Report to do a comparative risk/benefit analysis of fish as animportant source of protein and calories in the diet of U.S. populations. Such an analysis would bebeyond the scope of the CAA mandate. As emphasized in succeeding sections, the typical U.S.consumer of fish is not in danger of consuming harmful levels of methylmercury and is not beingadvised to reduce fish consumption.

1-2
This Mercury Study Report to Congress fulfills the mandate of section 112(n)(1)(B). The Reportis in eight volumes:
� Volume I: Executive Summary� Volume II: An Inventory of Anthropogenic Mercury Emissions in the United States� Volume III: Fate and Transport of Mercury in the Environment� Volume IV: An Assessment of Exposure to Mercury in the United States� Volume V: Health Effects of Mercury and Mercury Compounds� Volume VI: An Ecological Assessment for Anthropogenic Mercury Emissions in the
United States� Volume VII: Characterization of Human Health and Wildlife Risks from Mercury
Exposure in the United States� Volume VIII: An Evaluation of Mercury Control Technologies and Costs.
The various analyses documented in this Report were designed and conducted in accordancewith accepted guidelines and procedures. For example, the human health risk assessment performed forthis Report follows published Guidelines for Risk Assessment (including guidelines on ExposureAssessment, Developmental Toxicity, Carcinogenicity and Germ Cell Mutagenicity) and uses establishedmethodologies for quantitative assessment of general systemic toxicity (e.g., in the calculation ofreference doses (RfDs) and reference concentrations (RfCs)). Moreover, the assessment of ecologicaleffects, presented in Volume VI, follows U.S. EPA's Framework for Ecological Risk Assessment. Criteria values for protection of piscivorous wildlife were developed using the methodology developedfor the Great Lakes Water Quality Initiative.
In 1994, the National Research Council of the National Academy of Sciences, in Science andJudgment in Risk Assessment, recommended several areas in which U.S. EPA could improve its riskassessment and risk characterization practices. These recommendations are listed below along with adescription of how they were implemented in this Report.
� Provide an understanding of the type and magnitude of an adverse effect that a specificchemical or emission could cause under particular circumstances. The Reportcharacterizes both the type and magnitude of health and ecological effects associatedwith airborne emissions of mercury from anthropogenic sources.
� Validate methods and models. All models used for the Report were critiqued byscientific experts and model predictions were compared to measured mercury levelsusing the most appropriate data available.
� Describe the basis for default options. All assumptions are described and justified basedon available data. Where appropriate, exposure models were modified to improveassumptions and to focus on areas of prediction where use of model assumptions is mostjustified.
� Articulate and prioritize data needs. The Report includes a section on Research Needsin each volume.
� Distinguish between variability and uncertainty. The Report provides discussions thatattempt to make these distinctions for the risk results.

1-3
� Perform formal uncertainty analyses. Uncertainty analyses were formally conducted forthe dose-response and exposure assessment steps of the study, and were implicit inweight-of-evidence processes used in the hazard identification step of the human healthrisk assessment and the problem formulation phase of the ecological risk assessment. Uncertainty also was analyzed quantitatively in other components of the study, such asin the calculation of bioaccumulation factors and the RfD for methylmercury.

2-1
2. MERCURY IN THE ENVIRONMENT
As a chemical element, mercury cannot be created or destroyed. The same amount has existedon the planet since the earth was formed. Mercury, however, can cycle in the environment as part ofboth natural and human (anthropogenic) activities. Measured data and modeling results indicate that theamount of mercury mobilized and released into the biosphere has increased since the beginning of theindustrial age.
Several types of emission sources contribute to the total atmospheric loading of mercury. Oncein the air, mercury can be widely dispersed and transported thousands of miles from likely emissionsources. The distance of this transport and eventual deposition depends on the chemical and physicalform of the mercury emitted. Studies indicate that the residence time of elemental mercury in theatmosphere may be on the order of a year, allowing its distribution over long distances, both regionallyand globally, before being deposited to the earth. The residence time of oxidized mercury compounds inthe atmosphere is uncertain, but is generally believed to be on the order of a few days or less. Even afterit deposits, mercury commonly is emitted back to the atmosphere either as a gas or in association withparticulates to be re-deposited elsewhere. Mercury undergoes a series of complex chemical and physicaltransformations as it cycles among the atmosphere, land, and water. Humans, plants and animals areroutinely exposed to mercury and accumulate it during this cycle, potentially resulting in a variety ofecological and human health impacts.
Properties and Uses of Mercury
Elemental mercury metal is a heavy, silvery-white liquid at typical ambient temperatures andatmospheric pressures. The vapor pressure of mercury metal is strongly dependent on temperature, andit vaporizes readily under ambient conditions. Most of the mercury encountered in the atmosphere iselemental mercury vapor.
Mercury can exist in three oxidation states: Hg (metallic), Hg (mercurous) and Hg0 2+ 2+2
(mercuric). The properties and behavior of mercury depend on the oxidation state. Most of the mercuryin water, soil, sediments, or biota (i.e., all environmental media except the atmosphere) is in the form ofinorganic mercury salts and organic forms of mercury.
Mercury is widely used because of its diverse properties. In very small quantities, mercuryconducts electricity, responds to temperature and pressure changes and forms alloys with almost all othermetals. Mercury serves an important role as a process or product ingredient in several industrial sectors.
In the electrical industry, mercury is used in components such as fluorescent lamps, wiringdevices and switches (e.g., thermostats) and mercuric oxide batteries. Mercury also is used innavigational devices, instruments that measure temperature and pressure and other related uses. It also isa component of dental amalgams used in repairing dental caries (cavities).
In addition to specific products, mercury is used in numerous industrial processes. The largestquantity of mercury used in manufacturing in the U.S. is the production of chlorine and caustic soda bymercury cell chlor-alkali plants. Other processes include amalgamation, use in nuclear reactors, woodprocessing (as an anti-fungal agent), use as a solvent for reactive and precious metals, and use as acatalyst. Mercury compounds are also frequently added as a preservative to many pharmaceuticalproducts.

2-2
The Role of Atmospheric Releases and Processes
A schematic of the most recent conceptualization of the current global mercury cycle is presented inFigure 2-1. As indicated in this figure, mercury is emitted to the atmosphere by a variety of sources,dispersed and transported in the air, deposited to the earth, and stored in or transferred between the land,water, and air.
Figure 2-1The Global Mercury Cycle
Source: Adapted from Mason, R.P., Fitzgerald, W.F., and Morel, M.M. 1994. The Biogeochemical Cycling of ElementalMercury: Anthropogenic Influences. Geochim. Cosmochim. Acta, 58(15):3191-3198.
Mercury deposits on the earth in different ways and at different rates, depending on its physical andchemical form. Mercuric species are subject to much faster atmospheric removal than elemental mercury. Mercuric mercury bound to airborne particles and in a gaseous form is readily scavenged by precipitation andis also dry deposited (that is, deposited in the absence of precipitation). In contrast, elemental mercury vaporhas a strong tendency to remain airborne and is not susceptible to any major process resulting in directdeposition to the earth's surface. Although much uncertainty still exists, several studies indicate that therelative contribution of mercury loadings to land and water from atmospheric deposition can be substantial.
2-3
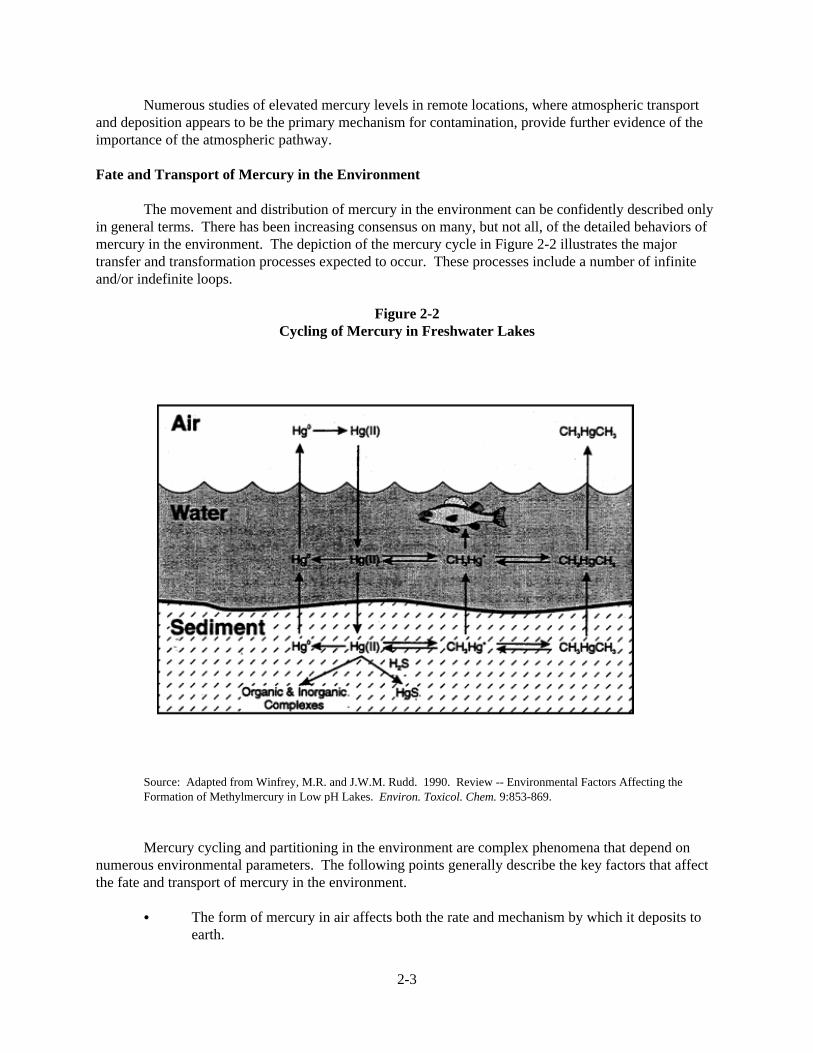
Numerous studies of elevated mercury levels in remote locations, where atmospheric transportand deposition appears to be the primary mechanism for contamination, provide further evidence of theimportance of the atmospheric pathway.
Fate and Transport of Mercury in the Environment
The movement and distribution of mercury in the environment can be confidently described onlyin general terms. There has been increasing consensus on many, but not all, of the detailed behaviors ofmercury in the environment. The depiction of the mercury cycle in Figure 2-2 illustrates the majortransfer and transformation processes expected to occur. These processes include a number of infiniteand/or indefinite loops.
Figure 2-2Cycling of Mercury in Freshwater Lakes
Source: Adapted from Winfrey, M.R. and J.W.M. Rudd. 1990. Review -- Environmental Factors Affecting theFormation of Methylmercury in Low pH Lakes. Environ. Toxicol. Chem. 9:853-869.
Mercury cycling and partitioning in the environment are complex phenomena that depend onnumerous environmental parameters. The following points generally describe the key factors that affectthe fate and transport of mercury in the environment.
� The form of mercury in air affects both the rate and mechanism by which it deposits toearth.

2-4
� Wet deposition apparently is the primary mechanism for transporting mercury from theatmosphere to surface waters and land.
� Once in aquatic systems, mercury can exist in dissolved or particulate forms and canundergo a number of chemical transformations (see Figure 2-2).
� Contaminated sediments at the bottom of surface waters can serve as an importantmercury reservoir, with sediment-bound mercury recycling back into the aquaticecosystem for decades or longer.
� Mercury has a long retention time in soils. As a result, mercury that has accumulated insoils may continue to be released to surface waters and other media for long periods oftime, possibly hundreds of years.
Potential Exposure Pathways
Plants, animals and humans can be exposed to mercury by direct contact with contaminatedenvironmental media or ingestion of mercury-contaminated water and food.
Generally, mercury accumulates up aquatic food chains so that organisms in higher trophiclevels have higher mercury concentrations. An example aquatic food web is shown in Figure 2-3. At thetop trophic levels are piscivores, such as humans, bald eagles, cormorants, herring gulls and other fish-eating species. The larger wildlife species (e.g., bald eagle, otter) can prey on fish that occupy hightrophic levels, such as trout and salmon, which in turn feed on smaller "forage" fish. Smaller piscivorouswildlife (e.g., kingfishers, ospreys) tend to feed on the smaller forage fish, which in turn feed onzooplankton or benthic invertebrates. Zooplankton feed on phytoplankton and the smaller benthicinvertebrates feed on algae and detritus. Thus, mercury is transferred and accumulated through severaltrophic levels.
Figure 2-3Example
Aquatic FoodWeb

2-5
Mercury Methylation and Bioaccumulation
Methylation of mercury is a key step in the entrance of mercury into food chains. Thebiotransformation of inorganic mercury species to methylated organic species in water bodies can occurin the sediment and the water column. All mercury compounds entering an aquatic ecosystem, however,are not methylated; demethylation reactions as well as volatilization of dimethylmercury decrease theamount of methylmercury available in the aquatic environment. There is a large degree of scientificuncertainty regarding the rate at which these reactions take place. There is general scientific agreementhowever that there is significant variability between waterbodies concerning the environmental factorsthat influence the methylation of mercury.
Nearly 100% of the mercury that bioaccumulates in fish tissue is methylated. Numerous factorsin can influence the bioaccumulation of mercury in aquatic biota. These include the acidity of the water(pH), length of the aquatic food chain, temperature and dissolved organic material. Physical andchemical characteristics of a watershed, such as soil type and erosion, affect the amount of mercury thatis transported from soils to water bodies. Interrelationships between these factors are poorly understood,however, and there is no single factor (including pH) that has been correlated with mercurybioaccumulation in all cases examined.
Mercury accumulates in an organism when the rate of uptake exceeds the rate of elimination. Although all forms of mercury can accumulate to some degree, methylmercury accumulates to a greaterextent than other forms of mercury. Inorganic mercury can also be absorbed but is generally taken up ata slower rate and with lower efficiency than is methylmercury. Elimination of methylmercury takesplace very slowly resulting in tissue half-lives (i.e., the time in which half of the mercury in the tissue iseliminated) ranging from months to years. Elimination of methylmercury from fish is so slow that long-term reductions of mercury concentrations in fish are often due mainly to growth of the fish. Bycomparison, other mercury compounds are eliminated relatively quickly resulting in reduced levels ofaccumulation.
Methylmercury production and accumulation in the freshwater ecosystem is an efficient processfor accumulating mercury which can then be ingested by fish-eating (piscivores) birds, animals andpeople. In addition, methylmercury generally comprises a relatively greater percentage of the totalmercury content at higher trophic levels. Accordingly, mercury exposure and accumulation is ofparticular concern for animals at the highest trophic levels in aquatic food webs and for animals andhumans that feed on these organisms.
Human Exposure Pathways and Health Effects
Humans are most likely to be exposed to methylmercury through fish consumption. Exposuremay occur through other routes as well (e.g., the ingestion of methylmercury-contaminated drinkingwater and food sources other than fish, and dermal uptake through soil and water); however, the fishconsumption pathway dominates these other pathways for people who eat fish.
There is a great deal of variability among individuals who eat fish with respect to food sourcesand fish consumption rates. As a result, there is a great deal of variability in exposure to methylmercuryin these populations. The presence of methylmercury in fish is, in part, the result of anthropogenicmercury releases from industrial and combustion sources. As a consequence of human consumption ofthe affected fish, there is an incremental increase in exposure to methylmercury.
2-6
Mercury is a known human toxicant. Clinically observable neurotoxicity has been observedfollowing exposure to high amounts of mercury (for example, �Mad Hatters’ Disease�). Consumption ofhighly contaminated food also has produced overt mercury neurotoxicity. Studies in humans and inexperimental animals are described in Volume V of the Mercury Study Report to Congress. Generally,the most subtle indicators of methylmercury toxicity are neurological changes. The neurotoxic effectsinclude subtle decrements in motor skills and sensory ability at comparatively low doses to tremors,inability to walk, convulsions and death at extremely high exposures.
Environmental Impacts
Adverse effects of mercury on fish include death, reduced reproductive success, impaired growthand development and behavioral abnormalities. Exposure to mercury can also cause adverse effects inplants, birds and mammals. Reproductive effects are the primary concern for mercury poisoning and canoccur at dietary concentrations well below those which cause overt toxicity. Effects of mercury on birdsand mammals include death, reduced reproductive success, impaired growth and development andbehavioral abnormalities. Sublethal effects of mercury on birds and mammals include liver damage,kidney damage, and neurobehavioral effects. Effects of mercury on plants include death and sublethaleffects. Sublethal effects on aquatic plants can include plant senescence, growth inhibition anddecreased chlorophyll content. Sublethal effects on terrestrial plants can include decreased growth, leafinjury, root damage, and inhibited root growth and function.
Concentrations of mercury in the tissues of wildlife species have been reported at levelsassociated with adverse effects. Toxic effects on piscivorous avian and mammalian wildlife due to theconsumption of contaminated fish have been observed in association with point source releases ofmercury to the environment. However, field data are insufficient to conclude whether wildlife hassuffered adverse effects due to airborne mercury.
Mercury Levels in the United States
Based on 1996 data compiled by U.S. EPA’s Office of Water, advisories have been issued in 39states that warn against the consumption of certain amounts and species of fish that are contaminatedwith mercury. Ten states have statewide advisories (i.e., advisories posted on every freshwater body inthat state). These advisories are based on the results of sampling surveys that measure mercury levels inrepresentative fish species collected from water bodies. The advisories are intended for people who catchand eat fish from those waterbodies.
Table 2-1 presents the range of average mercury concentrations in parts per million (ppm) inmajor fish species throughout the U.S. (i.e., these are ranges of averages values measured by Stateagencies across the U.S., not ranges of individual sample values used to calculate the means). Thisinformation is based on data which represent the results of fish samples from the District of Columbiaand 36 states.
The fish samples were analyzed during the period from 1990 through 1995. The three species ofbottom feeders categorized in the table are carp, white sucker and channel catfish. Largemouth bass,smallmouth bass, walleye, brown trout and northern pike represent the major predatory fish species.

O’Connor, T. P., and B. Beliaeff (1995). Recent Trends in Coastal Environmental Quality: Results from the Mussel Watch1
Project. 1986 to 1993. U.S. Department of Commerce, National Oceanic and Atmospheric Administration, National OceanService, Office of Ocean Resources, Conservation and Assessment, Silver Spring, MD.
2-7
Table 2-1Range of Average Mercury Concentrations (ppm) for Major Fish Species in the U.S. in 36 States
and DC, 1990-1995
Carp 0.061 -0.250 White sucker 0.042 - 0.456
Channel catfish 0.010 - 0.890 Largemouth bass 0.101 - 1.369
Smallmouth bass 0.094 - 0.766 Walleye 0.040 - 1.383
Brown trout 0.037 - 0.418 Northern pike 0.084 - 0.531
Fish sold in commerce are under the jurisdiction of the FDA which issues action levels forconcentration of mercury in fish and shellfish. The current FDA action level is 1 ppm mercury based on aconsideration of health impacts. As illustrated in the table above, freshwater fish can have mercurylevels which exceed the U.S. FDA action limit of 1 ppm. The concentration of methylmercury incommercially important marine species is, on the average, close to ten times lower than the FDA actionlevel.
Mercury levels in marine fish have been monitored for at least 20 years by the National MarineFisheries Service. The data in marine fish have shown mercury levels over this time to be relativelyconstant in various species. Comparable trends data for freshwater fish do not exist, although there aredata for coastal and estuarine sites.
The following information on mercury levels in coastal and estuarine bivalve mollusks (musselsand oysters) is taken from the Mussel Watch Project, which is part of the National Oceanic andAtmospheric Administration’s (NOAA’s) National Status and Trends (NS&T) Program. The MusselWatch Project is a large-scale monitoring project that measures concentrations of organic and trace metalcontaminants in fresh whole soft-parts of mussels and oysters at over 240 coastal and estuarine sites. These data, which are available for 1986-1993, provide important information about spatial and temporaltrends in mercury contamination.
These data are summarized on a regional basis in Table 2-2. Although statistical evaluation hasnot been conducted, median concentrations along the North Atlantic, Eastern Gulf, and Pacific coasts(0.15, 0.14, and 0.11 ppm dry weight, respectively) appear to be higher relative to those along the MiddleAtlantic, South Atlantic, and Western Gulf coasts (0.06, 0.09, and 0.08 ppm dry weight, respectively) . 1
The highest mercury concentrations measured exceed 1.0 ppm dry weight at sites along the Western Gulfand Pacific coasts (1.80 and 1.01 ppm dry weight, respectively) . 1
For the purpose of temporal analysis, annual Mussel Watch data on mercury concentrations inbivalve mollusks at specific sites have been aggregated to national geometric means . The national1
means, which are shown in Table 2-3, do not show any temporal trend in mercury concentrations inmussels and oysters for the period 1986-1993.

2-8
Table 2-2Mercury Concentration in Bivalve Mollusks from Mussel Watch Sites (1986-1993)
Region States Range ConcentrationConcentration Median
(ppm-dry weight) (ppm-dry weight)
North Atlantic ME, MA , RI, CT, NY, NJ 0.005-0.72 0.15
Middle Atlantic DE, MD, VA 0.003-0.33 0.06
South Atlantic NC, SC, GA, FL (east coast) 0.012-0.98 0.09
Eastern Gulf of Mexico FL (west coast), AL, MS 0.005-0.72 0.14
Western Gulf of Mexico LA, TX 0.002-1.80 0.08
Pacific CA, OR, WA, HI, AK 0.002-1.01 0.11
Table 2-3Nationwide Geometric Mean Concentrations of Mercury in Bivalve Mollusks (1986-1993)
1986 1987 1988 1989 1990 1991 1992 1993
Mean Mercury Concentration 0.11 0.11 0.11 0.12 0.09 0.11 0.11 0.12(ppm-dry weight)
Temporal trend analysis was also conducted on a site-by-site basis for 154 Mussel Watch sitesthat had data for at least six years during the period 1986-1993 (O’Conner and Beliaeff 1995). Sevensites exhibited an increasing trend in mercury concentrations, and eight sites exhibited a decreasing trendin mercury concentrations, with 95% statistical confidence. The sites with increasing and decreasingtrends are shown in Table 2-4. Many of these sites occur in areas which are heavily industrialized. It isprobable that there are point source discharges to these estuaries. The contribution of mercury via airdeposition to these sites is unclear.

2-9
Table 2-4Trends in Mercury Concentrations in Bivalve Mollusks (1986-1993)
Site Name State
Increasing Trend
Mobile Bay - Hollingers Island Channel AL
Lake Borgne - Malheureux Point LA
Galveston Bay - Confederate Reef TX
Point Loma - Lighthouse CA
San Francisco Bay - Emeryville CA
Point Arena - Lighthouse CA
Crescent - Point St. George CA
Decreasing Trend
Charlotte Harbor - Bord Island FL
Mississippi Sound - Pascagoula Bay MS
Sabine Lake - Blue Buck Point TX
Mission Bay - Ventura Bridge CA
Marina Del Rey - South Jetty CA
Elliott Bay - Four-Mile Rock WA
Sinclair Inlet - Waterman Point WA
Whidbey Island - Possession Point WA
3-1
3. FINDINGS OF THE MERCURY STUDY REPORT TO CONGRESS
Sources Contributing to Mercury in the Environment
In the CAA, Congress directed U.S. EPA to examine sources of mercury emissions, includingelectric utility steam generating units, municipal waste combustion units and other sources, includingarea sources. The U.S. EPA interpreted the phrase "... and other sources..." to mean that acomprehensive examination of mercury sources should be made and to the extent data were available, airemissions should be quantified. Volume II of this Report describes in some detail various sourcecategories that emit mercury. In many cases, a particular source category is identified as having thepotential to emit mercury, but data are not available to assign a quantitative estimate of emissions. TheU.S. EPA's intent was to identify as many sources of mercury emissions to the air as possible and toquantify those emissions where possible.
The mercury emissions data that are available vary considerably in quantity and quality amongdifferent source types. Not surprisingly, the best available data are for source categories that U.S. EPAhas examined in the past or is currently studying.
Sources of mercury emissions in the United States are ubiquitous. To characterize theseemissions, the types are defined in the following way:
� Natural mercury emissions -- the mobilization or release of geologically bound mercuryby natural processes, with mass transfer of mercury to the atmosphere;
� Anthropogenic mercury emissions -- the mobilization or release of geologically boundmercury by human activities, with mass transfer of mercury to the atmosphere; or
� Re-emitted mercury -- the mass transfer of mercury to the atmosphere by biologic andgeologic processes drawing on a pool of mercury that was deposited to the earth'ssurface after initial mobilization by either anthropogenic or natural activities.
Contemporary anthropogenic emissions of mercury are only one component of the globalmercury cycle. Releases from human activities today are adding to the mercury reservoirs that alreadyexist in land, water, and air, both naturally and as a result of previous human activities. Given the presentunderstanding of the global mercury cycle, the flux of mercury from the atmosphere to land or water atany one location is comprised of contributions from the following:
� The natural global cycle,� The global cycle perturbed by human activities,� Regional sources, and� Local sources.
Local sources could also include direct water discharges in addition to air emissions. Past usesof mercury, such as fungicide application to crops are also a component of the present mercury burden inthe environment.
Understanding of the global mercury cycle (shown schematically in Figure 3-1) has improvedsignificantly with continuing study of source emissions, mercury fluxes to the earth's surface, and the

3-2
Figure 3-1Comparison of Estimated Current and Pre-Industrial
Mercury Budgets and Fluxes
Current MercuryBudgets and
Fluxes
Pre-IndustrialMercury Budgets
and Fluxes
Source: Adapted from Mason, R.P. Fitzgerald, W.F. and Morel, M.M. 1994. TheBiogeochemical Cycling of Elemental Mercury: Anthropogenic Influences. Geochem. Cosmochim.Acta, 58(15):3191-3198.

Expert Panel on Mercury Atmospheric Processes. September 1994. Mercury Atmospheric Processes: A Synthesis Report.2
Electric Power Research Institute. Report No. TR-104214.
Fitzgerald, W. F., and R. P. Mason. 1996. The Global Mercury Cycle: Oceanic and Anthropogenic Aspects. Pp. 185-1083
in Baeyens, W., R. Ebinghaus, and O. Vasiliev, eds., Global and Regional Mercury Cycles: Sources, Fluxes, and MassBalances.
3-3
magnitude of mercury reservoirs that have accumulated in soils, watersheds and ocean waters. Althoughconsiderable uncertainty still exists, it has become increasingly evident that anthropogenic emissions ofmercury to the air rival or exceed natural inputs. Recent estimates place the annual amounts of mercuryreleased into the air by human activities at between 50 and 75 percent of the total yearly input to theatmosphere from all sources. Recycling of mercury at the earth's surface, especially from the oceans,extends the influence and active lifetime of anthropogenic mercury releases.
A better understanding of the relative contribution of mercury from anthropogenic sources is alsolimited by substantial remaining uncertainties regarding the level of natural emissions as well as theamount and original source of mercury that is re-emitted to the atmosphere from soils, watersheds, andocean waters. Recent estimates indicate that of the approximately 200,000 tons of mercury emitted tothe atmosphere since 1890, about 95 percent resides in terrestrial soils, about 3 percent in the oceansurface waters, and 2 percent in the atmosphere. More study is needed before it is possible to accuratelydifferentiate between natural emissions from these soils, watersheds and ocean water and from re-emissions of mercury which originated from anthropogenic sources. For instance, approximately one-third of total current global mercury emissions are thought to cycle from the oceans to the atmosphereand back again to the oceans, but a major fraction of the emissions from oceans consists of recycledanthropogenic mercury. According to the Expert Panel on Mercury Atmospheric Processes 20 to 302
percent of the oceanic emission is from mercury originally mobilized by natural sources. Similarly, apotentially large fraction of terrestrial and vegetative emissions consists of recycled mercury frompreviously deposited anthropogenic and natural emissions.
Comparisons of contemporary (within the last 15-20 years) measurements and historical recordsindicate that the total global atmospheric mercury burden has increased since the beginning of theindustrialized period by a factor of between two and five (see Figure 3-1). It is uncertain, however,whether overall atmospheric mercury levels are currently increasing, decreasing or remaining stable. Measurements over remote areas in the Atlantic Ocean show increasing levels up until 1990 and adecrease for the period 1990-1994. At some locations in the upper midwest of the U.S., measurements ofdeposition rates suggest decreased deposition at some locations. This decrease has been attributed tocontrol of mercury emissions from local or regional sources. However, measurements at remote sites innorthern Canada and Alaska show deposition rates that continue to increase. Since these remote sites aresubject to global long-range sources rather than regional sources, these measurements may indicate thatthe global atmospheric burden of mercury is still increasing.
Although the estimated residence time of elemental mercury in the atmosphere is about 1 year,the equilibrium between the atmosphere and ocean waters results in a longer time period needed foroverall change to take place in the size of the global reservoir. Therefore, by substantially increasing thesize of the oceanic mercury pool, anthropogenic sources have introduced long term perturbations into theglobal mercury cycle. Fitzgerald and Mason estimate that if all anthropogenic emissions were ceased, it3
would take about 15 years for mercury reservoirs in the oceans and the atmosphere to return to pre-industrial conditions. The Science Advisory Board, in its review of this study concluded that it couldtake significantly longer. There is scientific agreement however, that the slow release of mercury from

3-4
terrestrial sinks to freshwater and coastal waters will persist for a long time, probably decades, whicheffectively increases the length of time anthropogenic emissions would impact the environment. This isparticularly significant given that the surface soils contain most of the pollution-derived mercury of theindustrial period. As a result, it is uncertain at this time how long it would take after reductions inanthropogenic emissions for mercury levels in the global environment, including fish levels, to return totrue background levels.
Because of the current scientific understanding of the environmental fate and transport of thispollutant, it is not possible to quantify the contribution of U.S. anthropogenic emissions relative to othersources of mercury, including natural sources and re-emissions from the global pool, on methylmercurylevels in seafood and freshwater fish consumed by the U.S. population. Consequently, the U.S. EPA isunable to predict at this time how much, and over what time period, methylmercury concentrations in fishwould decline as a result of actions to control U.S. anthropogenic emissions. This is an area of ongoingstudy.
Inventory Approach and Uncertainties
Given the considerable uncertainties regarding the levels of natural and re-emitted mercuryemissions, the emissions inventory focused only on the nature and magnitude of mercury emissions fromcurrent anthropogenic sources. The U.S. EPA recognizes, however, that an assessment of the relativepublic health and environmental impact that can be attributed to current anthropogenic emissions isgreatly complicated by both natural mercury emissions, previous emissions of mercury that havesubsequently deposited and other sources such as water discharges and other previous uses (e.g.,fungicide application). Further study is needed to determine the importance of natural and re-emittedmercury, and the contribution of water discharges relative to atmospheric deposition. Based on estimatesof the total annual global input to the atmosphere from all sources (i.e, 5000 Mg from anthropogenic,natural, and oceanic emissions as illustrated by Figure 3-1), U.S. sources are estimated to contributeabout 3 percent, based on 1995 emissions estimates as described below.
For most anthropogenic source categories, an emission factor-based approach was used todevelop both facility-specific estimates for modeling purposes and nationwide emission estimates. Thisapproach requires an emission factor, which is a ratio of the mass of mercury emitted to a measure ofsource activity. It also requires an estimate of the annual nationwide source activity level. Examples ofmeasures of source activity include total heat input for fossil fuel combustion and total raw material usedor product generated for industrial processes. Emission factors are generated from emission test data,from engineering analyses based on mass balance techniques, or from transfer of information fromcomparable emission sources. Emission factors reflect the "typical control" achieved by the air pollutioncontrol measures applied across the population of sources within a source category.
The emission factor-based approach does not generate exact emission estimates. Uncertaintiesare introduced in the estimation of emission factors, control efficiencies and the activity level measures. Ideally, emission factors are based on a substantial quantity of data from sources that represent thesource category population. For trace pollutants like mercury, however, emission factors are frequentlybased on limited data that may not have been collected from representative sources. Changes inprocesses or emission measurement techniques over time may also result in biased emission factors. Emission control estimates are also generally based on limited data; as such, these estimates areimprecise and may be biased. Further uncertainty in the emission estimates is added by the sources ofinformation used on source activity levels, which vary in reliability.

3-5
Once emitted to the environment, the fate and transport of mercury is greatly influenced by thechemical form of mercury. The data collected for the emissions inventory was all reported as totalmercury with the exception of hazardous waste combustors for which there are site-specific speciateddata. For medical waste incinerators and utility boilers there were limited speciated samples from a fewfacilities. In the exposure analysis described below, estimates were made of speciation profiles formodeling purposes. Speciated data derived from actual monitoring of sources are a critical researchneed. These data are needed to establish a clear causal link between mercury originating fromanthropogenic sources and mercury concentration (projected or actual) in environmental media and/orbiota.
To improve the emissions estimates, a variety of other research activities are also needed. Theseare listed in Chapter 5 of this Volume.
Anthropogenic Emissions Summary
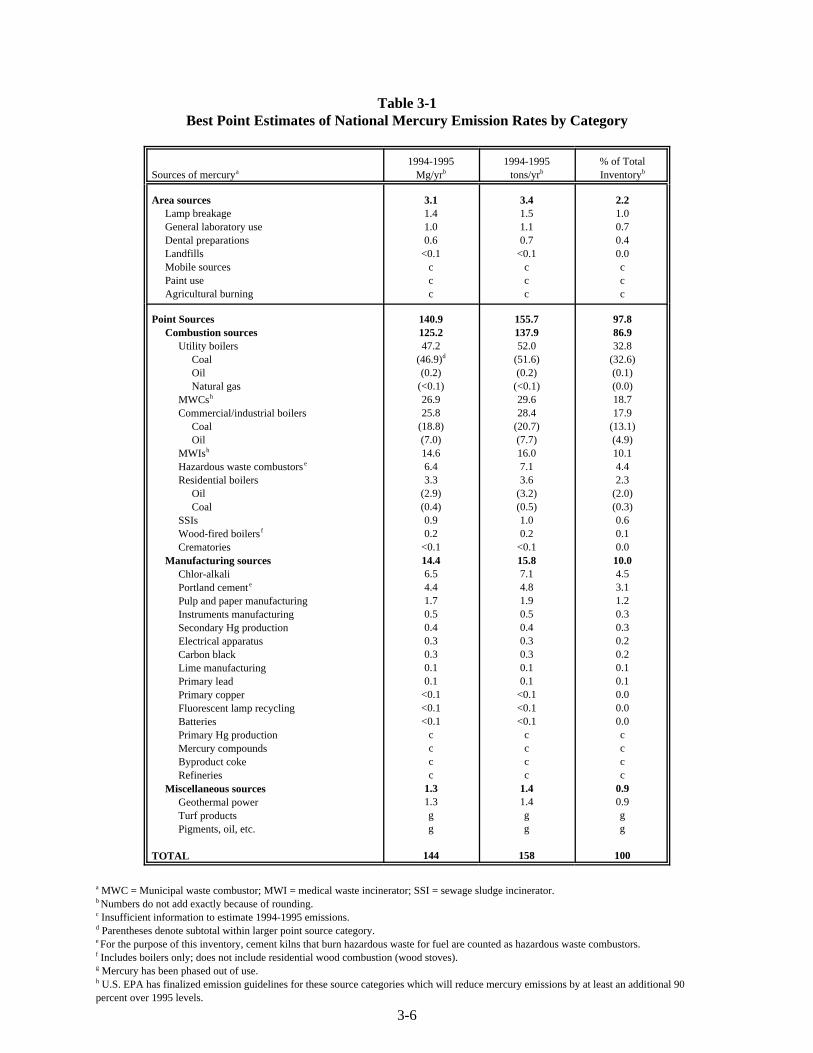
Table 3-1 summarizes the estimated national mercury emission rates by source category. Whilethese emission estimates for anthropogenic sources have limitations, they do provide insight into therelative magnitude of emissions from different groups of sources. All of these emissions estimatesshould be regarded as best point estimates given available data. Considering the data gaps and otheruncertainties in the inventory, the external peer review panel that reviewed this work in January 1995concluded that missing sources could contribute as much as 20 percent more mercury emissions to theU.S. total. This could affect the relative ranking of the smaller sources.
Of the estimated 144 Megagrams (Mg) (158 tons) of mercury emitted annually into theatmosphere by anthropogenic sources in the United States, approximately 87 percent is from combustionpoint sources, 10 percent is from manufacturing point sources, 2 percent is from area sources, and1 percent is from miscellaneous sources. Four specific source categories account for approximately80 percent of the total anthropogenic emissions--coal-fired utility boilers (33 percent), municipal wastecombustion (19 percent), commercial/industrial boilers (18 percent), and medical waste incinerators(10 percent). It should be noted that the U.S. EPA has finalized mercury emission limits for municipalwaste combustors and medical waste incinerators. When fully implemented, these emission limits willreduce mercury emissions from these sources by an additional 90 percent over 1995 levels.
All four of the most significant sources represent high temperature waste combustion or fossilfuel processes. For each of these operations, the mercury is present as a trace contaminant in the fuel orfeedstock. Because of its relatively low boiling point, mercury is volatilized during high temperatureoperations and discharged to the atmosphere with the exhaust gas.
Trends in Mercury Emissions
It is difficult to predict with confidence the temporal trends in mercury emissions for the U.S.,although there appears to be a trend toward decreasing total mercury emissions from 1990 to 1995. Thisis particularly true for the waste combustion sources where emissions have declined 50 percent frommunicipal waste combustors and 75 percent from medical waste incinerators since 1990 (see below). Also, as previously noted, there are a number of source categories where there is insufficient data toestimate current emissions let alone potential future emissions. Based on available information,however, a number of observations can be made regarding mercury emission trends from sourcecategories where some information is available about past activities and projected future activities.
3-6
Table 3-1Best Point Estimates of National Mercury Emission Rates by Category
Sources of mercury Mg/yr tons/yr Inventorya1994-1995 1994-1995 % of Total
b b b
Area sources 3.1 3.4 2.2 Lamp breakage 1.4 1.5 1.0 General laboratory use 1.0 1.1 0.7 Dental preparations 0.6 0.7 0.4 Landfills <0.1 <0.1 0.0 Mobile sources c c c Paint use c c c Agricultural burning c c c
Point Sources 140.9 155.7 97.8 Combustion sources 125.2 137.9 86.9 Utility boilers Coal Oil Natural gas MWCsh
Commercial/industrial boilers Coal Oil MWIsh
Hazardous waste combustorse
Residential boilers Oil Coal SSIs Wood-fired boilersf
Crematories Manufacturing sources Chlor-alkali Portland cemente
Pulp and paper manufacturing Instruments manufacturing Secondary Hg production Electrical apparatus Carbon black Lime manufacturing Primary lead Primary copper Fluorescent lamp recycling Batteries Primary Hg production Mercury compounds Byproduct coke Refineries Miscellaneous sources Geothermal power Turf products Pigments, oil, etc.
TOTAL
47.2 52.0 32.8(46.9) (51.6) (32.6)d
(0.2) (0.2) (0.1)(<0.1) (<0.1) (0.0)26.9 29.6 18.725.8 28.4 17.9
(18.8) (20.7) (13.1)(7.0) (7.7) (4.9)14.6 16.0 10.16.4 7.1 4.43.3 3.6 2.3
(2.9) (3.2) (2.0)(0.4) (0.5) (0.3)0.9 1.0 0.60.2 0.2 0.1
<0.1 <0.1 0.014.4 15.8 10.06.5 7.1 4.54.4 4.8 3.11.7 1.9 1.20.5 0.5 0.30.4 0.4 0.30.3 0.3 0.20.3 0.3 0.20.1 0.1 0.10.1 0.1 0.1
<0.1 <0.1 0.0<0.1 <0.1 0.0<0.1 <0.1 0.0
c c cc c cc c cc c c
1.3 1.4 0.91.3 1.4 0.9g g gg g g
144 158 100
MWC = Municipal waste combustor; MWI = medical waste incinerator; SSI = sewage sludge incinerator. a
Numbers do not add exactly because of rounding.b
Insufficient information to estimate 1994-1995 emissions.c
Parentheses denote subtotal within larger point source category.d
For the purpose of this inventory, cement kilns that burn hazardous waste for fuel are counted as hazardous waste combustors.e
Includes boilers only; does not include residential wood combustion (wood stoves).f
Mercury has been phased out of use.g
U.S. EPA has finalized emission guidelines for these source categories which will reduce mercury emissions by at least an additional 90h
percent over 1995 levels.
3-7
Current emissions of mercury from manufacturing sources are generally low compared tocombustion sources (with the exception of chlor-alkali plants using the mercury cell process and portlandcement manufacturing plants). The emissions of mercury are more likely to occur when the product(e.g., lamps, thermostats) is broken or discarded. Therefore, in terms of emission trends, one wouldexpect that if the future consumption of mercury remains consistent with the 1996 consumption rate,emissions from most manufacturing sources would remain about the same.
Secondary production of mercury (i.e., recovering mercury from waste products) has increasedsignificantly over the past few years. While 372 Mg of mercury were used in industrial processes in1996, 446 Mg were produced by secondary mercury producers and an additional 340 Mg were imported. This is a two-fold increase since 1991. The number of secondary mercury producers is expected toincrease as more facilities open to recover mercury from fluorescent lamps and other mercury-containingproducts (e.g., thermostats). As a result there is potential for mercury emissions from this sourcecategory to increase.
The largest identified source of mercury emissions during 1994-1995 is fossil fuel combustionby utility boilers, particularly coal combustion. Future trends in mercury emissions from this sourcecategory are largely dependent on both the nation's future energy needs and the fuel chosen to meet thoseneeds. Another factor is the nature of actions the utility industry may take in the future to meet other airquality requirements under the Clean Air Act (e.g., national ambient air quality standards for ozone andparticulate matter).
Two other significant sources of mercury emissions currently are municipal waste combustorsand medical waste incinerators. Emissions from these source categories have declined considerablysince 1990 on account of plant closures (for medical waste incinerators) and reduction in the mercurycontent of the waste stream (municipal waste combustors). Mercury emissions from both of these sourcetypes will decline even further by the year 2000 due to regulatory action the U.S. EPA is taking under thestatutory authority of section 129 of the CAA. The U.S. EPA has finalized rules for municipal wastecombustors and medical waste incinerators that will, when fully implemented, reduce mercury emissionsfrom both of these source categories by an additional 90 percent over 1995 levels. In addition to thisfederal action, a number of states (including Minnesota, Florida and New Jersey) have implementedmandatory recycling programs to reduce mercury-containing waste, and some states have regulationsthat impose emission limits that are lower than the federal regulation. These factors will reduce nationalmercury emissions from these source categories even further.
Trends in Mercury Use
Data on industrial demand for mercury show a general decline in domestic mercury use sincedemand peaked in 1964. Domestic demand fell by 74 percent between 1980 and 1993, and by more than75 percent between 1988 and 1996. The rate of decline, however, has slowed since 1990. Furtherevidence of the declining need for mercury in the U.S. is provided by the general decline in imports since1988 and the fact that exports have exceeded imports since at least 1989. Federal mercury sales steadilyincreased from 1988 to 1993, reaching a peak of 97 percent of the domestic demand. However, in July1994, DLA suspended future sales of mercury from the Department of Defense stockpile until theenvironmental implications of these sales are addressed. In addition, in past years, DLA sold mercuryaccumulated and held by the Department of Energy, which is also considered excess to governmentneeds. DLA suspended these mercury sales in July 1993 for an indefinite period in order to concentrate
Plachy, Jozef, 1997. Mineral Industry Surveys: Mercury Annual Review 1996. Reston, VA. June 1997.4
3-8
on selling material from its own mercury stockpile. These suspensions caused federal sales to rapidlydecrease to 18 percent of domestic demand in 1994 and to zero since 1995 .4
For industrial or manufacturing sources that use mercury in products or processes, the overallconsumption of mercury is generally declining. Industrial consumption of mercury has declined byabout 75 percent between 1988 (1503 Mg) and 1996 (372 Mg). Much of this decline can be attributed tothe elimination of mercury as a paint additive and the reduction of mercury in batteries. Use of mercuryby other source categories remained about the same between 1988 and 1996.
In general, these data suggest that industrial manufacturers that use mercury are shifting awayfrom mercury except for uses for which mercury is considered essential. This shift is believed to belargely the result of Federal bans on mercury additives in paint and pesticides; industry efforts to reducemercury in batteries; increasing state regulation of mercury emissions sources and mercury in products;and state-mandated recycling programs. A number of Federal activities are also underway to investigatepollution prevention measures and control techniques for a number of sources categories (see VolumeVIII of this Report to Congress).
Assessment Approach for Fate and Transport of Mercury
Study Design of the Fate and Transport Analysis
This analysis relied heavily on computer modeling to describe the environmental fate of emittedmercury because no monitoring data have been identified that conclusively demonstrate or refute arelationship between any of the individual anthropogenic sources in the emissions inventory andincreased mercury concentrations in environmental media or biota. To determine if there is a connectionbetween the above sources and increased environmental mercury concentrations, three different modelswere utilized. Volume III of this Report describes in detail the justification for choices of values formodel parameters.
Given the scientific uncertainties associated with environmental mercury, U.S. EPA decided thatit was most appropriate to examine the environmental fate of mercury at generalized, rather than specific,sites. A single air model which was capable of modeling both the local as well as regional fate ofmercury was not identified. This resulted in the use of two air models: the Regional Lagrangian Model ofAir Pollution (RELMAP), for assessing regional scale atmospheric transport, and the Industrial SourceCode model (ISC3), for local scale analyses (i.e., within 50 km of a source). To examine the fate ofmercury in terrestrial and aquatic environments, U.S. EPA modified an existing generalized watershedand water body fate model. The modified model is identified as IEM-2M. Each of the fate and transportmodels used in the analysis is summarized in Table 3-2.
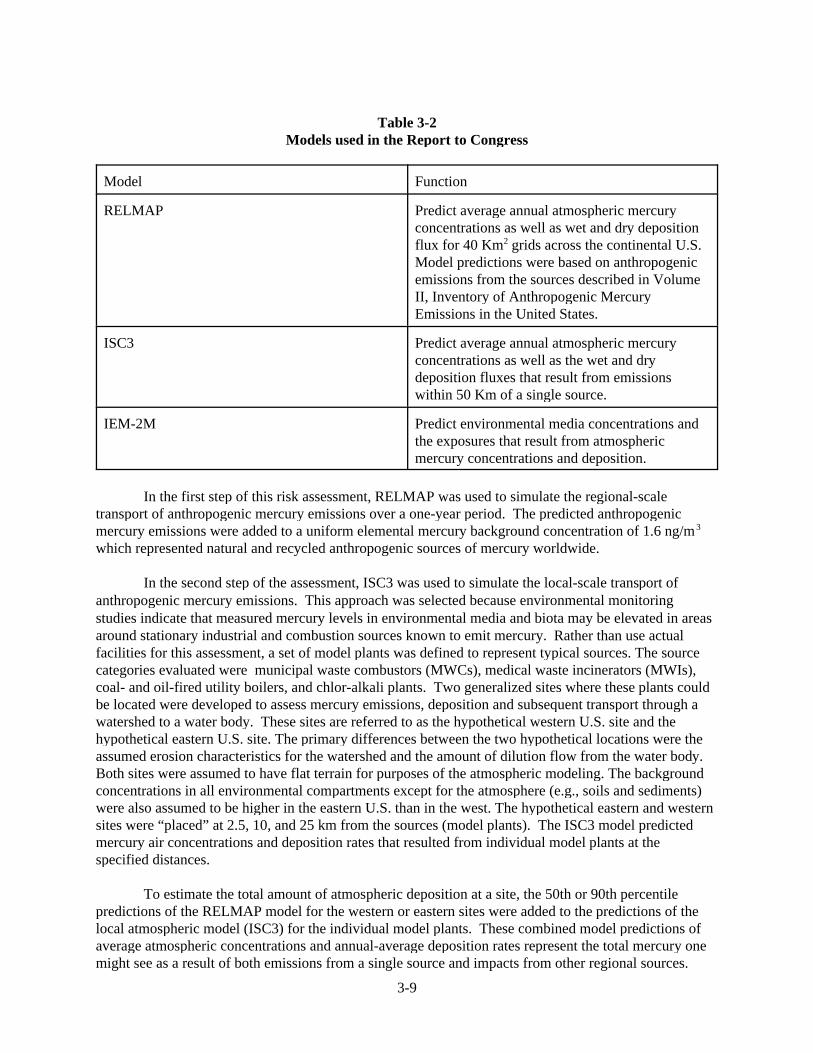
3-9
Table 3-2Models used in the Report to Congress
Model Function
RELMAP Predict average annual atmospheric mercuryconcentrations as well as wet and dry depositionflux for 40 Km grids across the continental U.S. 2
Model predictions were based on anthropogenicemissions from the sources described in VolumeII, Inventory of Anthropogenic MercuryEmissions in the United States.
ISC3 Predict average annual atmospheric mercuryconcentrations as well as the wet and drydeposition fluxes that result from emissionswithin 50 Km of a single source.
IEM-2M Predict environmental media concentrations andthe exposures that result from atmosphericmercury concentrations and deposition.
In the first step of this risk assessment, RELMAP was used to simulate the regional-scaletransport of anthropogenic mercury emissions over a one-year period. The predicted anthropogenicmercury emissions were added to a uniform elemental mercury background concentration of 1.6 ng/m3
which represented natural and recycled anthropogenic sources of mercury worldwide.
In the second step of the assessment, ISC3 was used to simulate the local-scale transport ofanthropogenic mercury emissions. This approach was selected because environmental monitoringstudies indicate that measured mercury levels in environmental media and biota may be elevated in areasaround stationary industrial and combustion sources known to emit mercury. Rather than use actualfacilities for this assessment, a set of model plants was defined to represent typical sources. The sourcecategories evaluated were municipal waste combustors (MWCs), medical waste incinerators (MWIs),coal- and oil-fired utility boilers, and chlor-alkali plants. Two generalized sites where these plants couldbe located were developed to assess mercury emissions, deposition and subsequent transport through awatershed to a water body. These sites are referred to as the hypothetical western U.S. site and thehypothetical eastern U.S. site. The primary differences between the two hypothetical locations were theassumed erosion characteristics for the watershed and the amount of dilution flow from the water body. Both sites were assumed to have flat terrain for purposes of the atmospheric modeling. The backgroundconcentrations in all environmental compartments except for the atmosphere (e.g., soils and sediments)were also assumed to be higher in the eastern U.S. than in the west. The hypothetical eastern and westernsites were “placed” at 2.5, 10, and 25 km from the sources (model plants). The ISC3 model predictedmercury air concentrations and deposition rates that resulted from individual model plants at thespecified distances.
To estimate the total amount of atmospheric deposition at a site, the 50th or 90th percentilepredictions of the RELMAP model for the western or eastern sites were added to the predictions of thelocal atmospheric model (ISC3) for the individual model plants. These combined model predictions ofaverage atmospheric concentrations and annual-average deposition rates represent the total mercury onemight see as a result of both emissions from a single source and impacts from other regional sources.
3-10
These estimates were used as inputs to the IEM-2M aquatic and terrestrial fate models at the hypotheticalwestern and eastern U.S. sites.
In the third step of this risk assessment, IEM-2M was utilized to predict the different chemicalspecies of mercury and their concentrations in watershed soils, the water column and sediments of thehypothetical lake, as well as in terrestrial and aquatic organisms. Soil concentrations are used along withvapor concentrations, deposition rates and biotransfer factors to estimate concentrations in various plants. These are used, in turn, along with other biotransfer factors to estimate concentrations in animals. Methylmercury (MHg) concentrations in fish are derived from dissolved MHg water concentrationsusing bioaccumulation factors (BAF). The BAF accounts for mercury accumulation in organisms thatcomprise the food web. The BAFs used in this analysis were calculated from existing field data.
A significant input to the IEM-2M model was the estimate of existing mercury concentrations inthe environment. To determine existing background concentrations in soil, water, and sediments, U.S.EPA estimated current “background” atmospheric concentrations and deposition rates to the hypotheticalwestern and eastern sites. Each site was then modeled using IEM-2M until equilibrium was achievedwith the specified atmospheric background conditions. At both hypothetical sites, the fate of depositedmercury was examined in three different settings: rural (agricultural), lacustrine (around a water body),and urban. The resulting predictions of mercury concentrations in soil, water, and biota were then used to evaluatemercury exposures to humans and wildlife as described in Volumes IV and V of this Report.
Figure 3-2 illustrates the how the various fate models were integrated.
Long-Range Transport Analysis
The long range transport modeling predicts the regional and national deposition of mercuryacross the continental U.S. Details of several studies which demonstrate the long range transport ofmercury are presented in Volume III. In this analysis, the long range transport of mercury was modeledusing site-specific, anthropogenic emission source data (presented in Volume II of this Report) togenerate average annual atmospheric mercury concentrations and deposition values across thecontinental U.S. The Regional Lagrangian Model of Air Pollution (RELMAP) was the model selected for this analysis.
From the RELMAP analysis and a review of field measurement studies, it is concluded thatmercury deposition appears to be ubiquitous across the continental U.S., and at, or above, detectionlimits when measured with current analytic methods. The southern Great Lakes and Ohio River Valley, the Northeast, and scattered areas in the South (particularly in the Miami and Tampa areas) are predictedto have the highest annual rate of deposition of total mercury (above the levels predicted at the 90thpercentile). Figure 3-3 illustrates the pattern of mercury deposition across the U.S. This figure alsoillustrates the boundaries of the RELMAP modeling domain. Measured deposition data are limited, butare available for certain geographic regions. The data that are available corroborate the RELMAPmodeling predictions for specific areas. These comparisons are discussed in detail in Volume III.
A wide range of mercury deposition rates is predicted across the continental U.S. The highestpredicted rates (i.e., above 90th percentile) are about 20 times higher than the lowest predicted rates (i.e.,below the 10th percentile).
The three principal factors that contribute to these modeled and observed deposition patterns are:
� the emission source locations;
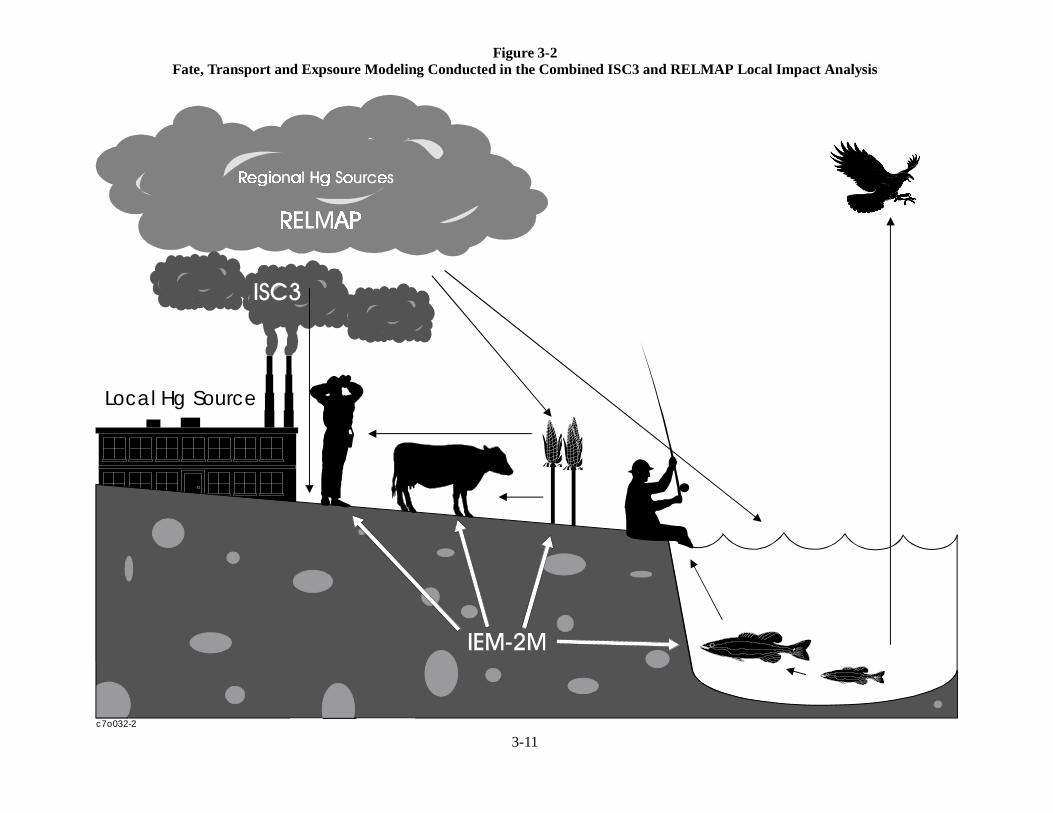
Local Hg Source
c7o032-2
Figure 3-2Fate, Transport and Expsoure Modeling Conducted in the Combined ISC3 and RELMAP Local Impact Analysis
3-11

3-12
Figure 3-3Total Simulated Wet + Dry Deposition of Mercury in All Forms
Units: �g/m2
Petersen, G., Å. Iverfeldt and J. Munthe. (1995) Atmospheric mercury species over Central and Northern Europe. Model calculations and5
comparison with observations from the Nordic Air and Precipitation Network for 1987 and 1988. Atmospheric Environment 29:47-68.
Bullock, Jr., O. R., W. G. Benjey and M. H. Keating. (1997) Modeling of regional scale atmospheric mercury transport and deposition6
using RELMAP. Atmospheric Deposition of Contaminants to the Great Lakes and Coastal Waters: Joel E. Baker, Ed. pp.323-347. SETACPress, Pensacola, Florida.
Bullock, Jr., O. R., K. A. Brehme and G. R. Mapp. (1997) Lagrangian modeling of mercury air emission, transport and deposition: An7
analysis of model sensitivity to emissions uncertainty. Special Issue on Mercury as a Global Pollutant: Science of the Total Environment, inpress.
3-13
� the amount of divalent and particulate mercury emitted or formed in the atmosphere; and
� climate and meteorology.
A facility located in a humid climate is predicted to have a higher annual rate of mercury deposition thana facility located in an arid climate.
The critical variables within the model are:
� the estimated washout ratios of elemental and divalent mercury; and
� the annual amount of precipitation.
Precipitation is important because it removes various forms of mercury from the atmosphere anddeposits them to the surface of the earth.
Mass Balances of Mercury within the Long-range Model Domain
The chemical form of emitted mercury is a critical factor in its fate, transport and toxicity in theenvironment. With the exception of hazardous waste incinerators, for which there are site-specificspeciated data, mercury emissions are reported as total mercury in all forms. The form distributions, orspeciation factors, define the estimated fraction of mercury emitted as elemental mercury (Hg ), divalent0
mercury (Hg ), or mercury associated with particulates (Hg ). These speciation factors were adopted2+p
from Peterson et al. with adjustments made to reflect the types of air pollution control equipment known5
to be installed at individual industrial plants. There is considerable uncertainty about the speciationfactors for some industrial sources. A wide variety of alternate speciation scenarios have beeninvestigated to measure the sensitivity of the RELMAP results to this uncertainty . The results show6,7
that the total simulated wet and dry deposition of mercury to the continental U. S. is strongly andpositively correlated to the fraction of mercury emitted as Hg and Hg for all major source types. The2+
p
speciation factors used in the RELMAP modeling for this Report are discussed in Volume III.
The results of the RELMAP modeling using these assumed speciation factors are describedbelow. The general mass balance of elemental mercury gas, divalent mercury gas, and particle-boundmercury from the RELMAP simulation results using specified speciation profiles are shown in Table 3-3. Using the meteorologic data from the year 1989, the mass balance shows a total of 141.8 metric tonsof mercury emitted to the atmosphere from anthropogenic sources. (This simulated emission total differsfrom the national totals indicated in Volume II since the states of Alaska and Hawaii are not within themodel domain.) The simulation indicates that 47.6 metric tons of anthropogenic mercury emissions aredeposited within the model domain and 0.4 metric tons remain in the air within the model domain at theend of the simulation. The remainder, about 93.8 metric tons, is transported outside the model domainand probably diffuses into the global atmospheric reservoir.

3-14
The simulation also indicates that 32.0 metric tons of mercury are deposited within the modeldomain from this global atmospheric reservoir, suggesting that about three times as much mercury isbeing added to the global reservoir from U.S. emissions as is being deposited from it. The total amountof mercury deposited in the model domain annually from U.S. anthropogenic emissions and from theglobal background concentration is estimated to be 79.6 metric tons, of which approximately three-fifthsis emitted by anthropogenic sources in the lower 48 United States.
Of the total anthropogenic mercury mass deposited to the surface in the model domain, 77% isestimated by the RELMAP to come from Hg emissions, 21% from Hg emissions and 2% from Hg2+ 0
P
emissions. When the deposition of Hg from the global background is considered in addition to0
anthropogenic sources in the lower 48 states, the species fractions of total deposition become 46% Hg ,2+
41% Hg and 13% Hg . The vast majority of mercury already in the global atmosphere is in the form of0P
Hg and, in general, the anthropogenic Hg emissions do not greatly elevate the Hg air concentration0 0 0
over the global background value. Although Hg is removed from the atmosphere very slowly, the global0
background reservoir is large and total deposition from it is significant. It should be noted that drydeposition of Hg is thought to be significant only at very elevated concentrations and has not been0
included in the RELMAP simulations. Wet deposition is the only major pathway for removal of Hg0
from the atmosphere. This removal pathway simulated by the RELMAP involves oxidation of mercuryby ozone in an aqueous solution; thus, the Hg that is extracted from the atmosphere by the modeled0
precipitation process would actually be deposited primarily in the form of Hg .2+
Table 3-3Modeled Mercury Mass Budget in Metric Tons for 1994-1995Using the Specified Speciation Profiles and 1989 Meteorology
Source/Fate Hg Hg Hg Total0a 2+bpc
Mercury
Total U.S. anthropogenic emissions 63.5 52.3 26.0 141.8Mass advected from model domain 62.3 15.5 16.0 93.8Dry deposited anthropogenic emissions 0.0 22.9 0.5 23.4Wet deposited anthropogenic emissions 0.9 13.8 9.5 24.2Remaining in air at end of simulation 0.4 <0.1 <0.1 0.4
Total deposited anthropogenic emissions 0.9 36.8 10.0 47.6Deposited from background Hg 32.0 0.0 0.0 32.00
Mercury deposited from all sources 32.9 36.8 10.0 79.6
(All figures rounded to the nearest tenth of a metric ton)
Hg = Elemental Mercurya 0
Hg = Divalent Vapor-phase Mercuryb 2+
Hg = Particle-Bound/Mercurycp
Of the 63.5 metric tons of anthropogenic Hg emitted in the lower 48 states, only 0.9 tons (1.4%)0
is deposited within the model domain, while of the 52.3 metric tons of Hg emitted, about 36.8 tons2+
(70.4%) is deposited. Ninety-eight percent of the deposited anthropogenic mercury was emitted in theform of Hg or Hg . Thus, a strong argument can be made that the combined Hg and Hg component2+ 2+
P P
of anthropogenic mercury emissions can be used as an indicator of eventual deposition of thoseemissions to the lower 48 states and surrounding areas. The emission inventory and chemical/physical

3-15
speciations profiles indicate that of all combined Hg and Hg emissions in 1994-1995, about 29% is2+P
from electric utility boilers, 25% is from municipal waste combustion, 18% is from medical wasteincineration, 16% is from commercial and industrial boilers, and 12% is from all other modeled sources.
Limitations of the Long-Range Transport (RELMAP) Analysis
There are a number of uncertainties with the RELMAP analysis. These have to do to a largedegree with the current state-of-the-science concerning atmospheric chemistry and speciation profiles ofmercury emissions. Some of the most important limitations are listed below.
� Comprehensive emissions data for a number anthropogenic and natural sources are notavailable. This reflects the current developmental nature of emission speciationmethods, resulting in few data on the various species of mercury and proportions ofvapor and solid forms emitted. Both elemental and divalent mercury species as well asgaseous and particulate forms are known to be emitted from point and area sources.
� Atmospheric chemistry data are incomplete. Some atmospheric reactions of mercury,such as the oxidation of elemental mercury to divalent mercury in cloud water dropletshave been reported. Other chemical reactions in the atmosphere that may reduce divalentspecies to elemental mercury have not been reported.
� There is inadequate information on the atmospheric processes that affect wet and drydeposition of mercury. Atmospheric particulate forms and divalent species of mercuryare thought to wet and dry deposit more rapidly than elemental mercury; however, therelative rates of deposition are uncertain. There is no validated air pollution model thatestimates wet and dry deposition of vapor-phase compounds close to the emissionsource. In addition, there is uncertainty regarding the revolatilization of depositedmercury.
Analysis of the Local Atmospheric Fate of Mercury
An analysis of the local atmospheric fate of mercury (within 50 km) released from anthropogenicemission sources was undertaken using the ISC-3 model to estimate the impacts of mercury fromselected, individual source types. The ISC-3 model was slightly modified to correspond more closely tothe chemical properties of atmospheric mercury. This analysis addressed atmospheric mercury emissionsfrom MWCs, coal- and oil-fired utility boilers, MWIs, and chlor-alkali plants. A model plant approachwas utilized to develop facilities which represent actual sources from these four categories. The modelplants were situated in hypothetical locations intended to simulate a site in either the western or easternU.S.
The ISC-3 model was used in conjunction with the results from the RELMAP regional scalemodeling in order to estimate the air concentrations and deposition rates for each hypothetical facility ineach site. Once emitted from a source, mercury may be deposited to the ground via two main processes:wet and dry deposition. Wet deposition refers to the mass transfer of dissolved gaseous or suspendedparticulate mercury species from the atmosphere to the earth's surface by precipitation, while drydeposition refers to such mass transfer in the absence of precipitation.

3-16
The model parameters exerting the most influence on the deposition rates are these:
� total mercury emission rate (grams/second);� assumptions regarding speciation of the total mercury;� vapor/particle phase partition estimate;� stack height for the plant; and� exit gas velocity.
Combined Results of Local and Regional Scale Analyses
The results of the local scale ISC-3 modeling and the regional scale RELMAP modeling werecombined to predict air concentrations and deposition rates for each hypothetical facility in each site. The predicted air concentrations are typically dominated by the regional values, even for the watershedsrelatively close to the facility. In general, the predicted average air concentrations are quite low. Theonly source class for which significantly elevated air concentrations are predicted is the chlor-alkalifacility. This is due to a very low stack height coupled with a high assumed mercury emission rate. Thelow stack height results in predicted plumes that are close to the receptors considered, and so there is lessdispersion of the plume compared to the other facilities.
In contrast to the predicted air concentrations, the annual deposition rates are cumulative; theyrepresent the sum of any deposition that occurs during the year, and hence are not affected by longperiods of little deposition. Further, the ISC3 model predicts that significant deposition events occurinfrequently, and it is these relatively rare events that are responsible for the majority of the annualdeposition rate. The percentage of mercury deposited within 50 km depends on two main factors:facility characteristics that influence effective stack height (stack height plus plume rise) and the fractionof mercury emissions that is divalent mercury. In most cases, the effective stack height affects only theair concentrations, and hence dry deposition.
For any site with appreciable precipitation, wet deposition can dominate the total deposition forreceptors close to the source. Single wet deposition events can deposit 300 times more Hg than a highdry deposition event. These events are even rarer than significant dry deposition events because not onlymust the wind direction be within a few degrees of the receptor's direction, but precipitation must beoccurring as well. The predicted dry deposition rates depend ultimately on the predicted airconcentrations. For this reason, dry deposition accounts for most of the total deposition for the facilitywith the highest predicted air concentrations, the chlor-alkali plant.
In general, 7-45% of the total mercury emitted is predicted to deposit within 50 km at the easternsite in flat terrain, while 2-38% is predicted to deposit at the western site. (The ranges represent valuesfrom the different sources considered.) This implies that at least 55% of the total mercury emissions istransported more than 50 km from any of the sources considered, and is consistent with the RELMAPresults that predict that mercury may be transported across considerable distances.
The differences between the results for the eastern and western sites are due primarily to thedifferences in the frequency and intensity of precipitation. At the eastern site, precipitation occurs about12 % of the year, with about 5% of this precipitation of moderate intensity (0.11 to 0.30 in/hr). Bycomparison, at the western site, precipitation occurs about 3% of the year, with about 2% of theprecipitation of moderate intensity.

3-17
Assessment of Watershed Fate
The atmospheric mercury concentrations and deposition rates estimated using the RELMAP andISC3 were then used as inputs in the watershed model, IEM-2M, to derive calculations of mercury inwatershed soils and surface waters. The soil and water concentrations, in turn, drive calculations ofconcentrations in the associated biota and fish, which humans and other animals are assumed toconsume.
IEM-2M is composed of two integrated modules that simulate mercury fate using mass balanceequations describing watershed soils and a shallow lake. The mass balances are performed for eachmercury component, with internal transformation rates linking Hg , Hg , and MeHg. Sources include0 2+
wetfall and dryfall loadings of each component to watershed soils and to the water body. An additionalsource is diffusion of atmospheric Hg vapor to watershed soils and the water body. Sinks include0
leaching of each component from watershed soils, burial of each component from lake sediments,volatilization of Hg and MeHg from the soil and water column, and advection of each component out of0
the lake.
The nature of this methodology is basically steady with respect to time and homogeneous withrespect to space. While it tracks the buildup of soil and water concentrations over the years given asteady depositional load and long-term average hydrological behavior, it does not respond to unsteadyloading or meteorological events. There are, thus, limitations on the analysis and interpretations imposedby these simplifications. The model's calculations of average water body concentrations are less reliablefor unsteady environments, such as streams, than for more steady environments, such as lakes.
The BAFs were used to estimate fish methylmercury concentrations based on measuredconcentrations of dissolved methylmercury in the water column. The distribution of the BAFs (AppendixD, Vol. III) was designed to estimate an average concentration of methylmercury in fish of a giventrophic level from an average concentration of dissolved methylmercury in the epilimnion for a (single)randomly-selected lake in the continental U.S. The large amount of variability evidenced by the data andreflected in the output distributions arises from several sources, which were not quantified. Much of thisvariability depends on fish age, model uncertainty, and possibly the use of unrepresentative watercolumn methylmercury measurements in the calculation of the BAFs.
Results of the Watershed Fate and Transport Analysis
For all facilities the contribution of the local source decreases as the distance from the facilityincreases. With the exception of the chlor-alkali plant, the facilities are generally predicted to contributeless than 50% to the total watershed soil concentration, with RELMAP (representing the regionalanthropogenic sources) contributing up to 15% for the RELMAP 50th percentiles, and up to 60% for theRELMAP 90th percentiles.
The results for the MeHg water concentrations and trophic level 4 fish concentrations show aslightly higher contribution from the local sources. While the fractions are similar to those for watershedsoil since the watershed serves as a mercury source for the waterbody, these values are slightly higherdue to the direct deposition onto the waterbody.
The predicted fruit, leafy vegetable, and beef concentrations are generally dominated by thebackground values. For plants, this is because these products are assumed to take up most of themercury from the air, and the local source usually does not impact the local air concentrationssignificantly. The exception is the chlor-alkali plant, for which the low stack results in higher mercury
3-18
air concentrations. The results for the beef concentrations are similar; however, there is a slightly highercontribution from the local source because the cattle are exposed through the ingestion of soil.
IEM-2M Model Sensitivity
For a specific atmospheric deposition rate, mercury concentrations in watersheds and waterbodies can vary significantly. Several intrinsic and extrinsic watershed and water body characteristicsinfluence the mercury concentrations in soil, water, and fish. These should cause significant variabilityin mercury concentrations between regions and among individual lakes within a region.
Mercury concentrations in watershed soils are strongly influenced by atmospheric loading andsoil loss processes. The influence of plant canopy and roots in mediating both the loading to the soil andthe loss from the soil is not well characterized at present, although published studies indicate its potentialimportance. Reduction of HgII in the upper soil layer appears to control the volatile loss of mercury,and variations in this reaction can cause significant variations in soil mercury levels. The factorscontrolling mercury reduction are not well characterized at present. Soil erosion from a watershed canvary more than 3 orders of magnitude depending on rainfall patterns, soil type, topography, and plantcover. High levels of soil erosion should significantly diminish soil mercury concentrations. Runoff andleaching are not expected to affect soil mercury concentrations significantly.
Total mercury concentrations in a water body are strongly influenced by atmospheric loadingand, for drainage lakes, by watershed loading. Variations in watershed size and erosion rates can causesignificant variability in lake mercury levels. Hydraulic residence time, the water body volume dividedby total flow, affects the maximum possible level of total water column mercury for a given loading rate. Parameters controlling mercury loss through volatilization and net settling can also cause significantvariations among lakes. Mercury loss through settling is affected by in-situ productivity, by the supplyof solids from the watershed, and by the solids-water partition coefficient. DOC concentrations cansignificantly affect partitioning, and thus overall mercury levels. Mercury loss through volatilization iscontrolled by the reduction rate, which is a function of sunlight and water clarity. Reduction may also becontrolled by pH, with lower pH values inhibiting this reduction, leading to higher total mercury levels.
Fish mercury levels are strongly influenced by the same factors that control total mercury levels. In addition, fish concentrations are sensitive to methylation and demethylation in the water column andsediments. A set of water body characteristics appear to affect these reactions, including DOC, sedimentTOC, sunlight, and water clarity. Variations in these properties can cause significant variations in fishconcentrations among lakes. Other factors not examined here, such as anoxia and sulfate concentrations,can stimulate methylation and lead to elevated fish concentrations. Fish mercury levels are sensitive tofactors that promote methylmercury mobility from the sediments to the water column; these factorsinclude sediment DOC and sediment-pore water partition coefficients.
Limitations of the Local Scale and Watershed Analyses
There are limitations associated with the fate and transport analyses. These have to do to a largedegree with the current state-of-the-science concerning mercury fate and transport in the terrestrial andaquatic environments and variability between waterbodies. Some of the most important limitations arelisted below.
� There is a lack of information characterizing the movement of mercury from watershedsoils to water bodies and the rates at which mercury converts from one chemical speciesto another. There appears to be a great deal of variability in these factors amongwatersheds.
3-19
� There are not conclusive data on the amount of and rates of mercury methylation indifferent types of water bodies. In addition, there is a lack of data on the transfer ofmercury between environmental compartments and biologic compartments; for example,the link between the amount of mercury in the water body and the levels in fish appearsto vary from water body to water body.
� There is a lack of adequate mercury measurement data near mercury sources. Measurement data are needed to assess how well the modeled data predict actualmercury concentrations in different environmental media at a variety of geographiclocations. Missing data include measured mercury deposition rates and measuredconcentrations in the atmosphere, soils, water bodies and biota.
� The IEM-2M has not been validated with site-specific data. The model wasbenchmarked against the independently-derived R-MCM, which itself has beencalibrated to several Wisconsin lakes. When driven by the same atmospheric loadingand solids concentrations, IEM-2M predictions of mercury concentrations compare wellwith those calculated by R-MCM for a set of Wisconsin lakes.
Conclusions Regarding Mercury Fate and Transport in the Environment
The uncertainty inherent in the modeled estimates arises from many individual assumptionspresent within the three models. Because of these uncertainties, U.S. EPA interpreted the model resultsqualitatively rather than quantitatively as follows.
The analysis of mercury fate and transport, in conjunction with available scientific knowledge,supports a plausible link between mercury emissions from anthropogenic combustion and industrialsources and mercury concentrations in air, soil, water and sediments. The critical variables contributingto this linkage are these:
� the species of mercury that are emitted from the sources, with Hg mostly contributing to0
concentrations in ambient air and Hg mostly contributing to concentrations in soil,2+
water and sediments;
� the overall amount of mercury emitted from a combustion source;
� the watershed soil loss rates, including reduction and erosion;
� the water body loss rates, including outflow, reduction, and settling; and
� the climate conditions.
In addition, the analysis of mercury fate and transport supports a plausible link between mercuryemissions from anthropogenic combustion and industrial sources and methylmercury concentrations infreshwater fish. The critical variables contributing to this linkage are the following:
� the species of mercury that are emitted, with emitted divalent mercury mostly depositinginto local watershed areas and, to a lesser extent the atmospheric conversion of elementalmercury to divalent species which are deposited over greater distances;
� the overall amount of mercury emitted from a source;
� the watershed soil loss rates, including reduction and erosion;

3-20
� the water body loss rates, including outflow, reduction, and settling;
� the extent of mercury methylation in the water body;
� the extent of food web bioaccumulation in the water body; and
� the climate conditions.
From the analysis of deposition and on a comparative basis, the deposition of Hg close to an2+
emission source is greater for receptors in elevated terrain (i.e., terrain above the elevation of the stackbase) than from receptors located in flat terrain (i.e., terrain below the elevation of the stack base). Thecritical variables are parameters that influence the plume height, primarily the stack height and stack exitgas velocity.
On a national scale, an apportionment between sources of mercury and mercury in environmentalmedia and biota cannot be described in quantitative terms with the current scientific understanding of theenvironmental fate and transport of this pollutant.
Assessment of Exposure
The exposure Volume consists of two parts; the first examines exposures predicted to result fromthe emitted mercury, and the second estimates exposures that result from seafood consumption. The firstpart of the exposure assessment draws upon the modeling analyses described above which assessed thelong range transport of mercury from emission sources through the atmosphere, the transport of mercuryfrom emission sources through the local atmosphere, and the aquatic and terrestrial fate and transport ofmercury at hypothetical sites. The exposure assessment used the results of the atmospheric, terrestrialand aquatic models to estimate the resulting exposures to humans and animals that were assumed toinhabit the hypothetical sites explained above. In the second part of the exposure Volume, exposure tomercury from seafood was estimated using various dietary surveys and measurements of mercuryconcentrations in seafood.
The exposure assessment, which was based on environmental fate and exposure modeling,addressed atmospheric mercury emissions from the four sources described earlier; MWCs, MWIs, utilityboilers and chlor-alkali plants. It did not address all anthropogenic emission sources. In addition,anthropogenic discharges of mercury to waterbodies were not addressed.
Human Exposure
The following human exposure routes were included: inhalation, consumption of water,consumption of fish, beef, beef liver, cow’s milk, poultry, chicken eggs, pork, lamb, green plants (e.g.,leafy vegetables, potatoes, fruits, grains and cereals) and ingestion of soil. Dermal exposures thatresulted from contact with soil and water, as well as exposure through inhalation of resuspended dustparticles and exposure through the consumption of human breast milk were not evaluated. The onlyexposure route considered for wildlife was the consumption of freshwater fish.
Consumption of fish is the dominant pathway of exposure to methylmercury for fish-consuminghumans and wildlife. There is a great deal of variability among individuals in these populations withrespect to food sources and fish consumption rates. As a result, there is a great deal of variability inexposure to methylmercury in these populations. The anthropogenic contribution to the total amount ofmethylmercury in fish is predicted to be, in part, the result of anthropogenic mercury releases fromindustrial and combustion sources increasing mercury body burdens in fish. Existing background
3-21
mercury concentrations are also predicted to contribute to methylmercury concentrations in fish. As aconsequence of human and wildlife consumption of the affected fish, there is an incremental increase inexposure to methylmercury. Due to differences in fish consumption rates per body weight anddifferences in body weights among species, it is likely that piscivorous birds and mammals have muchhigher environmental exposures to methylmercury than humans through the consumption ofcontaminated fish. This is true even in the case of fish consumption by humans who consume aboveaverage amounts of fish. The critical variables contributing to these outcomes are these:
� the fish consumption rate;� the body weight of the individual in relation to the fish consumption rate; and� the rate of biomagnification between trophic levels within the aquatic food-chain.
A current assessment of U.S. general population methylmercury exposure through theconsumption of fish is provided in Chapter 4 of Volume IV. This assessment was conducted to providean estimate of mercury exposure through the consumption of fish to the general U.S. population. It is anational assessment rather than a site-specific assessment. This assessment utilizes data from theContinuing Surveys of Food Intake by Individuals (CSFII 89-91, CSFII 1994, CSFII 1995) and the thirdNational Health and Nutrition Examination Survey (NHANES III) to estimate a range of fishconsumption rates among U.S. fish and shellfish eaters. Per capita, per user (only individuals whoreported fish consumption during the survey period) based on a single-day’s intake, and month-long peruser were considered. The month-long per user projections reflect the combined frequency distributionsof NHANES III frequency of fish/shellfish consumption data and single day’s data for per userconsumption patterns. For each fish-eater, the number of fish meals, the quantities and species of fishconsumed and the self-reported body weights were used to estimate mercury exposure on a body weightbasis. The constitution of the survey population was weighted to reflect the actual U.S. population. Results of smaller surveys on �high-end� fish consumers are also included.
These estimates of fish consumption rates were combined with species-specific mean values formeasured methylmercury concentrations. The marine fish methylmercury concentration data wereobtained from the National Marine Fisheries Service Database. The freshwater fish methylmercuryconcentration data were obtained from Bahnick et al., (1994) and Lowe et al., (1985). Through theapplication of specific fish preparation factors (USDA, 1995), estimates of the range of methylmercuryexposure from the consumption of fresh water fish were prepared for the fish-consuming segment of theU.S. population. Per body weight estimates of methylmercury exposure were determined by dividing thetotal daily methylmercury exposure from this pathway by the self-reported body weights of individualsin the USDA surveys and recorded body weights in the third NHANES data. The species offish/shellfish consumed by children were identified from the 24-hour recalls on children in the USDAsurveys and in the third NHANES.. The results of this analysis show that on a per kilogram body weightbasis children have higher average exposure rates to methylmercury through the consumption of fishthan adults. The higher exposures to children are considered biologically meaningful because month-long mercury exposures considerably in excess of the RfD are observed among some children. At theRfD or below, exposures are expected to be safe. The risk following exposures above the RfD isuncertain, but risk increases as exposures to methylmercury increase.
Wildlife Exposure
In terms of predicted methylmercury intake on a per body weight basis, the six wildlife speciesconsidered in this analysis can be ranked from high to low as follows:
� Kingfisher� River Otter

3-22
� Loon, Mink, Osprey� Bald Eagle
Methylmercury exposures for the most exposed wildlife species (the kingfisher) may be up to two ordersof magnitude higher than human exposures from contaminated freshwater fish (on a kilogram fishconsumed per body weight basis). This assumes that the fish within different tropic levels of a givenlake are contaminated with the same concentrations of methylmercury.
Human Health Effects of Methylmercury
Data in both humans and experimental animals show that all three forms of mercury evaluated inthis Report (elemental, inorganic and methylmercury) can produce adverse health effects at sufficientlyhigh doses. Human exposure to elemental mercury occurs in some occupations, and exposure toinorganic mercury can arise from mercury amalgams used in dental restorative materials (U.S. PHS,Environmental Health Policy Committee, 1995). People, however, are primarily exposed tomethylmercury in fish. The focus of this assessment, therefore, is on methylmercury, which can producea variety of adverse effects, depending on the dose and time of exposure.
Individual risk assessors for specific organizations may apply risk assessment differently. Identification of subpopulations of concern is one of the decisions in the risk assessment process. Because methylmercury is a neurotoxin (particularly to the developing nervous system), the fetus andyoung child are of particular interest. More than one approach to selection of the population at risk ofadverse effect is feasible. The RfD of 0.1 µg/kg bw/day was based on neurotoxic effects ofmethylmercury to the developing nervous system. Because nervous system development continues intopostnatal life the young child may also be a subpopulation of interest. If children are judged to be asubpopulation of concern, specific age-groups within this subpopulation may be judged to be of greaterinterest; e.g., birth through 4 years of age. Alternatively other risk assessors may prefer to consider allchildren (e.g., birth through 14 years of age) as a group when evaluating risk to children.
Methylmercury-induced neurotoxicity is the effect of greatest concern when exposure occurs tothe developing fetus. The RfD is a dose of methylmercury that is protective of the developing fetalnervous system. Post-natal brain development continues well into childhood. Methylmercury exposureadversely affects a number of cellular events in the developing brain both in utero and post-natally. Thepost-natal age when development of various regions of the brain is completed varies, but development ofmany functions continues through the first four to six years of life. The RfD of 0.1 ug/kg-bw/day(protective of fetal brain development) is anticipated to be protective of brain development in the youngchild.
3-23
Toxicokinetics of Mercury
The toxicokinetics (i.e., absorption, distribution, metabolism, and excretion) of mercury is highlydependent on the form of mercury to which a receptor has been exposed.
The absorption of elemental mercury vapor occurs rapidly through the lungs, but it is poorlyabsorbed from the gastrointestinal tract. Once absorbed, elemental mercury is readily distributed throughoutthe body; it crosses both placental and blood-brain barriers. The distribution of absorbed elemental mercuryis limited primarily by the oxidation of elemental mercury to the mercuric ion as the mercuric ion has alimited ability to cross the placental and blood-brain barriers. Once elemental mercury crosses these barriersand is oxidized to the mercuric ion, return to the general circulation is impeded, and mercury can be retainedin brain tissue. Elemental mercury is eliminated from the body via urine, feces, exhaled air, sweat, andsaliva. The pattern of excretion changes depending upon the extent the elemental mercury has been oxidizedto mercuric mercury.
Absorption of inorganic mercury through the gastrointestinal tract varies with the particularmercuric salt involved; absorption decreases with decreasing solubility. Estimates of the percentage ofinorganic mercury that is absorbed vary; as much as 20% may be absorbed. Inorganic mercury has a reducedcapacity for penetrating the blood-brain or placental barriers. There is some evidence indicating thatmercuric mercury in the body following oral exposures can be reduced to elemental mercury and excreted viaexhaled air. Because of the relatively poor absorption of orally administered inorganic mercury, the majorityof the ingested dose in humans is excreted through the feces.
Methylmercury is rapidly and extensively absorbed through the gastrointestinal tract. Absorptioninformation following inhalation exposures is limited. This form of mercury is distributed throughout thebody and easily penetrates the blood-brain and placental barriers in humans and animals. Methylmercury inthe body is considered to be relatively stable and is only slowly demethylated to form mercuric mercury inrats. It is hypothesized that methylmercury metabolism may be related to a latent or silent period observed inepidemiological studies observed as a delay in the onset of specific adverse effects. Methylmercury has arelatively long biological half-life in humans; estimates range from 44 to 80 days. Excretion occurs via thefeces, breast milk, and urine.
The most common biological samples analyzed for mercury are blood, urine and scalp hair. Themethods most frequently used to determine the mercury levels in these sample types include atomicabsorption spectrometry, neutron activation analysis, X-ray fluorescence and gas chromatography.
Two major epidemics of methylmercury poisoning through fish consumption have occurred. The best known of these two epidemics occurred among people and wildlife living near Minamata Cityon the shores of Minamata Bay, Kyushu, Japan. The source of methylmercury was a chemical factorythat used mercury as a catalyst. A series of chemical analyses identified methylmercury in the factorywaste sludge, which was drained into Minamata Bay. Once present in Minamata Bay, themethylmercury accumulated in the tissue of shellfish and fish that were subsequently consumed bywildlife and humans. Fish was a routine part of the diet in these populations. An average fishconsumption was reported to be in excess of 300 g/day (reviewed by Harada et al., 1995); this is a fargreater level of fish consumption than is typical for the general U.S. population. For the general U.S.population, the average fish consumption level is between 8 and 10 g/day (based on month-long data inNHANES III).
3-24
The first poisoning case occurred in 1956 in a six year old girl who came to a hospitalcomplaining of symptoms characteristic of nervous system damage. Symptoms of Minamata disease inchildren and adults included the following:
� Impairment of the peripheral vision;� disturbances in sensations ("pins and needles" feelings, numbness) usually in the hands
and feet and sometimes around the mouth;� incoordination of movements as in writing; � impairment of speech; � impairment of hearing; � impairment of walking; and � mental disturbances.
It frequently took several years before people were aware that they were developing the signs andsymptoms of methylmercury poisoning.
Over the next 20 years the number of people known to be affected with what became known asMinamata disease increased to thousands. In time the disease was recognized to result frommethylmercury poisoning, and fish were subsequently identified as the source of methylmercury. As isoften the situation with epidemics, the first cases noted were severe. Deaths occurred among both adultsand children. It also was recognized that the nervous system damage could occur to the fetus if themother ate fish contaminated with high concentrations of methylmercury during pregnancy. The nervoussystem damage of severe methylmercury poisoning among infants was very similar to congenitalcerebral palsy. In the fishing villages of this region the occurrence of congenital cerebral palsy due tomethylmercury was very high compared to the incidence for Japan in general. At the height of theepidemic, mercury concentrations in fish were between 10 and 30 ppm wet weight. After the source ofmercury contamination was identified, efforts were made to reduce the release of mercury into the bay. After 1969, average mercury concentrations in fish had fallen below 0.5 ppm.
In 1965, an additional methylmercury poisoning outbreak occurred in the area of Niigata, Japan. As in Minamata, multiple chemical plant sources of the chemical were considered. Scientific detectivework identified the source again to be a chemical factory releasing methylmercury into the Agano River. The signs and symptoms of disease in Niigata were those of methylmercury poisoning and stronglysimilar to the disease in Minamata.
The abnormalities (or pathology) in the human brain that result from methylmercury poisoningare well described. There is an extremely high level of scientific certainty that methylmercury causesthese changes. Similar pathology has been identified in other countries where methylmercury poisoningshave occurred. Methylmercury contamination of other food products (including grains and porkproducts) has resulted in severe methylmercury poisoning with pathological changes in the nervoussystem and clinical disease virtually identical to Minamata disease.
Methylmercury poisoning occurred in Iraq following consumption of seed grain that had beentreated with a fungicide containing methylmercury. The first outbreak occurred prior to 1960 andresulted in severe human poisonings. The second outbreak of methylmercury poisoning from grainconsumption occurred in the early 1970s. Imported mercury�treated seed grains arrived after the planting season andwere subsequently used as grain to make into flour that was baked into bread. Unlike the long�termexposures in Japan, the epidemic of methylmercury poisoning in Iraq was short in duration, but themagnitude of the exposure was high. Because many of the people exposed to methylmercury in this waylived in small villages in very rural areas (and some were nomads), the number of people exposed to
3-25
these mercury�contaminated seed grains is not known. The number of people admitted to the hospitalwith symptoms of poisoning has been estimated to be approximately 6,500, with 459 fatalities reported.
As in the Japanese poisoning epidemics, the signs and symptoms of disease were predominantlythose of the nervous system: difficulty with peripheral vision or blindness, sensory disturbances,incoordination, impairment of walking, slurred speech and in some cases, death. Children were affected,as well as adults. Of great concern was the observation that infants, born of mothers who had consumedthe methylmercury�contaminated grain (particularly during the second trimester of pregnancy) couldshow nervous system damage even though the mother was only slightly affected herself.
Some Limitations of the Assessment
In both the Iraqi and Japanese epidemics, the levels of methylmercury consumed were muchhigher than the levels currently reported in the U.S. food supply. For example, in the Japanese epidemic,mercury concentrations in fish were between 10 and 30 ppm. Average concentrations in freshwater fishin the U.S. are roughly 0.3 ppm. The most frequently consumed marine species have mercuryconcentrations less than 0.2 ppm. While there are no data to indicate that methylmercury absorption isaffected by food type, it must be noted that one of the severe poisoning episodes was through a meansnot expected to be prevalent in the U.S.; that is, the consumption of contaminated grain.
Health endpoints other than neurotoxicity were evaluated by U.S. EPA using established riskassessment Guidelines. Data for other endpoints than developmental neurotoxicity were limited. Methylmercury has been shown to cause tumors in mice at high doses that produce severe non-cancertoxicity. Low-dose exposures to methylmercury are not likely to cause cancer in humans. Data oneffects related to mutation formation (changes in DNA) indicate that methylmercury could increasefrequencies of mutation in human eggs and sperm. These data were not sufficient, however, to permitestimation of the amount of methylmercury that would cause a measurable mutagenic effect in a humanpopulation.
How Much Methylmercury is Harmful to Humans?
Information on the amount of methylmercury exposure producing particular combinations ofsigns and symptoms in people has been analyzed to yield what are called quantitative dose�responseassessments. Both the Japanese and Iraqi epidemics are important to understanding how methyl-mercuryfrom food produces neurological disease in humans. In the epidemics in Minamata and Niigata, theexposures were long�term, and the tissues of fish and shellfish were the sources of methylmercuryexposure. This establishes with highest scientific confidence that methylmercury in fish can producehuman disease. A limitation to these data is that many patients were severely affected. The extent ofmethylmercury poisoning was so severe that finding subtle indications of disease is difficult. Subtleindicators of poisoning are important for estimating the level of exposure that will not cause adverseeffects. The U.S. EPA calculates one such estimate, called a reference dose or RfD (see the box �What Isa Reference Dose?�).
U.S. EPA has on two occasions published RfDs for methylmercury which have represented theAgency consensus for that time. These are discussed at length in Volume IV, and the uncertainties andlimitations are described in Volume VI. At the time of the generation of the Mercury Study Report toCongress, it became apparent that considerable new data on the health effect of methylmercury inhumans were emerging. Among these are large studies of fish or fish and marine mammal consumingpopulations in the Seychelles and Faroes Islands. Smaller scale studies are in progress which describeeffects in populations around the U.S. Great Lakes. In addition, there are new evaluations, includingnovel statistical approaches and application of physiologically-based pharmacokinetic models to
3-26
published work. The U.S. EPA has been advised by scientific reviewers to employ this RfD for thisanalysis. Because of various limitations and uncertainties in the Iraqi data set, the U.S. EPA and otherfederal agencies intend to participate in an interagency review of all the human data on methylmercury,including the more comprehensive studies from the Seychelles and Faroe Islands. The purpose of thisreview is to reduce the level of uncertainty attending current estimates of the level of exposure tomercury associated with subtle neurological endpoints. After this process, the U.S. EPA will re-assessits RfD for methylmercury to determine if change is warranted.
The current U.S. EPA RfD for methylmercury was based on data on neurologic changes in 81Iraqi children who had been exposed in utero: their mothers had eaten methylmercury-contaminatedbread during pregnancy. The data were collected by interviewing the mothers of the children and byclinical examination by pediatric neurologists approximately 30 months after the poisoning episode. Theincidence of several endpoints (including late walking, late talking, seizures or delayed mentaldevelopment, and scores on clinical tests of nervous system function) were mathematically modeled byU.S. EPA to determine a mercury level in hair (measured in all the mothers in the study) which wasassociated with no adverse effects. These effects were delays in motor and language developmentdefined by the following:
� Inability to walk two steps without support by two years of age;
� inability to respond to simple verbal communication by age 2 years among children withgood hearing;
� scores on physical examination by a neurologist that assessed cranial nerve signs,speech, involuntary movements, limb tone, strength, deep tendon reflexes, plantarresponses, coordination, dexterity, primitive reflexes, sensation, posture, and ability tosit, stand, walk, and run; and
� assessment of mental development or the presence of seizures based on interviews withthe child's mother.
In calculating the mercury level in hair which was associated with no adverse effects, the U.S.EPA chose a benchmark dose approach based on modeling of all effects in children. The benchmarkdose is the intake of methylmercury associated with the lower bound (that is the lower limit) on a 95percent confidence interval of a dose producing a 10 percent prevalence of adverse effects. The 95percent confidence interval indicates there is a 5 percent likelihood that the effect reported was due tochance alone. The effects used as end-point of adverse neurological effects included delayed walking,delayed talking, and abnormal neurological scores (see p. 3-38 for details). This lower bound was 11ppm hair concentration for methylmercury. A dose�conversion equation was used to estimate a dailyintake of 1.1 µg methylmercury/kg body weight/day that when ingested by a 60 kg individual willmaintain a blood concentration of approximately 44 µg/L of blood or a hair concentration of 11 µgmercury/gram hair (11 ppm). Mothers with hair concentrations below that associated with the RfD (1 ugHg/g hair) are unlikely to experience adverse effects.
Data on the behavior of mercury in the human body were used to estimate the amount ofmercury ingested per day at this no adverse effect level. Due to variability in the way individualsprocess methylmercury in the body and the lack of data on observed adult male and female reproductiveeffects, an uncertainty factor of 10 was used to derive the RfD from the benchmark dose. The RfD formethylmercury was determined to be 1x10 mg/kg�day; that is a person could consume 0.1 µg�4
methylmercury for every kg of his/her body weight every day for a lifetime without anticipation of riskof

3-27
What Is A Reference Dose?
A reference dose or RfD is defined in the following way by U.S. EPA: an estimate (withuncertainty spanning perhaps an order of magnitude) of a daily exposure to the human population (includingsensitive subgroups) that is likely to be without an appreciable risk of deleterious effects during a lifetime. RfDs are reviewed by Agency scientists for accuracy, appropriate use of risk assessment methodology,appropriate use of data and other scientific issues. When consensus has been reached by the workgroup,information on the RfD is made available to the public through a U.S. EPA database; namely, the IntegratedRisk Information System (IRIS).
The RfD is based on the best available data that indicate a "critical effect"; this is generally the firstindicator or most subtle indicator of an adverse effect in the species under study. In calculating RfDs U.S.EPA generally uses a no observed adverse effect level (NOAEL). This is found from either inspection ormodeling of dose-response data on the critical effect. It is a means of estimating the threshold for effect inthe reported study. The NOAEL is most useful when it is from a study in which a determination of thelowest observed adverse effect level (LOAEL) can also be done. The LOAEL is the lowest tested dose atwhich the critical effect was seen in the species under study.
In calculating the RfD the U.S. EPA divides the NOAEL or LOAEL by a series of uncertainty andmodifying factors in order to extrapolate to the general human population. The uncertainty factors (whichmay be as much as 10 each) are for the following areas: extrapolation of data to sensitive humansubpopulations; extrapolation from animal data to conclusions for humans; lack of chronic data; lack ofcertain other critical data; and use of a LOAEL in the absence of a NOAEL.
The RfD is used for risk assessment judgments dealing with evaluations of general systemictoxicity. It is intended to account for sensitive (but not hypersensitive) members of the human population;the rationale is that if exposure to the RfD is likely to be without appreciable risk for sensitive members ofthe population, then it is without appreciable risk for all members of the population. The RfD is generallyapplicable to men and women and to adults, to children and to the aged, unless data support the calculation ofseparate RfDs for these groups.
The RfD is a quantitative estimate of levels expected to be without effect even if exposure persistsover a lifetime. It is not intended to be compared with isolated or one time exposures. Exceedance of theRfD does not mean that risk will be present. Acceptability of uncertain risks is a risk management decision. Risk management decisions may consider the RfD but will take into account exposures, other risk factors andnon-risk factors as well. At the RfD or below, exposures are expected to be safe. The risk followingexposures above the RfD is uncertain, but risk increases with increasing exposures.
adverse effect. The RfD is a daily ingestion level anticipated to be without adverse effect to persons,including sensitive subpopulations, over a lifetime. The RfD may be considered the midpoint in anestimated range of about an order of magnitude. This range reflects variability and uncertainty in theestimate. At the RfD or below, exposures are expected to be safe. The risk following exposures abovethe RfD is uncertain but risk increases with increasing exposure.
The RfD is a risk assessment tool, not a risk management decision. Judgments as to a "safe"dose and exposure represent decisions that involve risk management components.
3-28
Limitations and Uncertainties in the Assessment
The range of uncertainty in the RfD and the factors contributing to this range were evaluated inqualitative and quantitative uncertainty analyses. The uncertainty analyses indicated that paresthesia(numbness or tingling) in the hands and feet, and occasionally around the mouth, in adults is not the mostreliable endpoint for dose�response assessment because it is subject to the patient's recognition of theeffect. Paresthesia in adults is no longer the basis for U.S. EPA's methylmercury RfD as it was in themid-1980s. There are, however, uncertainties remaining on the current RfD based on developmentaleffects from methylmercury in children exposed in utero. There are difficulties with reliability inrecording and classifying events like late walking in children, especially as the data were collectedapproximately 30 months after the child's birth. It should be noted, however, that the endpoints usedrepresented substantial developmental delays; for example, a child's inability to walk two steps withoutsupport at two years of age, inability to talk based on use of two or three meaningful words by 24months, or presence of generalized convulsive seizures. There is uncertainty in the physiologic factorswhich were used in estimating the ingested mercury dose. There is also a degree of uncertaintyintroduced by the size of the study population (81 mother-child pairs).
The RfD is supported by investigations of laboratory animals under controlled exposures tomethylmercury. Data from experimental animals (including primates with long-term exposures tomethylmercury) show methylmercury-induced nervous system damage, particularly on the visual system,although the animals appeared clinically normal. The endpoints described in the animal literature areimportant and these have been induced by dosing protocols that are relevant to human exposures. Inexperiments using nonhuman primates, sensory (visual, somatosensory, auditory), cognitive (learningunder concurrent schedules, recognition of faces), social play, and schedule-controlled operant behaviorare all identified as having been adverse affected by methylmercury. The sensory, cognitive, and motordeficits appear reliably over a consistent range of doses in nonhuman primates exposed tomethylmercury during development. Subtle, but important deficits, appear in several functionaldomains. These are identifiable signs of methylmercury effects when appropriate testing conditions areapplied.
The RfD is supported by additional studies in children exposed in utero. These includeinvestigations among Cree Indians in Canada and New Zealanders consuming large amounts of fish. Inthese studies the hair concentration of mercury is used to monitor mercury exposure over time. Conclusions by the investigators in their official reports cite developmental delays among the childrenborn of mothers whose hair mercury concentrations during pregnancy were 6 to 18 µg/g, consistent withthe benchmark dose of 11 µg/g.
Currently a number of research studies are underway that further address the question of whatexposures to methylmercury in fish are associated with neurological disease. These studies include moresubjects than did the Iraqi study, are prospective in design, and utilize endpoints that are anticipated to bemore sensitive than the clinical signs and symptoms of methylmercury poisoning observed in Iraq. These studies of developmental effects of mercury exposure secondary to fish and shellfish consumption,rather than poisoning, are conducted in the Seychelles Islands in the Indian Ocean (sponsored, in part bythe Department of Health and Human Services), the Faroe Islands in the North Atlantic Ocean(sponsored, in part, by the United States Environmental Protection Agency and by the United StatesDepartment of Health and Human Services), and in the United States; this last study is sponsored by theAgency for Toxic Substances and Disease Registry (ATSDR).
Data from both the Seychelle Islands cohort and the Faroe Islands cohort have been publishedduring 1996 and 1997. These data should be useful in decreasing the uncertainty surrounding both thebenchmark dose and the RfD, however, statistical analyses for purposes of risk assessment have been
3-29
recommended by the U.S. EPA’s Science Advisory Board. In addition to these two major prospectiveinvestigations, additional studies evaluating the effect of methylmercury exposures from fish andshellfish in human subjects from other geographic areas are anticipated to be published in the peer-reviewed literature within the period 1997/1998. The U.S. FDA has determined that revisions of itsaction level for mercury concentrations of fish in interstate commerce should wait until the new studieshave reduced the level of uncertainty. The availability of results from the above studies will likewiseenable U.S. EPA to re-examine and adjust its RfD as needed.
Levels of Methylmercury Exposure Addressed by the U.S. Food and Drug Administration, WorldHealth Organization and State Recommendations
The U.S. EPA RfD is a daily intake level and is a risk assessment tool; the use of the RfD is notlimited to fish. The discussion that follows covers risk assessment and risk management activitiesconcerning fish. These consider fish consumption patterns and risk management policy factors.
There are numerous local and state warnings in the U.S. to limit intake of fish because ofchemical contamination. Warnings are issued because of a number of contaminants. Methylmercury ismost often included as one of the contaminants that form the basis for the warning. Often these warningsare issued based on local conditions.
Recommended limits on methylmercury exposure have been expressed in these units: �g/kgbody weight/day; concentrations of mercury in tissues such as blood, hair, feathers, liver, kidney, brain,etc.; grams of fish per day; number of fish meals per time interval (e.g., per week). Reference values formercury concentrations (expressed as total mercury) in biological materials commonly used to indicatehuman exposures to mercury were published by the WHO/IPCS (1990). The mean concentration ofmercury in whole blood is approximately 8 �g/L, in hair about 2 �g/g, and in urine approximately 4�g/L. Wide variation occurs about these values (WHO/IPCS, 1990).
A number of different estimates exist for hair mercury levels that are associated with low risks ofneurological endpoints such as paresthesia. These estimates are sensitive to variables such as thehalf�life of mercury in the body (time to eliminate half the dose of mercury). Half-life is usuallyestimated as an average of 70 days, with extremes of about 35 to just over 200 days reported for differentindividuals. The half�life of mercury in pregnant women has not been directly measured. The half�lifeof mercury in women during lactation is shorter, possibly due to excretion of mercury into milk producedduring lactation.
Cross-comparison of World Health Organization (WHO) recommendations regarding riskassociated with hair mercury concentrations is facilitated by data reported by the WHO on mercuryconcentrations in 559 samples of human head hair from 32 locations in 13 countries. The WHO reportfound that mercury concentrations in hair increased with increasing frequency of fish consumption (seeTable 3-4).
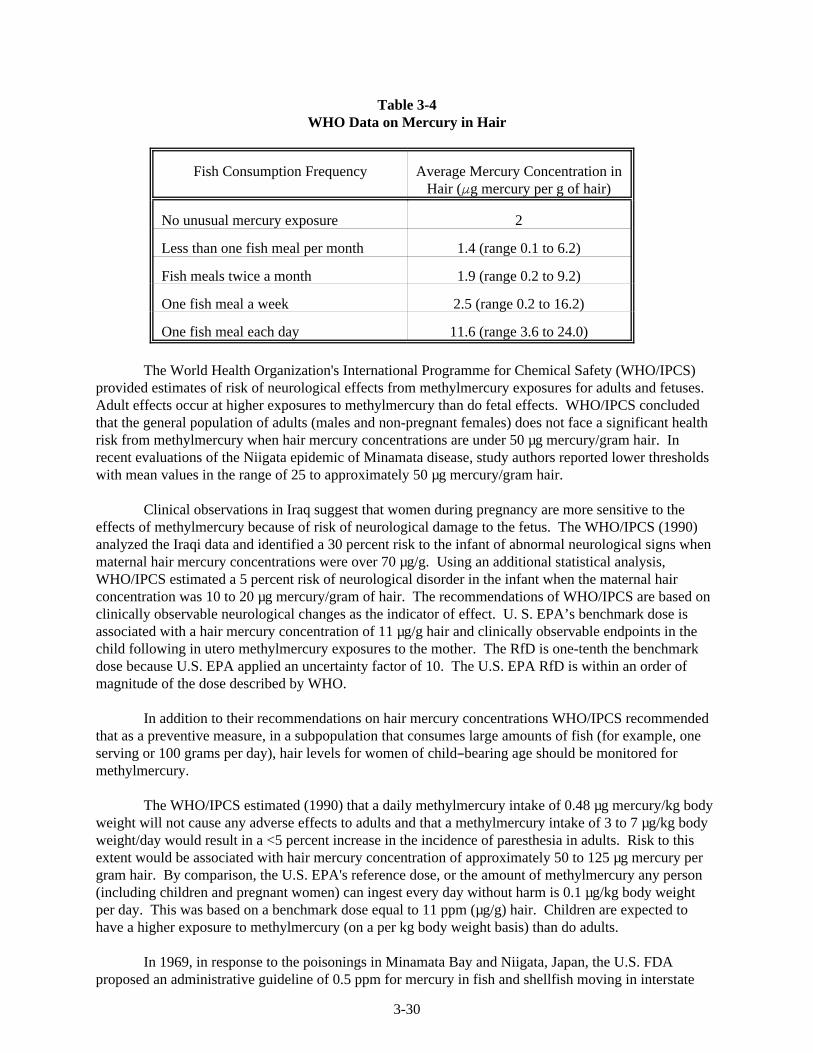
3-30
Table 3-4WHO Data on Mercury in Hair
Fish Consumption Frequency Average Mercury Concentration inHair (�g mercury per g of hair)
No unusual mercury exposure 2
Less than one fish meal per month 1.4 (range 0.1 to 6.2)
Fish meals twice a month 1.9 (range 0.2 to 9.2)
One fish meal a week 2.5 (range 0.2 to 16.2)
One fish meal each day 11.6 (range 3.6 to 24.0)
The World Health Organization's International Programme for Chemical Safety (WHO/IPCS)provided estimates of risk of neurological effects from methylmercury exposures for adults and fetuses. Adult effects occur at higher exposures to methylmercury than do fetal effects. WHO/IPCS concludedthat the general population of adults (males and non-pregnant females) does not face a significant healthrisk from methylmercury when hair mercury concentrations are under 50 µg mercury/gram hair. Inrecent evaluations of the Niigata epidemic of Minamata disease, study authors reported lower thresholdswith mean values in the range of 25 to approximately 50 µg mercury/gram hair.
Clinical observations in Iraq suggest that women during pregnancy are more sensitive to theeffects of methylmercury because of risk of neurological damage to the fetus. The WHO/IPCS (1990)analyzed the Iraqi data and identified a 30 percent risk to the infant of abnormal neurological signs whenmaternal hair mercury concentrations were over 70 µg/g. Using an additional statistical analysis,WHO/IPCS estimated a 5 percent risk of neurological disorder in the infant when the maternal hairconcentration was 10 to 20 µg mercury/gram of hair. The recommendations of WHO/IPCS are based onclinically observable neurological changes as the indicator of effect. U. S. EPA’s benchmark dose isassociated with a hair mercury concentration of 11 µg/g hair and clinically observable endpoints in thechild following in utero methylmercury exposures to the mother. The RfD is one-tenth the benchmarkdose because U.S. EPA applied an uncertainty factor of 10. The U.S. EPA RfD is within an order ofmagnitude of the dose described by WHO.
In addition to their recommendations on hair mercury concentrations WHO/IPCS recommendedthat as a preventive measure, in a subpopulation that consumes large amounts of fish (for example, oneserving or 100 grams per day), hair levels for women of child�bearing age should be monitored formethylmercury.
The WHO/IPCS estimated (1990) that a daily methylmercury intake of 0.48 µg mercury/kg bodyweight will not cause any adverse effects to adults and that a methylmercury intake of 3 to 7 µg/kg bodyweight/day would result in a <5 percent increase in the incidence of paresthesia in adults. Risk to thisextent would be associated with hair mercury concentration of approximately 50 to 125 µg mercury pergram hair. By comparison, the U.S. EPA's reference dose, or the amount of methylmercury any person(including children and pregnant women) can ingest every day without harm is 0.1 µg/kg body weightper day. This was based on a benchmark dose equal to 11 ppm (µg/g) hair. Children are expected tohave a higher exposure to methylmercury (on a per kg body weight basis) than do adults.
In 1969, in response to the poisonings in Minamata Bay and Niigata, Japan, the U.S. FDAproposed an administrative guideline of 0.5 ppm for mercury in fish and shellfish moving in interstate

3-31
commerce. This limit was converted to an action level in 1974 (Federal Register 39, 42738, December 6,1974) and increased to 1.0 ppm in 1979 (Federal Register 44, 3990, January 19, 1979) in recognition thatexposure to mercury was less than originally considered. In 1984, the 1.0 ppm action level wasconverted from a mercury standard to one based on methylmercury (Federal Register 49, November 19,1984).
FDA’s action level is based on consideration of the tolerable daily intake (TDI) formethylmercury, as well as information on seafood consumption and associated exposure tomethylmercury. The TDI is the amount of methylmercury that can be consumed daily over a long periodof time with a reasonable certainty of no harm to adults. The neurological endpoint evaluated wasparesthesia (see WHO description above for more information). U.S. FDA (and WHO) established aTDI based on a weekly tolerance of 0.3 mg of total mercury per person, of which no more than 0.2 mgshould be present as methylmercury. These amounts are equivalent to 5 and 3.3 µg, respectively, perkilogram of body weight. Using the values for methylmercury, this tolerable level would correspond toapproximately 230 µg/week for a 70 kg person or 33 µg/person/day. The TDI was calculated from datadeveloped in part by Swedish studies of Japanese individuals poisoned in the episode of Niigata whichresulted from the consumption of contaminated fish and shellfish and the consideration of other studiesof fish-eating populations.
Based on observations from the poisoning event later in Iraq, U.S. FDA has acknowledged thatthe fetus may be more sensitive than adults to the effects of mercury (Federal Register 44: 3990, January19, 1979; Cordle and Tollefson, 1984, U.S. FDA Consumer, September, 1994). In recognition of theseconcerns, U.S. FDA has provided advice to pregnant women and women of child-bearing age to limittheir consumption of fish known to have high levels of mercury (U.S. FDA Consumer, 1994). U.S. FDAbelieves, however, that given existing patterns of fish consumption, few women (less than 1%) eatingsuch high mercury fish will experience slight reductions in the margin of safety. However, due to theuncertainties associated with the Iraqi study, U.S. FDA has chosen not to use the Iraqi study as a basisfor revising its action level. Instead, the U.S. FDA has chosen to wait for findings of prospective studiesof fish-eating populations in the Seychelles Islands and in the Faroes Islands.
Characterization of Risk to Human Populations
The characterization of risk to U.S. human populations focuses on exposure to methylmercury. Although methylmercury is found in other media and biota, it accumulates to the highest concentrationsin the muscle tissue of fish, particularly fish at the top of the aquatic food chain. As a result, fishingestion is the dominant exposure pathway. The dominance of this pathway reflects bothbioaccumulation of methylmercury in the fish and the efficiency with which methylmercury passesthrough intestinal walls. The critical elements in estimation of methylmercury exposure from fish arethese: the species of fish consumed; the concentration of methylmercury in the fish; the quantityconsumed and the frequency of consumption.
There are three ways to assess the risk to populations from methylmercury exposure. The firstway used in this analysis was based on predicted increases in methylmercury concentrations in fish dueto anthropogenic emissions coupled with predicted exposure to human (and wildlife) populations. Thistype of analysis has the advantage of predicting the direct impact of anthropogenic emissions on fishconcentrations. The second way risk was assessed was by using dietary surveys to identify the amountand type of fish consumed by populations in the U.S. The advantage of this methodology is that a totalexposure from fish can be evaluated, even though the contamination may have come from sources otherthan anthropogenic emissions. The third way to determine whether members of the population are at riskwas to consider hair mercury levels as methylmercury exposures for the general populations are reflectedby these levels. This type of assessment would be one appropriate measurement of actual mercury
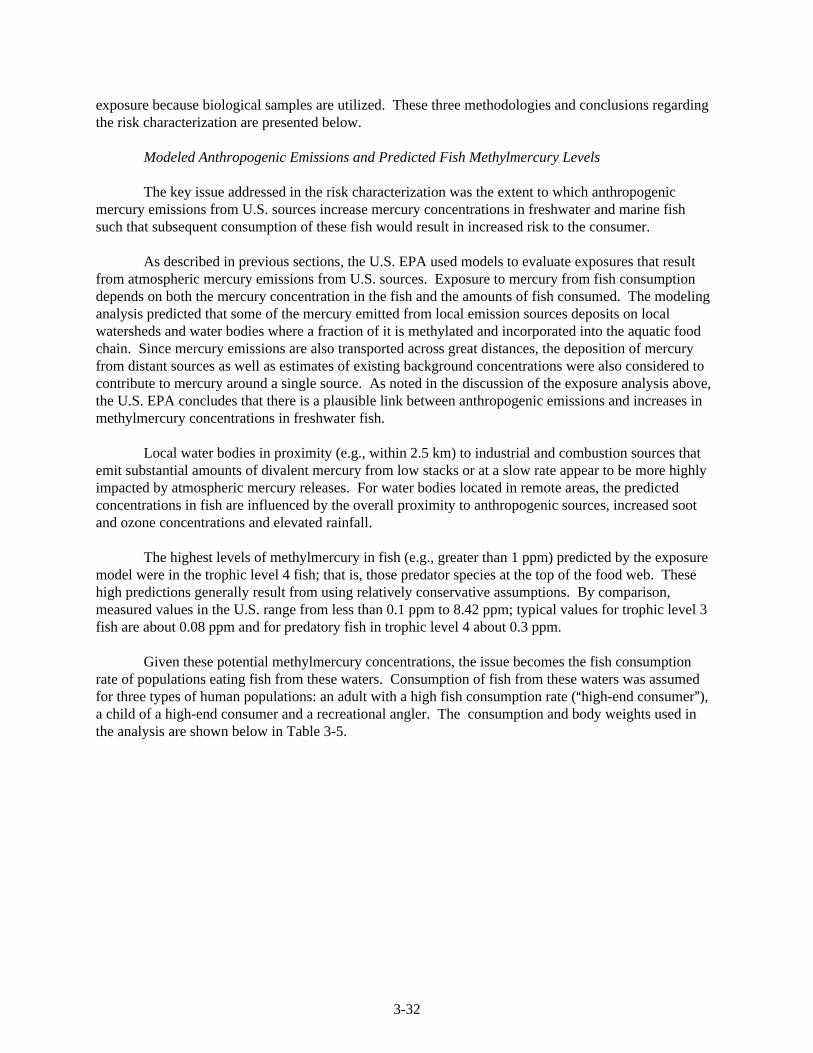
3-32
exposure because biological samples are utilized. These three methodologies and conclusions regardingthe risk characterization are presented below.
Modeled Anthropogenic Emissions and Predicted Fish Methylmercury Levels
The key issue addressed in the risk characterization was the extent to which anthropogenicmercury emissions from U.S. sources increase mercury concentrations in freshwater and marine fishsuch that subsequent consumption of these fish would result in increased risk to the consumer.
As described in previous sections, the U.S. EPA used models to evaluate exposures that resultfrom atmospheric mercury emissions from U.S. sources. Exposure to mercury from fish consumptiondepends on both the mercury concentration in the fish and the amounts of fish consumed. The modelinganalysis predicted that some of the mercury emitted from local emission sources deposits on localwatersheds and water bodies where a fraction of it is methylated and incorporated into the aquatic foodchain. Since mercury emissions are also transported across great distances, the deposition of mercuryfrom distant sources as well as estimates of existing background concentrations were also considered tocontribute to mercury around a single source. As noted in the discussion of the exposure analysis above,the U.S. EPA concludes that there is a plausible link between anthropogenic emissions and increases inmethylmercury concentrations in freshwater fish.
Local water bodies in proximity (e.g., within 2.5 km) to industrial and combustion sources thatemit substantial amounts of divalent mercury from low stacks or at a slow rate appear to be more highlyimpacted by atmospheric mercury releases. For water bodies located in remote areas, the predictedconcentrations in fish are influenced by the overall proximity to anthropogenic sources, increased sootand ozone concentrations and elevated rainfall.
The highest levels of methylmercury in fish (e.g., greater than 1 ppm) predicted by the exposuremodel were in the trophic level 4 fish; that is, those predator species at the top of the food web. Thesehigh predictions generally result from using relatively conservative assumptions. By comparison,measured values in the U.S. range from less than 0.1 ppm to 8.42 ppm; typical values for trophic level 3fish are about 0.08 ppm and for predatory fish in trophic level 4 about 0.3 ppm.
Given these potential methylmercury concentrations, the issue becomes the fish consumptionrate of populations eating fish from these waters. Consumption of fish from these waters was assumedfor three types of human populations: an adult with a high fish consumption rate (�high-end consumer�),a child of a high-end consumer and a recreational angler. The consumption and body weights used inthe analysis are shown below in Table 3-5.
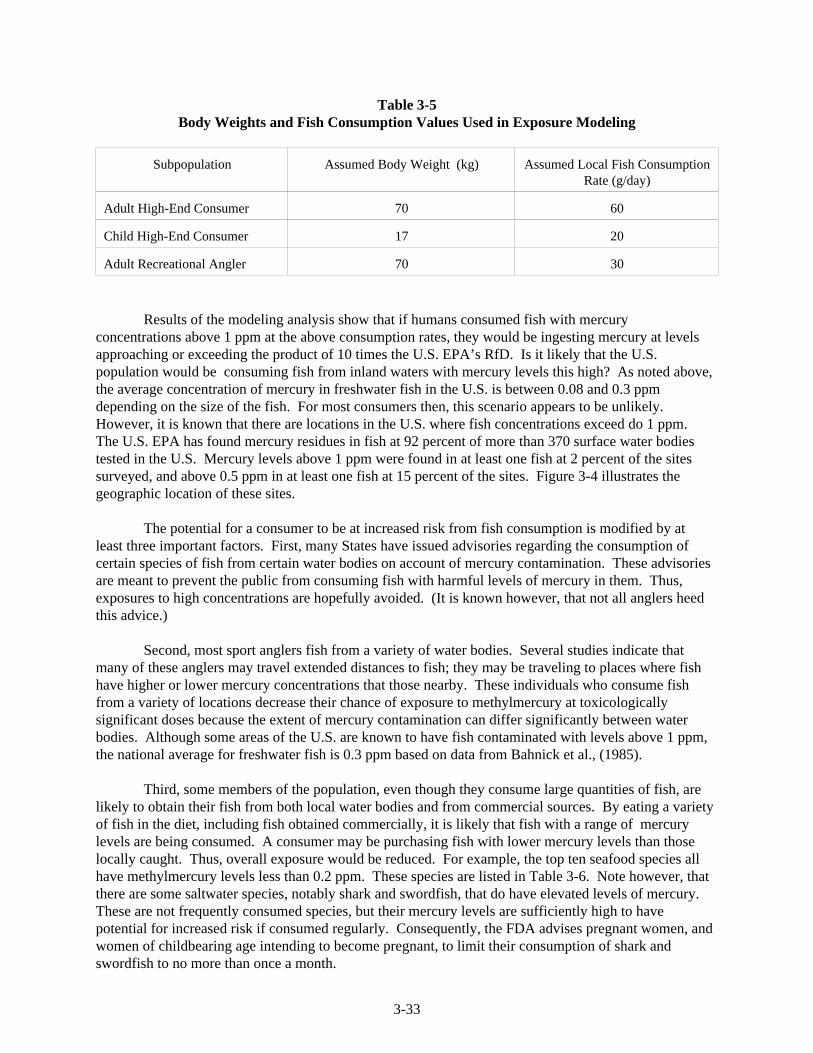
3-33
Table 3-5Body Weights and Fish Consumption Values Used in Exposure Modeling
Subpopulation Assumed Body Weight (kg) Assumed Local Fish ConsumptionRate (g/day)
Adult High-End Consumer 70 60
Child High-End Consumer 17 20
Adult Recreational Angler 70 30
Results of the modeling analysis show that if humans consumed fish with mercuryconcentrations above 1 ppm at the above consumption rates, they would be ingesting mercury at levelsapproaching or exceeding the product of 10 times the U.S. EPA’s RfD. Is it likely that the U.S.population would be consuming fish from inland waters with mercury levels this high? As noted above,the average concentration of mercury in freshwater fish in the U.S. is between 0.08 and 0.3 ppmdepending on the size of the fish. For most consumers then, this scenario appears to be unlikely. However, it is known that there are locations in the U.S. where fish concentrations exceed do 1 ppm. The U.S. EPA has found mercury residues in fish at 92 percent of more than 370 surface water bodiestested in the U.S. Mercury levels above 1 ppm were found in at least one fish at 2 percent of the sitessurveyed, and above 0.5 ppm in at least one fish at 15 percent of the sites. Figure 3-4 illustrates thegeographic location of these sites.
The potential for a consumer to be at increased risk from fish consumption is modified by atleast three important factors. First, many States have issued advisories regarding the consumption ofcertain species of fish from certain water bodies on account of mercury contamination. These advisoriesare meant to prevent the public from consuming fish with harmful levels of mercury in them. Thus,exposures to high concentrations are hopefully avoided. (It is known however, that not all anglers heedthis advice.)
Second, most sport anglers fish from a variety of water bodies. Several studies indicate thatmany of these anglers may travel extended distances to fish; they may be traveling to places where fishhave higher or lower mercury concentrations that those nearby. These individuals who consume fishfrom a variety of locations decrease their chance of exposure to methylmercury at toxicologicallysignificant doses because the extent of mercury contamination can differ significantly between waterbodies. Although some areas of the U.S. are known to have fish contaminated with levels above 1 ppm,the national average for freshwater fish is 0.3 ppm based on data from Bahnick et al., (1985).
Third, some members of the population, even though they consume large quantities of fish, arelikely to obtain their fish from both local water bodies and from commercial sources. By eating a varietyof fish in the diet, including fish obtained commercially, it is likely that fish with a range of mercurylevels are being consumed. A consumer may be purchasing fish with lower mercury levels than thoselocally caught. Thus, overall exposure would be reduced. For example, the top ten seafood species allhave methylmercury levels less than 0.2 ppm. These species are listed in Table 3-6. Note however, thatthere are some saltwater species, notably shark and swordfish, that do have elevated levels of mercury. These are not frequently consumed species, but their mercury levels are sufficiently high to havepotential for increased risk if consumed regularly. Consequently, the FDA advises pregnant women, andwomen of childbearing age intending to become pregnant, to limit their consumption of shark andswordfish to no more than once a month.
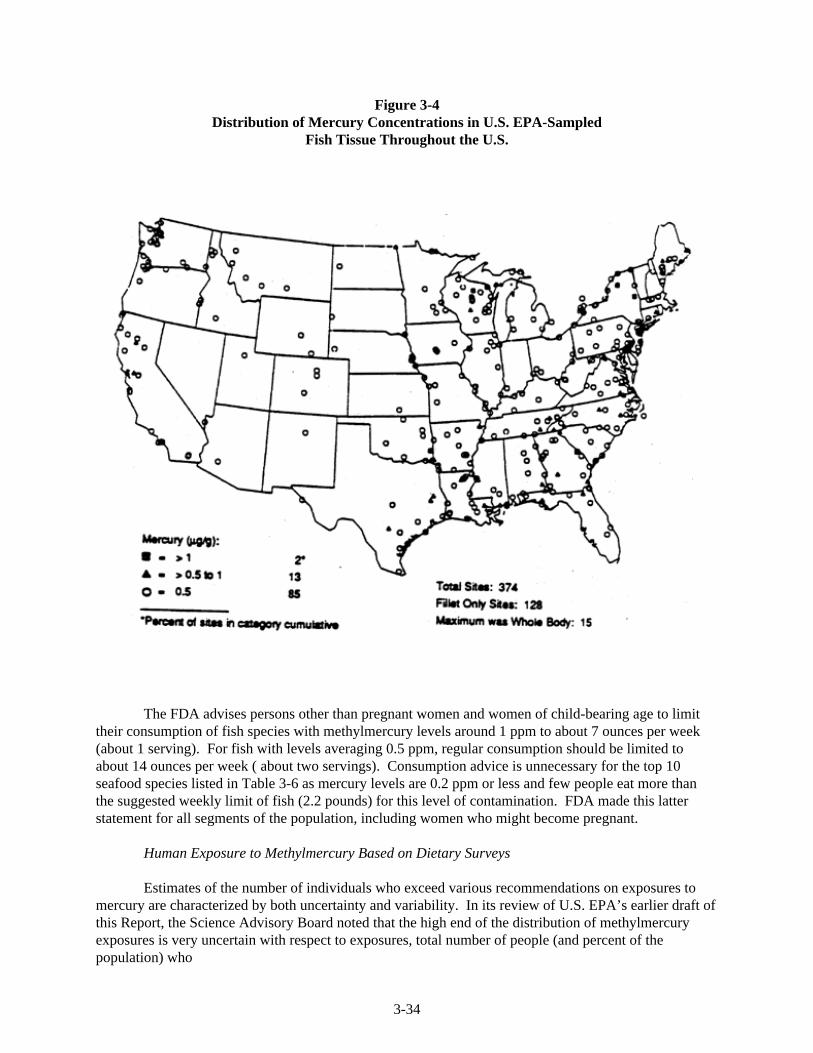
3-34
Figure 3-4Distribution of Mercury Concentrations in U.S. EPA-Sampled
Fish Tissue Throughout the U.S.
The FDA advises persons other than pregnant women and women of child-bearing age to limittheir consumption of fish species with methylmercury levels around 1 ppm to about 7 ounces per week(about 1 serving). For fish with levels averaging 0.5 ppm, regular consumption should be limited toabout 14 ounces per week ( about two servings). Consumption advice is unnecessary for the top 10seafood species listed in Table 3-6 as mercury levels are 0.2 ppm or less and few people eat more thanthe suggested weekly limit of fish (2.2 pounds) for this level of contamination. FDA made this latterstatement for all segments of the population, including women who might become pregnant.
Human Exposure to Methylmercury Based on Dietary Surveys
Estimates of the number of individuals who exceed various recommendations on exposures tomercury are characterized by both uncertainty and variability. In its review of U.S. EPA’s earlier draft ofthis Report, the Science Advisory Board noted that the high end of the distribution of methylmercuryexposures is very uncertain with respect to exposures, total number of people (and percent of thepopulation) who
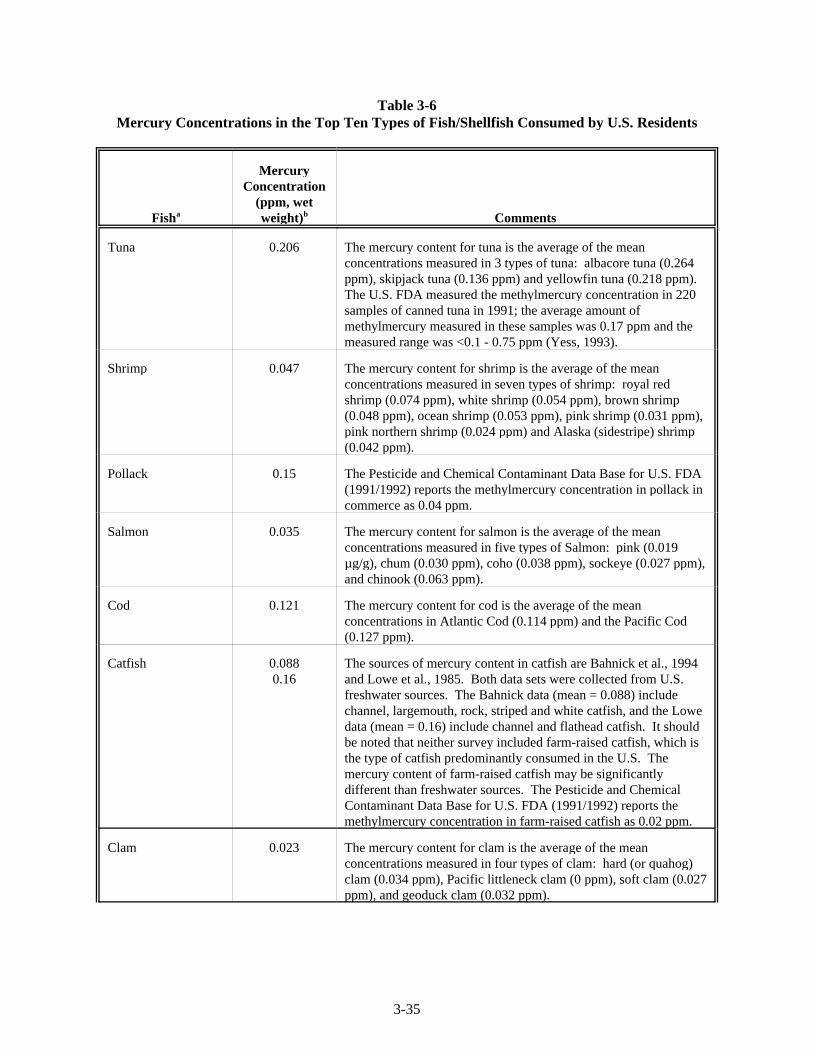
3-35
Table 3-6Mercur y Concentrations in the Top Ten Types of Fish/Shellfish Consumed by U.S. Residents
Fish weight) Commentsa
Mercur yConcentration
(ppm, wetb
Tuna 0.206 The mercury content for tuna is the average of the meanconcentrations measured in 3 types of tuna: albacore tuna (0.264ppm), skipjack tuna (0.136 ppm) and yellowfin tuna (0.218 ppm). The U.S. FDA measured the methylmercury concentration in 220samples of canned tuna in 1991; the average amount ofmethylmercury measured in these samples was 0.17 ppm and themeasured range was <0.1 - 0.75 ppm (Yess, 1993).
Shrimp 0.047 The mercury content for shrimp is the average of the meanconcentrations measured in seven types of shrimp: royal redshrimp (0.074 ppm), white shrimp (0.054 ppm), brown shrimp(0.048 ppm), ocean shrimp (0.053 ppm), pink shrimp (0.031 ppm),pink northern shrimp (0.024 ppm) and Alaska (sidestripe) shrimp(0.042 ppm).
Pollack 0.15 The Pesticide and Chemical Contaminant Data Base for U.S. FDA(1991/1992) reports the methylmercury concentration in pollack incommerce as 0.04 ppm.
Salmon 0.035 The mercury content for salmon is the average of the meanconcentrations measured in five types of Salmon: pink (0.019µg/g), chum (0.030 ppm), coho (0.038 ppm), sockeye (0.027 ppm),and chinook (0.063 ppm).
Cod 0.121 The mercury content for cod is the average of the meanconcentrations in Atlantic Cod (0.114 ppm) and the Pacific Cod(0.127 ppm).
Catfish 0.088 The sources of mercury content in catfish are Bahnick et al., 19940.16 and Lowe et al., 1985. Both data sets were collected from U.S.
freshwater sources. The Bahnick data (mean = 0.088) includechannel, largemouth, rock, striped and white catfish, and the Lowedata (mean = 0.16) include channel and flathead catfish. It shouldbe noted that neither survey included farm-raised catfish, which isthe type of catfish predominantly consumed in the U.S. Themercury content of farm-raised catfish may be significantlydifferent than freshwater sources. The Pesticide and ChemicalContaminant Data Base for U.S. FDA (1991/1992) reports themethylmercury concentration in farm-raised catfish as 0.02 ppm.
Clam 0.023 The mercury content for clam is the average of the meanconcentrations measured in four types of clam: hard (or quahog)clam (0.034 ppm), Pacific littleneck clam (0 ppm), soft clam (0.027ppm), and geoduck clam (0.032 ppm).

Table 3-6 (continued)Mercur y Concentrations in the Top Ten Types of Fish/Shellfish Consumed by U.S. Residents
Fish weight) Commentsa
Mercur yConcentration
(ppm, wetb
3-36
Flatfish (Flounder) 0.092 The mercury content for flounder is the average of the meanconcentrations measured in nine types of flounder: Gulf (0.147ppm), summer (0.127 ppm), southern (0.078 ppm), four-spot(0.090 ppm), windowpane (0.151 ppm), arrowtooth (0.020 ppm),witch (0.083 ppm), yellowtail (0.067 ppm), and winter (0.066ppm).
Crab 0.117 The mercury content for crab is the average of the meanconcentrations measured in five types of crab: blue crab (0.140ppm), dungeness crab (0.183 ppm), king crab (0.070 ppm), tannercrab (C. opilio) (0.088 ppm), and tanner crab (C. bairdl) (0.102ppm).
Scallop 0.042 The mercury content for scallop is the average of the meanconcentrations measured in four types of scallop: sea (smooth)scallop (0.101 ppm), Atlantic Bay scallop (0.038 ppm), calicoscallop (0.026 ppm), and pink scallop (0.004 ppm).
List of fish types from U.S. FDA (1995).a
Mercury concentrations sources are described in the comments, refer to Volume III for complete citations.b
may be experiencing exposures high enough to cause adverse health effects, and the actual subgroupswho are highly exposed. Consequently, the total population at risk is not, and cannot be fullycharacterized at this time.
Because of the uncertainties intrinsic to describing fully the high-end of the distribution, wheremultiple estimates of the size of the highly exposed population are available, a range of values has beenpresented. Predicted high exposures to methylmercury are caused by one of two factors or theircombination: 1) consumption of types of fish which exhibit elevated methylmercury concentrations intheir tissues; and or 2) high consumption rates of methylmercury contaminated fish.
The discussion of the modeling analysis above focused on potential risk to human populationsdue to consumption of fish having relatively high concentrations of mercury. A limitation of themodeling analysis is that the size of the population potentially at increased risk cannot be estimatedbecause hypothetical water body locations and exposure scenarios are employed. The analysis ofmercury exposure using dietary surveys described below is aimed at identifying populations that eatmuch greater amounts of fish than the average consumer. Their potential for increased risk is notnecessarily due to elevated concentrations in fish, it is more a function of the amount of fish consumedon a regular, usually daily, basis. The analysis of the at-risk population eating above average amounts offish focuses on that part of the population which consumes on average 100 grams or more of fish orshellfish per day (approximately 3.5 ounces). The basis for this focus on persons eating 100 grams ormore is a recommendation made by the World Health Organization’s International Programme forChemical Safety (WHO) that populations consuming large amounts of fish and shellfish require specialconsideration. The 100 gram per day recommendation by the WHO can be used as a screening analysisto identify populations potentially at increased risk; particularly risk among pregnant women. The
3-37
significance of the risk is, as mentioned above, is also a function of the methylmercury concentrations ofthe fish consumed. Figure 3-5 illustrates the distribution of fish consumption rates of variouspopulations. As shown in Figure 3-5, the general U.S. population consumes, on average, far less fishthan subsistence fishers and some Native American tribes which have been studied. Figure 3-5 alsoillustrates that some members of the U.S. population do consume fish in large amounts on a daily basis.
The second way dietary surveys were used in this analysis was to calculate methylmercuryexposure over a month-long period. This can be achieved by combining the frequency distribution ofmonth-long patterns of fish/shellfish consumption with dietary data indicating the species of fishconsumed, average values for mercury concentrations in the species of fish consumed, the portion sizeconsumed, and the individuals’ body weights.
The U.S. EPA used two types of dietary surveys to identify these populations. Dietary surveyscan be classified into longitudinal or cross-sectional surveys. Cross-sectional data are used to give a"snap shot" in time and are typically used to provide information on the distribution of intakes for groupswithin the population of interest. Cross-sectional data typically are for 24-hour or 3-day samplingperiods and may rely on recall of foods consumed following questioning by a trained interviewer, or mayrely on written records of foods consumed. The cross-sectional surveys used in this Report were theContinuing Surveys of Food Consumption by Individuals for the periods 1989 to 1991, 1994 and 1995and the third National Heath and Nutrition Examination Survey (NHANES III) conducted between 1988and 1994.
General U.S. Population. NHANES III obtained data on the self-reported month-long frequencyof consumption of fish and shellfish by respondents in this survey. Of the adults surveyed 86 percentreported they ate fish or shellfish at least once during the previous month. Major subgroups in thegeneral population indicated they consumed fish and shellfish more frequently than did the overallpopulation. Among persons who designated themselves as �White/NonHispanic,� 1.9 percent consumedfish/shellfish 6.4 times or more a week. Within the subpopulation of persons who categorizedthemselves as �Black/NonHispanic,� 3.3 percent consumed fish/shellfish 6 times or more per week. Among persons who categorized themselves as �Other� (typically individuals of Asian/Pacific Islanderethnicity, Native Americans, Alaskan Natives, and persons of Caribbean ethnicity), 8.9 percent indicatedthey consumed fish/shellfish 6 times or more a week.
Subpopulations of Concern. Three groups are potentially at increased risk from methylmercury: pregnant women, women of child-bearing age (i.e., between the ages of 15 and 44) and children ages 14and younger. Pregnant women are of concern because of the adverse effects of methylmercury on thefetal nervous system. Women of child-bearing age rather than only pregnant women are of concern fortwo reasons. The first is that methylmercury persists in tissues. Measured half-lives for methylmercuryin adults range from about 1 month to 9 months, although half-lives of just over 2 months are usuallyobserved. Thus, dietary intakes just prior to pregnancy are of concern rather than only methylmercuryintakes during pregnancy. The second reason is that women usually do not know they are pregnant untilthe pregnancy is past many of the critical stages of fetal development.
Children may be at a higher risk of methylmercury exposure than are adults because they appearto have higher exposures on a per kilogram body weight basis, and they may be inherently more sensitivethan adults given the developmental state of the nervous system. In the methylmercury poisoningepidemics in Japan and Iraq, children were affected, as well as adults. These effects were not seen onlyin children exposed to methylmercury in utero, but included children exposed through ingestingmethylmercury from food. Whether or not children differ from adults in sensitivity to methylmercuryneurotoxicity is not known.
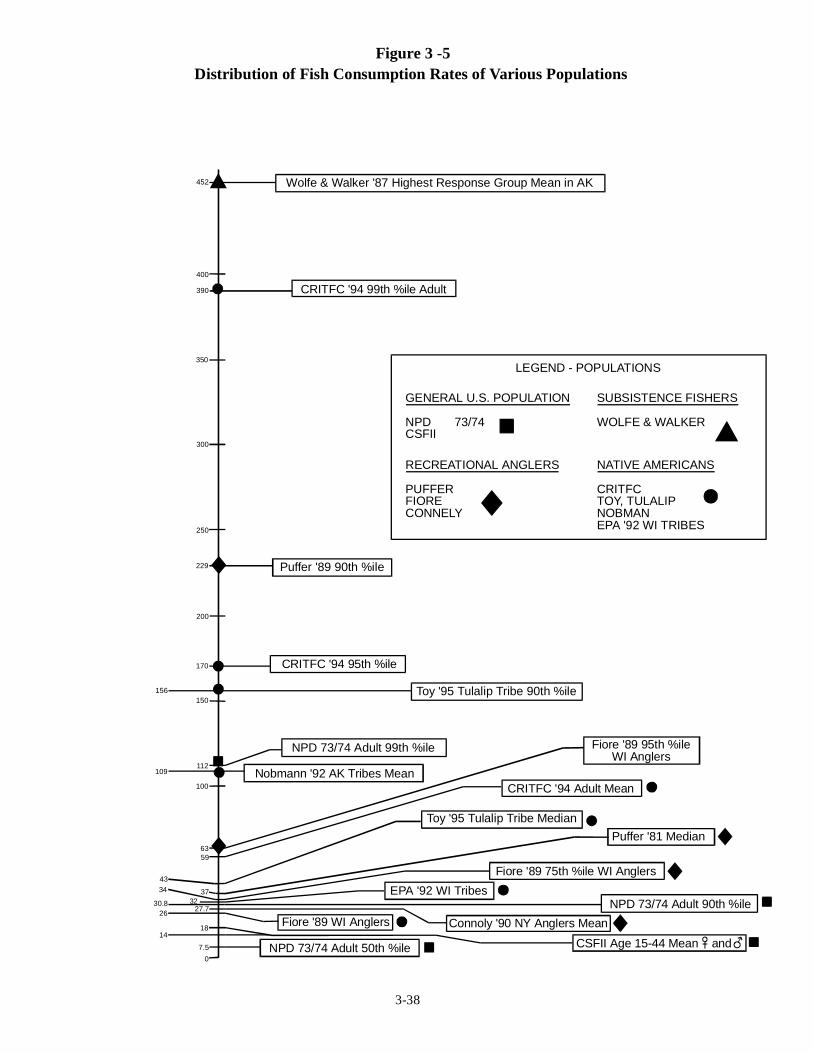
7.5
1418
26 27.730.8 32
34 37
43
5963
100
109112
150156
170
200
229
250
300
350
390
400
452 Wolfe & Walker '87 Highest Response Group Mean in AK
CRITFC '94 99th %ile Adult
Puffer '89 90th %ile
LEGEND - POPULATIONS
GENERAL U.S. POPULATION
NPD 73/74CSFII
RECREATIONAL ANGLERS
PUFFERFIORECONNELY
SUBSISTENCE FISHERS
WOLFE & WALKER
NATIVE AMERICANS
CRITFCTOY, TULALIPNOBMANEPA '92 WI TRIBES
CRITFC '94 95th %ile
Toy '95 Tulalip Tribe 90th %ile
NPD 73/74 Adult 99th %ile
Nobmann '92 AK Tribes Mean
Fiore '89 95th %ileWI Anglers
CRITFC '94 Adult Mean
Toy '95 Tulalip Tribe MedianPuffer '81 Median
Fiore '89 75th %ile WI Anglers
EPA '92 WI TribesNPD 73/74 Adult 90th %ile
Connoly '90 NY Anglers MeanFiore '89 WI Anglers
CSFII Age 15-44 Mean andNPD 73/74 Adult 50th %ile
Figure 3 -5Distribution of Fish Consumption Rates of Various Populations
0
3-38
3-39
Within the subpopulation of women of child-bearing age, it is useful to estimate the number of womenwhose dietary patterns include eating fish and shellfish in amount of 100 grams/day or more. When thedistribution of fish and shellfish intakes among the overall population of women in the United States isconsidered, it appears that approximately 5% of women eat fish and shellfish in amount of 100grams/day or more, on any single day. This type of data provide a distribution across the entirepopulation of women in the United States. However, because mercury is a toxic element thataccumulates in the body over time, it is relevant to know what percent of women consume fish at the 100grams or more level consistently. Using the NHANES III dietary data (including the fish consumptionfrequency data), it was estimated that 3% of women consistently consume 100 grams of fish/shellfish perday or more.
An additional source of information on typically long-term or longitudinal estimates of intake ofmercury from fish and shellfish is a longitudinal survey, the National Purchase Diary, Inc conducted in1973. In this survey the 99th percentile of fish and shellfish consumption among adults was 112 gramsper day.
Based on these three different approaches to estimating the amount of fish and shellfishconsumed on a month-long basis by adult women of childbearing age, it is estimated that between 1 and3 percent of women consistently consume 100 grams or more of fish and shellfish per day. Becauseoccasional ingestion of greater quantities of fish and shellfish may result in very short-term higherexposures, the 5% of women who report consuming 100 grams of fish and shellfish per day (the percapita data) may also be considered for purpose of assessing risk of exposure to mercury from diet.
Census statistics (United States 1990) indicate that within the 48 contiguous states the estimatednumber of women of childbearing age (that is assumed to be 15 through 44 years) was approximately58,222,000. It was estimated that in a given year 9.5 percent of women in this age group are pregnant. Ifthe consumption of 100 grams of fish/shellfish per day or more is used as a screen for concern formercury exposures, it is estimated that between approximately 52,000 and 166,000 pregnant womenconsume fish at these levels (based on 1% of the population from the NPD, Inc, survey and the 3%projection for month-long national estimates of consumption based on NHANES III (1988-1994)).
Estimates of Methylmercury Exposure Based on Dietary Surveys. Exposure to methylmercuryfrom contaminated fish results in an incremental increase in mercury exposure. Methylmercury exposurerates on a per body weight basis among fish-consuming children are predicted to be higher than for fish-consuming adults. Data obtained in the NHANES III permits calculation of national estimates of month-long exposures to mercury from eating fish and shellfish. This can be achieved by combining thefrequency distribution of month-long patterns of fish/shellfish consumption with dietary data indicatingthe species of fish consumed, mean values for mercury concentrations in the species of fish consumed,the portion size consumed, and the individuals’ body weights.
As is the situation with adults, it is uncertain how often children consume fish and shellfishaccording to the patterns that are shown by the 24-hour recall data. In the NHANES III, there are no datafor children which specify how frequently children eat fish/shellfish, although there are such data foradults. Consequently, a simplif ying assumption was made that children of a particular ethnic/racialgroup ate fish as often as the adults of that particular ethnic/racial group. Unlike the frequency data,however, the smaller portion size of fish/shellfish and the different species of fish/shellfish selected bychildren were described with the 24-hour recall data specific for children in NHANES III. In the U.S.EPA’s analysis only the data on frequency of fish consumption was extrapolated from adult data.
Using this approach, month-long estimates of mercury exposure were calculated. The resultsindicate that 7 percent of women ages 15 through 44 years of age exceed the RfD (0.1 µg/kg-bw/day). For 1 percent of women ages 15 through 44 years of age, the month-long estimate of mercury exposure
3-40
was 0.37 µg/kg-bw/day. Some children were also estimated to have exposures of 0.3 ug/kg-bw/day andhigher. As noted above, exposures at or below the RfD are expected to be safe. The risk followingexposures above the RfD are uncertain, but risk increases as exposure to methylmercury increases.
It is important to note that the above estimates of mercury exposure from fish and shellfish arebased on average concentrations of mercury in fish and shellfish usually selected by people. The mostcommonly consumed fish/shellfish were tuna, shrimp, and Alaskan pollock. The typical mixture of fishand shellfish species consumed is associated with an average concentration of mercury in the range of 0.1to 0.15 parts per million. This average mercury concentration for the mixture of fish and shellfishspecies usually eaten is a major factor in determining national estimates of mercury exposure. Theseconcentrations are comparatively lower than found in a number of species of fish.
Consumption of fish with mercury levels higher than average may pose a significant source ofmethylmercury exposure to consumers of such fish. The magnitude of methylmercury exposure varieswith local consumption rates and methylmercury concentrations in the fish. The average mercuryconcentrations measured throughout the inland waters of the U.S. provide an indication of the amounts ofmercury in various freshwater fish. These are provided in Table 2-1.
The exposure analysis described above indicates that some of these methylmercuryconcentrations in freshwater fish species may be elevated as a result of mercury emissions fromanthropogenic sources. As a result, exposures may be elevated as a result of mercury emissions fromanthropogenic sources. Because people may select fish from limited geographic regions where fishmercury concentrations are lower or higher than those present in the general diet, they may experiencequite different mercury exposures than does the general population as described by the national estimatesfrom dietary surveys (e.g., national estimates of month-long consumption projected from NHANES III). Exposures may be elevated among some members of subpopulations of concern; these are evidenced byblood mercury measurements in excess of 10 micrograms per liter of whole blood that have beenreported among multiple freshwater fish-consuming subpopulations.
Hair Mercury Measurements
Actual measurements of hair mercury levels would be an additional to assess mercury exposureand risk because mercury exposure is reflected by hair mercury levels. Because fish are the primaryexposure pathway for methylmercury there is a broad-based scientific literature describing increases inhair mercury concentrations with increases in fish consumption. Maternal hair mercury concentrationspredict mercury concentrations in fetal brain, fetal blood, umbilical cord blood and newborn hair.
The WHO has concluded that the general population of adults (males and non-pregnant females)does not face a significant health risk from methylmercury when hair mercury concentrations are under50 µg mercury/gram hair. However, in recent evaluations of the Niigata epidemic of Minamata disease,study authors reported lower thresholds with mean values in the range of 25 to approximately 50 µgmercury/gram hair.
In addition, clinical observations in Iraq suggest that women during pregnancy are moresensitive to the effects of methylmercury with fetuses at particularly increased risk. The WHO analyzedthe Iraqi data and identified a 30 percent risk to the infant of abnormal neurological signs when maternalhair mercury concentrations were over 70 µg/g. Using an additional statistical analysis, WHO estimateda 5 percent risk of neurological disorder in the infant when the maternal hair concentration was 10 to 20µg mercury/gram of hair.
Although data on hair mercury concentrations from a sample representative of the United Statespopulation with adequate documentation of quality assurance/quality control do not exist, data from
3-41
individual studies conducted within the United States are available and are discussed in the Volume onexposure (Volume IV) and in the risk characterization Volume (Volume VII). These surveys wereconducted in widely diverse geographic areas within the United States. The mean hair mercuryconcentrations identified for subjects in these studies are typically under 1 �g/g or 1 ppm. There are anumber of uncertainties surrounding this value which are discussed in the risk characterization Volume. The maximum values reported in these individual surveys conducted in widely diverse geographic areasof the United States range from 2.1 to 15.6 ppm.
Hair mercury concentrations of 1 ppm or less are associated with dietary intakes of mercury ofan estimated 0.1 µg/kgbw/day which is also the RfD. These mercury concentrations correspond to hairmercury concentrations associated with fish consumption at the level of less than one meal per month toone meal per week. Based on the higher hair mercury concentrations reported in additional studies ofsubpopulations expected to have higher than usual consumption of fish and shellfish, dietary intake ofmercury considerably in excess of the RfD also occurs among some members of the United Statespopulation.
Until appropriate survey data for the general United States population exist, the overalldistribution of hair mercury concentrations for the United States remains unclear. For adequateprediction of methylmercury exposure for the general United States population, the data should beobtained from subjects who are chosen based on a sampling strategy that can be extrapolated to theUnited States population, and must include appropriate quality assurance/quality control procedures.
Summary of the Risk Characterization
In summary, conclusions that can be drawn from the risk characterization are these.
� There is evidence from measurement data and modeling analyses that past and presentemissions and releases of mercury from industrial sources can be plausibly linked withincremental increases in environmental mercury concentrations, including fishmethylmercury levels in surface waters in the U.S.
� One U.S. EPA study found mercury levels above 1 ppm in at least one fish at 2 percentof the sites surveyed, and above 0.5 ppm in at least one fish at 15 percent of the sites. U.S. emissions contribute to local, regional and global atmospheric mercury and theresulting deposition to the oceans and land. These emissions ultimately contribute tototal mercury loads in fish, since elemental mercury in the environment is neither creatednor destroyed. Because mercury methylation and subsequent uptake in fish is complexand not well understood, it cannot be assumed that a change in total mercury emissionswill be linearly related to any resulting change in methylmercury in fish, even taking intoaccount the role of natural and old anthropogenic sources.
� The typical U.S. consumer eating fish from restaurants and grocery stores is not in
danger of consuming harmful levels of mercury from fish and is not being advised tolimit fish consumption. The levels of mercury found in the most frequently consumedcommercial fish are generally low, especially compared to levels that might be expectedin some non-commercial fish from fresh water bodies that have been affected bymercury emissions.
� While most U.S. consumers need not be concerned about their exposure to mercury,some exposures may be of concern. Those who regularly and frequently consume largeamounts of fish -- either marine species that typically have much higher levels of
3-42
mercury than the rest of seafood or freshwater fish that have been affected by mercurypollution -- are the most highly exposed. Since the developing fetus may be moresensitive to the effects of mercury in fish, women of child-bearing age are as thepopulation of greatest interest.
� In this Report, an analysis of dietary surveys led the U.S. EPA to conclude that between1 and 3 percent of the women of child-bearing age (i.e., between the ages of 15 and 44)eat sufficient amounts of fish to be at risk from mercury exposure depending on themercury concentrations in the fish. In addition, some Native Americans or subsistencefishers do consume fish in these large quantities for cultural or economic reasons. Theseconsumers should be aware of the FDA and State fish advisories that suggest limiting theconsumption of contaminated fish.
Limitations of the Risk Characterization
The primary purpose of the Mercury Study Report to Congress was to assess the impact of U.S.anthropogenic emissions on mercury exposure to humans and wildlife. The size of some populations ofconcern have been estimated; namely women of child�bearing age and children who eat fish. In thegeneral population, people typically obtain their fish from many sources. The question on whether or notthe impact of mercury from anthropogenic ambient emissions can be proportioned to the overall impactof methylmercury on wildlife is a much more difficult issue.
As with environmental monitoring data, information on body burden of mercury in populationsof concern (blood and/or hair mercury concentrations) are not available for the general U.S. population. Data on higher�risk groups are currently too limited to discern a pattern more predictive ofmethylmercury exposure than information on quantities of fish consumed. The selenium content ofcertain foods has been suggestive as a basis for modifying estimates of the quantities of methylmercurythat produce adverse effects, although there is no consistent evidence that selenium is protective againstthe neurotoxicity of methylmercury. Experimental investigations under controlled conditions indicatedthat feline species developed neurotoxicity from methylmercury as severely and as rapidly if themethylmercury was present naturally in fish or added as chemically pure methylmercury to the animals’diet. Currently, data on this mercury/selenium association form an inadequate basis to modifyquantitative estimates of human response to a particular exposure to mercury.
Available data for human health risk assessment have limitations as described in the Report andin this summary. Studies of human fish-consuming populations in the Seychelles and Faroes Islandsaddress some of these limitations. Additional studies on U.S. populations who consume fish from theGreat Lakes are in progress, as well as, additional studies currently in review and expected to bepublished during the period 1997/1998. Public health agencies of the U.S. government and the U.S. EPAwill evaluate these new data when they are available.
The benchmark dose methodology used in estimating the RfD required that data be clustered intodose groups. Most data on neurologically based developmental endpoints are continuous; that is, notassigned to dose groups. For example, scoring on scales of IQ involves points rather than a "yes/no"type of categorization. Measurements on the degree of constriction of the visual field involve a scalingrather than a "constricted/unconstricted" type of variable. Although arbitrary scales can be constructed,these groupings have generally not been done in current systems. Use of alternative dose groupings (asdescribed in Volume IV) had no significant effect on calculated benchmark doses. An additionaldifficulty occurs in estimation of benchmark dose for multiple endpoints that have been measured. Further research on appropriate methods for mathematical modeling is needed. For some situations suchinformation is known, but for methylmercury exposure and multiple endpoints assessing the same system

3-43
(i.e., developmentally sensitive neurological, neuromotor and neuropsychological effects) thetime�course/dose�response of such changes have not been clearly established. Development of themathematical models needs to be accompanied by understanding the physiological/pathologicalprocesses of methylmercury intoxication.
How Much Methylmercury Exposure is Harmful to Wildlife and What Are the Effects?
Massive poisonings of birds and wildlife from methylmercury�treated seed grains wereidentified during the decades preceding the 1970s. These findings resulted in substantial limitation onuse of methylmercury�treated seed grains. However, methylmercury contamination of the aquaticfoodchain from many sources continues to adversely affect wildlife and domestic mammals and wildbirds. In Minamata, Japan from about 1950�1952 (prior to recognition of human poisonings) severedifficulties with flying and other grossly abnormal behavior was observed among birds. Signs ofneurological disease including convulsions, fits, highly erratic movements (mad running, suddenjumping, bumping into objects) were observed among domestic animals, especially cats that consumedseafood.
Generally the place of wildlife in the aquatic foodchain of the ecosystem and their feeding habitsdetermine the degree to which the species is exposed to methylmercury. Fish�eating (piscivorous)animals and those which prey on other fish�eaters accumulate more mercury than if they consumed foodfrom terrestrial food chains. In a study of fur�bearing animals in Wisconsin, the species with the highesttissue levels of mercury were otter and mink, which are top mammalian predators in the aquatic foodchain. Top avian predators of aquatic food chains include raptors such as the osprey and bald eagle. Smaller birds feeding at lower levels in the aquatic food chains also may be exposed to substantialamounts of mercury because of their high food consumption rate (consumption/day/gram of bodyweight) relative to larger birds.
Laboratory studies under controlled conditions can be used to assess the effects ofmethylmercury from fish on mink, otter and several avian species. Effects can occur at a dose of 0.25µg/g bw/day or 1.1 µg/g methylmercury in diet. Death may occur in species at 0.1�0.5 µg/g bodyweight/day or 1.0�5.0 µg/g in the diet. Smaller animals (for example, minks, monkeys) are generallymore susceptible to mercury poisoning than are larger animals (for example, mule deer, harp seals). Smaller mammals eat more per unit body weight than larger mammals. Thus, smaller mammals may beexposed to larger amounts of methylmercury on a body weight basis.
Whole body residues of mercury in acutely poisoned birds usually exceed 20 µg/g fresh weight. Although sublethal effects include a number of different organ systems, reproductive effects are theprimary concern. These occur at concentrations far lower than those that cause overt toxicity.
The broad ecosystem effects of mercury are not completely understood. No applicable studies ofthe effects of mercury on intact ecosystems were found. Consequently, characterization of risk fornon�human species did not attempt to quantify effects of mercury on ecosystems, communities, orspecies diversity. The characterization focused on quantities of mercury that adversely affects the healthof sensitive subpopulations of wildlife species and on the co�location of these populations with areas ofelevated mercury exposure secondary to ambient, anthropogenic emissions of methylmercury. To thisend wildlife criteria (WC) were calculated for four piscivorous birds and two mammals (see Table 3-8). The WC is a methylmercury level in water which is expected to be without harm for the species. TheWC considers the bioaccumulation of methylmercury in the large and small fish eaten by the mammalsor birds. A bioaccumulation factor (BAF) was used in the WC calculation; the BAF was based on dataon methylmercury in fish and the water from which they were taken. A review of literature from the lastseveral years suggests that there is now sufficient information available to estimate BAFs for

3-44
methylmercury. Previously, it was thought that much of the variation around BAFs estimated on a totalmercury basis could be attributed to differences among water bodies in the proportion of total mercuryexisting as the methylated form. The goal of the present analysis was to calculate a WC for thebioaccumulating form of mercury, thereby yielding an estimate with the lowest possible variation aroundthe mean. The effects data for mammals were from a short-term study of neurotoxicity in mink. Thedata for fish�eating birds were from a three�generation study in mallard ducks.
The evaluation of data and calculation of WC in this Report was done in accordance with themethods and assessments published in the Final Water Quality Guidance for the Great Lakes System: Final Rule. Availability of additional data led to differences in calculated values of the WC in thisReport and those published in the final rule. Differences were the result of several factors. First, thisReport uses more recent data to derive BAFs. The Supplementary Information Document to the finalWater Quality Guidance for the Great Lakes System noted that a preliminary draft of the Mercury Reportto Congress was available but was not used because it had not been completed at the time the finalguidance was published. Second, the Guidance appropriately used some region-specific assumptionsthat were not used in this nationwide assessment (e.g., consumption of herring gulls by eagles). Third,different endpoints were used. In the Guidance, a risk-management decision was made to base the WCon endpoints that compare direct effects on growth, reproduction, or development. In this Report, moresensitive endpoints were considered with the goal of assessing a greater range of toxic effects. Finally,different uncertainty factors were employed in the two assessments. In general, uncertainty factors usedin the GLWQI are more conservative than those used in this Report.
Table 3-7Wildlife Criteria for Methylmercury
Organism Wildlife Criterion (pg/L)
Mink 57
River otter 42
Kingfisher 33
Loon 82
Osprey 82
Bald eagle 100
Derivation of a WC to protect the Florida panther is complicated by the possibility that preyitems (e.g., raccoon) accumulate mercury to an even greater extent than the fish represented by trophiclevel 4. Other prey (e.g., deer) probably contain relatively lower levels of mercury. Calculation of a WCprotective of the panther, therefore, requires collection of additional information on the diet of thisspecies and mercury residues in that diet. Existing data are insufficient to support such an analysis. Achronic NOAEL for domestic cats was reported to be 20 �g/kg/d. This is close to that of 5.5 �g/kg/destimated for mink (that is, the subchronic NOAEL of 55 �g/kg/d divided by a UF of 10). Cats (ands
presumably larger felines) do not, therefore, appear to be uniquely sensitive or insensitive to the toxiceffects of mercury.
Methylmercury (as described in Volumes V and VI of this Report) has deleterious effects on thechordate nervous system. The human health endpoint of concern is developmental neurotoxicity. The
3-45
health endpoints of concern for the avian wildlife species are reproductive and behavioral deficits and forthe mammalian quadrupeds are neurological effects. Assuming that the effects are of similar concern forthe well-being of individuals within a species, the NOAELs, LOAELs and the human and wildlife WCsfor these health endpoints can then be compared across species.
The human benchmark dose of 11 ppm mercury in hair was considered operationally equivalentto a NOAEL in the derivation of the methylmercury RfD. A LOAEL of 52.5 ppm mercury in hair wasestimated for purposes of this risk characterization from inspection of data in Table 5-4 of Volume VI. The NOAEL of 11 ppm mercury in hair and the LOAEL of 52.5 ppm mercury in hair correspond toingestion levels of 1 �g/kg-day and 5.3 �g/kg-day, respectively; these dose conversions were made byapplying the methods for converting hair mercury concentrations to ingestion levels used in thederivation of the RfD in Volume IV of this Report.
The avian RfD was based on the data from a series of studies by Heinz and collaborators onmallard ducks. A NOAEL could not be identified. The estimated LOAEL, based on reproductive andbehavioral effects, was 78 �g/kg bw/day. The mammalian RfD was based on the data from a series ofstudies by Wobeser and collaborators done on ranch mink. A NOAEL of 55 �g/kg bw/day wasestimated from these studies. The estimated LOAEL, based on damage to the nervous system and liver,was 180 �g/kg bw/day.
Based on the data developed for the health assessment, the human LOAEL and RfD are orders ofmagnitude lower than the corresponding LOAELs and RfD of the other animals. There is a great deal ofuncertainty in this comparison. It must be noted that the effects in humans are based on the RfDdefinition of a critical effect; that is the most sensitive reported adverse effect or indicator of adverseeffect. The effects reported for mammals (i.e., neurologic damage in the mink) and birds (i.e.,reproductive effects in mallards) would be considered frank effects in the human RfD methodology. Theobservations in laboratory animals indicate that it would be reasonable to expect more subtle and lessdamaging effects of methylmercury to occur at lower doses than the wildlife LOAEL and NOAEL.
The information assessed in this Report suggests that ecosystems most at risk from airbornereleases of mercury exhibit one or more of the following characteristics:
� They are located in areas where atmospheric deposition of mercury is high;
� they include surface waters already impacted by acid deposition;
� they possess characteristics other than low pH that result in high levels ofbioaccumulation; and/or
� they include sensitive species.
The adverse effects of methylmercury on wildlife have been described and quantified. For wildlife theimportance of site�specific effects of mercury exposure are anticipated to be greater than for humans inthe general population because wildlife obtain their fish from a much more limited geographic area thando people.
Limitations of the Wildlife Assessment
There is uncertainty and variability associated with each WC. These include lack of long-termstudies for mammals, lack of a no adverse effects level for birds, and extrapolation from one species toanother. It is not known if the species selected for WC development are the most sensitive or appropriate
3-46
species; also, it is not known if protecting individual animals or species will guarantee protection of theirecosystem from harmful effects of mercury. There are uncertainties and expected variability in the BAF;it was the subject of a quantitative uncertainty analysis.
For wildlife risk assessment, as for humans, mercury toxicity among wildlife involvesneurological effects. Available toxicology data from laboratory�based studies of wildlife exposed tomethylmercury have measured only gross clinical signs and symptoms of disease and death orpathological changes accompanying these clinically evident changes. Physiologically based evaluationof wildlife has not been done. The importance of more subtle endpoints of neurological function isanticipated to be relevant to such practical questions as the ability of visual hunters such as the loon tofind food.
The risk assessment for wildlife made the assumption that the primary source of mercuryexposure to the selected species was contaminated fish. Since mercury bioaccumulation is largelythrough aquatic ecosystems, it is reasonable to focus attention on wildlife species whose feeding habitsare tied to these systems. Existing data permit a general treatment of mercury exposure and effects onsuch populations. For some species, such as the kingfisher and river otter, it can be reasonably assumedthat fish always comprise a high percentage of the diet. For others, such as the eagle and mink,considerable variations in diet are likely to exist. Still others, such as the Florida panther, consume prey(such as the raccoon) which consume variable amounts of aquatic biota, but which in South Florida areclosely linked to the aquatic food chain. A more accurate characterization of the risk posed by mercuryto a specific group of animals occupying a given location will depend on the collection of necessarysupporting information: food habits, migratory behavior, breeding biology, and mercury residues inpreferred prey items.
To improve the characterization of risk, research needs highlighted in the preceding sectionsshould be addressed. Additional work to decrease uncertainty should be directed toward the exposureassessment. Validated local and regional atmospheric fate and transport models are needed. This shouldutilize long-term national monitoring networks. Data to improve understanding of movement of mercurythrough environmental media are also needed. The bioaccumulation factors are major sources ofuncertainty. This uncertainty will be decreased by improved data to use in the parameters of thebioaccumulation factor equations and by increased understanding of mercury biogeochemistry in waterbodies.

4-1
4. MANAGEMENT ALTERNATIVES
Possible Control Strategies
Effective control of mercury emissions may require a mix of strategies. The four major types ofcontrol techniques reviewed include:
� Pollution prevention measures, including product substitution, process modification andmaterials separation;
� Coal cleaning;
� Alternative approaches; and
� Flue gas treatment technologies.
Table 4-1 summarizes mercury control techniques for selected source categories. Pollution preventionmay be suitable for those processes or industries where a mercury substitute is demonstrated andavailable (e.g., mercury cell chlor-alkali plants). Another pollution prevention measure is materialseparation, which may be an appropriate approach for processes where mercury-containing products aredisposed of by incineration, or where mercury can be reduced in the fuel prior to the fuel beingcombusted (e.g., medical waste incineration). Conventional regulatory strategies may be applicablewhen mercury is emitted to the environment as a result of trace contamination in fossil fuel or otheressential feedstock in an industrial process (e.g., cement manufacturing). Other non-traditionalapproaches such as emissions trading or other market-based approaches may also prove feasible formercury control. In addition, emissions control is only one possible means for reducing humanexposure. For example, the issuance of fish advisories (or increased public education about advisoriesalready in place) is an alternative that would need to be explored when selecting among strategies forreducing risks to human health (though not to ecosystems).
Cost-effective opportunities to deal with mercury during the product life-cycle, rather than just atthe point of disposal, need to be pursued. A balanced strategy which integrates end-of-pipe controltechnologies with material substitution and separation, design-for-environment, and fundamental processchange approaches is needed. In addition, international efforts to reduce mercury emissions as well asgreenhouse gases will play an important role in reducing inputs to the global reservoir of mercury.
As noted above, because of the current, limited scientific understanding of the environmentalfate and transport of this pollutant, it is not possible to quantify the contribution of U.S. anthropogenicemissions relative to other sources of mercury, including natural sources and re-emissions from theglobal pool, on methylmercury levels in fish consumed by the U.S. population. Mercury methylation andsubsequent uptake in fish is complex and not well understood. As a result, it cannot be assumed that achange in total mercury emissions will be linearly related to any resulting change in methylmercury infish, nor over what time period these changes would occur. This is an area of ongoing study.
The analyses of control technologies and costs presented in this Report are not intended toreplace a thorough regulatory analysis, as would be performed for a rulemaking. The informationpresented is

4-2
Table 4-1Summary of Mercury Control Techniques for Selected Source Types
Mercury Control Applicable Source Estimated Mercury Cross-Media Other Pollutants CommentsTechnique Type Removal Efficiency Impacts? Controlleda
Product substitution (e.g., MWCs, MWIs Variable, depending on the Yes Could include other � Product substitution has reduced the use of mercurybatteries, fluorescent lights) extent of substitution components of mercury-in household batteries
containing batteries,fluorescent lights andother products
� Use of mercury-containing fluorescent lights hasincreased because of their energy efficiency, butlower mercury content is being achieved
� The impact of product substitution to other areasdepends on specific circumstances, includingtechnical and economic feasibility
Process modification Mercury cell chlor- 100% Yes None directly � In 1994, about one-half of the chlor-alkali plantsalkali plants used mercury-free processes
� Because the membrane cell process has lowerelectricity demands than the mercury cell process,plant conversion results in an energy savings
� Additional savings presumably also result byavoiding costs of recycling or disposing ofmercuric wastes
Materials separation MWCs and MWIs Variable, depending on the Yes Could include other � Separation of low-volume materials containingextent of separation components of mercury- high mercury concentrations (e.g., batteries,
containing wastes fluorescent lights, thermostats and other electricalburned in MWCs or items) can reduce mercury input to a combustorMWIs without removing energy content of the waste
stream
� Household battery separation has beenimplemented by several communities; programefficiency ranges from 3 to 25 percent
� Material separation programs at hospitals have beensuccessful

Table 4-1 (continued)Summary of Mercury Control Techniques for Selected Source Types
Mercury Control Applicable Source Estimated Mercury Cross-Media Other Pollutants CommentsTechnique Type Removal Efficiency Impacts? Controlleda
4-3
Carbon filter beds MWCs, utility 99% Yes Residual organic � Currently applied to five full-scale power plants inboilers, industrial compounds, other heavy Germany, and planned to be installed on fiveboilers metals, S0, acid gases hazardous waste incinerators in Europe2
� Technically feasible to other sources, such asMWIs or smelters, but has not been applied
� Potential negative effects associated with thedisposal of spent carbon and the potential for firesin the bed
Wet scrubbing MWCs, MWIs, Can be >90% for water- Yes Acid gases, metals, � Have not been applied to MWCs in the U.S.,boilers soluble species; limited for particulate matter, although they have been used at MWCs in Europe
elemental mercury dioxins, furans and MWIs in the U.S.
� 25 percent of coal-fired boilers currently have wetscrubbers
� Requires treatment of wastewater prior to disposal
� May form more toxic, lesser-chlorinated dioxin andfuran congeners
Depleted brine scrubbing Chlor-alkali plants 98% Yes None � Very little information is available on thistechnique
Treated activated carbon Chlor-alkali plants 90% Yes Residual organic � Very little information is available on thisadsorption compounds, other heavy technique
metals, SO, acid gases2� In 1984, carbon bed systems were in use at 8 of the
20 chlor-alkali plants in operation in the U.S. atthat time

Table 4-1 (continued)Summary of Mercury Control Techniques for Selected Source Types
Mercury Control Applicable Source Estimated Mercury Cross-Media Other Pollutants CommentsTechnique Type Removal Efficiency Impacts? Controlleda
4-4
Selenium filters Primary copper 90% Yes Particulate matter, acid � Factors that influence performance include inletsmelters, primary gases mercury concentrations, flue gas temperature andlead smelters, and flue gas dust content(more limited)MWCs, crematories,power plants
� Four known applications at smelters as well as aMWC and a crematory in Sweden; knowninstallation at a German power plan; potentiallyapplicable to MWIs
� Spent filter containing selenium and mercury mustbe landfilled after use
� More information needed on the possibility ofselenium being emitted from the filter itself
Activated carbon injection MWCs, MWIs, 50-90+% Yes Chlorinated dioxins and� Activated carbon injection efficiencies reported forutility boilers furans, potentially other utility boilers are based on pilot-scale data and as
semi-volatile organics such have a high degree of uncertainty
� Factors that influence performance include flue gastemperature, amount of activated carbon injected,type of particulate matter collector, concentrationand species of mercury in flue gas and type ofcarbon used
� Addition of carbon could have significant impacton amount of particulate matter requiring disposalfrom utility boilers, but not from MWCs or MWIs
For the purpose of this table, cross-media impacts refer to the potential to transfer and release mercury to media other than air, such as soil, ground water, and surface water. For example,a
carbon filter beds and wet scrubbers remove mercury from air emissions but result in the generation and disposal of mercury-containing solid and liquid wastes, respectively. In the case ofproduct substitution, cross-media impacts refer to the potential to decrease airborne emissions of mercury at one site but increase such emissions elsewhere.

4-5
intended to present the range of available options and provide a relative sense of the extent of mercuryreductions achievable and the general magnitude of the cost of such reductions.
Pollution Prevention Measures
One possible means of achieving reductions in mercury emissions is through the use of pollutionprevention or source reduction. Such approaches to achieving reductions involve changes in processes orinputs to reduce or eliminate emissions of mercury from a particular product or process. They couldinclude, for example, the replacement of mercury with an appropriate substitute or the use of low-mercury constituents.
In considering opportunities for pollution prevention or source reduction it is important toconsider both the potential reductions achievable and the costs of these options. Any consideration ofthe potential reductions, should examine whether (and the extent to which) emission reductions from theparticular sources in question will yield reductions in risk to public health and the environment. It is alsoessential to understand the costs associated with implementing a pollution prevention measure, includingany changes in the quality of the end product.
Removing mercury-containing products such as batteries, fluorescent lights and thermostatsfrom the waste stream can reduce the mercury input to waste combustors without lowering the energycontent of the waste stream. The mercury removal efficiency would vary, however, depending on theextent of the separation. Many materials in wastes contain mercury. Materials that comprise a largeportion of the waste stream, such as paper, plastic, dirt and grit and yard waste, contain very lowconcentrations of mercury. Therefore, obtaining appreciable mercury reduction from separation of thesetypes of materials would require separating a large fraction of the total waste stream. Separating thesematerials would counter the intended purpose of the combustion process, which is to disinfect and reducethe volume of waste materials.
Other materials contain higher concentrations of mercury, but make up only a very small portion(less than 1 percent )of the total waste stream. These materials include mercuric oxide batteries,fluorescent lights, thermostats and other electrical items. Separation of such materials can reducemercury input to a combustor without removing any of the energy content of the waste stream. Toevaluate a materials separation program, the feasibility and costs of separating a particular materialshould be compared with the mercury emission reduction achieved. Furthermore, the current and futuremercury reduction achieved by separating a certain material should be considered since the mercurycontent of some items such as household batteries has already declined considerably.
Coal Cleaning
Coal cleaning is another option for removing mercury from the fuel prior to combustion. In somestates, certain kinds of coal are commonly cleaned to increase its quality and heating value. Approximately 77 percent of the eastern and midwestern bituminous coal shipments are cleaned in orderto meet customer specifications for heating value, ash content and sulfur content. Any reduction inmercury content achieved by coal cleaning results in a direct decrease in mercury emissions from theboiler. The mercury removed by cleaning processes is transferred to coal-cleaning wastes, which arecommonly in the form of slurries. No data are available to assess the emissions of mercury from coal-cleaning slurries.
Volume II of this Report (An Inventory of Anthropogenic Mercury Emissions in the UnitedStates) presents available data on the mercury concentrations in raw coal, cleaned coal and the percentreduction achieved by cleaning. These data, which cover a number of different coal seams in four states(Illinois, Pennsylvania, Kentucky and Alabama), indicate that mercury reductions range from 0 to 64
4-6
percent, with an overall average reduction of 21 percent. This variation may be explained by severalfactors, including different cleaning techniques, different mercury concentrations in the raw coal anddifferent mercury analytical techniques. It is expected that significantly higher mercury reductions canbe achieved with the application of emerging coal preparation processes. For example, in one bench-scale study, five types of raw coal were washed by conventional cleaning methods followed by columnfroth floatation or selective agglomeration. Conventional cleaning and column froth flotation reducedmercury concentrations from the raw coals by 40 to greater than 57 percent, with an average of 55percent. Conventional cleaning and selective agglomeration reduced mercury concentrations from theraw coals by greater than 63 percent to 82 percent, with an average of 68 percent. In a second bench-scale study in which three types of coals were cleaned with a heavy-media-cyclone (a conventionalcleaning method) followed by a water-only-cyclone and a column froth flotation system, mercuryconcentrations in the raw coal were reduced by as much as 63 to 65 percent. Bench-scale testing is alsobeing carried out by DOE to investigate the use of naturally occurring microbes to reduce mercury (andother trace elements) from coal.
Alternative Approaches
There are a variety of flexible approaches for reducing the emissions of hazardous air pollutants. These include incentive- or market-based systems, “co-control,” and energy conservation and renewableenergy initiatives.
Incentive-based systems are tools that provide industry with more flexibility than traditionalregulatory programs. In such a system, the regulatory agency generally sets a ceiling on allowableemissions (a cap) for each source along with clear and certain penalties for missing the target, butregulated entities have complete choice in how these targets will be met. The cost to industry isdetermined by the market and by the innovation used in meeting the cap. Emissions cap programs allowfor increased incentives because sources that reduce emissions below their cap can sell the surplusreduction to sources that cannot achieve their cap. Trading is promising where sources have differentcompliance costs, or where local environmental impacts are minimal. Sources that reduce emissionsbefore they are required to do so can “bank” the excess reductions and save them for later. Examples ofexisting market-based programs include the SO2 allowance trading and NOx averaging programsimplemented under Title IV of the CAA Amendments to reduce acid deposition; the Regional Clean AirIncentives Market Program and Rules developed in California to reduce emissions of NOx, SOx, andreactive organic compounds; and U.S. EPA’s Lead Trading Program designed to reduce the emissions oflead from gasoline in the mid-1980's.
Incentive-based systems to reduce mercury emissions, either through regulation or voluntarymeans, may be attractive to utilities and other facilities for several reasons: to reduce mercury emissionsat a lower per unit cost, to insure against future regulation, to reduce the compliance costs of regulation,to bank credits toward future regulatory requirements, to build experience with technology and todemonstrate environmental leadership. Also, incentive-based programs could provide financing for thecontrol of mercury among different industries (and potentially other countries) and may be a viableoption for utilities and other sources where cost-effective technologies have yet to be identified.
Co-control refers to the control of mercury by control devices or other management measuresthat were designed or prescribed to limit the emissions of pollutants other than mercury. Co-control canalso be achieved through the implementation of the National Ambient Air Quality Standards (NAAQS)for ozone and particulate matter (PM). In support of the revised ozone and PM NAAQS, the U.S. EPAconducted numerous detailed analyses to predict what control approaches industry might use to achievethe new standards. Fuel switching, in which one fuel is switched to another (e.g., high-sulfur coal to low-sulfur coal, or coal to natural gas) to achieve emissions reductions, is also an alternative to direct control.
4-7
U.S. EPA estimates that implementation of the New Fine Particle Standard for ambient airquality through a regional control strategy that significantly reduces SOx below the CAA’s Title IVrequirements can indirectly lower forecasted mercury emissions in 2010 by about 11 tons from electricpower generation by units burning fossil fuels. This reduction occurs from both the additions of flue gasdesulfurization units (scrubbers) at coal-fired boilers to lower SOx emissions and through greaterreliance by the power industry on producing electricity from natural gas as another way to reduce SOx. In the Regulatory Impact Analysis for the new NAAQS, U.S. EPA estimated that in 2010 a regional SOxreduction strategy for the electric power industry to lower fine particle formation will lead to theinstallation of scrubbers on additional 60 GWs of coal-fired capacity (increasing forecasted scrubbercapacity under Title IV by about two-thirds). U.S. EPA assumes that scrubbers remove close to 30percent of the mercury contained in coal flue gas. U.S. EPA also estimated that electricity producedfrom natural gas would increase by 16 percent above baseline levels. Natural gas combustion producesnegligible levels of mercury emissions.
Title IV of the CAA also encourages energy conservation measures and use of renewable energyas a long-term strategy for reducing air pollution and other adverse effects of energy production and use. Renewable energy is defined as energy that is derived from biomass, solar, geothermal or wind.
Flue Gas Treatment Technologies
Most metals have sufficiently low vapor pressures at typical air pollution control deviceoperating temperatures that condensation onto particulate matter is possible. Mercury, on the other hand,has a high vapor pressure at typical control device operating temperatures, and collection by particulatematter control devices is highly variable.
In Volume VIII of this Report (An Evaluation of Mercury Control Technologies and Costs),add-on controls to reduce mercury emissions are described in detail including information on commercialstatus, performance, applicability to the specified mercury emission sources, and secondary impacts andbenefits. The controls described are:
� Carbon filter beds;� Wet scrubbing for waste combustors and utility boilers;� Depleted brine scrubbing;� Treated activated carbon adsorption; � Selenium filters; and � Activated carbon injection.
The most important conclusions from the assessment of flue gas treatment technologies include:
� Factors that enhance mercury control are low temperature in the control device system(less than 150 �Celsius [�C] [300 to 400 �Fahrenheit (�F)]), the presence of an effectivemercury sorbent and a method to collect the sorbent. In general, high levels of carbon inthe fly ash enhance mercury sorption onto particulate matter which is subsequentlyremoved by the particulate matter control device. Additionally, the presence of hydrogenchloride (HCl) in the flue gas stream can result in the formation of mercuric chloride(HgCl ), which is readily adsorbed onto carbon-containing particulate matter, or can be2efficiently scrubbed by a wet FGD system. Conversely, sulfur dioxide (SO ) in flue gas2can act as a reducing agent to convert oxidized mercury to elemental mercury, which ismore difficult to collect.
� Conversion of mercury cell chlor-alkali plants to a mercury-free process is technicallyfeasible and has been previously demonstrated.

4-8
� Control technologies designed for control of pollutants other than mercury (e.g., acidgases and particulate matter) vary in their mercury-removal capability, but in generalachieve reductions no greater than 50 percent (except for high removal efficiencies forHgCl by wet scrubbers) . 2
� Selenium filters are a demonstrated technology in Sweden for control of mercuryemissions from lead smelters. Carbon filter beds have been used successfully inGermany for mercury control on utility boilers and MWC’s. These technologies havenot been demonstrated in the U.S. for any of these source types.
� Injection of activated carbon into the flue gas of MWC’s and MWI’s can achievemercury reductions of at least 85 percent. The addition of activated carbon to the fluegas of these source types would not have a significant impact on the amount ofparticulate matter requiring disposal.
� No full-scale demonstrations of activated carbon injection for utility boilers have beenconducted in the U.S. Based on limited pilot-scale testing, activated carbon injectionprovides variable control of mercury for utility boilers (e.g., the same technology mightcapture 20 percent of the mercury at one plant and 80 percent at another). The mostimportant factors affecting mercury control on utility boilers include the flue gas volume,flue gas temperature and chloride content, the mercury concentration and chemical formof mercury being emitted.
� The chemical species of mercury emitted from utility boilers vary significantly from oneplant to another. Removal effectiveness depends on the species of mercury present. Todate, no single control technology has been identified that removes all forms of mercury.
� The addition of activated carbon to utility flue gas for mercury control wouldsignificantly increase the amount of particulate matter requiring disposal.
Cost of Controls
The overall approach for assessing the cost of “end-of-pipe” flue gas treatment technologies wasto select a subset of source categories on the basis of either their source category emissions in theaggregate or their potential to be significant point sources of emissions. Consideration was also given towhether a particular source category was a feasible candidate for application of a control technology-based standard under section 112 of the CAA. The cost analyses cover four source categories: municipal waste combustors (MWC), medical waste incinerators (MWI), chlor-alkali plants, and utilityboilers.
In addition to determining the cost effectiveness of applying mercury control technology, afinancial analysis was performed to evaluate the affordability of mercury control (in terms of potentialprice increases or impacts on financial impact) for the selected source categories.
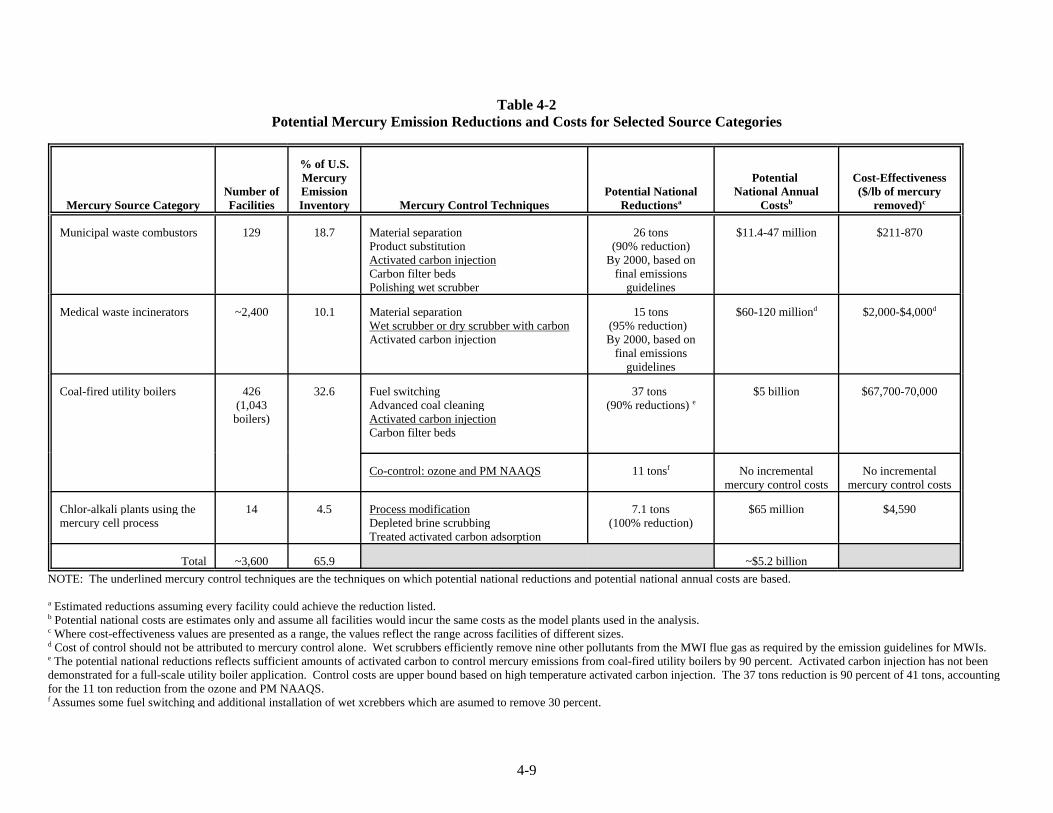
4-9
Table 4-2Potential Mercury Emission Reductions and Costs for Selected Source Categories
Mercury Source Category Facilities Inventory Mercury Control Techniques Reductions Costs removed)Number of Emission Potential National National Annual ($/lb of mercury
% of U.S.Mercury Potential Cost-Effectiveness
a b c
Municipal waste combustors 129 18.7 Material separation 26 tons $11.4-47 million $211-870Product substitution (90% reduction)Activated carbon injection By 2000, based onCarbon filter beds final emissionsPolishing wet scrubber guidelines
Medical waste incinerators ~2,400 10.1 Material separation 15 tons $60-120 million $2,000-$4,000Wet scrubber or dry scrubber with carbon (95% reduction) Activated carbon injection By 2000, based on
final emissionsguidelines
d d
Coal-fired utility boilers 426 32.6 Fuel switching 37 tons $5 billion $67,700-70,000(1,043 Advanced coal cleaning (90% reductions) boilers) Activated carbon injection
Carbon filter beds
e
Co-control: ozone and PM NAAQS 11 tons No incremental No incrementalf
mercury control costs mercury control costs
Chlor-alkali plants using the 14 4.5 Process modification 7.1 tons $65 million $4,590mercury cell process Depleted brine scrubbing (100% reduction)
Treated activated carbon adsorption
Total ~3,600 65.9 ~$5.2 billion
NOTE: The underlined mercury control techniques are the techniques on which potential national reductions and potential national annual costs are based.
Estimated reductions assuming every facility could achieve the reduction listed.a
Potential national costs are estimates only and assume all facilities would incur the same costs as the model plants used in the analysis.b
Where cost-effectiveness values are presented as a range, the values reflect the range across facilities of different sizes.c
Cost of control should not be attributed to mercury control alone. Wet scrubbers efficiently remove nine other pollutants from the MWI flue gas as required by the emission guidelines for MWIs.d
The potential national reductions reflects sufficient amounts of activated carbon to control mercury emissions from coal-fired utility boilers by 90 percent. Activated carbon injection has not beene
demonstrated for a full-scale utility boiler application. Control costs are upper bound based on high temperature activated carbon injection. The 37 tons reduction is 90 percent of 41 tons, accountingfor the 11 ton reduction from the ozone and PM NAAQS. Assumes some fuel switching and additional installation of wet xcrebbers which are asumed to remove 30 percent.f

4-10
Table 4-2 presents the four source categories for which a control technology and cost analysiswas performed. The selection of a particular type of control for the cost analysis should not be construedto mean that the U.S. EPA has selected, or has preference for, this technology for a given sourcecategory. The table presents the number of facilities in each category and the percent contribution ofeach to the national inventory. Potential national mercury reductions, potential national control costs andcost-effectiveness estimates are also presented. These estimates are based on the assumption that allplants within a source category will achieve the same reductions and incur the same costs as the modelplants used in the analysis. Because this assumption would not be applicable in all circumstances, theestimates of potential reductions and costs should be used only for relative comparisons among thesource categories to give an initial indication as to where mercury controls could provide the mostemission reduction for the least cost.
The cost of mercury control incurred by any specific facility may be underestimated by the costanalysis presented in this Report because of variability inherent in the assumptions that were made in theanalyses. These assumptions include the efficiency of the various control techniques for reducingmercury, the amount of mercury in the flue gas stream and other site-specific factors such as down-timeand labor costs. In addition, costs for monitoring and recordkeeping were not included in the costanalyses. These requirements would be specific to a regulatory action. On the other hand, the costsrepresent retrofit application of controls. Installation of controls at new facilities can be significantly lessexpensive than retrofitting an existing facility.
The estimates of cost for mercury reductions also do not illustrate two important considerations. One is that, as presented, all of the cost of control could mistakenly be attributed to mercury removal. Asdescribed previously in this Report, many of these controls achieve reductions of other pollutants as well(e.g., acid gases, dioxin, other metals). In some cases (e.g., the emission guidelines for MWI), the choiceof control technology or control strategy is aimed at reducing pollutants other than mercury. In thesecases, there is a co-control benefit of mercury reduction. The benefits of reducing other pollutants shouldbe considered when interpreting the mercury control costs. Second, the technologies available formercury control represent relatively new applications of these technologies. Thus, in the future, it islikely that as new or emerging technologies develop, the cost-effectiveness of control will improve. Airpollution control and prevention techniques are continuously under development and improvement. There is a fairly rapid pace of innovation in the air pollution control sector. The demand for cleanerproducts and cleaner processes that lower overall costs, combined with the necessity for improved air andwater quality, create strong incentives for technological innovation and a growing market for suchinnovations. As the demand for more innovative, cost-effective and cost-saving technologies increase,new technologies will move from the research and development or pilot program phase to commercialavailability.
While existing technology will play a key role in reducing mercury from some sources, emergingtechnology may be more appropriate for others. Innovations in environmental policies may also play akey role in developing a national management strategy for mercury. These innovations could includemulti-media approaches, greater emphasis on pollution prevention, regional control strategies andoptimization of co-control opportunities.
Ongoing U.S. EPA Activities to Reduce Mercury in the Environment
Mercury is a priority pollutant across numerous U.S. EPA programs including air, water,hazardous waste and pollution prevention. There are numerous activities currently underway to reducemercury emissions and releases to the environment. A number of these activities are described belowwhich reflect the broad scope U.S. EPA’s approach to the mercury issue.
4-11
Clean Air Act Initiatives
The U.S. EPA already has efforts underway to reduce mercury emissions from industrial sources. Specific actions being taken under the Clean Air Act include the following:
� The U.S. EPA has promulgated final emission limits for municipal waste combustors andmedical waste incinerators under the authority of section 129 of the CAA. Emissionstandards have also been proposed for hazardous waste incinerators.
� The U.S. EPA is evaluating the impacts of mercury reductions for the following sourcecategories: commercial/ industrial boilers, chlor–alkali plants using the mercury cellprocess and portland cement kilns.
� The U.S. EPA plans to evaluate whether secondary mercury production should be addedto the source category list under section 112(c) of the CAA and subsequently evaluatedfor regulation under the authority of section 112(c)(6).
� Numerous CAA requirements involve utilities either directly or indirectly. Section112(n)(1)(B) which required this Mercury Study Report to Congress specified utilityboilers for analysis as did section 112(n)(1)(A) which is referred to as the Utility AirToxics Report to Congress (Utility Study). The Utility Study is charged with evaluatingthe hazards to public health reasonably anticipated to occur as a result of emissions byelectric utility steam generating units of pollutants listed under Section 112(b), includingmercury, and to evaluate the impact of other provisions of the CAA on these emissions. The other provisions of the CAA would include the Acid Rain program as well asprovisions pertaining to National Ambient Air Quality Standards. The Utility Study isalso required to offer a regulatory recommendation with respect to regulation of utilityboilers under section 112 of the CAA.
� The �Great Waters� program (section 112(m)) is an ongoing study with biennial reportsto Congress required. The program must identify and assess the extent of atmosphericdeposition of hazardous air pollutants (including mercury) to the Great Lakes and otherspecified waters, the environmental and public health attributable to atmosphericdeposition and the contributing sources. Two reports have been submitted to Congresswhich address these issues.
Mercury Task Force
To address cross�media issues, additional pollution prevention options and regulatoryauthorities, the U.S. EPA has established a Mercury Task Force to consider strategies for coordinatingvarious programs for use, management and disposal of mercury. The Task Force has recommended tothe Department of Defense that the Defense Logistics Agency suspend sales of mercury from federalstockpiles through the fiscal year 1996 sales cycle, and are in the process of developing an environmentalimpact assessment.
The Mercury Task Force continues to consider several approaches for reducing mercury releasesand environmental and human health risks associated with mercury exposure. A wide range of options,within a multi�media framework, advocating common�sense pollution prevention programs are beingconsidered. Some areas which the Task Force will explore include evaluation and information transferof ongoing prevention and control efforts at local, national and international levels; consideration ofpollution prevention ideas including product substitution and innovation; recycling and disposal options;

4-12
research and science needs; and coordination within U.S. EPA for consistent mercury regulatoryprograms, as well as coordination with Federal agencies managing mercury.
The findings of the Mercury Study Report to Congress will be considered by the Mercury TaskForce as it develops a U.S. EPA mercury strategy.
Virtual Elimination Project
U.S. EPA and Environment Canada are actively developing strategies to achieve the Great LakesWater Quality Agreement's (GLWQA’s) goal that persistent toxic substances should be "virtuallyeliminated" from the Great Lakes. Because toxic substances enter the Great Lakes from ongoingeconomic activities, as well as from sites contaminated by past activities, eliminating toxic substancesfrom the Great Lakes requires a three-pronged approach that:
� Reduces the use of toxic substances at the source, through pollution prevention efforts;
� Reduces toxic substance discharges, emissions and other ongoing releases throughtreatment or other management techniques; and
� Cleans up sites of past contamination, such as contaminated sediments or areas ofconcern, through remediation efforts.
A central theme underlying the virtual elimination project is that opportunities may exist to alterthe decisionmaking environment in which individuals and firms choose to use and release toxicchemicals in their ongoing activities. The project focuses on government actions -- or "signals" -- suchas regulatory or voluntary programs that influence the economic and legal costs and benefits associatedwith using a particular chemical. These signals, which translate into costs for an affected entity, canmotivate individuals and firms to choose pollution prevention based on their own economic interests.
Other Pollution Prevention Programs
U.S. EPA is working with state and local governments to develop a national network ofprevention programs that will assist regulators at all levels of government in promoting pollutionprevention. To that end, U.S. EPA is providing funding support, technical assistance, informationdissemination and forming federal/state/local government partnerships to focus efforts on pollutionprevention as the national goal for environmental management.
State and federal partnerships have already led to actions that will reduce mercury loadings to theenvironment. For example, the National Wildlife Federation, funded in part by U.S. EPA, has recentlyreleased a report detailing how hospitals in Detroit, Michigan; Grand Rapids, Michigan; Boston,Massachusetts; and Duluth, Minnesota have successfully reduced mercury releases by applying pollutionprevention principles. This report contains practical and cost effective suggestions for improving theenvironmental performance of hospitals and to help them meet increasingly stringent limits in regulatorypermits. Industry groups have also made advances in pollution prevention (see text box below onChrysler Corporation).
U.S. EPA is working continually to incorporate pollution prevention into the mainstream of itswork. Over the last six years, the agency has undertaken a concerted effort to find the best ways toincorporate prevention into regulations and permitting. For example, in 1992, U.S. EPA began an effortto evaluate pollution prevention options for a number of new regulations under development. This effort,called the Source Reduction Review Project, required U.S. EPA’s media offices to identify multi-mediaapproaches to addressing air, water and solid waste regulations. Another program, U.S. EPA’s Common

4-13
Life Cycle Cost Management in the Auto Industry
Industry remains at the center of pollution prevention activities. Studies have shown that theeconomic benefits can be compelling arguments in favor of pollution prevention, but only whenmanagers are able to see the cost savings that pollution prevention would bring. Environmentalaccounting is the key factor in demonstrating to businesses the value of prevention. The followingserves as a specific example of pollution prevention in practice to reduce mercury loadings.
The Chrysler Corporation is now removing or replacing all mercury switches that have beentraditionally used in its underhood convenience light applications. Chrysler has done so as a result ofthe application of life cycle cost management methodologies that are advocated by the U.S. EPAPollution Prevention Division’s Environmental Accounting Project. This Project is a cooperativeeffort with business, academia and others to promote sound management accounting and capitalbudgeting practices which better address environmental costs. The project encourages and motivatesbusiness to understand the full spectrum of environmental costs and integrate these costs into decisionmaking. Chrysler is partnering with the Project to share its environmental accounting experience andcase studies with the 800-plus members of the Project-facilitated Environmental Accounting Network.
By applying the principles of environmental accounting, the Chrysler Corporation determinedthat it could cost-effectively replace the mercury switches with a rolling ball switch or remove theswitches altogether. For the first group of cars on which Chrysler tested the feasibility of substitutionand removal, it determined that it could avoid $40,000 in costs. Most of those costs were associatedwith the documentation of the removal of mercury switches from the vehicle before disposal, and withthe potential liability for any mercury that enters the environment following vehicle disposal. Afterconducting their own total cost analyses, other auto manufacturers are now following suit and areactively removing mercury switches from their own automobiles.
Sense Initiative, created a pollution prevention framework for environmental protection on an industry-by-industry basis by focusing on opportunities to change complicated or inconsistent environmentalrequirements into comprehensive strategies. The goal of each of these programs is a cleaner environmentat less costs to taxpayers.
In addition, and on a broader scale, U.S. EPA is currently developing a long-term plan to mitigatethe risks associated with mercury and other chemicals of concern under its Persistent, Bioaccumulativeand Toxic (PBT) Chemicals strategy by using pollution prevention principles. Through its current effortson the PBT strategy, U.S. EPA will focus these activities more intensively on the key persistent,bioaccumulative pollutants, especially mercury. U.S. EPA expects that through partnership with statesand local organizations, and in collaboration with industry, there will be more opportunities to usepollution prevention as a means to mitigate the potential risk to human health and the environmentassociated with exposure to mercury.
International Activities
On an international level, mercury is being addressed as part of the Great Lakes BinationalToxics Strategy and the North American Regional Action Plan, among other efforts. These twoinitiatives are summarized below.
Binational Strategy

4-14
The Great Lakes Binational Toxics Strategy, which was signed between Canada and the UnitedStates on April 7, 1997 (U.S. EPA and Environment Canada, 1997), was developed to help achieve theobjectives of the 1987 GLWQA. Although both Canada and the United States have domestic virtualelimination strategies as described above, a coordinated strategy is necessary for the greatest reduction intoxic substances throughout the Great Lakes Basin.
The Binational Strategy provides the framework to achieve quantifiable goals in a specified timeframe (1997 to 2006) for targeted persistent toxic substances, especially those which bioaccumulate. TheStrategy recommends that goals be accomplished through a four-step process:
� Gather information on generation, uses, and sources of the pollutant within and outsidethe Great Lakes Basin;
� Analyze current regulatory and non-regulatory programs and initiatives that manage orcontrol the pollutants and identify the gaps in these regulations that offer opportunitiesfor reductions;
� Develop cost-effective options and provide recommendations for increasing the pace andlevel of reductions; and
� Recommend and implement actions to achieve goals.
Mercury and mercury compounds are considered immediate priorities and are targeted for reduction andeventual virtual elimination through pollution prevention and other incentive-based actions.
Both the United States and Canada have set �challenge� goals to achieve reductions throughimplementation of voluntary efforts and regulatory actions. One of these challenges is the commitmentof these countries to work together to assess atmospheric inputs of persistent toxic substances to theGreat Lakes, with the goal of evaluating and reporting jointly on the contribution and significance oflong-range transport of these substances from worldwide sources. Efforts will be made to work withinthe existing international framework to reduce releases of such pollutants from remaining long-rangesources.
North American Regional Action Plan
The North American Regional Action Plan (NARAP) is one of a number of regionalundertakings that stem from the North American agreement on Environmental Cooperation between thegovernments of Canada, the united Mexican states and the United States of America (Parties). TheNARAP calls for the development of regional action plans for selected persistent and toxic substances asa first priority in the Parties’ common desire to address national and regional concerns associated withthe sound management of chemicals.
The action plans are designed to reflect a long-term commitment to regional action. The sharingand transfer of information and best practices are seen as an important means of enhancing nationalcapacity for the sound management of chemicals. Other important elements and outcomes of thesecooperative initiatives include collaboration and cooperation in the measurement, monitoring, modeling,research and assessment of selected persistent and toxic substances in environmental media. Suchcooperation will improve the quality, availability and relevance of the “environmental information”needed to make informed and responsible decisions throughout the implementation of the action plans.
Mercury is one of the targeted chemicals and has its own action plan designed to unite the Partiesin their joint and differentiated efforts to reduce the exposure of North American ecosystems, fish and

4-15
wildlife, and especially humans, to mercury through the prevention and reduction of anthropogenicreleases of mercury to the North American environment. The objectives of the action plan are to reducemercury levels in and fluxes among environmental media in order to prevent or minimize exposure toecosystems, fish and wildlife, and humans.
Implementation on the mercury action plan is predicated on the following objectives:
� Building on existing initiatives. Examples include the Great Lakes Binational ToxicsStrategy, described above.
� Promoting North American regional and global activities. The mercury action plan willpromote regional actions to reduce mercury emissions and serve as an example forinitiatives under development throughout the region and globally.
� Best practices. The action plan will promote the sharing, transfer, and general adoptionof policies, programs, technologies, and other measures that have proven to be cost-effective and environmentally appropriate.
� Challenging stakeholders to take cooperative action on mercury. The action planpromotes stakeholder partnerships in information and technology exchanges.
� Improving scientific understanding. The action plan will use government and private-sector partnerships to fund research and monitoring, and to advance the science andtechnology state-of-knowledge for mercury.
� Capacity building in Mexico. The Parties are committed to working cooperatively tobuild Mexico’s capacity with respect to the prevention and reduction of anthropogenicreleases of mercury and the sound management of mercury.
� Extended Americas. The Parties agree to actively promote cooperation with othercountries to promote pertinent initiatives.
Specific actions outlined for mercury include a series of workgroups and workshops to assess the currentknowledge on mercury issues and compile information into shared databases. An implementationcommittee will provide oversight of the action plan.
5-1
5. RESEARCH NEEDS
The following sections summarize the major research needs identified for each of the study areasaddressed in this Report.
Anthropogenic Mercury Emissions in the United States
An effort has been made to characterize the uncertainties (at least qualitatively) in the emissionsestimates for the various source categories described. There are inherent uncertainties in estimatingemissions using emission factors. To reduce these uncertainties, a number of research needs remain,including the following.
1. Source test data are needed from a number of source categories that have been identifiedas having insufficient data to estimate emissions. Notable among these are mobilesources, landfills, agricultural burning, sludge application, coke ovens, petroleumrefining, residential woodstoves, mercury compounds production and zinc mining. Anumber of manufacturing sources were also identified as having highly uncertainemissions estimates. Notable among this category are secondary mercury production,commercial and industrial boilers, electric lamp breakage, primary metal smeltingoperations and iron and steel manufacturing. The possibility of using emissions datafrom other countries could be further investigated.
2. Development and validation of a stack test protocol for speciated mercury emissions isneeded.
3. More data are needed on the efficacy of coal cleaning and the potential for slurries fromthe cleaning process to be a mercury emission source.
4. More data are needed on the mercury content of various coals and petroleum and thetrends in the mercury content of coal burned at utilities and petroleum refined in the U.S.
5. Additional research is needed to address the potential for methylmercury to be emitted(or formed) in the flue gas of combustion sources.
6. The importance (quantitatively) of re-emission of mercury from previously depositedanthropogenic emissions and mercury-bearing mining waste needs to be investigated. This would include both terrestrial and water environments. Measuring the flux ofmercury from various environments would allow a determination to be made of therelative importance of re-emitted mercury to the overall emissions of currentanthropogenic sources.
7. Determination of the mercury flux from natural sources would help determine the impactof U.S. anthropogenic sources on the global mercury cycle as well as the impact of allmercury emissions in the United States.
8. The use of more sophisticated fate and transport models for mercury will require moredetailed emissions data, particularly more information on the chemical species ofmercury being emitted (including whether these species are particle-bound) and thetemporal variability of the emissions.
5-2
Mercury Fate and Transport Modeling
During the development of the mercury fate and transport assessment, many areas of uncertaintyand significant data gaps were identified. Many of these have been identified in the document, andseveral are presented in the following list.
1. Improved analytical techniques for measuring speciated mercury air emissions areneeded as well as total mercury emissions from point sources. Laboratory evidencesuggests that divalent mercury gas emissions will wet and dry deposit much more readilythan elemental mercury gas. Particle-bound mercury is also likely to deposit relativelyquickly. Current stack sampling methods do not provide sound information about thefraction of mercury emissions that are in oxidized form. While filters are used todetermine particulate mercury fractions, high temperature stack samples may not beindicative of the fraction of mercury that is bound to particles after dilution and coolingin the first few seconds after emission to the atmosphere. Methods for determination ofthe chemical and physical forms of mercury air emissions after dilution and cooling needto be developed and used to characterize significant point sources.
2. Evaluated local and regional atmospheric fate and transport models are needed. Thesemodels should treat all important chemical and physical transformations which takeplace in the atmosphere. The development of these models will require comprehensivefield investigations to determine the important atmospheric transformation pathways(e.g., aqueous cloud chemistry, gas-phase chemistry, particle attachment, photolyticreduction) for various climatic regions.
3. The evaluation of these models will require long-term national (possibly international)monitoring networks to quantify the actual air concentrations and surface depositionrates for the various chemical and physical forms of mercury.
4. Better understanding of mercury transport from watershed to water body including thesoil chemistry of mercury, the temporal aspects of the soil equilibrium and the impact oflow levels of volatile mercury species in surface soils and water bodies on total mercuryconcentrations and equilibrium.
5. Better understanding of foliar uptake of mercury and plant/mercury chemistry. (Themost important questions: do plants convert elemental or divalent mercury into forms ofmercury that are more readily bioaccumulated? Do plants then emit these differentforms to the air?) A better understanding of the condensation point for mercury isneeded.
6. Better understanding of mercury movement from plant into soil (detritus). May need torefine the models used to account for movement of mercury in leaf litter to soil.
7. The impact of anthropogenic mercury on the "natural," existing mercury levels andspecies formed in soil, water, and sediments needs better understanding. How does theaddition of anthropogenic mercury affect "natural" soil and water mercury cycles? Natural emission sources need to be studied better and their impacts better evaluated.
8. Improved understanding of mercury flux in water bodies and impact of plant and animalbiomass are needed. Unlike many other pollutants, most of the methylmercury in awater body appears to be in the biological compartment. The sedimentation rate as well

5-3
as benthic sediment:water partition coefficient require field evaluation. Important toconsider rivers and other larger water bodies in these flux analyses.
Exposure from Anthropogenic Mercury Emissions in the United States
1. To improve the quantitative exposure assessment modeling component of the riskassessment for mercury and mercury compounds, U.S. EPA would need more and bettermercury emissions data and measured data near sources of concern, as well as a betterquantitative understanding mor mercury chemistry I the emission plume, the atmosphere,soils, water bodies, and biota.
2. To improve the exposure estimated based on surveys of fish consumption, more study inneeded among potentially high-end fish consumers, which examines specific biomarkersindicating mercury exposure (e.g., blood mercury concentrations and hair mercuryconcentrations).
3. A pharmacokinetic-based understanding of mercury partitioning in children is needed. Additional studies of fish intake and methylmercury exposure among children areneeded.
Health Effects of Mercury and Mercury Compounds
1. In addition to the ongoing studies identified in the health effects review, further researchis necessary for refinement of the U.S. EPA's risk assessments for mercury and mercurycompounds. In order to reduce uncertainties in the current estimates of the oralreference doses (RfDs) and inhalation reference concentrations (RfCs), longer-termstudies with low-dose exposures are necessary. In particular, epidemiological studiesshould emphasize comprehensive exposure data with respect to both dose and durationof exposure. Some studies should be targeted to populations identified in this Report aslikely to experience methylmercury exposure in fish (e.g., subsistence fishers).
2. The current RfD and RfC values have been determined for the most sensitive toxicityendpoint for each compound; that is, the neurological effects observed followingexposure to elemental or methylmercury, and the renal autoimmune glomerulonephritisfollowing exposure to inorganic mercury. For each of these compounds, experimentsconducted at increasingly lower doses with more sensitive measures of effect willimprove understanding of the respective dose-response relationships at lower exposurelevels and the anticipated thresholds for the respective effects in humans. Similarinformation from developmental toxicity studies would allow determination of RfDs fordevelopmental toxicity (RfD ) for elemental and inorganic mercury.dt
3. Research needs include studies which will delineate the most appropriate indicators ofneurotoxic effects for exposed adults, children and individuals exposed tomethylmercury in utero. Well conducted studies are also needed to clarify critical levelsat which other toxic effects could occur in humans.
4. Well-conducted studies are also needed to clarify exposure levels at which toxic effectsother than those defined as �critical� could occur in humans. For all three forms ofmercury, data are inadequate, conflicting, or absent for the following: adversereproductive effects (effects on function or outcome, including multigeneration
5-4
exposure); impairment of immune function; and genotoxic effects on human somatic orgerminal cells (elemental and inorganic mercury).
5. Investigations that relate the toxic effects to biomonitoring data will be invaluable inquantifying the risks posed by these mercury compounds. In addition, work shouldfocus on subpopulations that have elevated risk because they are exposed to higher levelsof mercury at home or in the workplace, because they are also simultaneously exposed toother hazardous chemicals, or because they have an increased sensitivity to mercurytoxicity.
6. There are data gaps in the carcinogenicity assessments for each of the mercurycompounds. The U.S. EPA's weight-of-evidence classification of elemental mercury(Group D) is based on studies in workers who were also potentially exposed to otherhazardous compounds including radioactive isotopes, asbestos, or arsenic. There wereno appropriate animal studies available for this compound. Studies providinginformation on the mode of action of inorganic mercury and methylmercury inproducing tumors will be of particular use in defining the nature of the dose responserelationship.
7. The assessment of both noncarcinogenic effects and carcinogenic effects will beimproved by an increased understanding of the toxicokinetics of these mercurycompounds. In particular, quantitative studies that compare the three forms of mercuryacross species and/or across routes of exposure are vital for the extrapolation of animaldata when assessing human risk. For elemental mercury there is a need for quantitativeassessment of the relationship between inhaled concentration and delivery to the brain orfetus; in particular the rate of elemental to mercuric conversion mediated by catalase andthe effect of blood flow. Such assessment is needed for evaluation of the impact ofmercury exposure from dental amalgam.
8. Work has been done on development of physiologically-based pharmacokinetic models. While one of these has developed a fetal submodel, data on fetal pharmacokinetics aregenerally lacking. The toxicokinetics of mercury as a function of various developmentalstages should be explored. Elemental mercury and methylmercury appear to have thesame site of action in adults; research is, therefore, needed on the potential forneurotoxicity in newborns when the mother is exposed. This work should beaccompanied by pharmacokinetic studies and model development.
Ecological Assessment for Anthropogenic Mercury Emissions in the United States
1. Process-based Research. Mechanistic information is needed to understand the variabilitythat presently typifies the mercury literature. This research includes laboratory and fieldstudies to identify the determinants of mercury accumulation in aquatic food chains andkinetic information that would allow researchers to describe the dynamics of thesesystems. Areas of uncertainty include: (1) translocation of mercury from watersheds towaterbodies; (2) factors that determine net rates of methylation and demethylation; (3)dietary absorption efficiency from natural food sources; (4) effect of dietary choice; and(5) bioavailability of methylmercury in the presence of dissolved organic material andother potential ligands. In time, it is anticipated that this information can be used todevelop process-based models for mercury bioaccumulation in fish and other aquaticbiota. Significant progress in this direction is represented by the Mercury Cycling Model(MCM) (Hudson et al., 1994) and by the ISC3M model described in Volume III of thisReport and employed in the wildlife exposure characterization.
5-5
2. Wildlife Toxicity Data. There is a need to reduce the present reliance on a relatively fewtoxicity studies for WC development. Additional data are needed for wildlife thatconstitute the most exposed organisms in various parts of the country, and in particularthere is need to evaluate whether dietary selenium and endogenous demethylatingpathways confer protection to piscivorous birds and mammals. Toxicity studies shouldexamine endpoints relevant to the mode of action of methylmercury, includingassessments of both reproductive and behavioral effects. There is also a criticalrequirement for toxicity data (e.g., growth and fecundity) that can be related to effects onpopulations, including effects on organisms that comprise the lower trophic levels.
3. Improved Analytical Methods. Efforts to develop and standardize methods for analysisof total mercury and methylmercury in environmental samples should be continued. Such methods must recognize the importance of contamination, both during thecollection of such samples and during their analysis. It is particularly important thatmercury measurements, which at present tend to be operationally defined (e.g., "soluble"or "adsorbed to organic material"), be made in such a way that mercury residues in fishcan be correlated with the bioavailable mercury pool. Whenever possible, water samplesshould be filtered to obtain a measure of dissolved mercury species. As validatedmethods become available, it is important to analyze for both total and methylmercury sothat differences between aquatic systems can be definitively linked to differences inmethylmercury levels. Analyzing the two mercury species together will contribute to anunderstanding of existing data, much of which is reported as total mercury.
4. Complexity of Aquatic Food Webs. Present efforts to develop WC values for mercuryare based on linear, four-tiered food chain models. Research is needed to determine theappropriateness of this simple paradigm and to develop alternatives if field data suggestotherwise. Of particular interest is whether zooplankton and phytoplankton should bemodeled as two different trophic levels. Current information for detritivores and benthicinvertebrates is extremely limited, even though their importance in mobilizinghydrophobic organic contaminants has been demonstrated.
5. Accumulation in Trophic Levels 1 and 2. Ongoing efforts to understand mercurybioaccumulation in aquatic systems continue to be focused on trophic levels 3 and 4,despite the fact that uncertainties in PPFs are relatively small. Additional emphasisshould be placed on research at the lower trophic levels. In particular, there is a need tounderstand the determinants of mercury accumulation in phytoplankton and zooplanktonand how rapid changes in plankton biomass impact these values.
6. Field Residue Data. High-quality field data are needed to support process-based researchefforts and to determine residue concentrations in the fish and other aquatic biota thatwildlife eat. Whenever possible, it is desirable to collect residue data at all trophic levelsand to analyze mercury levels in the abiotic compartments of a system (e.g., water andsediments). It is particularly important that such measurements be made in a broaderarray of aquatic ecosystem types (including both lakes and rivers) so that a betterunderstanding of mercury cycling and accumulation can be obtained.
Residue data from wildlife are needed to identify populations that are potentially at risk. Feathers and fur hold considerable promise in this regard due to the potential for "non-invasive" determination of mercury residues. Laboratory research is required, however,to allow interpretation of these data. Factors such as age, sex, and time to last molt arelikely to result in variability among individuals of a single population and need to beunderstood. Whenever possible, tissue samples should be analyzed for both total and

5-6
methylmercury, as well as selenium. This is especially true of the liver. More attentionshould be given to analysis of mercury levels in brain tissue, since this is the primary siteof toxic action. Sampling efforts with wildlife should be accompanied by analyses oflikely food items.
7. Natural History Data. The development of WC values requires knowledge of whatwildlife eat. Fish sampling efforts are frequently focused on species that are relevant tohuman consumers but that may be of little significance to wildlife. There is an additionalneed to collect information for macroinvertebrates and amphibians. Seasonal and spatialeffects on predation should be explored and methods developed to describe thisinformation adequately. Additional life history data is needed to characterize fully thenature and extent of exposure to mercury. Complicating factors must be considered,including migratory behaviors and sex-specific differences in distribution and resourceallocation. It is particularly important that information be collected to support thedevelopment of predictive population models for sensitive species. Such models mustaccount for immigration and emigration, density dependent factors, and the observationthat mercury often bioaccumulates as animals age resulting in variable residues inbreeding animals from a single population.
Risk Characterization
1. A monitoring program is needed to assess either blood mercury or feather/hair mercuryof piscivorous wildlife; particularly those in highly impacted areas. This program shouldinclude assessment of health endpoints including neurotoxicity and reproductive effects.
2. There is a need to collect additional monitoring data on hair or blood mercury and assesshealth endpoints among women of child-bearing age and children. This study shouldfocus on high-end fish consumers and on consumption of fish from contaminated waterbodies.
3. There is a need for improved data on effects that influence survival of the wildlifespecies as well as on individual members of the species.
4. There is a need for controlled studies on mercury effects in intact ecosystems.
5. Monitoring data sufficient to validate or improve the local impact exposure models areneeded.
Mercury Control Technologies
1. Data from full-scale testing of activated carbon injection at a coal-fired utility boiler.
2. Additional data on the efficiency of various sorbents including fly ash-based sorbents,activated carbon, impregnated carbons and other types of sorbents, in reducing thedifferent chemical species of mercury present in flue gas.
3. Information on the cost-effectiveness and commercialization costs of other technologiesfor mercury control that are currently in the research stage. These include impregnatedactivated carbon, sodium sulfide injection, activated carbon fluidized bed and other typesof sorbents.

5-7
4. Additional data on the ability and cost of conventional or advanced coal cleaningtechniques to remove mercury from raw coal. The potential for mercury emissions fromcoal-cleaning slurries needs to be characterized.
5. Additional data on the fundamental mechanisms responsible for conversion of mercuryto other chemical species as a result of combustion of certain coals or post-combustionconditions.
6. Additional information on improving the capture of mercury in wet FGD systems.
7. Additional analyses are required on the feasibility, cost-effectiveness of other mercuryemission prevention measures such as emissions trading, emissions averaging, energyconservation, renewable energy, and fuel switching.