Embed Size (px)
Citation preview

Department of Physics Graduate school of ScienceDepartment of Physics Graduate school of ScienceOsaka UniversityOsaka University
March 2002March 2002
The study on characteristics of mercuryThe study on characteristics of mercurycluster ions from sputtering ion sourcecluster ions from sputtering ion source
Takaya SatohTakaya Satoh
AbstractAbstract
The electronic structure of mercury atom is 5The electronic structure of mercury atom is 5dd101066ss22 closed shell which is isoelectronic with closed shell which is isoelectronic with
helium Therefore the diatomic molecule and smaller clusters are bounded by van der Waals forcehelium Therefore the diatomic molecule and smaller clusters are bounded by van der Waals force
For intermediated cluster size the 6For intermediated cluster size the 6ss and 6 and 6pp orbitals broaden The overlapping of 6 orbitals broaden The overlapping of 6ss and 6 and 6pp bands bands
gives the metallic behavior of bulk Hg The non-metal to metal transition of mercury cluster wasgives the metallic behavior of bulk Hg The non-metal to metal transition of mercury cluster was
studied by various methods such as recording the autoionization lines ( 5studied by various methods such as recording the autoionization lines ( 5dd rarrrarr 6 6pp ) excited by ) excited by
synchrotron radiation measuring the ionization potential and binding energy Every experimentsynchrotron radiation measuring the ionization potential and binding energy Every experiment
showed the non-metal to metal transition occurred at cluster size around 15 Furthermore the non-showed the non-metal to metal transition occurred at cluster size around 15 Furthermore the non-
metal to metal transition was also observed about the mercury-alkali metal binary cluster ions atmetal to metal transition was also observed about the mercury-alkali metal binary cluster ions at
cluster size cluster size nn = 30 = 30
This thesis consists of the three following subjectsThis thesis consists of the three following subjects
(1) The size distribution of mercury-silver binary cluster ions Hg(1) The size distribution of mercury-silver binary cluster ions HgnnAgAg++ and Hg and HgnnAgAg22++ The The
structure of Hgstructure of HgnnAgAg++ was interpreted by electronic shell model rather than geometric On the other was interpreted by electronic shell model rather than geometric On the other
hand the stable Hghand the stable Hg1818AgAg22++ was considered to be geometrical double icosahedron structure In order was considered to be geometrical double icosahedron structure In order
to know more accurate character of mercury-silver binary cluster ions the fragmentation patternto know more accurate character of mercury-silver binary cluster ions the fragmentation pattern
was also investigatedwas also investigated
(2) Determination of appearance sizes of doubly and triply charged mercury cluster ions(2) Determination of appearance sizes of doubly and triply charged mercury cluster ions
from direct observation of fission and evaporation They were decided to from direct observation of fission and evaporation They were decided to NNaa2+2+ = 20 and = 20 and NNaa
3+3+ = 46 = 46
for doubly and triply charged cases respectively The fission channels were also investigated andfor doubly and triply charged cases respectively The fission channels were also investigated and
estimated by calculation of estimated by calculation of QQ values The symmetric fission of doubly charged cluster ions was values The symmetric fission of doubly charged cluster ions was
caused by van der Waals bonding of small mercury clusters The fission channels of triply chargedcaused by van der Waals bonding of small mercury clusters The fission channels of triply charged
were asymmetric since the metallic character came into prominence for both precursor and largewere asymmetric since the metallic character came into prominence for both precursor and large
one of fission fragmentone of fission fragment
(3) Estimation of lifetime distribution of cluster ions from sputtering ion source using frag-(3) Estimation of lifetime distribution of cluster ions from sputtering ion source using frag-
mentation rate obtained from experimental data The one atom evaporation of singly charged silvermentation rate obtained from experimental data The one atom evaporation of singly charged silver
and mercury-silver binary cluster ions were investigated The lifetime distributions of both samplesand mercury-silver binary cluster ions were investigated The lifetime distributions of both samples
were widely broadened and resembled each other where dissociation energies which were relatedwere widely broadened and resembled each other where dissociation energies which were related
to lifetime were quite different From the size dependence of lifetime distribution Hgto lifetime were quite different From the size dependence of lifetime distribution Hg1212AgAg++ which which
could understand by geometrical icosahedron structure was turn out to be rather stablecould understand by geometrical icosahedron structure was turn out to be rather stable
CONTENTSCONTENTS
1 Introduction1 Introduction
1 1 Cluster1 1 Cluster 111 2 Mercury cluster1 2 Mercury cluster 33
1 3 The outline of this thesis1 3 The outline of this thesis 44
2 Experimental2 Experimental
2 1 Production of cluster ions2 1 Production of cluster ions 772 2 Double focussing mass spectrometer GEMMY2 2 Double focussing mass spectrometer GEMMY 77
2 3 Determination of fragmentation pattern of cluster ions2 3 Determination of fragmentation pattern of cluster ions 11112 3 1 Contour map modification method2 3 1 Contour map modification method 1313
2 3 1 Acceleration voltage scan method2 3 1 Acceleration voltage scan method 1818
3 Size distribution and fragmentation pattern of mercury-silver3 Size distribution and fragmentation pattern of mercury-silverbinarycluster ionsbinarycluster ions
3 1 Introduction3 1 Introduction 2222
3 2 Results3 2 Results 2323
3 2 1 Size distribution of mercury-silver binary cluster ion3 2 1 Size distribution of mercury-silver binary cluster ion 2323
3 2 2 Fragmentation pattern of mercury-silver binary cluster ion3 2 2 Fragmentation pattern of mercury-silver binary cluster ion 2929
3 3 Conclusions3 3 Conclusions 3939
4 Competition of fission and evaporation processes of multiply4 Competition of fission and evaporation processes of multiplycharged mercury cluster ionscharged mercury cluster ions
4 1 Introduction4 1 Introduction 41414 2 Determination of fragmentation channels of doubly and triply charged cluster4 2 Determination of fragmentation channels of doubly and triply charged cluster
ionsions44444 2 1 Evaporation of multiply charged cluster ions4 2 1 Evaporation of multiply charged cluster ions 44444 2 2 Fission of doubly charged cluster ions4 2 2 Fission of doubly charged cluster ions 4545
4 2 3 Fission of triply charged cluster ions4 2 3 Fission of triply charged cluster ions 4545
4 3 Results4 3 Results 4747
4 3 1 Observation of Hg4 3 1 Observation of HgnnAgAg2+2+ survived 10 survived 10-4-4 sec sec 4747
4 3 2 Evaporation processes of Hg4 3 2 Evaporation processes of HgnnAgAg2+2+ 49494 3 3 Evaporation processes of triply charged Hg4 3 3 Evaporation processes of triply charged Hgnn
3+3+ 52524 3 4 Fission processes of Hg4 3 4 Fission processes of Hgnn
2+2+ and Hg and HgnnAgAg2+2+ 56564 3 5 Fission processes of Hg4 3 5 Fission processes of Hgnn
3+3+ 5858
4 3 6 Calculation of 4 3 6 Calculation of QQ value value 6161
4 4 Conclusions4 4 Conclusions 6666
5 Lifetime distribution of cluster ions from a sputtering ion source5 Lifetime distribution of cluster ions from a sputtering ion source
5 1 Introduction5 1 Introduction 69695 2 Experimental conditions5 2 Experimental conditions 7070
5 3 Results5 3 Results 71715 3 1 Dissociation rate on time5 3 1 Dissociation rate on time 7171
5 3 2 Lifetime distributions5 3 2 Lifetime distributions 7676
54 Conclusions54 Conclusions 8080
-1--1-
1 Introduction1 Introduction
1 1 Cluster1 1 Cluster
The cluster is an aggregate The cluster is an aggregate consisting of 2 - 1000 atoms ( or molecules ) and its radius is inconsisting of 2 - 1000 atoms ( or molecules ) and its radius is in
the order of 10the order of 10 ÅÅ It is in one of the phase between a atom ( or molecule ) and bulk as shown in It is in one of the phase between a atom ( or molecule ) and bulk as shown in
Fig 1 1 It shows quantum-mechanical properties depending on its shape and size like atoms andFig 1 1 It shows quantum-mechanical properties depending on its shape and size like atoms and
molecules The characteristic point of the cluster is most of containing atoms are on the surfacemolecules The characteristic point of the cluster is most of containing atoms are on the surface
and so the surface phenomena take a significant part for its stabilities It also exhibits at finiteand so the surface phenomena take a significant part for its stabilities It also exhibits at finite
temperatures physical properties often encountered in macroscopic systems like liquids This istemperatures physical properties often encountered in macroscopic systems like liquids This is
due to the presence of large number of low-lying metastable statesdue to the presence of large number of low-lying metastable states
There are mainly two methods for producing cluster One is cohering the atoms or moleculesThere are mainly two methods for producing cluster One is cohering the atoms or molecules
1 10 102 103 105104 Consiting atoms
Cluster
Fine particle
106
Bulk
Atom
Surface atomsInner atoms
0 1 10
Particle radius ( Å)1 10 100
Fig 1 1 Classification of the fragments according to their sizes obtained by successive division ofFig 1 1 Classification of the fragments according to their sizes obtained by successive division of
materialmaterial
-2--2-
by adiabatic expansion method The clusters produced by this method have relatively low internalby adiabatic expansion method The clusters produced by this method have relatively low internal
energy ( low temperature ) The other way is subdividing the bulk into clusters by bombarding withenergy ( low temperature ) The other way is subdividing the bulk into clusters by bombarding with
neutral atoms ( FAB Fast Atom Bombardment ) or ions (SIMS Secondary Ion Mass Spectrom-neutral atoms ( FAB Fast Atom Bombardment ) or ions (SIMS Secondary Ion Mass Spectrom-
etry) The clusters having relatively high internal energy ( high temperature ) clusters are producedetry) The clusters having relatively high internal energy ( high temperature ) clusters are produced
using this method They cause the spontaneous fragmentation and are qualified for studying frag-using this method They cause the spontaneous fragmentation and are qualified for studying frag-
mentation processes The later production method was used in this experimentmentation processes The later production method was used in this experiment
The stabilities and characters of clusters are very sensitive to their sizes (consisting atoms)The stabilities and characters of clusters are very sensitive to their sizes (consisting atoms)
Therefore mass spectrometer which can separate the cluster ions by their sizes is available forTherefore mass spectrometer which can separate the cluster ions by their sizes is available for
cluster analyses Usually the discontinuous variations are observed in size distributions obtainedcluster analyses Usually the discontinuous variations are observed in size distributions obtained
from mass spectra These anomalous sizes are called ldquomagic numberrdquo that are clues to understandfrom mass spectra These anomalous sizes are called ldquomagic numberrdquo that are clues to understand
the structures of the clustersthe structures of the clusters
The clusters which the consisting atoms ( or molecules ) are bound by different kind ofThe clusters which the consisting atoms ( or molecules ) are bound by different kind of
binding forces were investigated The characteristic magic numbers were observed for each kindbinding forces were investigated The characteristic magic numbers were observed for each kind
of the clusterof the cluster
The magic numbers of noble gas clusters ( eg XeThe magic numbers of noble gas clusters ( eg Xenn++ ) observed in the mass spectrum were ) observed in the mass spectrum were nn
= 13 19 23 25 55 71 81 101 135 and 147 [11] These numbers are coincided with the numbers= 13 19 23 25 55 71 81 101 135 and 147 [11] These numbers are coincided with the numbers
of constituent atoms of the icosahedron or the double icosahedron structures The geometricallyof constituent atoms of the icosahedron or the double icosahedron structures The geometrically
packed structures are well known for van der Waals clusterspacked structures are well known for van der Waals clusters
The alkali-halide cluster [12] ( eg ( CsI )The alkali-halide cluster [12] ( eg ( CsI )nnCsCs++ ) which the binding force of bulks are ionic ) which the binding force of bulks are ionic
have the magic numbers of have the magic numbers of n n = 13 22 31 37 and 52 consisted with 27 45 63 75 and 105 atoms= 13 22 31 37 and 52 consisted with 27 45 63 75 and 105 atoms
respectively The structures of these cluster ions are understood to be rock-salt structures such asrespectively The structures of these cluster ions are understood to be rock-salt structures such as
( 3( 3 timestimes 33 timestimes 3 )3 ) ( 3 ( 3 timestimes 33 timestimes 5 )5 ) ( 3 ( 3 timestimes 33 timestimes 7 )7 ) ( 3 ( 3 timestimes 55 timestimes 55 ) ) and ( 3 and ( 3 timestimes 55 timestimes 77 ) ) respectively respectively
As compared with the geometrical stabilities of noble gas and alkali-halide clusters the sta-As compared with the geometrical stabilities of noble gas and alkali-halide clusters the sta-
bilities of alkali metal [13] and noble metal [14] clusters are interpreted by the valence electronsbilities of alkali metal [13] and noble metal [14] clusters are interpreted by the valence electrons
-3--3-
shell model This model is on the basis of a one-electron shell model in which the valence electronsshell model This model is on the basis of a one-electron shell model in which the valence electrons
are bound in a spherically symmetric potential well The cluster would be rather stable when theare bound in a spherically symmetric potential well The cluster would be rather stable when the
number of total valence electrons is a shell closed number such as 2 8 18 20 34 58 92number of total valence electrons is a shell closed number such as 2 8 18 20 34 58 92
1 2 Mercury cluster1 2 Mercury cluster
The electronic shell structure of mercury atom is 5The electronic shell structure of mercury atom is 5dd101066ss22 closed shell which is isoelectronic closed shell which is isoelectronic
with helium Therefore the diatomic molecule and smaller clusters are bound by the van der Waalswith helium Therefore the diatomic molecule and smaller clusters are bound by the van der Waals
force For intermediated cluster size the 6force For intermediated cluster size the 6ss and 6 and 6pp orbitals broaden as indicated in Fig 1 2 For orbitals broaden as indicated in Fig 1 2 For
bulk Hg the overlapping of 6bulk Hg the overlapping of 6ss and 6 and 6pp bands gives the metallic behaviors bands gives the metallic behaviors
Atom Bulk
6s
6p
Cluster
Fig 1 2 Electoric configurations of the Hg atom cluster and bulkFig 1 2 Electoric configurations of the Hg atom cluster and bulk
-4--4-
The non-metal to metal transition of mercury clusters was studied by various methodsThe non-metal to metal transition of mercury clusters was studied by various methods
BrBrJJchingac chingac et alet al [15] recorded the autoionization lines ( 5 [15] recorded the autoionization lines ( 5dd rarrrarr 6 6pp ) excited by synchrotron radia- ) excited by synchrotron radia-
tion The transition to metallic bonding occurs gradually from tion The transition to metallic bonding occurs gradually from nn ~~ 15 Rademann 15 Rademann et alet al [16] [16]
measured the ionization potentials of mercury cluster ions and found that the van der Waals behav-measured the ionization potentials of mercury cluster ions and found that the van der Waals behav-
ior deviated at ior deviated at nn ~~ 15 Kaiser 15 Kaiser et alet al [17] showed that large mercury clusters of approximately 100 [17] showed that large mercury clusters of approximately 100
atoms already possess a high density of atoms already possess a high density of pp states near Fermi level Harberland states near Fermi level Harberland et alet al [18] measured [18] measured
the ionization potentials and binding energies of Hgthe ionization potentials and binding energies of Hgnn and deduced that the bonding force first and deduced that the bonding force first
changes from van der Waals to covalent between changes from van der Waals to covalent between nn = 20 and = 20 and nn = 70 and then becomes metallic = 70 and then becomes metallic
above above nn = 100 = 100
1 3 The outline of this thesis1 3 The outline of this thesis
The experimental conditions are described in chapter 2 The production of cluster ions theThe experimental conditions are described in chapter 2 The production of cluster ions the
mass spectrometer used in this experiment and the determination of fragmentation pattern of sin-mass spectrometer used in this experiment and the determination of fragmentation pattern of sin-
gly charged cluster ions are describedgly charged cluster ions are described
The characters of mercury-silver binary cluster ions HgThe characters of mercury-silver binary cluster ions HgnnAgAg++ and Hg and HgnnAgAg22++ are discussed are discussed
from size distributions and fragmentation pattern in chapter 3from size distributions and fragmentation pattern in chapter 3
The fragmentation pattern of doubly and triply charged cluster ions were argued in chapter 4The fragmentation pattern of doubly and triply charged cluster ions were argued in chapter 4
The fragmentation channel of multiply charged cluster ion is roughly classified into fission andThe fragmentation channel of multiply charged cluster ion is roughly classified into fission and
evaporationevaporation
XXnni+i+ rarrrarr XXmm
j+j+ + + XXn-mn-m(( i-j i-j ))++ ( ( i = ji = j evaporation evaporation i gt ji gt j fission ) fission )
The fission and the evaporation processes are competed The size which the fission and the evapo-The fission and the evaporation processes are competed The size which the fission and the evapo-
ration occurred with same probability is called appearance size The evaporation are prior to theration occurred with same probability is called appearance size The evaporation are prior to the
-5--5-
fission at cluster size larger than the appearance size The appearance sizes of doubly and triplyfission at cluster size larger than the appearance size The appearance sizes of doubly and triply
charged mercury and mercury-silver cluster ions were determined by direct observation of evapo-charged mercury and mercury-silver cluster ions were determined by direct observation of evapo-
ration and fission processes Furthermore the ration and fission processes Furthermore the QQ values which is the total energy difference be- values which is the total energy difference be-
tween initial and final states of doubly and triply charged mercury clusters were calculated usingtween initial and final states of doubly and triply charged mercury clusters were calculated using
both the metallic droplet model and the experimental data reported in ref [18] The asymmetricboth the metallic droplet model and the experimental data reported in ref [18] The asymmetric
fission channels were expected for the metallic droplet model however the van der waals bondingfission channels were expected for the metallic droplet model however the van der waals bonding
of small cluster ions leaded to the symmetric fission channels of doubly charged cluster ionsof small cluster ions leaded to the symmetric fission channels of doubly charged cluster ions
The lifetime and internal energy distributions of cluster ions produced by the sputtering methodThe lifetime and internal energy distributions of cluster ions produced by the sputtering method
are discussed in chapter 5 The fragmentation channels of Agare discussed in chapter 5 The fragmentation channels of Agn+n+11++ rarrrarr Ag Agnn
++ + Ag ( + Ag ( n n = 12 14 ) and = 12 14 ) and
HgHgn+n+11AgAg++ rarrrarr Hg HgnnAgAg++ + Hg ( + Hg ( n n = 8 - 14 ) were investigated At first the fragmentation rates of each = 8 - 14 ) were investigated At first the fragmentation rates of each
channels was obtained from experimental data The fragmentation rates were rather power func-channels was obtained from experimental data The fragmentation rates were rather power func-
tion than exponential one The lifetime distributions were calculated using the experimental frag-tion than exponential one The lifetime distributions were calculated using the experimental frag-
mentation rates It was carried out based on the consideration that the non-exponential nature wasmentation rates It was carried out based on the consideration that the non-exponential nature was
originated by superposition of different lifetime according to the different internal energy Theoriginated by superposition of different lifetime according to the different internal energy The
stabilities of cluster mercury-silver cluster ions were also discussed by the size dependence ofstabilities of cluster mercury-silver cluster ions were also discussed by the size dependence of
lifetime distribution The characteristic cluster Hglifetime distribution The characteristic cluster Hg1212AgAg++ which could understand by icosahedron which could understand by icosahedron
structure turned out to be rather stablestructure turned out to be rather stable
-6--6-
ReferencesReferences
[11] O Echt K Sattler and E Recknagel [11] O Echt K Sattler and E Recknagel Phys Rev LettPhys Rev Lett 47 47 (1981) 1121 (1981) 1121
[12] J E Campana T M Barlac R J Colton J J Wyatt and B I Dunlap [12] J E Campana T M Barlac R J Colton J J Wyatt and B I Dunlap Phys Rev LettPhys Rev Lett 4747
10461046
[13] W D Knight K Clemenger W A deHeer W A Saunders M Y Chou and M Cohen[13] W D Knight K Clemenger W A deHeer W A Saunders M Y Chou and M Cohen
Phys Rev LettPhys Rev Lett 52 52 (1984) 2141(1984) 2141
[14] I Katakuse T Ichihara Y Fujita T Matsuo T Sakurai and H Matsuda [14] I Katakuse T Ichihara Y Fujita T Matsuo T Sakurai and H Matsuda Int J MassInt J Mass
Spectrom Ion ProcessesSpectrom Ion Processes 7474 (1986) 33 (1986) 33
[15] C Br[15] C BrJJchingac M Broyer Ph Cahuzac G Delacretaz P Labastie and L Wchingac M Broyer Ph Cahuzac G Delacretaz P Labastie and L Wooste ste Phys RevPhys Rev
LettLett 60 60 (1988) 275 (1988) 275
[16] K Rademann Ber Bunsenges [16] K Rademann Ber Bunsenges Phys ChemPhys Chem 9393 (1989) 653 (1989) 653
[17] B Kaiser and K Rademann [17] B Kaiser and K Rademann Phys Rev LettPhys Rev Lett 6969 (1992) 3204 (1992) 3204
[18] H Haberland H Kornmeier H Langosch M Oschwald and G Tanner [18] H Haberland H Kornmeier H Langosch M Oschwald and G Tanner J Chem SocJ Chem Soc
Faraday TransFaraday Trans 86 86 (1990) 2473(1990) 2473
-7--7-
2 Experimental2 Experimental
2 1 Production of cluster ions2 1 Production of cluster ions
The cluster ions were produced by Xe ions bombardment on a sample material The silverThe cluster ions were produced by Xe ions bombardment on a sample material The silver
plate was used as the sample to produce silver clusters and silver amalgam in case mercury andplate was used as the sample to produce silver clusters and silver amalgam in case mercury and
mercury-silver binary clusters The primary ions ( Xenon ions ) were produced by a dischargedmercury-silver binary clusters The primary ions ( Xenon ions ) were produced by a discharged
type of a compact ion gun [21] and were accelerated up to several keV The discharge current wastype of a compact ion gun [21] and were accelerated up to several keV The discharge current was
kept constant at 03 - 04 mA in order to obtain the stable ion beam intensity by controlling thekept constant at 03 - 04 mA in order to obtain the stable ion beam intensity by controlling the
discharge voltage and the Xe gas pressure The secondary ions were extracted and accelerateddischarge voltage and the Xe gas pressure The secondary ions were extracted and accelerated
toward the mass spectrometer by the potential applied to the electrostatic lens system The sche-toward the mass spectrometer by the potential applied to the electrostatic lens system The sche-
matic diagrams of the primary ion gun and the electrostatic lens system are shown in Fig 2 1matic diagrams of the primary ion gun and the electrostatic lens system are shown in Fig 2 1
2 2 Double focussing mass spectrometer GEMMY2 2 Double focussing mass spectrometer GEMMY
The cluster ions were mass analyzed by the sector type mass spectrometer ldquoGEMMYrdquo [22]The cluster ions were mass analyzed by the sector type mass spectrometer ldquoGEMMYrdquo [22]
shown in Fig 2 2 The field arrangement is QQHQC ( Q denotes a electric quadropole H ashown in Fig 2 2 The field arrangement is QQHQC ( Q denotes a electric quadropole H a
homogeneous magnetic sector C a cylindrical electric sector ) The radii of magnetic sector andhomogeneous magnetic sector C a cylindrical electric sector ) The radii of magnetic sector and
electric sector were 125 m and 090 m respectively The maximum flux density of the magnet waselectric sector were 125 m and 090 m respectively The maximum flux density of the magnet was
18 T The flight path from the main slit to the detector slit was 7635 m The vacuum pressure of18 T The flight path from the main slit to the detector slit was 7635 m The vacuum pressure of
mass analyzer was about 10mass analyzer was about 10-7-7 Torr Torr
-8--8-
A
Electrostatic lens system
Sample chip
Primary ion source
Acceleration Voltage
DischargeVoltage
Gas inlet
Anode
Cathodes
Va
Va
Va + Vd ( kV )Vd = 7 - 9
Fig 2 1 Schematic diagram of ion source and electrostatic lens systemFig 2 1 Schematic diagram of ion source and electrostatic lens system
-9--9-
Fig 2 2 Grand scale sector type of mass spectrometer GEMMYFig 2 2 Grand scale sector type of mass spectrometer GEMMY
Ion source Q lens Magnetic sector
Q lens
Electronicsector
Detector
-10--10-
AD board
Low pass filter
Pre Amp
Electron MultiplierConversion dinode
Detector slit
Oscilloscope
~-15 kV ~-2 kV
( sixteen stages )
Ion+
e-
Fig 2 3 Schematic diagrams of detector and signal to AD boardFig 2 3 Schematic diagrams of detector and signal to AD board
-11--11-
2 3 Determination of fragmentation pattern of cluster ions2 3 Determination of fragmentation pattern of cluster ions
The cluster ions produced by the sputtering ion source have high internal energy enough toThe cluster ions produced by the sputtering ion source have high internal energy enough to
cause the spontaneous fragmentations The contour map modification method and the accelerationcause the spontaneous fragmentations The contour map modification method and the acceleration
voltage scan method are used in this study in order to determine the fragmentation pattern of singlyvoltage scan method are used in this study in order to determine the fragmentation pattern of singly
charged cluster ions The concept of two methods are same The kinetic energy of product ionscharged cluster ions The concept of two methods are same The kinetic energy of product ions
which could path through the cylindric electric sector which could path through the cylindric electric sector EE0 0 ( eV charge )( eV charge ) was fixed and changed thewas fixed and changed the
acceleration voltage acceleration voltage VVaa ( V ) related to kinetic energy of precursor ion The mass ratio of ( V ) related to kinetic energy of precursor ion The mass ratio of MMpre pre M Mpropro
are equal to are equal to VVa a E E00 for singly charged cluster ion where for singly charged cluster ion where MMprepre and and MMpropro are the mass of precursor and are the mass of precursor and
product ion because the kinetic energy of precursor ion is approximately equally divided intoproduct ion because the kinetic energy of precursor ion is approximately equally divided into
products in proportional to each of their massproducts in proportional to each of their mass
The most advantageous point of the contour map modification method is that the fragmenta-The most advantageous point of the contour map modification method is that the fragmenta-
tion occurred at entire region of mass spectrometer can be observed This makes it possible totion occurred at entire region of mass spectrometer can be observed This makes it possible to
discuss lifetime distributions ( Chapter 5 ) On the other hand the relatively narrow limitation ofdiscuss lifetime distributions ( Chapter 5 ) On the other hand the relatively narrow limitation of
MMpre pre M Mpropro is disadvantage point It was supplemented by the acceleration voltage scan method is disadvantage point It was supplemented by the acceleration voltage scan method
In order to increase the detection efficiency the ions passing through a detector slit were postIn order to increase the detection efficiency the ions passing through a detector slit were post
accelerated up to about 15 keV and exchanged to electrons using conversion dinode The con-accelerated up to about 15 keV and exchanged to electrons using conversion dinode The con-
verted electrons were detected by a conventional sixteen-stage electron multiplier Mass spectraverted electrons were detected by a conventional sixteen-stage electron multiplier Mass spectra
were obtained by scanning the magnet current in a linear mode and were recorded using a 486 PCwere obtained by scanning the magnet current in a linear mode and were recorded using a 486 PC
with an analog to digital converter The schematic diagram of the detector and recorder are shownwith an analog to digital converter The schematic diagram of the detector and recorder are shown
in Fig 2 3in Fig 2 3
-12--12-
which mainly investigated the fragmentations occurred between ion source and magnetic sectorwhich mainly investigated the fragmentations occurred between ion source and magnetic sector
The acceleration voltage scan method is useful to determine the fragmentation channels yieldingThe acceleration voltage scan method is useful to determine the fragmentation channels yielding
small product ionssmall product ions
2 3 1 Contour map modification method2 3 1 Contour map modification method
The procedure of the contour map modification method was is as follows (1) The potentialThe procedure of the contour map modification method was is as follows (1) The potential
of the cylindrical electric sector and the width of energy slit were kept constant so that the ions ofof the cylindrical electric sector and the width of energy slit were kept constant so that the ions of
EE00 plusmnplusmn EE ΔΔ ( eV charge ) could path through the sector (2) The acceleration voltage was changed( eV charge ) could path through the sector (2) The acceleration voltage was changed
within the certain limitation by within the certain limitation by VV ΔΔ ( V ) step The value of ( V ) step The value of VV ΔΔ was decided to satisfy the relationwas decided to satisfy the relation
VV ΔΔ = = 22EE ΔΔ (3) Mass spectra were obtained by scanning the magnetic field in a linear mode ( B(3) Mass spectra were obtained by scanning the magnetic field in a linear mode ( B
scanning ) for each acceleration voltage (4) The obtained mass spectra were modified as a form ofscanning ) for each acceleration voltage (4) The obtained mass spectra were modified as a form of
a contour map for visual understanding Microcal Origin ver 41 ( Microcal Software Inc ) wasa contour map for visual understanding Microcal Origin ver 41 ( Microcal Software Inc ) was
used for modificationused for modification
The appearance positions in a contour map or appearance mass in mass spectra were differ-The appearance positions in a contour map or appearance mass in mass spectra were differ-
ent according to the occurring places in spite of the same fragmentation channel For convenienceent according to the occurring places in spite of the same fragmentation channel For convenience
the mass spectrometer is divided into five regions and named as ( see Fig 2 4 )the mass spectrometer is divided into five regions and named as ( see Fig 2 4 )
region1 electrostatic lens in ion sourceregion1 electrostatic lens in ion source
region2 field free region between ion source and magnetic sectorregion2 field free region between ion source and magnetic sector
region3 magnetic sectorregion3 magnetic sector
region4 field free region between magnetic sector and electric sectorregion4 field free region between magnetic sector and electric sector
region5 electric sectorregion5 electric sector
The mass spectra at acceleration voltages of 5100V and 5430V are shown in Fig 2 5 TheseThe mass spectra at acceleration voltages of 5100V and 5430V are shown in Fig 2 5 These
mass spectra were the parts of a series of the mass spectra acquired to study the fragmentation ofmass spectra were the parts of a series of the mass spectra acquired to study the fragmentation of
mercury-silver cluster ions by the contour map modification method The experimental conditionsmercury-silver cluster ions by the contour map modification method The experimental conditions
-13--13-
Fig 2 4 Five regions of GEMMYFig 2 4 Five regions of GEMMY
region1 electrostatic lens in ion sourceregion1 electrostatic lens in ion source
region2 field free region between ion source and magnetic sectorregion2 field free region between ion source and magnetic sector
region3 magnetic sectorregion3 magnetic sector
region4 field free region between magnetic sector and electric sectorregion4 field free region between magnetic sector and electric sector
region5 electric sectorregion5 electric sector
region2region1 region3
region4
region5
-14--14-
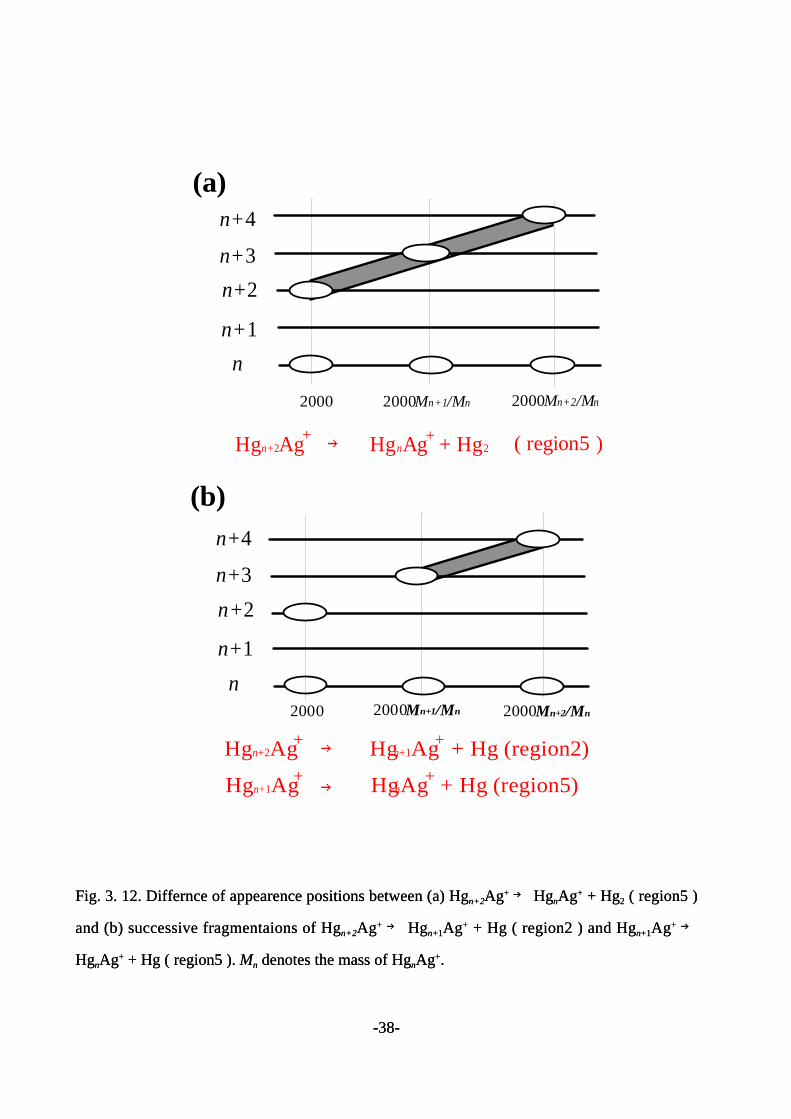
Fig 2 5 The mass spectra at acceleration volteges of (a) 5100 V and (b) 5430V The figuresFig 2 5 The mass spectra at acceleration volteges of (a) 5100 V and (b) 5430V The figures
labeled each fragmentaion peaks indicated the fragmentaion channel and region For instancelabeled each fragmentaion peaks indicated the fragmentaion channel and region For instance
symbol symbol nn ( ( rr ) corresponded to Hg ) corresponded to Hgn+1n+1AgAg++ rarrrarr Hg HgnnAgAg++ + Hg occurred in region + Hg occurred in region rr
2200 2400 2600 2800 300010-3
10-2
10-1
100
Inte
nsity
( ar
b u
nits
)
mz
2200 2400 2600 2800 300010-3
10-2
10-1
100
11 ( 3 ) plateau11 ( 4 )
11 ( 2 )
10 ( 5 )13 ( 5 )12 ( 5 )11 ( 5 )
13 ( 1 ) 14 ( 1 )12 ( 1 )11 ( 1 )
( b ) 5430 V
( a ) 5100 VIn
tens
ity (
arb
uni
ts )
mz
-15--15-
the potential of cylindrical electric sector and the width of energy slit were fixed so that the ions ofthe potential of cylindrical electric sector and the width of energy slit were fixed so that the ions of
5000 5000 plusmnplusmn 5 ( eV charge ) could path through5 ( eV charge ) could path through
It is difficult to assign the corresponding fragmentation channel and region of fragment peaksIt is difficult to assign the corresponding fragmentation channel and region of fragment peaks
or plateau observed in mass spectra from only one mass spectrum One must investigate severalor plateau observed in mass spectra from only one mass spectrum One must investigate several
mass spectra of adjacent acceleration voltages to assign accurate fragmentation channel and re-mass spectra of adjacent acceleration voltages to assign accurate fragmentation channel and re-
gion However it is not rational to see over 50 - mass spectra one by one The contour map modi-gion However it is not rational to see over 50 - mass spectra one by one The contour map modi-
fication method is therefore very useful for visual understanding of fragmentation channels andfication method is therefore very useful for visual understanding of fragmentation channels and
region as a whole The symbols region as a whole The symbols nn ( ( r r ) shown in Fig 2 5 are the assigned fragmentation channels) shown in Fig 2 5 are the assigned fragmentation channels
and regionsand regions
Now let us discuss the correlation between the positions in a contour map and regions1-5 inNow let us discuss the correlation between the positions in a contour map and regions1-5 in
which fragmentation occurred Here fragmentation channel is which fragmentation occurred Here fragmentation channel is AA++ rarrrarr B B++ + C + C where where AA++ denote the denote the
precursor ion precursor ion BB++ the product ion and the product ion and CC the neutral loss The mass of the precursor and the product the neutral loss The mass of the precursor and the product
ion are ion are MMprepre and and MMpropro respectively The potential of cylindrical electric sector was fixed so that the respectively The potential of cylindrical electric sector was fixed so that the
ions of 5 ( keV charge ) could path throughions of 5 ( keV charge ) could path through
Assuming that the electrostatic lens system was a pair of parallel plates for simplicity prod-Assuming that the electrostatic lens system was a pair of parallel plates for simplicity prod-
uct ions yielded at distance uct ions yielded at distance xx ( ( x x = 0 to be start of lens system ) in the electrostatic lens system has= 0 to be start of lens system ) in the electrostatic lens system has
kinetic energykinetic energy
minus
minus=Lx
M
MM1VU
pre
propreapro == 5 ( keV ) 5 ( keV ) (( 0 lt x lt L 0 lt x lt L ))
where where VVaa is the acceleration voltage and is the acceleration voltage and LL is the length of electrostatic lens system is the length of electrostatic lens system The kineticThe kinetic
energy of product ion energy of product ion UUpropro must be 5 keV in order to reach the detector Accordingly the accelera- must be 5 keV in order to reach the detector Accordingly the accelera-
tion voltage must be set depending on tion voltage must be set depending on x x for 5 kV ( for 5 kV ( xx= 0 ) to 5= 0 ) to 5MMprepreMMpropro ( kV ) ( ( kV ) ( x = L x = L ) Considered) Considered
with the fact that the product ions are mass analyzed by the magnetic sector the fragmentationwith the fact that the product ions are mass analyzed by the magnetic sector the fragmentation
occurred at region1 expected to appear as lines parallel to the abscissa axis in the contour mapoccurred at region1 expected to appear as lines parallel to the abscissa axis in the contour map
-16--16-
region1 ( region1 ( VVaa mz mz ) = ( 5 lt ) = ( 5 lt VVaa lt 5lt 5MMprepre M Mpropro MMpropro ))
Fragmentation occurred at region2 - 4 ( from exit of ion source to entrance of cylindricalFragmentation occurred at region2 - 4 ( from exit of ion source to entrance of cylindrical
electric field (C) ) appeared at the same acceleration voltage in contour map In order to passelectric field (C) ) appeared at the same acceleration voltage in contour map In order to pass
through the electric sector precursor ions must be accelerated by 5through the electric sector precursor ions must be accelerated by 5MMprepre M Mpropro ( keV ) The appearing( keV ) The appearing
mzmz values are different according to the position of fragmentation so that are analyzed ions by values are different according to the position of fragmentation so that are analyzed ions by
magnetic sector The fragmentation occurred at regin2-4 appeared in contour mapsmagnetic sector The fragmentation occurred at regin2-4 appeared in contour maps
region2 the peak at ( region2 the peak at ( VVaa mz mz ) = ( 5) = ( 5MMprepre M Mpropro MMpropro ))
region3 the line at ( region3 the line at ( VVaa mz mz ) = ( 5) = ( 5MMprepre M Mpropro MMpro pro lt lt M lt MM lt Mprepre22 M Mpropro ))
( line connecting region2 and region4 fragmentation peak )( line connecting region2 and region4 fragmentation peak )
region4 peak at ( region4 peak at ( VVaa mz mz ) = ( 5) = ( 5MMprepre M Mpropro MMprepre22 M Mpropro ))
The precursor ions that have the kinetic energy of 5 - 5The precursor ions that have the kinetic energy of 5 - 5MMproproMMprepre decomposed at certain place decomposed at certain place
in the cylindrical electric sector could path through it and are detected The fragmentation in elec-in the cylindrical electric sector could path through it and are detected The fragmentation in elec-
tronic sector are shown as the linetronic sector are shown as the line
region5 ( region5 ( VVaa mz mz ) = ( 5 lt ) = ( 5 lt VVaa lt 5lt 5MMprepre M Mpropro VVaa M Mprepre 55 ))
( connecting peaks of region4 and not fragmented peak of ( connecting peaks of region4 and not fragmented peak of MMprepre ) )
In summary a typical contour map and an appearance positions in the contour map corre-In summary a typical contour map and an appearance positions in the contour map corre-
sponding to fragmentation channel sponding to fragmentation channel AA ++ rarrrarr B B ++ + C + C at each region are described in Fig 2 6 The at each region are described in Fig 2 6 The
lines at acceleration voltages 5100 and 5430 V are corresponding to the mass spectra of Fig 2 5lines at acceleration voltages 5100 and 5430 V are corresponding to the mass spectra of Fig 2 5
(a) and (b) It is understood that the fragmentation channels and regions of peaks appeared in mass(a) and (b) It is understood that the fragmentation channels and regions of peaks appeared in mass
spectra can assign easily The appearance position of the fragmentation channel Hgspectra can assign easily The appearance position of the fragmentation channel Hg1212AgAg++ rarrrarr Hg Hg1111AgAg++
+ Hg is shown in the contour map The values of + Hg is shown in the contour map The values of MMpre pre and and MMpropro are 25150 and 23144 respectively are 25150 and 23144 respectively
The appearance position decomposing in each region areThe appearance position decomposing in each region are
region1 ( region1 ( VVaa ( keV ) ( keV ) mz mz ) = ( 5 lt ) = ( 5 lt VVaa lt 543 2314lt 543 2314 ) region2 ( ) region2 ( VVaa mz mz ) = ( 543 2314) = ( 543 2314 ))
region3 ( region3 ( VVaa mz mz ) = ( 543 2314 lt M lt) = ( 543 2314 lt M lt 2733 ) region4 ( 2733 ) region4 ( VVaa mz mz ) = ( 543 2733) = ( 543 2733 ))
region5 ( region5 ( VVaa mz mz ) = ( 5 lt ) = ( 5 lt VVaa lt 543 2515 lt 543 2515 VVaa 5 )5 )
-17--17-
5000 5100 5200 5300 5400 55002200
2400
2600
2800
3000
Fig 2 5 (b)Fig 2 5 (a)
Acceleration Voltage ( V )
mz
Fig 2 6 The typical contour map ( upper ) and the appearence position dependence of fragmenta-Fig 2 6 The typical contour map ( upper ) and the appearence position dependence of fragmenta-
tion regions in contour map about the channel of which the mass of precursor and product ion aretion regions in contour map about the channel of which the mass of precursor and product ion are
MMprepre and and MMpropro respectively ( bottom ) Two lines parallel to mz axis were correspond to Fig 2 5 respectively ( bottom ) Two lines parallel to mz axis were correspond to Fig 2 5
(a) and (b) The appearence position dependence of fragmentation regions about the channel Hg(a) and (b) The appearence position dependence of fragmentation regions about the channel Hg1212AgAg++
rarrrarr Hg Hg1111AgAg++ + Hg were also described in contour map + Hg were also described in contour map
5 5M Mpre pro
region1
region2
region3
region4
region5
Acceleration Voltage (kV)
mz
Mpro
Mpre
Mpre2 M pro
-18--18-
2 3 1 Acceleration voltage scan method2 3 1 Acceleration voltage scan method
Since about one minute was necessary for one magnetic field scan it took about 2 hours inSince about one minute was necessary for one magnetic field scan it took about 2 hours in
order to make a contour map consisted with 100 mass spectra It was difficult to maintain the ionorder to make a contour map consisted with 100 mass spectra It was difficult to maintain the ion
source constant and stable for such a long time As a result the contour map modification methodsource constant and stable for such a long time As a result the contour map modification method
was available when the consisting mass spectra were less than 100 In other words the experimentwas available when the consisting mass spectra were less than 100 In other words the experiment
to investigate the fragmentation channels which mass ratio of precursor ions to product ions wereto investigate the fragmentation channels which mass ratio of precursor ions to product ions were
about about MMprepreMMpropro lt 3 An acceleration voltage scan method is available to study the fragmentation lt 3 An acceleration voltage scan method is available to study the fragmentation
channels of channels of MMprepreMMpropro lt 6 This method was generally applied for the fragmentation yielding small lt 6 This method was generally applied for the fragmentation yielding small
size of the product ion A acceleration voltage scan spectrum corresponded to trace of the linesize of the product ion A acceleration voltage scan spectrum corresponded to trace of the line
parallel to a acceleration voltage axis of a contour map The decompositions occurred at region2parallel to a acceleration voltage axis of a contour map The decompositions occurred at region2
which have higher intensities than others were mainly investigatedwhich have higher intensities than others were mainly investigated
The schematic diagram of the acceleration voltage scan method is shown in Fig 2 7 At firstThe schematic diagram of the acceleration voltage scan method is shown in Fig 2 7 At first
the strength of the magnetic and the electric field were fixed so that the product ions of giventhe strength of the magnetic and the electric field were fixed so that the product ions of given
kinetic energy and mass could path through to detector When the function generator received thekinetic energy and mass could path through to detector When the function generator received the
start signal ( TTL signal ) from the PC for scanning then outputs the signal shown in Fig 2 8start signal ( TTL signal ) from the PC for scanning then outputs the signal shown in Fig 2 8
which was used as the reference signal of acceleration voltage power source Two accelerationwhich was used as the reference signal of acceleration voltage power source Two acceleration
voltage spectra could obtain for one scan because the reference signal was going up and down Thevoltage spectra could obtain for one scan because the reference signal was going up and down The
acceleration voltage power supply output the voltage multiplied the reference signal by 5000acceleration voltage power supply output the voltage multiplied the reference signal by 5000
A typical acceleration voltage scan spectrum is shown in Fig 2 9 where the selected productA typical acceleration voltage scan spectrum is shown in Fig 2 9 where the selected product
ion is Agion is Ag1313+ + of 1 keV Three peaks observed in the spectrum were determined as Agof 1 keV Three peaks observed in the spectrum were determined as Ag1313
++ of (a) non- of (a) non-
fragmented (b) in fragmentation channels Agfragmented (b) in fragmentation channels Ag1414++ rarrrarr Ag Ag1313
++ + Ag and (c) Ag + Ag and (c) Ag1515++ rarrrarr Ag Ag1313
++ + Ag + Ag22 These These
were calculated from the observed acceleration voltages The peak (a) had wide-based tail towardwere calculated from the observed acceleration voltages The peak (a) had wide-based tail toward
to the peak (b) This was the product ions in Agto the peak (b) This was the product ions in Ag1414++ rarrrarr Ag Ag1313
++ + Ag at region1 + Ag at region1
-19--19-
AD board( PC )
FunctiongeneratorStart Signal
( TTL signal )
Reference signal
Accelerationvoltage
Power supplyDetector
Ion Signal
Mass spectrometer
Fig 2 7 Schematic diagram of acceleration voltage scan methodFig 2 7 Schematic diagram of acceleration voltage scan method
0 5 10 15 20 25
02
04
06
08
10
Ref
eren
ce V
olta
ge (
V )
Time ( sec )
Fig 2 8 Reference voltage transmitted from function generator to acceleration voltage powerFig 2 8 Reference voltage transmitted from function generator to acceleration voltage power
supplysupply
-20--20-
08 10 12 14 16 18 20 22 24 26 28 30
1E-3
001
01
( c )
( b )
( a )
Inte
nsity
( ar
b u
nits
)
Acceleration Voltage ( kV )
Fig 2 9 Acceleration voltage scan spectrum that the selected product ions was AgFig 2 9 Acceleration voltage scan spectrum that the selected product ions was Ag1313+ + of 1 keVof 1 keV
-21--21-
ReferencesReferences
[21] I Katakuse T Ichihara H Nakabushi T Matsuo H Matsuda Mass spectrom [21] I Katakuse T Ichihara H Nakabushi T Matsuo H Matsuda Mass spectrom 31 31 (1983) (1983)
1111
[22] H Matsuda T Matsuo Y Fujita T Sakurai I Katakuse Int J Mass spectrum Ion Pro-[22] H Matsuda T Matsuo Y Fujita T Sakurai I Katakuse Int J Mass spectrum Ion Pro-
cesses cesses 9191 (1989) 1 (1989) 1
-22--22-
3 Size distribution and fragmentation pattern3 Size distribution and fragmentation patternof mercury-silver binarycluster ionsof mercury-silver binarycluster ions
3 1 Introduction3 1 Introduction
The size distributions of mercury-alkali metal binary cluster ions ( HgThe size distributions of mercury-alkali metal binary cluster ions ( HgnnKK++ Hg HgnnCsCs++ Hg HgnnRbRb++ ) )
produced by the sputter ion source were already investigated [312] The magic numbers produced by the sputter ion source were already investigated [312] The magic numbers n n = 8= 8
12 14 18 22 25 and 31 were observed at small size region These were independent of includ-12 14 18 22 25 and 31 were observed at small size region These were independent of includ-
ing alkali metal and were quite similar to those of van der Waals cluster ions This fact indicateding alkali metal and were quite similar to those of van der Waals cluster ions This fact indicated
that the bonding force of mercury-alkali metal binary cluster ions were also van der Waals force atthat the bonding force of mercury-alkali metal binary cluster ions were also van der Waals force at
nn lt 30 The structures of stable mercury-alkali metal cluster ions believed to be icosahedral or lt 30 The structures of stable mercury-alkali metal cluster ions believed to be icosahedral or
double icosahedral structures where alkali metal ions were at the center of the clusterdouble icosahedral structures where alkali metal ions were at the center of the cluster
The size distribution of large HgThe size distribution of large HgnnCsCs++ ( ( nn lt1000 ) clusters was also investigated [32] It lt1000 ) clusters was also investigated [32] It
showed the wave like variation where the cluster sizes at bottom of valleys were roughly consistentshowed the wave like variation where the cluster sizes at bottom of valleys were roughly consistent
with those of predicted electronic shell closed numbers The authors concluded that this was origi-with those of predicted electronic shell closed numbers The authors concluded that this was origi-
nated from the metallic structure of neutral Hgnated from the metallic structure of neutral Hgnn Two kinds of clusters Hg Two kinds of clusters Hgnn and Hg and HgnnCsCs++ were were
created in the ion source and the wave like variation was the results of formercreated in the ion source and the wave like variation was the results of former
In this section the size distribution and fragmentation pattern of mercury-silver binary clus-In this section the size distribution and fragmentation pattern of mercury-silver binary clus-
ter ions were reported Silver atom has the one ter ions were reported Silver atom has the one ss valence electron ( 5 valence electron ( 5ss electron ) as well as alkali electron ) as well as alkali
metalsmetals
-23--23-
3 2 Results3 2 Results
3 2 1 Size distribution of mercury-silver binary cluster ion3 2 1 Size distribution of mercury-silver binary cluster ion
The mass spectrum The mass spectrum mzmz = 350 - 4250 is shown in Fig 3 1 (a) Each peak of the same size = 350 - 4250 is shown in Fig 3 1 (a) Each peak of the same size
seen as like one peak had own peak pattern because both mercury and silver were not monoisotopeseen as like one peak had own peak pattern because both mercury and silver were not monoisotope
elements At elements At mzmz lt 1500 the mass resolution was enough to separate each peak Thus I could lt 1500 the mass resolution was enough to separate each peak Thus I could
assign composition of each cluster peak by comparing with calculated peak pattern The peakassign composition of each cluster peak by comparing with calculated peak pattern The peak
patterns of cluster ions were calculated from the IUPAC isotopic compositions of the elementspatterns of cluster ions were calculated from the IUPAC isotopic compositions of the elements
[33] and the 1983 atomic mass table [ 34 ] For example enlarged mass spectrum of Fig 3 1 (a)[33] and the 1983 atomic mass table [ 34 ] For example enlarged mass spectrum of Fig 3 1 (a)
between between mzmz = 895 - 925 and calculated peak pattern of Hg = 895 - 925 and calculated peak pattern of Hg44AgAg++ under the condition that mass under the condition that mass
resolution 1000 are shown in Fig 3 1 (b) and (c)resolution 1000 are shown in Fig 3 1 (b) and (c)
As for the As for the mzmz gt 1500 however insufficient mass resolution prevented from assigning the gt 1500 however insufficient mass resolution prevented from assigning the
composition of cluster ions by comparing with calculated peak patterns Accordingly the peakscomposition of cluster ions by comparing with calculated peak patterns Accordingly the peaks
were assigned by appeared masses and extrapolation from the composition of smaller size clusterwere assigned by appeared masses and extrapolation from the composition of smaller size cluster
ions The dominant peaks shown in Fig 3 1 (a) had the ions The dominant peaks shown in Fig 3 1 (a) had the mzmz values of 2006 values of 2006 nn + 1079 thus they + 1079 thus they
were assigned to Hgwere assigned to HgnnAgAg++
The enlarged mass spectrum of Fig 3 1 (a) is shown in Fig 3 2 There were two smallerThe enlarged mass spectrum of Fig 3 1 (a) is shown in Fig 3 2 There were two smaller
peaks between Hgpeaks between HgnnAgAg++ and Hg and Hgnn+1+1AgAg++ peaks They were assigned to be Hg peaks They were assigned to be Hgnn++ and Hg and Hgnn-1-1AgAg22
++ because because
their appeared masses were their appeared masses were mzmz values of 2006 values of 2006 nn and 2006 ( and 2006 ( n n - 1 ) + 2158 respectively These- 1 ) + 2158 respectively These
two peaks could not resolve at the two peaks could not resolve at the nn gt 15 however Hg gt 15 however Hgnn-1-1AgAg22++ were dominant considering the were dominant considering the
appeared appeared mzmz values values
The size distribution of HgThe size distribution of HgnnAgAg++ ( ( nn = 1 - 45 ) is shown in Fig 3 3 Generally the size = 1 - 45 ) is shown in Fig 3 3 Generally the size
distributions of cluster ions produced by a sputtering ion source are well known to logarithmicallydistributions of cluster ions produced by a sputtering ion source are well known to logarithmically
decreased as the size increased On the contrary the suddenly intensity decrease was observed at decreased as the size increased On the contrary the suddenly intensity decrease was observed at nn
-24--24-
Fig 3 1 (a) Mass spectrum of cluster ions made by 10 keV Xe ions bombardment on silverFig 3 1 (a) Mass spectrum of cluster ions made by 10 keV Xe ions bombardment on silver
mercury amalgammercury amalgam
Fig 3 1 (b) Enlarged mass spectrum of Fig 3 1 (a) The observed peak pattern of HgFig 3 1 (b) Enlarged mass spectrum of Fig 3 1 (a) The observed peak pattern of Hg44AgAg++ (c) (c)
Calcurated peak pattern of HgCalcurated peak pattern of Hg44AgAg++
895 900 905 910 915 920 925000
002
004
006
008
010
012
Isot
opic
rat
io
mz
895 900 905 910 915 920 92500
02
04
06
08
10(c)(b)
Inte
nsity
( ar
b u
nits
)
500 1000 1500 2000 2500 3000 3500 400000
02
04
06
08
10 (a)
Inte
nsity
(arb
uni
ts)
mz
-25--25-
Fig 3 2 Enlarged mass spectrum of Fig 3 1 (a) Two peaks between the HgFig 3 2 Enlarged mass spectrum of Fig 3 1 (a) Two peaks between the HgnnAgAg++ (saturated(saturated
peaks) were Hgpeaks) were Hgnn++ and Hg and Hgnn-1-1AgAg22
++
Fig 3 3 Size distribution of HgFig 3 3 Size distribution of HgnnAgAg++ ( ( nn = 1 - 45) The figures are the predicted shell closed sizes = 1 - 45) The figures are the predicted shell closed sizes
and number of total valence electron ( in parentheses) based on electronic shell modeland number of total valence electron ( in parentheses) based on electronic shell model
4 8 12 16 20 24 28 32 36 40 44001
01
1 4
29
17109
(40)(34)
(8)
(58)
(18) (20)
Inte
nsity
(arb
uni
ts)
Cluster size of HgnAg+ ( n )
1600 1800 2000 2200 2400 2600 2800 3000000
001
002
003
004
005
Hg13Ag2+
Hg14+
Hg10Ag2+
Hg11+
Hg7Ag2+
Hg8+
Inte
nsity
(arb
uni
ts)
mz
-26--26-
lt 10 Whether such intensity reduction at small size was caused by characters of mercury-silverlt 10 Whether such intensity reduction at small size was caused by characters of mercury-silver
clusters or by the creation mechanism was very interesting It would be argued in later text takingclusters or by the creation mechanism was very interesting It would be argued in later text taking
account of fragmentation patterns tooaccount of fragmentation patterns too
Several variations were appeared in size distribution at Several variations were appeared in size distribution at nn lt 40 The conspicuous step like lt 40 The conspicuous step like
variations were observed at cluster size variations were observed at cluster size nn = 10 22 and the less were observed at = 10 22 and the less were observed at nn = 17 26 The size = 17 26 The size
distribution of Hgdistribution of HgnnAgAg++ was quite different from Hg was quite different from HgnnMM++ ( M alkali metals ) The observed charac- ( M alkali metals ) The observed charac-
teristic numbers teristic numbers nn = 10 17 could not be interpreted by icosahedron or double icosahedron struc- = 10 17 could not be interpreted by icosahedron or double icosahedron struc-
tures Moreover the magic numbers indicating geometrical stabilities ( tures Moreover the magic numbers indicating geometrical stabilities ( nn = 12 18 ) were not ob- = 12 18 ) were not ob-
served The total number of valence electrons in Hgserved The total number of valence electrons in HgnnAgAg++ was 2 was 2n n Considering the electronic shellConsidering the electronic shell
structures of Hgstructures of HgnnAgAg++ the predicted magic number would be the predicted magic number would be n n = 4 9 10 17 20 and 29 ( total= 4 9 10 17 20 and 29 ( total
valence electrons were 8 18 20 34 40 and 58 respectively ) which relatively consistent with myvalence electrons were 8 18 20 34 40 and 58 respectively ) which relatively consistent with my
experimental result It is well known that the internal energy of cluster ( or temperature ) is greatlyexperimental result It is well known that the internal energy of cluster ( or temperature ) is greatly
contributed to variety of stability whether geometrical or electronic The internal energy of clusterscontributed to variety of stability whether geometrical or electronic The internal energy of clusters
made by sputtering method were widly distributed ( see chapter 5 ) so that the geometrical andmade by sputtering method were widly distributed ( see chapter 5 ) so that the geometrical and
electronic stabilities would be competed The small size of Hgelectronic stabilities would be competed The small size of HgnnAgAg++ ( ( nn lt 40 ) was rather understood lt 40 ) was rather understood
by electronic shell structure than geometric one which was differed from the mercury-alkali metalby electronic shell structure than geometric one which was differed from the mercury-alkali metal
binary cluster ions It was believed that the delocalization of the charge at silver atom of Hgbinary cluster ions It was believed that the delocalization of the charge at silver atom of HgnnAgAg++
caused the metalic structure in the size distribution of Hgcaused the metalic structure in the size distribution of HgnnAgAg++
The mass spectrum of The mass spectrum of mzmz = 10000 - 68200 is shown in Fig 3 4 The abscissa is expressed = 10000 - 68200 is shown in Fig 3 4 The abscissa is expressed
in number of Hg atoms in cluster size of Hgin number of Hg atoms in cluster size of HgnnAgAg++ Each peaks were resolved up to Each peaks were resolved up to nn = 250 Taking = 250 Taking
account the energy window of the cylindrical electric sector the product ions Hgaccount the energy window of the cylindrical electric sector the product ions HgnnAgAg++ ( ( nn gt 200 ) gt 200 )
yielded by a Hg atom evaporation at region2 could also reach to the detector and would appear atyielded by a Hg atom evaporation at region2 could also reach to the detector and would appear at
cluster size about ( cluster size about ( n n - 2 ) The wave like variation was appeared in size distributions at the cluster- 2 ) The wave like variation was appeared in size distributions at the cluster
size lager than size lager than nn gt 30 The cluster size of gt 30 The cluster size of nn = 46 74 100 133 176 225 284 were the bottom of = 46 74 100 133 176 225 284 were the bottom of
-27--27-
Fig 3 4 Mass spectrum of HgFig 3 4 Mass spectrum of HgnnAgAg++ ( ( nn = 50- 340 ) The wave like variations were appeared The = 50- 340 ) The wave like variations were appeared The
cluster size at the bottom of valley and total number of valence electrons ( in parentheses ) werecluster size at the bottom of valley and total number of valence electrons ( in parentheses ) were
shownshown
Fig 3 5 The size distribution of HgFig 3 5 The size distribution of HgnnAgAg22++ ( ( nn = 4 - 39 ) = 4 - 39 )
60 80 100 120 140 160 180 200 220 240 260 280 300 320 340
10-3
10-2
10-1
284(568)
225(450)
176(352)
133(266)
100(200)
74(148)
Inte
nsity
(arb
uni
ts)
Cluster Size of HgnAg+ ( n )
4 6 8 10 12 14 16 18 20 22 24 26 28 30 32 34 36 38 40001
01
1
Inte
nsity
( ar
b u
nits
)
Cluster size of HgnAg2+( n )
-28--28-
valleys This wave like variation and sizes at bottom of valleys were quite similar to those ofvalleys This wave like variation and sizes at bottom of valleys were quite similar to those of
HgHgnnCsCs++ that already reported [32] that already reported [32]
The shell closing numbers predicted by a shell model based on Woods-Saxon potential wereThe shell closing numbers predicted by a shell model based on Woods-Saxon potential were
58 92 138 198 254 268 338 440 562 [35] The number of valence electrons at bottoms of58 92 138 198 254 268 338 440 562 [35] The number of valence electrons at bottoms of
valleys were roughly equal calculated shell closing numbers Taking the total valence electrons ofvalleys were roughly equal calculated shell closing numbers Taking the total valence electrons of
HgHgnnAgAg++ was 2 was 2nn into account into account there were agreement between the total number of valence electrons there were agreement between the total number of valence electrons
at local minima and the shell closing numbers This agreement was interpreted as well as Hgat local minima and the shell closing numbers This agreement was interpreted as well as HgnnCsCs++
[32] The production of mercury-silver cluster ions was competed with neutral mercury clusters[32] The production of mercury-silver cluster ions was competed with neutral mercury clusters
HgHgnn where neutral species were believed to be a major yield Size distributions of neutral species where neutral species were believed to be a major yield Size distributions of neutral species
would seriously influence on the ions It is considered that weak intensities of Hgwould seriously influence on the ions It is considered that weak intensities of HgnnAgAg++ at valley at valley
were indicating the strong intensities of Hgwere indicating the strong intensities of Hgnn since the number of valence electrons in Hg since the number of valence electrons in Hgnn and and
HgHgnnAgAg++ were the same ( = 2 were the same ( = 2n n ) as illustrated in Fig 3 4) as illustrated in Fig 3 4
The size distribution of HgThe size distribution of HgnnAgAg22++ ( ( nn = 4 - 39 ) is shown in Fig 3 5 The suddenly discontinu- = 4 - 39 ) is shown in Fig 3 5 The suddenly discontinu-
ous was observed at ous was observed at nn = 18 however it was hard to understand its stability by electronic shell = 18 however it was hard to understand its stability by electronic shell
model because Hgmodel because Hg1818AgAg22++ has 37 total valence electrons It is believed that the stable Hg has 37 total valence electrons It is believed that the stable Hg1818AgAg22
++
cluster ion has geometric double icosahedron structure ( see the picture in Fig 3 5 ) The silvercluster ion has geometric double icosahedron structure ( see the picture in Fig 3 5 ) The silver
dimmer ion Agdimmer ion Ag22++ considered to be behaved like an atom at the center of these complex cluster considered to be behaved like an atom at the center of these complex cluster
The interpretations of mass spectra whether geometrical or elecrical were changed accord-The interpretations of mass spectra whether geometrical or elecrical were changed accord-
ing to the number of silver atom in the mercury clusters The same phenomenon was also observeding to the number of silver atom in the mercury clusters The same phenomenon was also observed
for Hgfor HgnnKKii++ [31] where size distributions were interpreted geometrically for [31] where size distributions were interpreted geometrically for ii = 1 2 and 3 on the = 1 2 and 3 on the
other hand electrically for other hand electrically for ii = 4 = 4
-29--29-
3 2 2 Fragmentation pattern of mercury-silver binary cluster ion3 2 2 Fragmentation pattern of mercury-silver binary cluster ion
A typical contour map is shown in Fig 3 6 indicating the fragmentation in the flight of theA typical contour map is shown in Fig 3 6 indicating the fragmentation in the flight of the
mass spectrometer The electric field was kept constant so that the ions having 2000 mass spectrometer The electric field was kept constant so that the ions having 2000 plusmnplusmn 10 eV could 10 eV could
path through while the acceleration voltage was varied from 2 kV to 3 kV by 20 V step The masspath through while the acceleration voltage was varied from 2 kV to 3 kV by 20 V step The mass
spectra were obtained at each acceleration voltage by a magnetic field scan The observed massspectra were obtained at each acceleration voltage by a magnetic field scan The observed mass
range was range was mzmz = 195 - 4975 Hg = 195 - 4975 HgnnAgAg++ ( ( nn = 1 - 24 ) could be observed The curved lines on the = 1 - 24 ) could be observed The curved lines on the
contour map show predicted positions when precursor cluster ions emitted neutral atoms or clustercontour map show predicted positions when precursor cluster ions emitted neutral atoms or cluster
in region2 The labeled figures at the upside are corresponding to the number of emitted mercuryin region2 The labeled figures at the upside are corresponding to the number of emitted mercury
atoms Basically the fragmentation channels which emitted more than two mercury atoms couldatoms Basically the fragmentation channels which emitted more than two mercury atoms could
not be distinguished whether cluster emission or successive atoms emissions Considering thenot be distinguished whether cluster emission or successive atoms emissions Considering the
flight time in region2 ( 10flight time in region2 ( 10-6-6 - 10 - 10-4-4 sec) however the large cases of mercury atoms losses believed to sec) however the large cases of mercury atoms losses believed to
be cluster emissionsbe cluster emissions
The possible fragmentation channels of HgThe possible fragmentation channels of HgnnAgAg++ ( ( nn = 1 - 10 ) were investigated for discussing = 1 - 10 ) were investigated for discussing
the sudden intensity decrease at small cluster size the sudden intensity decrease at small cluster size nn lt 10 In this case we used the acceleration lt 10 In this case we used the acceleration
voltage scan method because the mass ratios of voltage scan method because the mass ratios of MMprepreMMpropro ( ( MMprepre denotes the mass of precursor ion denotes the mass of precursor ion
and and MMpropro mass of product ion) were too large to use the contour map modification method as mass of product ion) were too large to use the contour map modification method as
mentioned in section 2 3 1 In the acceleration voltage scan method the product ions of Hgmentioned in section 2 3 1 In the acceleration voltage scan method the product ions of Hgnn++ ( ( nn = =
1 - 10 ) and Hg1 - 10 ) and HgnnAgAg++ ( ( nn = 0 - 9 ) of 1 keV kinetic energy were selected = 0 - 9 ) of 1 keV kinetic energy were selected
A typical acceleration voltage scan spectrum is shown in Fig 3 7 where the field strength ofA typical acceleration voltage scan spectrum is shown in Fig 3 7 where the field strength of
the magnet and the electric sector was set to path through Hgthe magnet and the electric sector was set to path through Hg22++ of 1 keV The precursor ions were of 1 keV The precursor ions were
determined from appeared acceleration voltage The fragment peaks labeled with naked figure determined from appeared acceleration voltage The fragment peaks labeled with naked figure nn
were the peaks coming from precursor ions of Hgwere the peaks coming from precursor ions of HgnnAgAg++ and labeled with circled figure were from and labeled with circled figure were from
HgHgnn++
The intensities of fragmentation channels from HgThe intensities of fragmentation channels from HgnnAgAg++ ( ( nn = 1 - 10 ) are shown in Table 3 1 = 1 - 10 ) are shown in Table 3 1
-30--30-
Fig 3 6 Fragmentation patterns shown in a typical contour map The curved lines showed theFig 3 6 Fragmentation patterns shown in a typical contour map The curved lines showed the
predicted positions when precursor clusters emitted neutral atom or cluster in region2 The labeledpredicted positions when precursor clusters emitted neutral atom or cluster in region2 The labeled
figures are corresponding to the emitting numbers of mercury atomsfigures are corresponding to the emitting numbers of mercury atoms
2000 2200 2400 2600 2800 3000
500
1000
1500
2000
2500
3000
3500
4000
4500
9 12111087653 421
Acceralation Voltage ( V )
mz
-31--31-
10 15 20 25 30 35 40 45 50 551E-3
001
01
1
10
n HgnAg+
⑦⑥⑤
④
③
⑧108 9765
432
n Hgn+
Precursor ions
Selected product ion Hg2+
Inte
nsity
( ar
b u
nits
)
Acceleration Voltage ( kV )
Fig 3 7 The typical acceleration voltage scan spectrum where the field strength of the magnetFig 3 7 The typical acceleration voltage scan spectrum where the field strength of the magnet
and the electric sector was set to path through Hgand the electric sector was set to path through Hg22++ of 1keV of 1keV
-32--32-
Precursor ions ( HgnAg+)
n 1 2 3 4 5 6 7 8 9 10
Product ions(HgnAg+
Hgn+)
0 0 0
1 0 0 0 0
1 20 29 35 20 49 61
2 7 8 47 39 45 38 46 52
2 272 375 275 347 231 173 146 151
3 15 16 10 19 27 42 57 81
3 875 559 703 554 409 291 187
4 7 0 0 0 0 0 0
4 836 657 599 551 436 312
5 7 0 0 0 0 0
5 1012 337 302 297 275
6 2 0 0 0 0
6 988 186 125 171
7 3 0 0 0
7 1082 225 171
8 5 0 0
8 1116 147
9 7 0
9 1115
10 3
Table 3 1 The intensities of fragmentation channels of HgTable 3 1 The intensities of fragmentation channels of HgnnAgAg++ The grayed lines were indicating The grayed lines were indicating
the fragmentation channels yielding Hgthe fragmentation channels yielding Hgnn++ as product ions as product ions
-33--33-
The major channel of each precursor ions was an emission of one mercury atom The fragmenta-The major channel of each precursor ions was an emission of one mercury atom The fragmenta-
tion channels yielding mercury cluster ions were only observed for product ions of Hgtion channels yielding mercury cluster ions were only observed for product ions of Hgnn++ ( ( nn = 2 3 = 2 3
) however these were considerably minor channels with respect to the channels yielding Hg) however these were considerably minor channels with respect to the channels yielding HgnnAgAg++
The cluster ions produced by sputtering method have high internal energy that caused theThe cluster ions produced by sputtering method have high internal energy that caused the
chain or branch fragmentations from production time One could only recognize the fragmentationchain or branch fragmentations from production time One could only recognize the fragmentation
occurred 10occurred 10-7-7 sec after the production in this experimental conditions The product ions yeilded by sec after the production in this experimental conditions The product ions yeilded by
the fragmentations occurred before 10the fragmentations occurred before 10-7-7 sec are not distinguish from non-fragmented ions of same sec are not distinguish from non-fragmented ions of same
size The sudden intensity decrease at small size region in mass spectra could be interpreted if thesize The sudden intensity decrease at small size region in mass spectra could be interpreted if the
fragmentation channels Hgfragmentation channels HgnnAgAg++ rarrrarr Hg Hgmm++ + Hg + Hgn-mn-mAg would occur mainly before 10Ag would occur mainly before 10-7-7 sec The sec The
fragmentation channels during the flight time in mass spectrometer ( 10fragmentation channels during the flight time in mass spectrometer ( 10-6-6 - 10 - 10-4-4 sec ) were investi- sec ) were investi-
gated whether the fragmentation channels Hggated whether the fragmentation channels HgnnAgAg++ rarrrarr Hg Hgmm++ + Hg + Hgn-mn-mAg was dominant at small sizeAg was dominant at small size
However the intensity decrease at small size could not interpret by the fragmentation pattern ofHowever the intensity decrease at small size could not interpret by the fragmentation pattern of
HgHgnnAgAg++ ( ( nn = 1 - 10 ) Thus intensity decrease was believed to be originated from the creation = 1 - 10 ) Thus intensity decrease was believed to be originated from the creation
mechanism It is believed that the low density of Ag atoms in mercury sample caused the produc-mechanism It is believed that the low density of Ag atoms in mercury sample caused the produc-
tion of relatively large mercury-silver binary cluster ions As a result the size distribution whichtion of relatively large mercury-silver binary cluster ions As a result the size distribution which
the intensities of small cluster ions decreased were observed in this experimentthe intensities of small cluster ions decreased were observed in this experiment
The fragmentation pattern of cluster size The fragmentation pattern of cluster size nn = 25 - 100 is shown in Figs 3 8 - 10 The consist- = 25 - 100 is shown in Figs 3 8 - 10 The consist-
ing mass spectra were obtained under condition that the cylindrical electric field was kept constanting mass spectra were obtained under condition that the cylindrical electric field was kept constant
so that the ions having 2000 so that the ions having 2000 plusmnplusmn 20 eV could path through and acceleration voltage was varied from 20 eV could path through and acceleration voltage was varied from
2 to 3 kV by 20 V step The curved lines on the contour map show predicted positions when2 to 3 kV by 20 V step The curved lines on the contour map show predicted positions when
precursor cluster ions emitted neutral atom or cluster in region2 The labeled figures at the upsideprecursor cluster ions emitted neutral atom or cluster in region2 The labeled figures at the upside
are corresponding to the emitting numbers of mercury atoms The intensities of fragmentationare corresponding to the emitting numbers of mercury atoms The intensities of fragmentation
channels losing large cluster emissions were gradually decreased accompanied with size increasechannels losing large cluster emissions were gradually decreased accompanied with size increase
The mainly observed fragmentation channels were HgThe mainly observed fragmentation channels were Hgnn ( ( nn = 1 - 3 ) emissions and priority were = 1 - 3 ) emissions and priority were
-34--34-
Fig 3 9 The framentation pattern of HgFig 3 9 The framentation pattern of HgnnAgAg++ ( ( nn = 25 - 50 ) modified in contour map = 25 - 50 ) modified in contour map
2000 2040 2080 2120 2160
26
28
30
32
34
36
38
40
42
44
46
48
2 3 41C
lust
er s
ize
of H
g nAg+ (
n )
Acceleration Voltage ( V )
-35--35-
Fig 3 9 The framentation pattern of HgFig 3 9 The framentation pattern of HgnnAgAg++ ( ( nn = 50 - 74 ) modified in contour map = 50 - 74 ) modified in contour map
1980 2000 2020 2040 2060 2080 2100 2120 2140 2160 2180
50
52
54
56
58
60
62
64
66
68
70
72
744321
Acceleration Votage ( V )
Clu
ster
siz
e of
Hg nA
g+ ( n
)
-36--36-
Fig 3 10 The framentation pattern of HgFig 3 10 The framentation pattern of HgnnAgAg++ ( ( nn = 75 - 100 ) modified in contour map = 75 - 100 ) modified in contour map
1980 2000 2020 2040 2060 2080 2100 2120 2140 2160 2180
76
78
80
82
84
86
88
90
92
94
96
98
4321
Acceleration Voltage ( V )
Clu
ste
size
of H
g nAg+ (
n )
-37--37-
changed from Hg to Hgchanged from Hg to Hg22 emission and furthermore the Hg emission and furthermore the Hg33 emission as the cluster size increased emission as the cluster size increased
( Fig 3 11 ) As mentioned above the Hg( Fig 3 11 ) As mentioned above the Hgnn emission and successive emission and successive n n mercury atoms emissionsmercury atoms emissions
were basically indistinguishable however the Hgwere basically indistinguishable however the Hg22 and Hg and Hg33 emission were found out to be mainly emission were found out to be mainly
two or three successive Hg emission by paying attention to appearance position in counter map fortwo or three successive Hg emission by paying attention to appearance position in counter map for
both cases It would be interpreted in following textboth cases It would be interpreted in following text
At the large cluster size region HgAt the large cluster size region Hgnn+1+1AgAg++ rarrrarr HgHgnnAgAg++ + Hg ( region4 ) and Hg + Hg ( region4 ) and Hgnn+3+3AgAg++ rarrrarr
HgHgnn+2+2AgAg++ + Hg ( region2 ) were almost superposed In the same way Hg + Hg ( region2 ) were almost superposed In the same way Hgnn+2+2AgAg++ rarrrarr HgHgnnAgAg++ + Hg + Hg22 ( (
region4 ) and Hgregion4 ) and Hgnn+6+6AgAg++ rarrrarr HgHgnn+4+4AgAg++ + Hg + Hg22 ( region2 ) were also superposed ( region2 ) were also superposed
The appearance positions of fragmentation channel HgThe appearance positions of fragmentation channel Hgnn+1+1AgAg++ rarrrarr HgHgnnAgAg++ + Hg occurred at + Hg occurred at
region5 in the contour map was slant line connecting between non-fragmented peaks Hgregion5 in the contour map was slant line connecting between non-fragmented peaks Hgnn+1+1AgAg++ and and
fragmentation peaks of channel Hgfragmentation peaks of channel Hgnn+1+1AgAg++ rarrrarr HgHgnnAgAg++ + Hg + Hg ( region4 ) which was appeared just( region4 ) which was appeared just
like the lines between non-fragmented Hglike the lines between non-fragmented HgnnAgAg++ peak and fragmentation peak of channel Hg peak and fragmentation peak of channel Hgnn+3+3AgAg++
rarrrarr Hg Hgnn+2+2AgAg++ + Hg + Hg ( region2 ) These slant lines between non-fragmented peaks and Hg emission( region2 ) These slant lines between non-fragmented peaks and Hg emission
peaks were appeared in Fig 3 7 at the size region peaks were appeared in Fig 3 7 at the size region nn = 25 - 40 and gradually disappeared as the main = 25 - 40 and gradually disappeared as the main
Fig 3 11 The size dependence of the observed main fragmentation channelsFig 3 11 The size dependence of the observed main fragmentation channels
Cluster size1 50
One Hg atom emission
Two Hg atoms emission
Three Hg atoms emission
100
-38--38-
Fig 3 12 Differnce of appearence positions between (a) HgFig 3 12 Differnce of appearence positions between (a) Hgn+2n+2AgAg++ rarrrarr Hg HgnnAgAg++ + Hg + Hg22 ( region5 ) ( region5 )
and (b) successive fragmentaions of Hgand (b) successive fragmentaions of Hgn+2n+2AgAg++ rarrrarr Hg Hgnn+1+1AgAg++ + Hg ( region2 ) and Hg + Hg ( region2 ) and Hgnn+1+1AgAg++ rarrrarr
HgHgnnAgAg++ + Hg ( region5 ) + Hg ( region5 ) MMnn denotes the mass of Hg denotes the mass of HgnnAgAg++
n
n+1
n+2
n+3
n+4
Hgn+2Ag HgnAg + Hg2 rarr+ +
2000 2000Mn+1Mn
n
n+1
n+2
n+3
n+4
Hgn+2Ag Hgn+1Ag + Hg (region2) rarr+ +
Hgn+1Ag HgnAg + Hg (region5) rarr+ +
2000 2000Mn+1Mn 2000Mn+2Mn
(a)
(b)
( region5 )
2000Mn+2Mn
-39--39-
fragmentation channel proceeded to Hgfragmentation channel proceeded to Hg22 emission emission
There was difference between appearance positions in contour map of dimer emissionThere was difference between appearance positions in contour map of dimer emission
HgHgn+2n+2AgAg++ rarrrarr Hg HgnnAgAg++ + Hg + Hg22 ( region5 ) ( Fig 3 12 (a) ) and successive fragmentations of Hg ( region5 ) ( Fig 3 12 (a) ) and successive fragmentations of Hgn+2n+2AgAg++
rarrrarr Hg Hgnn+1+1AgAg++ + Hg ( region2 ) and Hg + Hg ( region2 ) and Hgnn+1+1AgAg++ rarrrarr Hg HgnnAgAg++ + Hg ( region5 ) ( Fig312(b) ) The + Hg ( region5 ) ( Fig312(b) ) The
position corresponding with Hgposition corresponding with Hg22 emission was seen at the lines between non-fragmented Hg emission was seen at the lines between non-fragmented Hgn+2n+2AgAg++
peaks and fragmentation peaks Hgpeaks and fragmentation peaks Hgnn+6+6AgAg++ rarrrarr Hg Hgnn+4+4AgAg++ + Hg + Hg22 ( region2 ) On the other hand posi-( region2 ) On the other hand posi-
tion for successive Hg emissions were appeared as the slant lines between Hgtion for successive Hg emissions were appeared as the slant lines between Hgnn+4+4AgAg++ rarrrarr Hg Hgnn+3+3AgAg++
+ Hg+ Hg ( region2 ) and Hg( region2 ) and Hgnn+6+6AgAg++ rarrrarr Hg Hgnn+4+4AgAg++ + Hg + Hg22 ( region2 )( region2 )
The slant lines between Hg and HgThe slant lines between Hg and Hg22 emission peaks were only seen at the cluster size emission peaks were only seen at the cluster size nn gt 40 gt 40
These lines were not indicating the HgThese lines were not indicating the Hg22 emission at region5 but the successive Hg atom emissions emission at region5 but the successive Hg atom emissions
at region2 and region5 The same concept for the cluster size at region2 and region5 The same concept for the cluster size nn gt 70 may applicable to Hg gt 70 may applicable to Hg33 emis emis--
sion where successive three Hg atom emission occurredsion where successive three Hg atom emission occurred
3 3 Conclusions3 3 Conclusions
The size distributions of two type of mercury-silver binary cluster ions HgThe size distributions of two type of mercury-silver binary cluster ions HgnnAgAg++ and Hg and HgnnAgAg22++
were investigated The size distribution of Hgwere investigated The size distribution of HgnnAgAg++ was quite different from Hg was quite different from HgnnMM++ ( M alkali ( M alkali
metal ) at metal ) at nn lt 30 that the magic numbers were rather interpreted in electronic shell model structure lt 30 that the magic numbers were rather interpreted in electronic shell model structure
On the other hand the charactoristic number of On the other hand the charactoristic number of nn = 18 was observed for Hg = 18 was observed for HgnnAgAg22++ The stable The stable
HgHg1818AgAg22+ + was considered to be geometrical double icosahedron structurewas considered to be geometrical double icosahedron structure
The fragmentation patterns of HgThe fragmentation patterns of HgnnAgAg++ was also investigated There were many fragmenta- was also investigated There were many fragmenta-
tion channels for small cluster ions At the cluster size tion channels for small cluster ions At the cluster size nn is larger than 20 the one atom evaporation is larger than 20 the one atom evaporation
was the dominate channelswas the dominate channels
-40--40-
ReferencesReferences
[31] I Katakuse T Ichihara H Ito T Sakurai and T Matsuo [31] I Katakuse T Ichihara H Ito T Sakurai and T Matsuo Surface Review and LettersSurface Review and Letters 3 (1)3 (1)
(1996) 551(1996) 551
[32] H Ito T Sakurai T matsuo T Ichihara and I Katakuse [32] H Ito T Sakurai T matsuo T Ichihara and I Katakuse Phys Rev BPhys Rev B 48 (7)48 (7) (1993) 4741 (1993) 4741
[33] IUPAC [33] IUPAC Pure Appl ChemPure Appl Chem 6363 (1991) 991 (1991) 991
[34] A H Wapstra G Audi [34] A H Wapstra G Audi Nucl PhysNucl Phys A432A432 (1985) 1 (1985) 1
[35] H Nishioka K Hansen and B R Mottelson [35] H Nishioka K Hansen and B R Mottelson Phys Rev BPhys Rev B 4242 (1990) 9377 (1990) 9377
-41--41-
4 Competition of fission and evaporation pro-4 Competition of fission and evaporation pro-cesses of multiply charged mercury cluster ionscesses of multiply charged mercury cluster ions
4 1 Introduction4 1 Introduction
The natures of multiply charged cluster ion are critically different from singly charged onesThe natures of multiply charged cluster ion are critically different from singly charged ones
because the coulomb repulsive force effects on their stabilities Roughly speaking when the clusterbecause the coulomb repulsive force effects on their stabilities Roughly speaking when the cluster
size is small enough the coulomb repulsive force is comparable to binding force of the cluster Insize is small enough the coulomb repulsive force is comparable to binding force of the cluster In
the case the cluster ion which has enough internal energy cause the fragmentation into two chargedthe case the cluster ion which has enough internal energy cause the fragmentation into two charged
fragments ie fission processfragments ie fission process
Experimental study about the multiple charged cluster ions was first reported for differentExperimental study about the multiple charged cluster ions was first reported for different
kinds of bonding metal clusters Pbkinds of bonding metal clusters Pbnn2+2+ ionic clusters (NaI) ionic clusters (NaI)nn
2+2+ and van der Waals clusters Xe and van der Waals clusters Xenn2+2+
[41] In this work doubly charged cluster ions above certain cluster size were recognized as at[41] In this work doubly charged cluster ions above certain cluster size were recognized as at
peaks half-size values of singly charged cluster ions in mass spectra These sizes were called ldquocriti-peaks half-size values of singly charged cluster ions in mass spectra These sizes were called ldquocriti-
cal size cal size nnccrdquo and were 33 for Pbrdquo and were 33 for Pbnn2+2+ 23 for (NaF) 23 for (NaF)nn
2+2+ and 53 for Xe and 53 for Xenn2+2+ respectively Authors con- respectively Authors con-
cluded that only if doubly charged cluster ions exceeded a critical size they survive from ldquoCou-cluded that only if doubly charged cluster ions exceeded a critical size they survive from ldquoCou-
lomb explosionrdquo This result about xenon cluster ions was coincident with the computer simula-lomb explosionrdquo This result about xenon cluster ions was coincident with the computer simula-
tions [42] that the lifetime of Xetions [42] that the lifetime of Xe55552+2+ ( 10 ( 10-4-4 sec ) was remarkably longer than Xe sec ) was remarkably longer than Xe5151
2+2+ ( ( 10 10-10-10 sec sec ) The) The
subsequent experimental work about critical sizes of subsequent experimental work about critical sizes of nnccz+z+ up to up to zz = 4 of van der Waals bonding = 4 of van der Waals bonding
clusters were reported The ratio of critical sizes was clusters were reported The ratio of critical sizes was nncc44++ nncc
33++ nncc22++ = 16 9 4 while the values of the = 16 9 4 while the values of the
critical sizes vary widely between different substances [43]critical sizes vary widely between different substances [43]
The metal clusters were known to have an analogues with atomic nuclei that both systemsThe metal clusters were known to have an analogues with atomic nuclei that both systems
consist of fermions moving nearly freely in a confined space The shell model of nuclear physicsconsist of fermions moving nearly freely in a confined space The shell model of nuclear physics
was successfully applied to electronic properties of metal cluster [13 4] The giant dipole reso-was successfully applied to electronic properties of metal cluster [13 4] The giant dipole reso-
-42--42-
nances in the excitation spectra of nuclei have their similarity in the plasmon resonances of metalnances in the excitation spectra of nuclei have their similarity in the plasmon resonances of metal
clusters [44] Finally the droplet model describing the fission of unstable nuclei was applied toclusters [44] Finally the droplet model describing the fission of unstable nuclei was applied to
fragmentation of highly charged metal cluster ions although the nuclei were uniformly chargedfragmentation of highly charged metal cluster ions although the nuclei were uniformly charged
droplets while metal clusters were surface charged objectsdroplets while metal clusters were surface charged objects
In the cluster cases the relative weight of repulsive and cohesive forces is expressed throughIn the cluster cases the relative weight of repulsive and cohesive forces is expressed through
the fissility parameter as well as nuclei the fissility parameter as well as nuclei XX = = EEcoulombcoulomb 2E 2Esurfacesurface The cluster ions thatThe cluster ions that fission parameterfission parameter
of of XX lt 1 are unstable to fission The fission parameter can also expressed as lt 1 are unstable to fission The fission parameter can also expressed as XX = ( = (ZZ22NN)()(ZZ22NN))critcrit
where (where (ZZ22NN))critcrit corresponding to corresponding to XX = 1 is ( = 1 is (ZZ22NN))critcrit = 16 = 16BBrrwsws33FFee22 Here Here rrwsws is the Wigner-Seitz is the Wigner-Seitz
radius radius ee is the elementary charge and is the elementary charge and FF is the surface tension The ( is the surface tension The (ZZ22NN))crit crit value of mercuryvalue of mercury
cluster ions is calculated to 06cluster ions is calculated to 06
In case of In case of XX lt 1 however the fragmentations of multiply charged cluster ions are competi- lt 1 however the fragmentations of multiply charged cluster ions are competi-
tion of evaporation ( neutral atom loss ) and fission ( split into two charged fragments ) processestion of evaporation ( neutral atom loss ) and fission ( split into two charged fragments ) processes
although physical underlying are distinct each other Generally speaking evaporation is prior toalthough physical underlying are distinct each other Generally speaking evaporation is prior to
fission at the cluster size lager than called ldquoappearance size fission at the cluster size lager than called ldquoappearance size NNaardquordquo whichwhich defined as the size evapora-defined as the size evapora-
tion and fission occurred with equal probabilitytion and fission occurred with equal probability
Direct observations of fission fragments from doubly charged alkali-metal [45-7] and noble-Direct observations of fission fragments from doubly charged alkali-metal [45-7] and noble-
metal [48-10] cluster ions were reported in succession before and after the 1990metal [48-10] cluster ions were reported in succession before and after the 1990
Almost all possible fission channels of doubly charged silver cluster ions made by sputteringAlmost all possible fission channels of doubly charged silver cluster ions made by sputtering
method which produced relatively high temperature cluster were observed [48] They were pre-method which produced relatively high temperature cluster were observed [48] They were pre-
ferred to emit the odd-size cluster which have even number of electrons especially Agferred to emit the odd-size cluster which have even number of electrons especially Ag33++ and Ag and Ag99
++
known as magic numberknown as magic number
The fragmentation of gold cluster ions AuThe fragmentation of gold cluster ions Aunn22++ ( ( nn = 12 - 18 ) made by LMIS ( liquid metal ion = 12 - 18 ) made by LMIS ( liquid metal ion
source ) were studied by collisions with stationary krypton gas [4910] The probabilities of fissionsource ) were studied by collisions with stationary krypton gas [4910] The probabilities of fission
channels have the odd-even alternation that the product ions having even number of electron werechannels have the odd-even alternation that the product ions having even number of electron were
-43--43-
prior especially the channel yielding singly charged trimer was dominant for all clusters Theprior especially the channel yielding singly charged trimer was dominant for all clusters The
appearance size were determined to appearance size were determined to NNaa2+2+ = 14 experimentally = 14 experimentally
The fragmentations around critical sizes of alkali metal cluster ions ( lithium sodium andThe fragmentations around critical sizes of alkali metal cluster ions ( lithium sodium and
potassium ) made by supersonic expansion method were also reported [45-7] The major fissionpotassium ) made by supersonic expansion method were also reported [45-7] The major fission
channels were emission of singly charged trimer and pentamer that have even-number of electronschannels were emission of singly charged trimer and pentamer that have even-number of electrons
Furthermore Furthermore zz-fold charged sodium and cesium cluster ions were reported up to -fold charged sodium and cesium cluster ions were reported up to zz = 7 and = 7 and zz
= 4 for potassium and rubidium [41112] The critical sizes for appearance of each charged states= 4 for potassium and rubidium [41112] The critical sizes for appearance of each charged states
in the mass spectra which were called ldquoeffective appearance sizesin the mass spectra which were called ldquoeffective appearance sizes N Naaeffeff rdquo were determined What rdquo were determined What
these experiments showed were appearance sizes lied in narrow interval of these experiments showed were appearance sizes lied in narrow interval of XX-values ( 025 lt -values ( 025 lt XX lt lt
035 ) irrespective of charge state 035 ) irrespective of charge state zz and substances It is simply considered the appearance sizes lie and substances It is simply considered the appearance sizes lie
so close to a line of constant so close to a line of constant ZZ22NN because the fission barrier heights will scale with the surface because the fission barrier heights will scale with the surface
energy ie energy ie NN2323 whereas the activation energy for the competing evaporation process is essentially whereas the activation energy for the competing evaporation process is essentially
independent of independent of NN
There were several reports about multiply charged mercury cluster ions The doubly chargedThere were several reports about multiply charged mercury cluster ions The doubly charged
mercury cluster ions made by both adiabatic expansion [413-15] and sputtering methods [416]mercury cluster ions made by both adiabatic expansion [413-15] and sputtering methods [416]
were reported The observed critical sizes of Hgwere reported The observed critical sizes of Hgnn2+2+ were were nncc
2+2+ = 5 for former and = 5 for former and nncc2+2+ = 2 for latter = 2 for latter
The triply charged mercury cluster ions HgThe triply charged mercury cluster ions Hgnn3+3+ made by adiabatic expansion method was only made by adiabatic expansion method was only
reported and its critical size was reported and its critical size was nncc3+3+ = 46 [415] = 46 [415]
As mentioned in chapter 1 metal to non-metal transition of mercury cluster ions was oc-As mentioned in chapter 1 metal to non-metal transition of mercury cluster ions was oc-
curred at cluster size curred at cluster size n n ~~ 20 The characteristics of multiply charged cluster ions are very interest-20 The characteristics of multiply charged cluster ions are very interest-
ing subjects while only the critical sizes are known In this section competition of fission anding subjects while only the critical sizes are known In this section competition of fission and
evaporation processes of doubly charged mercury Hgevaporation processes of doubly charged mercury Hgnn2+2+ mercury-silver cluster ions Hg mercury-silver cluster ions HgnnAgAg2+2+ and and
triply charged mercury cluster ions Hgtriply charged mercury cluster ions Hgnn3+3+ were reported and determined the appearance size from were reported and determined the appearance size from
experimental data The fission channels were also investigated and compared with calculated experimental data The fission channels were also investigated and compared with calculated QQ
-44--44-
value ( the total energy difference before and after )value ( the total energy difference before and after )
4 2 Determination of fragmentation channels of doubly and4 2 Determination of fragmentation channels of doubly andtriply charged cluster ionstriply charged cluster ions
The fragmentations of multiply charged cluster ions can classify into evaporation and fissionThe fragmentations of multiply charged cluster ions can classify into evaporation and fission
processes In this experiment the fragmentations occurred at region2 were observed The voltageprocesses In this experiment the fragmentations occurred at region2 were observed The voltage
applied to electric sector was fixed so that the ions of 5 keVcharge could path through itapplied to electric sector was fixed so that the ions of 5 keVcharge could path through it
4 2 1 Evaporation of multiply charged cluster ions4 2 1 Evaporation of multiply charged cluster ions
The schematic diagram of evaporation process of multiply charged ions is shown in Fig41The schematic diagram of evaporation process of multiply charged ions is shown in Fig41
The acceleration voltage must fix to 5The acceleration voltage must fix to 5MM00MM11 ( ( MM00 denotes the mass of precursor ion denotes the mass of precursor ion MM11 mass of mass of
product ion ) in order to detect the product ions when the kinetic energy of precursor ion is as-product ion ) in order to detect the product ions when the kinetic energy of precursor ion is as-
M0 M1
m+
mVa ( keV )
m+
Va = 5M0M1
mVa M1M0 ( keV )
mVa M1M0 = 5m
Fig 4 1 The schematic diagram of evaporation process of Fig 4 1 The schematic diagram of evaporation process of mm-charged ion -charged ion MM00m+m+
-45--45-
sumed to be divided into products proportional to their masses The appearance acceleration volt-sumed to be divided into products proportional to their masses The appearance acceleration volt-
age is larger than 5 kV because the mass ratio is age is larger than 5 kV because the mass ratio is MM00MM11 gt 1 gt 1
The evaporation processes were investigated by acquiring the mass spectra where the accel-The evaporation processes were investigated by acquiring the mass spectra where the accel-
eration voltage was changed from 5080 to 5280 V by every 20 V step The fragment peaks wereeration voltage was changed from 5080 to 5280 V by every 20 V step The fragment peaks were
appeared at appeared at mzmz values of product ions values of product ions
4 2 2 Fission of doubly charged cluster ions4 2 2 Fission of doubly charged cluster ions
The schematic diagram of fission process of doubly charged cluster ion is shown in Fig42The schematic diagram of fission process of doubly charged cluster ion is shown in Fig42
In case of fission processes both of fragments are singly charged ion and basically they can beIn case of fission processes both of fragments are singly charged ion and basically they can be
observed However I observed heavier fission fragment observed However I observed heavier fission fragment MM11 which has the kinetic energiy of 2which has the kinetic energiy of 2VVaaMM11
MM00 ( keV ) The appearance acceleration voltage 5 ( keV ) The appearance acceleration voltage 5MM00 2 2MM11 ( kV ) will be less than 5 kV because ( kV ) will be less than 5 kV because
the mass ratiothe mass ratio M M00MM11 is between 1 and 2 The most advantageous point for observing the fissionis between 1 and 2 The most advantageous point for observing the fission
processes under 5 kV acceleration voltage is the exclusion of the effect from evaporation processesprocesses under 5 kV acceleration voltage is the exclusion of the effect from evaporation processes
mainly that of singly charged ions Unfortunately fragmentation peaks can not be observed whenmainly that of singly charged ions Unfortunately fragmentation peaks can not be observed when
the mass ratio is the mass ratio is MM11MM00 = 12 ( ie the precursor ion is decomposed to two same fission fragments= 12 ( ie the precursor ion is decomposed to two same fission fragments
) because the fragments and same size of non-fragmented ions are not distinguishable) because the fragments and same size of non-fragmented ions are not distinguishable
4 2 3 Fission of triply charged cluster ions4 2 3 Fission of triply charged cluster ions
The schematic diagram of fission process of triply charged cluster ions is shown in Fig 4 3The schematic diagram of fission process of triply charged cluster ions is shown in Fig 4 3
In this case singly and doubly charged fission fragments are yielded when the precursor ions de-In this case singly and doubly charged fission fragments are yielded when the precursor ions de-
compose into two fragments The kinetic energies of singly and doubly charged product ions arecompose into two fragments The kinetic energies of singly and doubly charged product ions are
33VVaaMM11MM00 and 3 and 3VVaaMM22MM00 ( keV ) ( ( keV ) ( MM11 denotes the mass of singly charged product ion denotes the mass of singly charged product ion MM22 mass of mass of
doubly charged product ion ) respectively Furthermore the appearance acceleration voltages aredoubly charged product ion ) respectively Furthermore the appearance acceleration voltages are
55MM0033MM11 ( kV ) and 10 ( kV ) and 10MM0033MM22 ( kV ) respctively If the mass ratio of ( kV ) respctively If the mass ratio of MM11MM00 is more than 13 the is more than 13 the
-46--46-
2+ 1+ 1+
M0 M1 M2
2Va ( keV ) 2Va M1M0 ( keV )
Va = 5M0 2M1 lt 5
gt
2Va M1M0 = 5( ∵ 1 lt M0 M1 lt 2 )
Fig 4 2 The schematic diagram of fission process of doubly charged cluster ionsFig 4 2 The schematic diagram of fission process of doubly charged cluster ions
3+ 1+ 2+
M0 M1 M2
3Va ( keV )
Va = 5M03M1 lt 5
3Va M1M0 3Va M2M0
3Va M1M0 = 5
3Va M2M0 = 10
(i) M1M0 gt 13
Va = 10M03M1 lt 5
Fig 4 3 The schematic diagram of fission process of triply charged cluster ionsFig 4 3 The schematic diagram of fission process of triply charged cluster ions
-47--47-
4 3 Results4 3 Results
4 3 1 Observation of Hg4 3 1 Observation of HgnnAgAg2+2+ survived 10 survived 10-4-4 sec sec
The mass spectrum of The mass spectrum of mzmz = 1700 - 4400 is shown in Fig 4 4 (a) As mentioned in section = 1700 - 4400 is shown in Fig 4 4 (a) As mentioned in section
3 the dominant peaks were the Hg3 the dominant peaks were the HgnnAgAg++ ( ( n n = 8 - 21 ) and the peaks of Hg= 8 - 21 ) and the peaks of Hgnn+1+1++ and Hg and HgnnAgAg22
++ ( (nn = 8 - = 8 -
20) were observed between Hg20) were observed between HgnnAgAg++ and Hg and Hgnn+1+1AgAg++
The enlarged mass spectrum of Fig 4 4 (a) within the The enlarged mass spectrum of Fig 4 4 (a) within the mzmz = 1780 - 3080 is shown in Fig 4 = 1780 - 3080 is shown in Fig 4
4 (b) which I focused on the critical size of Hg4 (b) which I focused on the critical size of HgnnAgAg2+2+ The abscissa is expressed the cluster size of The abscissa is expressed the cluster size of
HgHgnnAgAg2+2+ The ions must survive at least 10 The ions must survive at least 10-4-4 sec in order to reach detector without fragmentation sec in order to reach detector without fragmentation
considering the flight time in the mass spectrometer at acceleration voltage of 5 kV The odd-evenconsidering the flight time in the mass spectrometer at acceleration voltage of 5 kV The odd-even
alternation was appeared in intensities of peaks observed at integer values but it seems to be notalternation was appeared in intensities of peaks observed at integer values but it seems to be not
reflecting the character of Hgreflecting the character of HgnnAgAg2+2+ Unfortunately the even size peaks of Hg Unfortunately the even size peaks of HgnnAgAg2+2+ were overlapped were overlapped
singly charged fragment will be observed at acceleration voltage under 5 kV On the other hand insingly charged fragment will be observed at acceleration voltage under 5 kV On the other hand in
case of the mass ratiocase of the mass ratio M M11MM00 lt 13 ( or lt 13 ( or MM22MM00 gt 23 ) the doubly charged fragment will be observedgt 23 ) the doubly charged fragment will be observed
at acceleration voltage under 5 kV As well as the doubly charged fission when the mass ratio isat acceleration voltage under 5 kV As well as the doubly charged fission when the mass ratio is
MM11MM00 = 13 fission fragments can not distinguish from same size of non-fragmented ions Fur-= 13 fission fragments can not distinguish from same size of non-fragmented ions Fur-
thermore doubly charged fragments are indistinguishable from the singly charged one which havethermore doubly charged fragments are indistinguishable from the singly charged one which have
the half mass of doubly charged ones For example fragmentation channels Hgthe half mass of doubly charged ones For example fragmentation channels Hg46463+3+ rarrrarr Hg Hg4040
2+2+ + Hg + Hg66++
is indistinguishable from Hgis indistinguishable from Hg46463+3+ rarrrarr Hg Hg2626
2+2+ + Hg + Hg2020++
The fission processes were investigated using the acceleration voltage scan method TheThe fission processes were investigated using the acceleration voltage scan method The
scanned acceleration voltage range was under 5 kV in order to exlude the evaporation of singlyscanned acceleration voltage range was under 5 kV in order to exlude the evaporation of singly
charged ionscharged ions
-48--48-
18 19 20 21 22 23 24 25 26 27 28 29 30
0002
0004
0006
0008
0010(b)
Cluster size of HgnAg2+ ( n )
2000 2500 3000 3500 40000
2
4
6
8
10(a)
Inte
nsity
(arb
uni
ts)
mz
Fig 4 4 (a) Typical mass spectrum of Fig 4 4 (a) Typical mass spectrum of mzmz = 1700 - 4400 (b) Enlarged mass spectrum of (a) = 1700 - 4400 (b) Enlarged mass spectrum of (a)
within the within the mzmz = 1780 - 3080 where the abscissa is expressed in the cluster size of Hg = 1780 - 3080 where the abscissa is expressed in the cluster size of HgnnAgAg2+2+
-49--49-
with Hgwith Hgn2n2CrCr++ and Hg and Hgn2n2FeFe++ The chromium and iron were originated from electrode of the primary The chromium and iron were originated from electrode of the primary
ion gun There were no peaks at the position of odd size of Hgion gun There were no peaks at the position of odd size of HgnnAgAg2+2+ smaller than cluster size smaller than cluster size nn = 21 = 21
There was ambiguity about critical size whether There was ambiguity about critical size whether nncc2+2+ = 20 or 21 = 20 or 21
Existence of the doubly charged mercury cluster ions HgExistence of the doubly charged mercury cluster ions Hgnn2+2+ survived at least 10 survived at least 10-4-4 sec was not sec was not
clear because the even and odd-size of ions were overlapped with Hgclear because the even and odd-size of ions were overlapped with Hgnn22++ and Hg and Hg((nn-1)2-1)2AgAg++ respec- respec-
tively The triply charged cluster ions Hgtively The triply charged cluster ions Hgnn3+3+ and Hg and HgnnAgAg3+3+ were also not observed were also not observed
4 3 2 Evaporation processes of Hg4 3 2 Evaporation processes of HgnnAgAg2+2+
The mass spectrum at acceleration voltage 5160V is shown in Fig 4 5 (a) The peaks la-The mass spectrum at acceleration voltage 5160V is shown in Fig 4 5 (a) The peaks la-
beled with open circle beled with open circle ( ( ) ) indicated the product ions of fragmentation channels Hg indicated the product ions of fragmentation channels Hgnn+1+1AgAg++ rarrrarr
HgHgnnAgAg++ + Hg ( region1 ) They appeared at + Hg ( region1 ) They appeared at mzmz = 2006 = 2006nn + 1079 ( + 1079 ( nn = 11 - 18 ) The peaks appeared = 11 - 18 ) The peaks appeared
between these peaks labeled with solid circle ( between these peaks labeled with solid circle ( ) were corresponding to the fragmentation ) were corresponding to the fragmentation
channels Hgchannels HgnnAgAg++ rarrrarr HgHgnn-1-1AgAg++ + Hg ( region5 ) The increasing of peak intensities at + Hg ( region5 ) The increasing of peak intensities at mzmz = 2900 - = 2900 -
3500 were caused by overlapping with fragmentation channels Hg3500 were caused by overlapping with fragmentation channels HgnnAgAg++ rarrrarr HgHgnn++ + Ag and Hg + Ag and HgnnAgAg22
++
rarrrarr HgHgnnAgAg++ + Ag ( region2 ) + Ag ( region2 )
The enlarged spectrum of Fig 4 5 (a) at The enlarged spectrum of Fig 4 5 (a) at mzmz = 2560 - 3565 is shown in Fig 4 5 (b) The = 2560 - 3565 is shown in Fig 4 5 (b) The
abscissa is expressed in the cluster size of Hgabscissa is expressed in the cluster size of HgnnAgAg2+2+ The peaks labeled with open star ( The peaks labeled with open star ( ) were ) were
indicating the product ions of the evaporation processes Hgindicating the product ions of the evaporation processes Hgnn+1+1AgAg2+2+ rarrrarr Hg HgnnAgAg2+2+ + Hg ( region2 + Hg ( region2 ))
The mass spectra at acceleration voltages 5220 - 5280 V are shown in Fig 4 6 The abscissaThe mass spectra at acceleration voltages 5220 - 5280 V are shown in Fig 4 6 The abscissa
expressed the cluster size of Hgexpressed the cluster size of HgnnAgAg2+2+ which correspond to mass region of which correspond to mass region of mzmz = 1460 - 2660 The = 1460 - 2660 The
peaks indicating product ions of fragmentation channels Hgpeaks indicating product ions of fragmentation channels Hgnn+1+1AgAg2+2+ rarrrarr Hg HgnnAgAg2+2+ + Hg ( region2 ) + Hg ( region2 )
were also labeled with open star ( were also labeled with open star ( ) The observed minimum product ion was Hg ) The observed minimum product ion was Hg1919AgAg2+ 2+ so thatso that
the Hgthe Hg2020AgAg2+2+ was the smallest ions came out from acceleration region ( region1 ) and cause the was the smallest ions came out from acceleration region ( region1 ) and cause the
evaporation In this case it took about 10evaporation In this case it took about 10-6-6 sec for passing through the acceleration region sec for passing through the acceleration region
-50--50-
25 26 27 28 29 30 31 32 33 34 35000
001
002
003
004
005
006
007
008
009
010
Cluster size of HgnAg2+ ( n )
2400 2600 2800 3000 3200 3400 3600 380000
02
04
06
08
10
12
14
( b )
( a )In
tens
ity (
arb
uni
ts )
mz
Inte
nsity
( a
rb u
nits
)
Fig 4 5 (a) The mass spectrum of acceleraion voltage 5160 V (b) The enlarged mass spectrum ofFig 4 5 (a) The mass spectrum of acceleraion voltage 5160 V (b) The enlarged mass spectrum of
(a) within the (a) within the mzmz = 2560 - 3565 which the abscissa is expressed in the cluster size of Hg = 2560 - 3565 which the abscissa is expressed in the cluster size of HgnnAgAg2+2+
The peaks labeled with open star ( The peaks labeled with open star ( ) were indicating fragmentation channels Hg ) were indicating fragmentation channels Hgnn+1+1AgAg2+2+ rarrrarr
HgHgnnAgAg2+2+ + Hg + Hg
-51--51-
Fig 4 6 (a) The mass spectrum of acceleraion voltage (a) 5220 V (b) 5240 V (c) 5260 V and (d)Fig 4 6 (a) The mass spectrum of acceleraion voltage (a) 5220 V (b) 5240 V (c) 5260 V and (d)
5280 V The peaks labeled with open star ( 5280 V The peaks labeled with open star ( ) were indicating fragmentation channels Hg ) were indicating fragmentation channels Hgnn+1+1AgAg2+2+
rarrrarr Hg HgnnAgAg2+2+ + Hg The observed minimum product ion was Hg + Hg The observed minimum product ion was Hg1919AgAg2+2+
14 15 16 17 18 19 20 21 22 23 24 25 26000002004006008010
14 15 16 17 18 19 20 21 22 23 24 25 26000002004006008010
(a) 5220 V
(b) 5240 V
(c) 5260 V
(d) 5280 V
Cluster size of HgnAg2+ ( n )
14 15 16 17 18 19 20 21 22 23 24 25 26000002004006008010
minimum product ion
Inte
nsity
( ar
b u
nits
)
14 15 16 17 18 19 20 21 22 23 24 25 26000002004006008010
-52--52-
The evaporation processes of HgThe evaporation processes of Hgnn2+2+ could not observe because these peaks were overlapped could not observe because these peaks were overlapped
with fragmentation peaks of Hgwith fragmentation peaks of Hgnn++ Hg HgnnAgAg++ and Hg and HgnnAgAg22
++ occurred at region1 occurred at region1
4 3 3 Evaporation processes of triply charged Hg4 3 3 Evaporation processes of triply charged Hgnn3+3+
The mass spectrum at acceleration voltage 5100 V is shown in Fig 4 7 (a) The peaksThe mass spectrum at acceleration voltage 5100 V is shown in Fig 4 7 (a) The peaks
mainly appeared in this spectrum corresponded to fragmentation channels Hgmainly appeared in this spectrum corresponded to fragmentation channels Hgnn+1+1AgAg++ rarrrarr Hg HgnnAgAg++ + +
Hg ( region1 ) HgHg ( region1 ) Hgnn+1+1AgAg++ rarrrarr Hg HgnnAgAg++ + Hg ( region5 ) superposition of Hg + Hg ( region5 ) superposition of Hgnn+1+1++ rarrrarr Hg Hgnn
++ + Hg and + Hg and
HgHgnnAgAg22++ rarrrarr Hg Hgnn-1-1AgAg22
++ + Hg ( region1 ) which were labeled with symbols + Hg ( region1 ) which were labeled with symbols and and respec- respec-
tivelytively
Enlarged spectrum of Fig 4 7 (a) at Enlarged spectrum of Fig 4 7 (a) at mzmz = 2450 - 4000 which abscissa expressed cluster size = 2450 - 4000 which abscissa expressed cluster size
of Hgof Hgnn3+3+ is shown in Fig 4 7 (b) The peaks labeled with open stars ( is shown in Fig 4 7 (b) The peaks labeled with open stars ( ) indicating the product) indicating the product
ions of evaporation channels Hgions of evaporation channels Hgnn+1+13+3+ rarrrarr Hg Hgnn
3+3+ + Hg ( region2 ) These peaks could not distinguish + Hg ( region2 ) These peaks could not distinguish
from Hgfrom HgnnAgAg223+3+ rarrrarr Hg Hgnn-1-1AgAg22
3+3+ + Hg ( region2 ) because of insufficient mass resolving power How- + Hg ( region2 ) because of insufficient mass resolving power How-
ever the latter channels were excluded from consideration It was believed that the multiply chargedever the latter channels were excluded from consideration It was believed that the multiply charged
mercury-silver binary cluster ions were difficult to produce in this experimental conditions in viewmercury-silver binary cluster ions were difficult to produce in this experimental conditions in view
of the triply charged evaporation processes of Hgof the triply charged evaporation processes of HgnnAgAg3+3+ were not observed The evaporation chan- were not observed The evaporation chan-
nels Hgnels Hgnn+1+13+3+ rarrrarr Hg Hgnn
3+3+ + Hg ( region2 ) were well resolved from fragmentation peaks of singly + Hg ( region2 ) were well resolved from fragmentation peaks of singly
charged cluster ions for only charged cluster ions for only n n = 3= 3mm+1 (+1 ( m m integer ) integer )
The mass spectra of acceleration voltage of 5120 and 5140 V which took notice on minimumThe mass spectra of acceleration voltage of 5120 and 5140 V which took notice on minimum
product ion of evaporation channels Hgproduct ion of evaporation channels Hgnn+1+13+3+ rarrrarr Hg Hgnn
3+3+ + Hg ( region2 ) are shown in Fig4 8 These + Hg ( region2 ) are shown in Fig4 8 These
peaks were also labeled with open stars peaks were also labeled with open stars (()) The observed minimum product ion was The observed minimum product ion was n n = 46= 46
As mentioned in section 3 the fragmentation channels of successive two atoms emissionAs mentioned in section 3 the fragmentation channels of successive two atoms emission
were prior to one atom emission in cluster size over were prior to one atom emission in cluster size over nn = 40 The mass spectra at acceleration = 40 The mass spectra at acceleration
voltage 5200 and 5220 V are shown in Fig 4 9 that payed attention to product ions yielded by twovoltage 5200 and 5220 V are shown in Fig 4 9 that payed attention to product ions yielded by two
-53--53-
38 40 42 44 46 48 50 52 54 56 58000
001
002
003
004
005
Cluster size of Hgn3+ ( n )
2500 3000 3500 4000 450000
01
02
03
04
In
tens
ity (
arb
uni
ts )
mz
Fig 4 7 (a) The mass sepctrum at acceleration voltage 5100 V (b) Enlarged spectrum of (a) atFig 4 7 (a) The mass sepctrum at acceleration voltage 5100 V (b) Enlarged spectrum of (a) at
mzmz = 2450 - 4000 which absicca is expressed in cluster size of Hg = 2450 - 4000 which absicca is expressed in cluster size of Hgnn3+3+
-54--54-
Fig 4 8 The mass spectra of acceleration voltage of 5120 V (a) and 5140 V (b) EvaporationFig 4 8 The mass spectra of acceleration voltage of 5120 V (a) and 5140 V (b) Evaporation
channels Hgchannels Hgn+1n+13+3+ rarrrarr Hg Hgnn
3+3+ + Hg ( region2 ) were labeled with open stars ( + Hg ( region2 ) were labeled with open stars ( ))
38 40 42 44 46 48 50 52 54 56 580000
0005
0010
0015
0020
0025
0030
minimum product ion
Inte
nsity
( a
rb u
nits
)
Cluster size of Hgn3+ ( n )
38 40 42 44 46 48 50 52 54 56 580000
0005
0010
0015
0020
0025
0030
Inte
nsity
( a
rb u
ntis
)
-55--55-
Fig 4 9 The mass spectra of acceleration voltage of 5200 V (a) and 5220 V (b)Fig 4 9 The mass spectra of acceleration voltage of 5200 V (a) and 5220 V (b)
Succesive emission of two Hg atoms from HgSuccesive emission of two Hg atoms from Hgnn+2+23+3+ were labeled with open stars were labeled with open stars (())
43 44 45 46 47 48 49 50 51 52 53 54 55 56 57
0000
0005
0010
0015
0020
0025
0030
minimum product ions
43 44 45 46 47 48 49 50 51 52 53 54 55 56 57
0000
0005
0010
0015
0020
0025
0030
Inte
nsity
( a
rb u
nits
)
Cluster size of Hgn3+ ( n )
-56--56-
successive Hg atoms loss Hgsuccessive Hg atoms loss Hgnn+2+23+3+ rarrrarr Hg Hgnn
3+3+ + 2Hg ( region2 ) which were corresponded to the + 2Hg ( region2 ) which were corresponded to the
peaks labeled with open stars (peaks labeled with open stars ( ) These fragmentation peaks were well resolved from others in) These fragmentation peaks were well resolved from others in
case case nn = 3 = 3mm + 1 and 2 When + 1 and 2 When nn = 3 = 3mm these peaks were superposed on the peaks corresponding tothese peaks were superposed on the peaks corresponding to
the fragmentation Hgthe fragmentation Hgmm+1+1++ rarrrarr Hg Hgmm
++ + Hg ( region1 ) however the former would be larger content + Hg ( region1 ) however the former would be larger content
The minimum size of product ions was The minimum size of product ions was nn = 44 The smallest triply charged mercury cluster sur- = 44 The smallest triply charged mercury cluster sur-
vived 10vived 10-6-6 sec was concluded in Hg sec was concluded in Hg46463+3+ from the results of both one and two atoms emission cases from the results of both one and two atoms emission cases
4 3 4 Fission processes of Hg4 3 4 Fission processes of Hgnn2+2+ and Hg and HgnnAgAg2+2+
The fission processes of doubly charged mercury and mercury-silver binary cluster ions wereThe fission processes of doubly charged mercury and mercury-silver binary cluster ions were
investigated using an acceleration voltage scan method by selecting the fission fragments of Hginvestigated using an acceleration voltage scan method by selecting the fission fragments of Hgnn++ ( (
nn = 2 - 19 ) and Hg = 2 - 19 ) and HgnnAgAg++ ( ( nn = 8 - 19 ) of 5 keV kinetic energy = 8 - 19 ) of 5 keV kinetic energy
The acceleration voltage scan spectrum is shown in Fig 4 10 (a) where the selected fissionThe acceleration voltage scan spectrum is shown in Fig 4 10 (a) where the selected fission
fragment is Hgfragment is Hg33++ Two peaks appeared at acceleration voltage 3333 V and 4166 V indicating the Two peaks appeared at acceleration voltage 3333 V and 4166 V indicating the
product ions from precursor ions Hgproduct ions from precursor ions Hg442+2+ and Hg and Hg55
2+2+ respectively In addition to fission peaks the respectively In addition to fission peaks the
peak corresponding to the charge transfer process with residual gas Hgpeak corresponding to the charge transfer process with residual gas Hg332+2+ + ( gas ) + ( gas )00 rarrrarr Hg Hg33
++ + (gas) + (gas)++
( region2 ) was observed at 2500 V( region2 ) was observed at 2500 V
The charge transfer process was observed for only doubly charged dimer and trimer TheThe charge transfer process was observed for only doubly charged dimer and trimer The
second ionization potential of neutral cluster is generally noted assecond ionization potential of neutral cluster is generally noted as V VIPIP2+2+ = A + Bn = A + Bn-13-13 As the cluster As the cluster
size decreases the ionization potential increases Moreover the electron affinity of doubly chargedsize decreases the ionization potential increases Moreover the electron affinity of doubly charged
cluster ion also increases The electron affinities of dimer and trimer are considered to be highcluster ion also increases The electron affinities of dimer and trimer are considered to be high
enough to cause the charge transfer with residual gasenough to cause the charge transfer with residual gas
The acceleration voltage scan spectrum is shown in Fig 4 10 (b) where the selected fissionThe acceleration voltage scan spectrum is shown in Fig 4 10 (b) where the selected fission
fragment is Hgfragment is Hg99++ The fission peaks were assigned from the acceleration voltages The acceleration The fission peaks were assigned from the acceleration voltages The acceleration
voltage to detect the fission fragment Hgvoltage to detect the fission fragment Hg99++ from Hg from Hgnn
2+2+ ( ( nn = 13 - 17 ) and Hg = 13 - 17 ) and HgnnAgAg2+2+ ( ( nn = 16 17 ) is = 16 17 ) is
-57--57-
2500 3000 3500 4000 4500 50000000
0001
0002
0003( b ) Selected product ions Hg9
+
Hg17Ag2+
Hg142+
Hg132+
Hg16Ag2+
Hg152+ Hg16
2+ Hg172+
Precursor ions ( fission )
Inte
nsity
( ar
b u
nits
)
Acceleration Voltage ( V )
2500 3000 3500 4000 4500 50000000
0002
0004
0006
0008
0010
0012
0014
0016
0018
0020 ( a )
Hg32+( Charge exchange )
Hg42+ ( Fission )
Hg52+ ( Fission )
Selected Product ions Hg3+
Inte
nsity
( a
rb u
nits
)
Acceleration Voltage ( V )
Fig 4 10 The acceleration voltage scan spectra where selected product ions are (a) HgFig 4 10 The acceleration voltage scan spectra where selected product ions are (a) Hg33++ and (b) and (b)
HgHg99++ of 5keV kinetic energies of 5keV kinetic energies
-58--58-
given by 1385given by 1385MMprepre ( ( MMprepre denotes the mass of precorsor ions where 2006 denotes the mass of precorsor ions where 2006nn for Hg for Hgnn2+2+ and 2006 and 2006n n ++
1079 for Hg1079 for HgnnAgAg2+2+ ) )
The intensities of fission channels of HgThe intensities of fission channels of Hgnn2+2+ ( ( nn = 3 - 22 ) are shown in Table 41 The fission = 3 - 22 ) are shown in Table 41 The fission
fragments which had the mass larger than half of precursorrsquos could observed at under 5 kV accel-fragments which had the mass larger than half of precursorrsquos could observed at under 5 kV accel-
eration voltage The open triangle ( eration voltage The open triangle ( ) showed the channels which decomposing into two same ) showed the channels which decomposing into two same
fission fragments Such a channel could not be observed The cross ( fission fragments Such a channel could not be observed The cross ( timestimes ) symbols showed the ) symbols showed the
channels which were not observed ( under detection limit )channels which were not observed ( under detection limit )
Any peak was observed corresponding fission fragments of HgAny peak was observed corresponding fission fragments of Hgnn++ ( ( nn = 14 - 17 ) and Hg = 14 - 17 ) and HgnnAgAg++
( ( nn = 8 - 18 ) from Hg = 8 - 18 ) from Hgnn2+2+ or Hg or HgnnAgAg2+2+ It was found out that intensities of doubly charged mercury It was found out that intensities of doubly charged mercury
cluster ions were considerably higher than that of doubly charged mercury-silver binary clustercluster ions were considerably higher than that of doubly charged mercury-silver binary cluster
ions It was conincident with assumption that multiply charged silver complex cluster ions wereions It was conincident with assumption that multiply charged silver complex cluster ions were
less produced in this experimental conditionsless produced in this experimental conditions
The largest precursor ion caused the fission processes was HgThe largest precursor ion caused the fission processes was Hg22222+2+ The appearance sizes of The appearance sizes of
doubly charged mercury and mercury-silver binary cluster ions were both determined as doubly charged mercury and mercury-silver binary cluster ions were both determined as NNaa2+2+ = 20 = 20
by taking account the result of evaporation processby taking account the result of evaporation process
4 3 5 Fission processes of Hg4 3 5 Fission processes of Hgnn3+3+
The fission processes of triply charged mercury cluster ions were also investigated using anThe fission processes of triply charged mercury cluster ions were also investigated using an
acceleration voltage scan method by selecting the product ions Hgacceleration voltage scan method by selecting the product ions Hgnn++ ( ( nn = 15 - 45 ) of 5 keV kinetic = 15 - 45 ) of 5 keV kinetic
energy and Hgenergy and Hgnn2+2+ ( ( nn = 30 - 45 ) of 10 keV kinetic energy The acceleration voltage scan spectra are = 30 - 45 ) of 10 keV kinetic energy The acceleration voltage scan spectra are
shown in Fig 4 13 where the selected fission fragments are Hgshown in Fig 4 13 where the selected fission fragments are Hg38382+2+ Hg Hg3939
2+2+ and Hg and Hg40402+2+ As men- As men-
tioned in section 4 2 3 even-size of doubly charged fission fragments such as Hgtioned in section 4 2 3 even-size of doubly charged fission fragments such as Hg38382+2+ and Hg and Hg4040
2+2+
are indistinguishable from half size of singly charged fragments Hgare indistinguishable from half size of singly charged fragments Hg1919++ and Hg and Hg2020
++ respectively For respectively For
example the fission channel corresponding to peak observed in Fig 4 11 (a) could not assignexample the fission channel corresponding to peak observed in Fig 4 11 (a) could not assign
-59--59-
Observed product ions ( Hgn+ )
Precursor ions( Hgn
2+)
2 3 4 5 6 7 8 9 10 11 12
3 108
4 28
5 139 32
6 78 8
7 81 31 1
8 59 4 times
9 47 15 2 times
10 22 7 times times
11 15 10 2 times times
12 10 5 times times times
13 18 8 3 times times times
14 14 6 6 times times
15 7 9 8 4 times
16 9 8 5 2
17 8 7 4 2
18 5 4 2
19 5 4 1
20 3 3
21 2 3
22 2
Table 4 1 Intensities of fission channels of HgTable 4 1 Intensities of fission channels of Hgnn2+2+ ( ( nn =3 - 22 ) The symbol of open triangle ( =3 - 22 ) The symbol of open triangle ( ) )
showed the channels that could not observe because the precursor ions were decomposed into twoshowed the channels that could not observe because the precursor ions were decomposed into two
same products The symbol of cross ( same products The symbol of cross ( timestimes ) showed the channels not observed ) showed the channels not observed
-60--60-
Fig 4 11 The acceleration voltage scan spectra of which the selected cluster ions of (a) HgFig 4 11 The acceleration voltage scan spectra of which the selected cluster ions of (a) Hg38382+2+ and and
HgHg1919++ (b) Hg (b) Hg3939
2+2+ and (c) Hg and (c) Hg40402+2+ and Hg and Hg2020
++
2500 3000 3500 4000 4500 5000
1E-3
001
01
Inte
nsity
( ar
b u
nits
)
(b) Selected Product ions Hg392+
Hg463+
Hg453+
2500 3000 3500 4000 4500 5000
1E-3
001
01
Acceleraion Voltage ( V )
(c) Selected Product ions
Hg20+ and Hg40
2+
Hg473+Hg46
3+
2500 3000 3500 4000 4500 5000
1E-3
001
01
Hg453+Hg44
3+
(a) Selected Product ions
Hg19+ and Hg38
2+
-61--61-
whether Hgwhether Hg45453+3+ rarrrarr Hg Hg3838
2+2+ + Hg + Hg77++ or Hg or Hg4545
3+3+ rarrrarr Hg Hg26262+2+ + Hg + Hg1919
++ However former would be plausible However former would be plausible
since the nearly same intense peak was observed in acceleration voltage scan spectrum selectingsince the nearly same intense peak was observed in acceleration voltage scan spectrum selecting
the odd size of doubly charged fission fragment Hgthe odd size of doubly charged fission fragment Hg39392+2+ ( Fig 4 11 (b) ) which was not selected ( Fig 4 11 (b) ) which was not selected
with singly charged fission fragmentswith singly charged fission fragments
The fission processes were increased for clusters smaller than HgThe fission processes were increased for clusters smaller than Hg47473+3+ The appearance size of The appearance size of
triply charged mercury cluster ions was determined as triply charged mercury cluster ions was determined as NNaa3+3+ = 46 The prior fission channels of triply = 46 The prior fission channels of triply
charged mercury cluster ions Hgcharged mercury cluster ions Hgnn3+3+ were emission of Hg were emission of Hg66
++ and Hg and Hg77++ In contrast to doubly charged In contrast to doubly charged
cluster ions the fission channels of triply charged mercury cluster ions were asymmetriccluster ions the fission channels of triply charged mercury cluster ions were asymmetric
4 3 6 Calculation of 4 3 6 Calculation of QQ value value
A schematic diagram representing fission process is shown in Fig 4 12 where A schematic diagram representing fission process is shown in Fig 4 12 where BBff is fission is fission
barrier and barrier and QQ is the total energy difference between initial and final states The total energy is the total energy difference between initial and final states The total energy EEtottot((nznz))
of of zz-charged -charged nn-atom cluster-atom cluster X Xnnz+z+ is defined as the energy required for the process is defined as the energy required for the process
X ni+
X n-mj+ +Xm
( i - j )+Q
Bf
Fig 4 12 A schematic diagram representing fission process where Fig 4 12 A schematic diagram representing fission process where BBff is fission barrier and is fission barrier and QQ is the is the
total energy difference between before and aftertotal energy difference between before and after
-62--62-
XXnnz+z+ rarrrarr ( ( n - z n - z )) e e-- + nX + nX++
EEtottot (( n z n z )) = - = - ( ( n - z )Vn - z )VIPIP -E -Eatat(( n n ))
where where VVIPIP is the ionization potential of the atom is the ionization potential of the atom XX and and EEatat(( n z n z ) is the atomization energy which is) is the atomization energy which is
the energy for the processthe energy for the process
XXnnz+z+ rarrrarr zX zX ++ + ( + ( n - z n - z )) X X
Using the Born-Herber cycleUsing the Born-Herber cycle
XXnn rarrrarr nXnXdarrdarr darrdarr
XXnnz+z+ rarrrarr zX zX ++ + ( + ( n - z n - z )) X X
one deducedone deduced
EEatat(( n z n z )) == E Eatat(( n n )) + zV + zVIPIP - V - VIPIPz+z+ (( n n ) )
where where EEatat( ( nn ) is the atomization energy of neutral cluster ) is the atomization energy of neutral cluster XXnn and and VVIPIPz+z+ (( n n ) is the ) is the zz-ionization-ionization
potential of potential of nn-atom neutral cluster The total energy is expressed as sum of the atomization and the-atom neutral cluster The total energy is expressed as sum of the atomization and the
ionization termionization term
EEtottot (( n z n z )) = -E = -Eatat(( n n )) - nV - nVIPIP + V + VIPIPz+z+ (( n n ) )
The The QQ value for fission process shown in Fig 4 11 is value for fission process shown in Fig 4 11 is
Q Q = = EEtottot (( m j m j ) ) + E+ Etottot (( n-m i-j n-m i-j ) ) - E- Etottot (( n i n i ))
The difference between the ionization potential for the state of charge The difference between the ionization potential for the state of charge z+z+ and ( and ( z z+1 )+ was+1 )+ was
considered to be an added term considered to be an added term ee2244BB0 0 rrwswsnn1313 for for z+z+1 with respect to 1 with respect to zz The second The second VVIPIP2+2+ (( n n ) and ) and
third third VVIPIP3+3+ (( n n ) ionization potentials are expressed as ) ionization potentials are expressed as
310
22
4)(2)(
nre
nVnVws
IPIP πε+= ++
310
23
43
)(3)(nr
enVnV
ws
IPIP πε+= ++
In the case of alkali metal clusters [417] first ionization potential is theorigically given byIn the case of alkali metal clusters [417] first ionization potential is theorigically given by
-63--63-
134)(
nre
WnVws0
2
IP πεα+= infin
+
where where WWinfininfin is the work function of the bulk and is the work function of the bulk and αα is 12 or 38 according to different authors Theis 12 or 38 according to different authors The
cluster ion is considered as metal droplet in this model although it is not true for mercury clustercluster ion is considered as metal droplet in this model although it is not true for mercury cluster
case The first ionization potential and atomization energy of mercury cluster used in the calcula-case The first ionization potential and atomization energy of mercury cluster used in the calcula-
tion were experimental data reported by Haberland tion were experimental data reported by Haberland et alet al [18] which represented in two straight[18] which represented in two straight
lines by Blanc lines by Blanc et alet al [415] They were [415] They were
VVIPIP++ (( n n ) = 1653 ) = 1653 n n --1313 + 1818 ( + 1818 ( nn gt 19 ) gt 19 )
= 4112 = 4112 n n --1313 + 6397 ( + 6397 ( nn ≦≦ 19 ) 19 )
andand
EEatat(( n n ) = 083) = 083 nn - 177 - 177 nn23 23 ( ( nn gt 17 ) gt 17 )
= 0228 = 0228 nn - 0228 - 0228 nn23 23 ( ( nn ≦≦ 17 ) 17 )
The The QQ values for fragmentation processes values for fragmentation processes
HgHgnn2+2+ rarrrarr Hg Hgmm
++ + Hg + Hgn-mn-m++
are calculated from equationare calculated from equation
4
)(2
)()()()()(
)2()1()1(
31ws0
2
IP
IPIPatatat
tottottot
nre
nV
mnVmVnEmnEmE
nEmnEmEQ
πεminusminus
minus+++minusminusminus=
minusminus+=
+
++
The calculated The calculated QQ values of precursor ion of Hg values of precursor ion of Hg20202+2+ using the experimental data and the metal using the experimental data and the metal
droplet model are shown in Fig 4 13 In the case of metal droplet model fragmentation channeldroplet model are shown in Fig 4 13 In the case of metal droplet model fragmentation channel
favored asymmetric at low fission parameter as it was observed for alkali or noble metal clusterfavored asymmetric at low fission parameter as it was observed for alkali or noble metal cluster
ions around appearance size However the van der Waals bonding of small mercury clusters causeions around appearance size However the van der Waals bonding of small mercury clusters cause
the symmetric fission even at near the appearance size which matched to our experimental resultsthe symmetric fission even at near the appearance size which matched to our experimental results
The The QQ values about precursor ions of Hg values about precursor ions of Hg20202+2+ Hg Hg1515
2+2+ and Hg and Hg10102+2+ are shown in Fig 4 14 These are shown in Fig 4 14 These
-64--64-
Fig 4 13 The Fig 4 13 The QQ-values for precursor ions of Hg-values for precursor ions of Hg20202+ 2+ calculated using experimental data and metalcalculated using experimental data and metal
droplet modeldroplet model
Fig 4 14 The Fig 4 14 The QQ-values for precursor ions of Hg-values for precursor ions of Hg20202+2+ HgHg1515
2+2+ and and HgHg10102+ 2+ calculated using experimen-calculated using experimen-
tal datatal data
00 01 02 03 04 05 06 07 08 09 10-12
-10
-08
-06
-04
-02
00
Hg202+ Hgm
+ + Hg20-m+ Experimental data ( Ref [18] )
Metal dropletQ
val
ue (
eV )
Size asymmetry ( m20 )
00 01 02 03 04 05 06 07 08 09 10-26-24-22-20-18-16-14-12-10-08-06-04-020002
Hgn2+ Hgm
+ + Hgn-m+
Precursor ions n = 10 n = 15 n = 20
Q v
alue
( eV
)
Size asymmetry ( mn )
-65--65-
Fig 4 15 The Fig 4 15 The QQ-values for precursor ions of Hg-values for precursor ions of Hg45453+ 3+ calculated using experimental data and metalcalculated using experimental data and metal
droplet modeldroplet model
00 01 02 03 04 05 06 07 08 09 10-2
0
2
4
6
8
10 Experimental data ( Ref [18] ) Metal droplet
Hg453+ Hgm
2+ + Hg45-m+
Q v
alue
( eV
)
Size asymmetry ( m45 )
-66--66-
calculations supported the symmetric fission occurred for Hgcalculations supported the symmetric fission occurred for Hgnn2+2+ ( ( nn ≦≦ 20 )20 )
The The QQ values for fragmentation processes values for fragmentation processes
HgHgnn3+3+ rarrrarr Hg Hgmm
2+2+ + Hg + Hgn-mn-m++
are calculated equationare calculated equation
13
2
13
2
443
)(3
)()(2)()()(
)3()1()2(
mre
nre
nV
mnVmVmnEmEnE
nEmnEmEQ
ws0ws0IP
IPIPatatat
tottottot
πεπε+minusminus
minus++minusminusminus=
minusminus+=
+
++
The The QQ values for precursor ion of Hg values for precursor ion of Hg45453+ 3+ which calculated using experimental data and metalwhich calculated using experimental data and metal
droplet model are shown in Fig 4 15 The asymmetric fission channels were favored in both casesdroplet model are shown in Fig 4 15 The asymmetric fission channels were favored in both cases
which roughly fitted to my experimental results There was slight difference about emitted clusterwhich roughly fitted to my experimental results There was slight difference about emitted cluster
ions between experimental results and ions between experimental results and QQ values calculations The singly charged 6-mer and 7-mer values calculations The singly charged 6-mer and 7-mer
emissions were prior channels for our experimental results compared to the singly charged dimeremissions were prior channels for our experimental results compared to the singly charged dimer
or trimer emissions likely to occur according to or trimer emissions likely to occur according to QQ values calculated However these calculations values calculated However these calculations
took into account neither the stabilities of product ions nor fission barriertook into account neither the stabilities of product ions nor fission barrier
4 4 Conclusions4 4 Conclusions
The appearance sizes of doubly and triply charged mercury cluster ions were experimentallyThe appearance sizes of doubly and triply charged mercury cluster ions were experimentally
determined as determined as NNaa2+2+ = 20 and = 20 and NNaa
3+3+ = 46 respectively Moreover appearance size of doubly charged = 46 respectively Moreover appearance size of doubly charged
mercury-silver cluster ion was determined to mercury-silver cluster ion was determined to NNaa2+2+ = 20 The fission parameters at appearance sizes = 20 The fission parameters at appearance sizes
were were XX = 033 in both doubly and triply charged cases It was coincident with the results reported = 033 in both doubly and triply charged cases It was coincident with the results reported
for multiply charged alkali-metal cluster of which fission parameter for multiply charged alkali-metal cluster of which fission parameter XX at appearance size was not at appearance size was not
-67--67-
ReferenceReference
[41] K Sattler J M[41] K Sattler J Mhhhlbach O Echt P Pfau and E Recknagel hlbach O Echt P Pfau and E Recknagel Phys Rev LettPhys Rev Lett 4747 (1981) 160 (1981) 160
[42] J G Gay B J Berne [42] J G Gay B J Berne Phys Rev LettPhys Rev Lett 4949 (1982) 194 (1982) 194
[43]O Echt D Kreisle E Recknagel J J Saenz R Casero and J M Soler [43]O Echt D Kreisle E Recknagel J J Saenz R Casero and J M Soler Phys Rev APhys Rev A 3838 (7) (7)
(1988) 3236(1988) 3236
[44] W A de Heer K Selby V Kressin J Masuri M Vollmer A Ch[44] W A de Heer K Selby V Kressin J Masuri M Vollmer A Chgtgttelain and W D Knighttelain and W D Knight
Phys Rev LettPhys Rev Lett 5959 (1987) 1805 (1987) 1805
[44] K Selby M Vollmer J Masui V Kresin W A de Heer and W D Knight [44] K Selby M Vollmer J Masui V Kresin W A de Heer and W D Knight Phys Rev BPhys Rev B 4040
(1989) 5417(1989) 5417
[45] C Br[45] C BrJJchignac Ph Cahuzac F Carlier and M de Frutos chignac Ph Cahuzac F Carlier and M de Frutos Phys Rev LettPhys Rev Lett 64 64 (24) (1990)(24) (1990)
28932893
[46] C Br[46] C BrJJchignac Ph Cahuzac F Carlier J Leygnier and A Sarfati chignac Ph Cahuzac F Carlier J Leygnier and A Sarfati Phys Rev BPhys Rev B 44 44 (20)(20)
(1991) 11386(1991) 11386
[47] C Br[47] C BrJJchignac Ph Cahuzac F Carlier and M de Frutos chignac Ph Cahuzac F Carlier and M de Frutos Phys Rev BPhys Rev B 49 49 (20) (1994) 2825(20) (1994) 2825
[48] I Katakuse H Ito and T Ichihara [48] I Katakuse H Ito and T Ichihara Int J Mass Spectrom Ion ProcessesInt J Mass Spectrom Ion Processes 9797 (1990) 47 (1990) 47
[49] W A Saunders [49] W A Saunders Phys Rev LettPhys Rev Lett 6464 (1990) 3046 (1990) 3046
[410] W A Saunders [410] W A Saunders Phys Rev APhys Rev A 4646 (1992) 7028 (1992) 7028
[411] T P Martin U N[411] T P Martin U Nher H Gher H G`lich and T Lange lich and T Lange Chem Phys LettChem Phys Lett 196 196 (1992) 113(1992) 113
depend on charge state depend on charge state zz
The fission channels of doubly and triply charged cluster ions were also investigated It wasThe fission channels of doubly and triply charged cluster ions were also investigated It was
interesting that the fission channels of doubly charged mercury cluster ions were symmetric whichinteresting that the fission channels of doubly charged mercury cluster ions were symmetric which
could not interpreted by metal droplet model It may be caused by the van der Waals bonding ofcould not interpreted by metal droplet model It may be caused by the van der Waals bonding of
small cluster ions On the other hand triply charged cluster ions caused the asymmetric fragmenta-small cluster ions On the other hand triply charged cluster ions caused the asymmetric fragmenta-
tion channelstion channels
-68--68-
[412] U N[412] U Nher S Frank N Malinowski F Tast I M L Billas and T P Martin her S Frank N Malinowski F Tast I M L Billas and T P Martin Z Phys DZ Phys D 3131
(1994) 191(1994) 191
[413] C Br[413] C BrJJchingac M Broyer Ph Cahuzac G Delacretaz P Labastie and L Wchingac M Broyer Ph Cahuzac G Delacretaz P Labastie and L W`ste ste ChemChem
Phys LettPhys Lett 120 120 (1985) 559 (1985) 559
[414] H Harberland B von Issendorff J Yufeng and T Kolar [414] H Harberland B von Issendorff J Yufeng and T Kolar Phys Rev LettPhys Rev Lett 6969 (1992) 3212 (1992) 3212
[415] J Blanc M Broyer M Sence J P Wolf and L Woste [415] J Blanc M Broyer M Sence J P Wolf and L Woste J Chem PhysJ Chem Phys 102102 (2) (1995) 680 (2) (1995) 680
[416] H Ito T Sakurai T Matsuo T Ichihara and I Katakuse [416] H Ito T Sakurai T Matsuo T Ichihara and I Katakuse Z Phys DZ Phys D 40 40 (1997) 102(1997) 102
[417] C Br[417] C BrJJchignac Ph Cahuzac F Carlier and J Leygnier chignac Ph Cahuzac F Carlier and J Leygnier Phys Rev LettPhys Rev Lett 6363 (1989) 1368 (1989) 1368
As a review of multiply charged metal cluster ions fission U NAs a review of multiply charged metal cluster ions fission U Nher S Bjher S Bjrrrnhorm S Frauendorfrnhorm S Frauendorf
F Garcias and C Guet F Garcias and C Guet Physics ReportPhysics Report 285285 (1982) 247 (1982) 247
-69--69-
5 Lifetime distribution of cluster ions from a5 Lifetime distribution of cluster ions from asputtering ion sourcesputtering ion source
5 1 Introduction5 1 Introduction
The interaction of keV energy ions with a solid leads to the sputtering of the clusters A lot ofThe interaction of keV energy ions with a solid leads to the sputtering of the clusters A lot of
experiments were carried out using this phenomenon to investigate the electronic state stability ofexperiments were carried out using this phenomenon to investigate the electronic state stability of
the cluster and so on [124 51-6] The ldquomagic numberrdquo appearing in size distributions providedthe cluster and so on [124 51-6] The ldquomagic numberrdquo appearing in size distributions provided
useful informations about stabilities and structures of clustersuseful informations about stabilities and structures of clusters
In addition to the size distribution the study of fragmentation pattern occurred within 10In addition to the size distribution the study of fragmentation pattern occurred within 10-6-6 - -
1010-4-4 sec presented useful data [51 5 6] to understand the more accurate characters of clusters It sec presented useful data [51 5 6] to understand the more accurate characters of clusters It
is well known that clusters made by sputtering are relatively ldquohotrdquo and cause the spontaneousis well known that clusters made by sputtering are relatively ldquohotrdquo and cause the spontaneous
fragmentations It would be advantage for investigating the fragmentation pattern On the otherfragmentations It would be advantage for investigating the fragmentation pattern On the other
hand spontaneous decompositions make difficult to know the mechanisms of cluster productionhand spontaneous decompositions make difficult to know the mechanisms of cluster production
by sputtering because the informations about nascent clusters are lostby sputtering because the informations about nascent clusters are lost
To say nothing of the internal energy distribution of the clusters at the production time it isTo say nothing of the internal energy distribution of the clusters at the production time it is
little known about the internal energy of clusters in the experimental time range ie 10little known about the internal energy of clusters in the experimental time range ie 10-7-7 - 10 - 10-4-4 sec sec
The main duty of mass spectrometer in cluster analyses is separate the cluster ions by their massesThe main duty of mass spectrometer in cluster analyses is separate the cluster ions by their masses
or sizes although the internal energies of cluster ions are considered to widely distribute even theyor sizes although the internal energies of cluster ions are considered to widely distribute even they
are same sizeare same size
According to a Rice-Ramsperger-Kassel ( RRK ) theory [ 57 ] the dissociation rate constantAccording to a Rice-Ramsperger-Kassel ( RRK ) theory [ 57 ] the dissociation rate constant
kk a reciprocal of lifetime of the cluster ion is correlated with the relative internal energy a reciprocal of lifetime of the cluster ion is correlated with the relative internal energy EEint int EEdd
k = kk = k00 (( 11- E- Ed d EEintint ) ) s s - 1- 1
-70--70-
where where EEintint is the internal energy is the internal energy EEdd is the dissociation energy and is the dissociation energy and ss is the number of modes Using is the number of modes Using
this theory investigation of lifetime distribution of cluster ions gives the information about internalthis theory investigation of lifetime distribution of cluster ions gives the information about internal
energy distributionenergy distribution
A simulation was carried out using molecular-dynamics ( MD ) on nascent AgA simulation was carried out using molecular-dynamics ( MD ) on nascent Agnn clusters [58] clusters [58]
The nascent AgThe nascent Agnn clusters sputtered by keV Ar clusters sputtered by keV Ar++ ions had an average internal energy about 1 eV per ions had an average internal energy about 1 eV per
constituent atom and branching or chain decay occurred in the time range of 10constituent atom and branching or chain decay occurred in the time range of 10-11-11 sec that is quite sec that is quite
early stage compared with experimental one Determination of the internal energy distribution ofearly stage compared with experimental one Determination of the internal energy distribution of
cluster ions from a sputtering ion source was only reported for sputtered Tacluster ions from a sputtering ion source was only reported for sputtered Tann++ ( ( nn = 4 - 8 ) about the = 4 - 8 ) about the
experimental time range of 10experimental time range of 10-9-9 - 10 - 10-4-4 sec [59] The authors concluded that the average internal sec [59] The authors concluded that the average internal
energy per constituent atom depended weakly upon their cluster sizesenergy per constituent atom depended weakly upon their cluster sizes
In this chapter one of the method for obtaining the lifetime distributions using a typicalIn this chapter one of the method for obtaining the lifetime distributions using a typical
double focusing mass spectrometer is introduced The time dependences of fragmentation ratesdouble focusing mass spectrometer is introduced The time dependences of fragmentation rates
within the experimental time range of 10within the experimental time range of 10-7-7 - 10 - 10-4-4 sec were studied about fragmentation channels sec were studied about fragmentation channels
HgHgnn+1+1AgAg++ rarrrarr Hg HgnnAgAg++ + Hg ( + Hg ( nn = 8 - = 8 - 14 ) and Ag14 ) and Agnn+1+1++ rarrrarr Ag Agnn
++ + Ag ( + Ag ( nn = 12 14 ) The dissociation = 12 14 ) The dissociation
energies of mercury and silver cluster ions were reported as about 02 eV [510] and 2 eV [511]energies of mercury and silver cluster ions were reported as about 02 eV [510] and 2 eV [511]
respectively that was quite different each other The lifetime distribution of each fragmentationrespectively that was quite different each other The lifetime distribution of each fragmentation
channel was calculated using fragmentation rate experimentally obtained Furthermore its sizechannel was calculated using fragmentation rate experimentally obtained Furthermore its size
dependence was argued about mercury-silver binary cluster ionsdependence was argued about mercury-silver binary cluster ions
5 2 Experimental conditions5 2 Experimental conditions
Fragmentation processes were observed by following procedures (1) The deflection poten-Fragmentation processes were observed by following procedures (1) The deflection poten-
tial of the cylindrical electric sector and energy slits were kept constant so that the ions of 5000 tial of the cylindrical electric sector and energy slits were kept constant so that the ions of 5000 plusmnplusmn
-71--71-
5 3 Results5 3 Results
5 3 1 Dissociation rate on time5 3 1 Dissociation rate on time
As a preparation to examine the lifetime distributions the fragmentation rate as a function ofAs a preparation to examine the lifetime distributions the fragmentation rate as a function of
time time FFexpexp(( t t )) = dI = dIff dt dt ( ( I Iff denotes the fragmentation intensity ) is investigated from experimental denotes the fragmentation intensity ) is investigated from experimental
data As an example the fragmentation channel Hgdata As an example the fragmentation channel Hg1313AgAg++ rarrrarr Hg Hg1212AgAg++ + Hg is explained in the + Hg is explained in the
followingsfollowings
The appearance of fragmentation channel occurred in each region was already descrived inThe appearance of fragmentation channel occurred in each region was already descrived in
section 2 3 1 In the case of channel section 2 3 1 In the case of channel HgHg1313AgAg++ rarrrarr Hg Hg1212AgAg++ + Hg + Hg the fragmentation peaks of the fragmentation peaks of
plateaus were appeared with in acceleration volgate of plateaus were appeared with in acceleration volgate of 5 lt 5 lt VVaa lt 5lt 5MM1313 M M1212 ( kV ) where ( kV ) where MM1313 and and MM1212
denoted the mass of Hgdenoted the mass of Hg1313AgAg++ and Hg and Hg1212AgAg++ respectively respectively The value of The value of 55MM1313 M M1212 is 54 ( kV) is 54 ( kV) TheThe
mass spectra of acceleration voltage 5100 V and 5400 V are shown in Fig 5 1 (a) and (b) Fourmass spectra of acceleration voltage 5100 V and 5400 V are shown in Fig 5 1 (a) and (b) Four
peaks and one plateau labeled with region peaks and one plateau labeled with region rr ( ( rr = 1 - 5 ) in Fig 5 1 (a) and (b) corresponded to the = 1 - 5 ) in Fig 5 1 (a) and (b) corresponded to the
fragmentation channel fragmentation channel HgHg1313AgAg++ rarrrarr Hg Hg1212AgAg++ + Hg + Hg occurred at each region occurred at each region
Basically fragmentation rate was derived from peak or plateau areas ( Basically fragmentation rate was derived from peak or plateau areas ( dIdIff ))rr ( ( rr = 1 - 5 = 1 - 5
denoted the each fragmentation region ) divided by travel time of cluster ions in each region ( denoted the each fragmentation region ) divided by travel time of cluster ions in each region ( dt dt ))rr
The representing time of given region was travel time from the start point of the electrostatic lensThe representing time of given region was travel time from the start point of the electrostatic lens
system in the ion source to the center of the region The ( system in the ion source to the center of the region The ( dIdIff dt dt ) )rr values at region1-5 were values at region1-5 were
obtained by following proceduresobtained by following procedures
The peaks that indicated the fragmentation occurred in region1 appeared in mass spectra ofThe peaks that indicated the fragmentation occurred in region1 appeared in mass spectra of
20 eVcharge could pass through the sector (2) The acceleration voltage was changed from 5000 V20 eVcharge could pass through the sector (2) The acceleration voltage was changed from 5000 V
to 6000 V for every 40 V step and mass spectra were obtained by scanning the magnet current in ato 6000 V for every 40 V step and mass spectra were obtained by scanning the magnet current in a
linear mode ( B scanning ) for each acceleration voltagelinear mode ( B scanning ) for each acceleration voltage
-72--72-
2500 2600 2700 2800 2900 3000
001
01
1
10
region3 region4
region2
region5
region1
Inte
nsity
(arb
uni
ts)
mz
2450 2500 2550 2600 2650 2700 2750 2800
001
01
1
10
(b) 5400 V
(a) 5100 V
Inte
nsity
(arb
uni
ts)
mz
Fig 5 1 The mass spectra at acceleration voltage of (a) 5100 V and 5400 V The labeled lettersFig 5 1 The mass spectra at acceleration voltage of (a) 5100 V and 5400 V The labeled letters
ldquoregion ldquoregion r r (( r = r = 1-5 )rdquo indicate the fragmentaion position of the peaks and plateau about fragmenta-1-5 )rdquo indicate the fragmentaion position of the peaks and plateau about fragmenta-
tion channel Hgtion channel Hg1313AgAg++ rarrrarr Hg Hg1212AgAg++ + Hg + Hg
-73--73-
acceleration voltages 5 lt acceleration voltages 5 lt VVaa lt 5lt 5MM1313 M M1212 The area of the peak in each mass spectrum at accelera- The area of the peak in each mass spectrum at accelera-
tion voltage tion voltage VVaa ( V ) was defined as ( ( V ) was defined as ( dIdIff ))11 Va Va Assuming that the electrostatic lens system was a pair Assuming that the electrostatic lens system was a pair
of parallel plates and fixing the acceleration voltage of parallel plates and fixing the acceleration voltage VVaa the kinetic energy of product ion the kinetic energy of product ion UUpro pro ( eV( eV
) the function of ) the function of x x asas
minus
minus=Lx
MMM
1VU13
1213apro ( 0 lt ( 0 lt xx lt lt L L ))
where where MM1313 and and MM1212 are masses of Hg are masses of Hg1313AgAg++ and Hg and Hg1212AgAg++ LL is length of lens system This relation can is length of lens system This relation can
be also expressed asbe also expressed as
minus
minus=
a
13
1213
proa
VM
MM
UVLx
The kinetic energy of product ions The kinetic energy of product ions UUpropro was limited by width of energy slit to 000 was limited by width of energy slit to 000 plusmnplusmn 20 eV20 eV
charge According to kinetic energy limitation the fragmentation place at given acceleration volt-charge According to kinetic energy limitation the fragmentation place at given acceleration volt-
age was also limited The very place limitation at each acceleration voltage was related directlyage was also limited The very place limitation at each acceleration voltage was related directly
with the travel times ( with the travel times ( dt dt ))1 Va1 Va
The fragmentation peaks ( region2 4 ) and plateaus ( region3 ) were observed in three mass The fragmentation peaks ( region2 4 ) and plateaus ( region3 ) were observed in three mass
spectra acquired at acceleration voltages neighboring the value of 5spectra acquired at acceleration voltages neighboring the value of 5MM1313 MM1212 ( keV ) caused by the ( keV ) caused by the
dispersive energy of secondary ions dispersive energy of secondary ions The fragmentation intensities of region2 - 4 ( The fragmentation intensities of region2 - 4 ( dIdIff ))2 - 42 - 4 were were
defined by summing up peak or plateau areas obtained from three mass spectradefined by summing up peak or plateau areas obtained from three mass spectra The travel times of The travel times of
region region rr ( ( rr = 2 - 4 ) could obtain by calculating the time of flight to each end of region = 2 - 4 ) could obtain by calculating the time of flight to each end of region rr These were These were
calculated from potential shape of acceleration region (electric field of lens system mentionedcalculated from potential shape of acceleration region (electric field of lens system mentioned
above) acceleration voltage 5above) acceleration voltage 5MM1313 MM1212 ( keV ) and the length of region ( keV ) and the length of region rr ( ( r r = 1 - 4 )= 1 - 4 )
As well as the case of region1 the peaks corresponded to fragmentation at region5 wereAs well as the case of region1 the peaks corresponded to fragmentation at region5 were
appeared in mass spectra at acceleration voltage of 5 lt appeared in mass spectra at acceleration voltage of 5 lt VVaa lt 5lt 5MM1313 MM1212 But it was difficult to But it was difficult to
determine the correlation between the fragmentation time and the acceleration voltage In order todetermine the correlation between the fragmentation time and the acceleration voltage In order to
derive ( derive ( dIdIff ))55 peak areas which were not overlapped with other fragmentation were averaged and peak areas which were not overlapped with other fragmentation were averaged and
-74--74-
multiplied by the number of spectrum within 5 lt multiplied by the number of spectrum within 5 lt VVaa lt 5lt 5MM1313 MM1212 since the peak area of each mass since the peak area of each mass
spectrum was almost same Travel time ( spectrum was almost same Travel time ( dt dt ))55 was obtained as well as region2 - 4 was obtained as well as region2 - 4
One must take attention to the effect from other fragmentation channels because the oneOne must take attention to the effect from other fragmentation channels because the one
neutral atom loss was not only fragmentation channels for both silver and mercury silver clusterneutral atom loss was not only fragmentation channels for both silver and mercury silver cluster
ions The intensities of fragmentation occurred in region1 were the most which need to pay atten-ions The intensities of fragmentation occurred in region1 were the most which need to pay atten-
tionstions
In case of the silver cluster ions there was odd-even alternation in the fragmentation patternIn case of the silver cluster ions there was odd-even alternation in the fragmentation pattern
The neutral dimmer loss AgThe neutral dimmer loss Agnn+2+2++ rarrrarr Ag Agnn
++ + Ag + Ag22 was comparable to one atom loss for odd- was comparable to one atom loss for odd-nn while while
little was observed for even-little was observed for even-n n It leaded to the fragmentation intensities of one neutral atom loss forIt leaded to the fragmentation intensities of one neutral atom loss for
only odd-only odd-n n occurred in region1 was expected to be increased by that of dimmer loss For thisoccurred in region1 was expected to be increased by that of dimmer loss For this
reason the argument of lifetime distribution about odd-reason the argument of lifetime distribution about odd-nn was excluded from discussion was excluded from discussion
In the case of the mercury-silver cluster ions there was little size dependence about fragmen-In the case of the mercury-silver cluster ions there was little size dependence about fragmen-
tation pattern however the successive atom emission was observed in this experimental time rangetation pattern however the successive atom emission was observed in this experimental time range
The successive two emissions of an atom occurred first in region1 and second in any region HgThe successive two emissions of an atom occurred first in region1 and second in any region Hgnn+1+1AgAg++
rarrrarr Hg HgnnAgAg++ + Hg ( region1 ) + Hg ( region1 ) rarrrarr Hg Hgnn-1-1AgAg++ + Hg ( region1-5 ) was not counted in the fragmentation + Hg ( region1-5 ) was not counted in the fragmentation
intensity of Hgintensity of Hgnn+1+1AgAg++ rarrrarr Hg HgnnAgAg++ + Hg ( region1 ) and that would be reduction factor The incre- + Hg ( region1 ) and that would be reduction factor The incre-
ment factors also existed such as the fragmentation channels Hgment factors also existed such as the fragmentation channels Hgnn+2+2AgAg++ rarrrarr Hg HgnnAgAg++ + 2Hg or Hg + 2Hg or Hg22
( region1 ) which a part of them was counted in The ratio of the increment and reduction factor was( region1 ) which a part of them was counted in The ratio of the increment and reduction factor was
unknown however the effect to the fragmentation intensity of one atom loss at region1 was thoughtunknown however the effect to the fragmentation intensity of one atom loss at region1 was thought
to be negligible as long as the dissociation rate on time was argued in logarithmic scale since theto be negligible as long as the dissociation rate on time was argued in logarithmic scale since the
two atoms losses at region2 were about a few dozens of percents of one atom loss at same regiontwo atoms losses at region2 were about a few dozens of percents of one atom loss at same region
The fragmentation rates on time of the channels HgThe fragmentation rates on time of the channels Hg1313AgAg++ rarrrarr Hg Hg1212AgAg++ + Hg and Ag + Hg and Ag1313++ rarrrarr
AgAg1212++ + Ag are shown in Fig 5 2 Both fragmentation rate and time are represented in logarithmic + Ag are shown in Fig 5 2 Both fragmentation rate and time are represented in logarithmic
scalesscales
-75--75-
103
Time ( sec )
102
10
110
-610
-5 10-4
region 1
region 2
region 3
region 4
region 5
dIf
dt
Ag13 rarr Ag12 + Ag++
Hg13Ag rarr Hg12Ag + Hg++
Fig 5 2 The fragmentation rate on time of the channels HgFig 5 2 The fragmentation rate on time of the channels Hg1313AgAg++ rarrrarr Hg Hg1212AgAg++ + Hg and Ag + Hg and Ag1313++ rarrrarr
AgAg1212++ + Ag Both fragmentation rate and time are represented in logarithmic scales + Ag Both fragmentation rate and time are represented in logarithmic scales
-76--76-
5 3 2 Lifetime distributions5 3 2 Lifetime distributions
The fragmentation rate The fragmentation rate FFexpexp (( t t ) was approximated by power function rather than by an expo-) was approximated by power function rather than by an expo-
nential one in both silver and mercury-silver binary cluster ions cases I assumed that the experi-nential one in both silver and mercury-silver binary cluster ions cases I assumed that the experi-
mental data were simulated by the following functionmental data were simulated by the following function
FFexpexp(( t t ) = ) = b t b t -a-a
and acquired constants and acquired constants aa and and bb using the least squares fitting using the least squares fitting
The fragmentation rate on time of the channel HgThe fragmentation rate on time of the channel Hg1313AgAg++ rarrrarr Hg Hg1212AgAg++ + Hg with fitted line are + Hg with fitted line are
shown in Fig 5 3 In case of fitting calculation the point of region2 was excluded in both casesshown in Fig 5 3 In case of fitting calculation the point of region2 was excluded in both cases
because of the wide range of flight time ( 10because of the wide range of flight time ( 10-6-6 - 10 - 10-4-4 order ) In Hg order ) In HgnnAgAg++ case the points superposed case the points superposed
with the other fragmentation channel were also excluded These points are shown with open circlewith the other fragmentation channel were also excluded These points are shown with open circle
in Fig 5 3in Fig 5 3
In case of lifetime In case of lifetime JJ fragmentation rate fragmentation rate FFJ J (( t t ) must be following function) must be following function
FFJ J (( t t ) = ) = expexp ( ( - t- t JJ ) ) JJ
The non-exponential nature of The non-exponential nature of FFexpexp(( t t ) shown in experimental data indicated that cluster ions of) shown in experimental data indicated that cluster ions of
same size have different lifetime of the fragmentation reaction By introducing the distributions ofsame size have different lifetime of the fragmentation reaction By introducing the distributions of
lifetimelifetime ΦΦ ((JJ) fragmentation rate was written as a superposition of the exponential functions) fragmentation rate was written as a superposition of the exponential functions
F F (( t t ) = ) = II ΦΦ ((JJ)) exp exp ( ( - t- t JJ ) ) JJ d dJJ
Comparing with the experimental function Comparing with the experimental function FFexpexp(( t t ) the lifetime distribution ) the lifetime distribution ΦΦ ((JJ) could deter-) could deter-
mine analytically asmine analytically as
ΦΦ (( ττ ) = ) = b b JJ -a-a ΓΓ ( ( aa ) )
Limitation of lifetime should be 10Limitation of lifetime should be 10-7-7 - 10 - 10-3-3 sec by taking the time window of this experimental sec by taking the time window of this experimental
conditions into account It is well known that the cluster ions decomposed through chain or branchconditions into account It is well known that the cluster ions decomposed through chain or branch
pathways from their production time and so that the derived lifetime distribution was not reflectingpathways from their production time and so that the derived lifetime distribution was not reflecting
the character of the nascent cluster ions but of the cluster ions 10the character of the nascent cluster ions but of the cluster ions 10-7-7 sec after their production sec after their production
-77--77-
10-6 10-5 10-41
10
100
1000
region5
region4region3
region2
region1
Dis
soci
atio
n ra
te (
dI f
dt )
Time ( sec )
Fig 5 3 The fragmentation rate on time of fragmentation channel HgFig 5 3 The fragmentation rate on time of fragmentation channel Hg1313AgAg++ rarrrarr Hg Hg1212AgAg++ + Hg with + Hg with
fitted line obtained using least mean squares fittingfitted line obtained using least mean squares fitting
-78--78-
There were two parameters There were two parameters aa and and bb for each fragmentation channel In the case of mercury-for each fragmentation channel In the case of mercury-
silver binary cluster ions we could argue the size dependence of the parameter The parameter silver binary cluster ions we could argue the size dependence of the parameter The parameter bb
indicated the intercepts of indicated the intercepts of FFexpexp (( t t ) so that the dissociation rate at 1 sec after the production time) so that the dissociation rate at 1 sec after the production time
Considering that the experimental time range 10Considering that the experimental time range 10-7-7 - 10 - 10-3-3 sec it was impertinence to argue the size sec it was impertinence to argue the size
dependence of the parameter dependence of the parameter bb
The size dependence of the The size dependence of the aa value of fragmentation channels Hg value of fragmentation channels Hgnn+1+1AgAg++ rarrrarr Hg HgnnAgAg++ + Hg + Hg
( ( nn = 8 - = 8 - 14 ) is shown in Fig 5 4 The 14 ) is shown in Fig 5 4 The aa value reflected the relative abundance of long and short value reflected the relative abundance of long and short
lived cluster ions The large lived cluster ions The large aa value indicated the less of long-lived precursor ions There were the value indicated the less of long-lived precursor ions There were the
singularity in size dependence ofsingularity in size dependence of a a value at value at n n = 12 This fact indicated that Hg= 12 This fact indicated that Hg1212AgAg++ was relatively was relatively
stable It may be understood as due to icosahedron structurestable It may be understood as due to icosahedron structure
The relationship between lifetime and relative internal energyThe relationship between lifetime and relative internal energy E Eintint EEdd could be expressed could be expressed
following equation according to a simple RRK theoryfollowing equation according to a simple RRK theory
k = k = 11JJ = gv = gv (( 11- E- Ed d EEintint ) ) 33n n - 7- 7
where where gg is a degeneracy factor equal to number of surface atom which is adopted the cluster size is a degeneracy factor equal to number of surface atom which is adopted the cluster size nn
in this case and in this case and vv is a typical vibrational frequency ( ca 10 is a typical vibrational frequency ( ca 101212 Hz ) The relative internal energy Hz ) The relative internal energy
EEintint EEdd as a function of lifetime is shown in Fig 5 5 It would be 18 to 26 in this experimentalas a function of lifetime is shown in Fig 5 5 It would be 18 to 26 in this experimental
time rage 10time rage 10-7-7 - 10 - 10-3-3 sec The corresponding internal energies of silver and mercury-silver binary sec The corresponding internal energies of silver and mercury-silver binary
cluster ions were quite different although the experimental time range were samecluster ions were quite different although the experimental time range were same
In order to know the internal energy distributions for wider range the lifetime shorter orIn order to know the internal energy distributions for wider range the lifetime shorter or
longer than this experimental time range has to be investigated The experiment to know about thelonger than this experimental time range has to be investigated The experiment to know about the
lifetime of cluster ions at experimental time rage of 10lifetime of cluster ions at experimental time rage of 10-9-9 - 10 - 10-4-4 sec was performed successfully by sec was performed successfully by
devising the shape of the acceleration potential [59] The ion trap method which could hold clusterdevising the shape of the acceleration potential [59] The ion trap method which could hold cluster
ions for long time spatially may be useful for experimental time range longer than 10ions for long time spatially may be useful for experimental time range longer than 10-3-3 sec sec
-79--79-
8 9 10 11 12 13 14073
074
075
076
077
078
079
080
081
082
083
084
rarr
Val
ue o
f par
amet
er a
Fragmentation channel Hgn+1Ag+ HgnAg+ + Hg ( n )
Fig 5 4 The size dependence of the Fig 5 4 The size dependence of the aa value of fragmentation channels Hg value of fragmentation channels Hgn+1n+1AgAg++ rarrrarr Hg HgnnAgAg++ + Hg + Hg
( ( nn = 8 - 14 ) = 8 - 14 )
10-9 10-8 10-7 10-6 10-5 10-4 10-3 10-2
1
2
3
4
Ein
t E
d
Lifetime ( sec )
Fig 5 5 Relationship between lifetime and relative internal energyFig 5 5 Relationship between lifetime and relative internal energy E Eintint EEdd
-80--80-
54 Conclusions54 Conclusions
The lifetime distributions of silver and mercury-silver binary cluster ions were investigatedThe lifetime distributions of silver and mercury-silver binary cluster ions were investigated
experimentally The widely distributed lifetime originated by spread of internal energy of clusterexperimentally The widely distributed lifetime originated by spread of internal energy of cluster
ions produced by a sputtering method was indicated The size dependence of lifetime distributionions produced by a sputtering method was indicated The size dependence of lifetime distribution
allowed one to discuss about cluster stability According to it Hgallowed one to discuss about cluster stability According to it Hg1212AgAg++ which was understood by which was understood by
icosahedron structure was rather stable than adjacent cluster ions The stability of Hgicosahedron structure was rather stable than adjacent cluster ions The stability of Hg1212AgAg++ was not was not
appeared as ldquomagic numberrdquo in size distribution ( see section 3 2 1 ) The investigation of lifetimeappeared as ldquomagic numberrdquo in size distribution ( see section 3 2 1 ) The investigation of lifetime
distribution might be the other useful method to know the stabilities of cluster ionsdistribution might be the other useful method to know the stabilities of cluster ions
-81--81-
ReferencesReferences
[51] I Katakuse T Ichihara Y Fujita T Matsuo T Sakurai and H Matsuda [51] I Katakuse T Ichihara Y Fujita T Matsuo T Sakurai and H Matsuda Int J Mass spectromInt J Mass spectrom
Ion ProcessesIon Processes 6767 (1985) 229 (1985) 229
[52] I Katakuse T Ichihara Y Fujita T Matsuo T Sakurai and H Matsuda [52] I Katakuse T Ichihara Y Fujita T Matsuo T Sakurai and H Matsuda Int J Mass spectromInt J Mass spectrom
Ion ProcessesIon Processes 6969 (1986) 109 (1986) 109
[53] H Ito T Sakurai T Matsuo T Ichihara and I Katakuse [53] H Ito T Sakurai T Matsuo T Ichihara and I Katakuse Phys Rev BPhys Rev B 4848 (1993) 4741 (1993) 4741
[54] H Ito T Sakurai T Matsuo T Ichihara and I Katakuse [54] H Ito T Sakurai T Matsuo T Ichihara and I Katakuse J Mass Spectrom Soc Jpn J Mass Spectrom Soc Jpn (( 質量質量
分析分析 ) ) 44 44 (1995) 29(1995) 29
[55] I Katakuse H Nakabushi T Ichihara T Sakurai T Matsuo and H Matsuda [55] I Katakuse H Nakabushi T Ichihara T Sakurai T Matsuo and H Matsuda Int J MassInt J Mass
spectrom Ion Processesspectrom Ion Processes 6262 (1984) 17 (1984) 17
[56] H Ito T Matsuo TSatoh T Ichihara and I Katakuse [56] H Ito T Matsuo TSatoh T Ichihara and I Katakuse J mass spectromJ mass spectrom 3535 168 (2000) 168 (2000)
[57] P J Robinson and K A Holbrook [57] P J Robinson and K A Holbrook Unimolecular ReactionsUnimolecular Reactions ( Wiley Lomdon 1972 ) ( Wiley Lomdon 1972 )
[58] A Wucher B J Garrison [58] A Wucher B J Garrison Phys Rev BPhys Rev B 4646 (1992) 4885 (1992) 4885
[59] N Kh Dzhemilev A M Goldenberg I V Veriovkin S V Verkhoturov [59] N Kh Dzhemilev A M Goldenberg I V Veriovkin S V Verkhoturov Nucl Instr andNucl Instr and
Meth BMeth B 2121 (1996) 245 (1996) 245
[510] H Haberland H Kornmeier HLangosch M Oschwald G Tanner [510] H Haberland H Kornmeier HLangosch M Oschwald G Tanner J Chem Soc FaradayJ Chem Soc Faraday
transtrans 86(13)86(13) (1990) 2473 (1990) 2473
[511] U Hild G Dietrich S Kr[511] U Hild G Dietrich S Krhhckeberg M Lindinger K Lckeberg M Lindinger K Lhhtzenkirchen L Shweikhard Ctzenkirchen L Shweikhard C
Walther and J Ziegler Walther and J Ziegler Phys Rev A Phys Rev A 5757 (1998) 2786 (1998) 2786
AcknowledgmentsAcknowledgments
I would like to express my sincere appreciation to Professor Itsuo Katakuse under whoseI would like to express my sincere appreciation to Professor Itsuo Katakuse under whose
guidance the work was conducted and completed I also express my gratitude to Associate profes-guidance the work was conducted and completed I also express my gratitude to Associate profes-
sor Morio Ishihara for many useful suggestion and advice I express my heartfelt thanks to Assis-sor Morio Ishihara for many useful suggestion and advice I express my heartfelt thanks to Assis-
tant Hiroyuki Ito for instructing many experimental ideas and techniques during a course of studytant Hiroyuki Ito for instructing many experimental ideas and techniques during a course of study
I express my warm appreciation to Assistant Michisato Toyoda for enlightening discussion aboutI express my warm appreciation to Assistant Michisato Toyoda for enlightening discussion about
mass spectrometrymass spectrometry
I greatly acknowledge to Mr Toshio Ichihara for technical supports I also express my thanksI greatly acknowledge to Mr Toshio Ichihara for technical supports I also express my thanks
to Mr Hiroki Sakae of CREST for helpful discussion and adviceto Mr Hiroki Sakae of CREST for helpful discussion and advice
I appreciate to colleagues Mr K Kumondai Mr D Okumura Mr Y Manabe Mr K SasakiI appreciate to colleagues Mr K Kumondai Mr D Okumura Mr Y Manabe Mr K Sasaki
Mr K Nishiguchi Mr T Oda Miss M Kiyotoshi Mr T Fujimoto Mr A Miwatari and Mr SMr K Nishiguchi Mr T Oda Miss M Kiyotoshi Mr T Fujimoto Mr A Miwatari and Mr S
Moriyama Especially I am indebted to Mr K Sasaki who helped my work by acquiring andMoriyama Especially I am indebted to Mr K Sasaki who helped my work by acquiring and
analyzing the experimental dataanalyzing the experimental data
Finally I am deeply grateful to my parents and wife for their daily supportsFinally I am deeply grateful to my parents and wife for their daily supports

AbstractAbstract
The electronic structure of mercury atom is 5The electronic structure of mercury atom is 5dd101066ss22 closed shell which is isoelectronic with closed shell which is isoelectronic with
helium Therefore the diatomic molecule and smaller clusters are bounded by van der Waals forcehelium Therefore the diatomic molecule and smaller clusters are bounded by van der Waals force
For intermediated cluster size the 6For intermediated cluster size the 6ss and 6 and 6pp orbitals broaden The overlapping of 6 orbitals broaden The overlapping of 6ss and 6 and 6pp bands bands
gives the metallic behavior of bulk Hg The non-metal to metal transition of mercury cluster wasgives the metallic behavior of bulk Hg The non-metal to metal transition of mercury cluster was
studied by various methods such as recording the autoionization lines ( 5studied by various methods such as recording the autoionization lines ( 5dd rarrrarr 6 6pp ) excited by ) excited by
synchrotron radiation measuring the ionization potential and binding energy Every experimentsynchrotron radiation measuring the ionization potential and binding energy Every experiment
showed the non-metal to metal transition occurred at cluster size around 15 Furthermore the non-showed the non-metal to metal transition occurred at cluster size around 15 Furthermore the non-
metal to metal transition was also observed about the mercury-alkali metal binary cluster ions atmetal to metal transition was also observed about the mercury-alkali metal binary cluster ions at
cluster size cluster size nn = 30 = 30
This thesis consists of the three following subjectsThis thesis consists of the three following subjects
(1) The size distribution of mercury-silver binary cluster ions Hg(1) The size distribution of mercury-silver binary cluster ions HgnnAgAg++ and Hg and HgnnAgAg22++ The The
structure of Hgstructure of HgnnAgAg++ was interpreted by electronic shell model rather than geometric On the other was interpreted by electronic shell model rather than geometric On the other
hand the stable Hghand the stable Hg1818AgAg22++ was considered to be geometrical double icosahedron structure In order was considered to be geometrical double icosahedron structure In order
to know more accurate character of mercury-silver binary cluster ions the fragmentation patternto know more accurate character of mercury-silver binary cluster ions the fragmentation pattern
was also investigatedwas also investigated
(2) Determination of appearance sizes of doubly and triply charged mercury cluster ions(2) Determination of appearance sizes of doubly and triply charged mercury cluster ions
from direct observation of fission and evaporation They were decided to from direct observation of fission and evaporation They were decided to NNaa2+2+ = 20 and = 20 and NNaa
3+3+ = 46 = 46
for doubly and triply charged cases respectively The fission channels were also investigated andfor doubly and triply charged cases respectively The fission channels were also investigated and
estimated by calculation of estimated by calculation of QQ values The symmetric fission of doubly charged cluster ions was values The symmetric fission of doubly charged cluster ions was
caused by van der Waals bonding of small mercury clusters The fission channels of triply chargedcaused by van der Waals bonding of small mercury clusters The fission channels of triply charged
were asymmetric since the metallic character came into prominence for both precursor and largewere asymmetric since the metallic character came into prominence for both precursor and large
one of fission fragmentone of fission fragment
(3) Estimation of lifetime distribution of cluster ions from sputtering ion source using frag-(3) Estimation of lifetime distribution of cluster ions from sputtering ion source using frag-
mentation rate obtained from experimental data The one atom evaporation of singly charged silvermentation rate obtained from experimental data The one atom evaporation of singly charged silver
and mercury-silver binary cluster ions were investigated The lifetime distributions of both samplesand mercury-silver binary cluster ions were investigated The lifetime distributions of both samples
were widely broadened and resembled each other where dissociation energies which were relatedwere widely broadened and resembled each other where dissociation energies which were related
to lifetime were quite different From the size dependence of lifetime distribution Hgto lifetime were quite different From the size dependence of lifetime distribution Hg1212AgAg++ which which
could understand by geometrical icosahedron structure was turn out to be rather stablecould understand by geometrical icosahedron structure was turn out to be rather stable
CONTENTSCONTENTS
1 Introduction1 Introduction
1 1 Cluster1 1 Cluster 111 2 Mercury cluster1 2 Mercury cluster 33
1 3 The outline of this thesis1 3 The outline of this thesis 44
2 Experimental2 Experimental
2 1 Production of cluster ions2 1 Production of cluster ions 772 2 Double focussing mass spectrometer GEMMY2 2 Double focussing mass spectrometer GEMMY 77
2 3 Determination of fragmentation pattern of cluster ions2 3 Determination of fragmentation pattern of cluster ions 11112 3 1 Contour map modification method2 3 1 Contour map modification method 1313
2 3 1 Acceleration voltage scan method2 3 1 Acceleration voltage scan method 1818
3 Size distribution and fragmentation pattern of mercury-silver3 Size distribution and fragmentation pattern of mercury-silverbinarycluster ionsbinarycluster ions
3 1 Introduction3 1 Introduction 2222
3 2 Results3 2 Results 2323
3 2 1 Size distribution of mercury-silver binary cluster ion3 2 1 Size distribution of mercury-silver binary cluster ion 2323
3 2 2 Fragmentation pattern of mercury-silver binary cluster ion3 2 2 Fragmentation pattern of mercury-silver binary cluster ion 2929
3 3 Conclusions3 3 Conclusions 3939
4 Competition of fission and evaporation processes of multiply4 Competition of fission and evaporation processes of multiplycharged mercury cluster ionscharged mercury cluster ions
4 1 Introduction4 1 Introduction 41414 2 Determination of fragmentation channels of doubly and triply charged cluster4 2 Determination of fragmentation channels of doubly and triply charged cluster
ionsions44444 2 1 Evaporation of multiply charged cluster ions4 2 1 Evaporation of multiply charged cluster ions 44444 2 2 Fission of doubly charged cluster ions4 2 2 Fission of doubly charged cluster ions 4545
4 2 3 Fission of triply charged cluster ions4 2 3 Fission of triply charged cluster ions 4545
4 3 Results4 3 Results 4747
4 3 1 Observation of Hg4 3 1 Observation of HgnnAgAg2+2+ survived 10 survived 10-4-4 sec sec 4747
4 3 2 Evaporation processes of Hg4 3 2 Evaporation processes of HgnnAgAg2+2+ 49494 3 3 Evaporation processes of triply charged Hg4 3 3 Evaporation processes of triply charged Hgnn
3+3+ 52524 3 4 Fission processes of Hg4 3 4 Fission processes of Hgnn
2+2+ and Hg and HgnnAgAg2+2+ 56564 3 5 Fission processes of Hg4 3 5 Fission processes of Hgnn
3+3+ 5858
4 3 6 Calculation of 4 3 6 Calculation of QQ value value 6161
4 4 Conclusions4 4 Conclusions 6666
5 Lifetime distribution of cluster ions from a sputtering ion source5 Lifetime distribution of cluster ions from a sputtering ion source
5 1 Introduction5 1 Introduction 69695 2 Experimental conditions5 2 Experimental conditions 7070
5 3 Results5 3 Results 71715 3 1 Dissociation rate on time5 3 1 Dissociation rate on time 7171
5 3 2 Lifetime distributions5 3 2 Lifetime distributions 7676
54 Conclusions54 Conclusions 8080
-1--1-
1 Introduction1 Introduction
1 1 Cluster1 1 Cluster
The cluster is an aggregate The cluster is an aggregate consisting of 2 - 1000 atoms ( or molecules ) and its radius is inconsisting of 2 - 1000 atoms ( or molecules ) and its radius is in
the order of 10the order of 10 ÅÅ It is in one of the phase between a atom ( or molecule ) and bulk as shown in It is in one of the phase between a atom ( or molecule ) and bulk as shown in
Fig 1 1 It shows quantum-mechanical properties depending on its shape and size like atoms andFig 1 1 It shows quantum-mechanical properties depending on its shape and size like atoms and
molecules The characteristic point of the cluster is most of containing atoms are on the surfacemolecules The characteristic point of the cluster is most of containing atoms are on the surface
and so the surface phenomena take a significant part for its stabilities It also exhibits at finiteand so the surface phenomena take a significant part for its stabilities It also exhibits at finite
temperatures physical properties often encountered in macroscopic systems like liquids This istemperatures physical properties often encountered in macroscopic systems like liquids This is
due to the presence of large number of low-lying metastable statesdue to the presence of large number of low-lying metastable states
There are mainly two methods for producing cluster One is cohering the atoms or moleculesThere are mainly two methods for producing cluster One is cohering the atoms or molecules
1 10 102 103 105104 Consiting atoms
Cluster
Fine particle
106
Bulk
Atom
Surface atomsInner atoms
0 1 10
Particle radius ( Å)1 10 100
Fig 1 1 Classification of the fragments according to their sizes obtained by successive division ofFig 1 1 Classification of the fragments according to their sizes obtained by successive division of
materialmaterial
-2--2-
by adiabatic expansion method The clusters produced by this method have relatively low internalby adiabatic expansion method The clusters produced by this method have relatively low internal
energy ( low temperature ) The other way is subdividing the bulk into clusters by bombarding withenergy ( low temperature ) The other way is subdividing the bulk into clusters by bombarding with
neutral atoms ( FAB Fast Atom Bombardment ) or ions (SIMS Secondary Ion Mass Spectrom-neutral atoms ( FAB Fast Atom Bombardment ) or ions (SIMS Secondary Ion Mass Spectrom-
etry) The clusters having relatively high internal energy ( high temperature ) clusters are producedetry) The clusters having relatively high internal energy ( high temperature ) clusters are produced
using this method They cause the spontaneous fragmentation and are qualified for studying frag-using this method They cause the spontaneous fragmentation and are qualified for studying frag-
mentation processes The later production method was used in this experimentmentation processes The later production method was used in this experiment
The stabilities and characters of clusters are very sensitive to their sizes (consisting atoms)The stabilities and characters of clusters are very sensitive to their sizes (consisting atoms)
Therefore mass spectrometer which can separate the cluster ions by their sizes is available forTherefore mass spectrometer which can separate the cluster ions by their sizes is available for
cluster analyses Usually the discontinuous variations are observed in size distributions obtainedcluster analyses Usually the discontinuous variations are observed in size distributions obtained
from mass spectra These anomalous sizes are called ldquomagic numberrdquo that are clues to understandfrom mass spectra These anomalous sizes are called ldquomagic numberrdquo that are clues to understand
the structures of the clustersthe structures of the clusters
The clusters which the consisting atoms ( or molecules ) are bound by different kind ofThe clusters which the consisting atoms ( or molecules ) are bound by different kind of
binding forces were investigated The characteristic magic numbers were observed for each kindbinding forces were investigated The characteristic magic numbers were observed for each kind
of the clusterof the cluster
The magic numbers of noble gas clusters ( eg XeThe magic numbers of noble gas clusters ( eg Xenn++ ) observed in the mass spectrum were ) observed in the mass spectrum were nn
= 13 19 23 25 55 71 81 101 135 and 147 [11] These numbers are coincided with the numbers= 13 19 23 25 55 71 81 101 135 and 147 [11] These numbers are coincided with the numbers
of constituent atoms of the icosahedron or the double icosahedron structures The geometricallyof constituent atoms of the icosahedron or the double icosahedron structures The geometrically
packed structures are well known for van der Waals clusterspacked structures are well known for van der Waals clusters
The alkali-halide cluster [12] ( eg ( CsI )The alkali-halide cluster [12] ( eg ( CsI )nnCsCs++ ) which the binding force of bulks are ionic ) which the binding force of bulks are ionic
have the magic numbers of have the magic numbers of n n = 13 22 31 37 and 52 consisted with 27 45 63 75 and 105 atoms= 13 22 31 37 and 52 consisted with 27 45 63 75 and 105 atoms
respectively The structures of these cluster ions are understood to be rock-salt structures such asrespectively The structures of these cluster ions are understood to be rock-salt structures such as
( 3( 3 timestimes 33 timestimes 3 )3 ) ( 3 ( 3 timestimes 33 timestimes 5 )5 ) ( 3 ( 3 timestimes 33 timestimes 7 )7 ) ( 3 ( 3 timestimes 55 timestimes 55 ) ) and ( 3 and ( 3 timestimes 55 timestimes 77 ) ) respectively respectively
As compared with the geometrical stabilities of noble gas and alkali-halide clusters the sta-As compared with the geometrical stabilities of noble gas and alkali-halide clusters the sta-
bilities of alkali metal [13] and noble metal [14] clusters are interpreted by the valence electronsbilities of alkali metal [13] and noble metal [14] clusters are interpreted by the valence electrons
-3--3-
shell model This model is on the basis of a one-electron shell model in which the valence electronsshell model This model is on the basis of a one-electron shell model in which the valence electrons
are bound in a spherically symmetric potential well The cluster would be rather stable when theare bound in a spherically symmetric potential well The cluster would be rather stable when the
number of total valence electrons is a shell closed number such as 2 8 18 20 34 58 92number of total valence electrons is a shell closed number such as 2 8 18 20 34 58 92
1 2 Mercury cluster1 2 Mercury cluster
The electronic shell structure of mercury atom is 5The electronic shell structure of mercury atom is 5dd101066ss22 closed shell which is isoelectronic closed shell which is isoelectronic
with helium Therefore the diatomic molecule and smaller clusters are bound by the van der Waalswith helium Therefore the diatomic molecule and smaller clusters are bound by the van der Waals
force For intermediated cluster size the 6force For intermediated cluster size the 6ss and 6 and 6pp orbitals broaden as indicated in Fig 1 2 For orbitals broaden as indicated in Fig 1 2 For
bulk Hg the overlapping of 6bulk Hg the overlapping of 6ss and 6 and 6pp bands gives the metallic behaviors bands gives the metallic behaviors
Atom Bulk
6s
6p
Cluster
Fig 1 2 Electoric configurations of the Hg atom cluster and bulkFig 1 2 Electoric configurations of the Hg atom cluster and bulk
-4--4-
The non-metal to metal transition of mercury clusters was studied by various methodsThe non-metal to metal transition of mercury clusters was studied by various methods
BrBrJJchingac chingac et alet al [15] recorded the autoionization lines ( 5 [15] recorded the autoionization lines ( 5dd rarrrarr 6 6pp ) excited by synchrotron radia- ) excited by synchrotron radia-
tion The transition to metallic bonding occurs gradually from tion The transition to metallic bonding occurs gradually from nn ~~ 15 Rademann 15 Rademann et alet al [16] [16]
measured the ionization potentials of mercury cluster ions and found that the van der Waals behav-measured the ionization potentials of mercury cluster ions and found that the van der Waals behav-
ior deviated at ior deviated at nn ~~ 15 Kaiser 15 Kaiser et alet al [17] showed that large mercury clusters of approximately 100 [17] showed that large mercury clusters of approximately 100
atoms already possess a high density of atoms already possess a high density of pp states near Fermi level Harberland states near Fermi level Harberland et alet al [18] measured [18] measured
the ionization potentials and binding energies of Hgthe ionization potentials and binding energies of Hgnn and deduced that the bonding force first and deduced that the bonding force first
changes from van der Waals to covalent between changes from van der Waals to covalent between nn = 20 and = 20 and nn = 70 and then becomes metallic = 70 and then becomes metallic
above above nn = 100 = 100
1 3 The outline of this thesis1 3 The outline of this thesis
The experimental conditions are described in chapter 2 The production of cluster ions theThe experimental conditions are described in chapter 2 The production of cluster ions the
mass spectrometer used in this experiment and the determination of fragmentation pattern of sin-mass spectrometer used in this experiment and the determination of fragmentation pattern of sin-
gly charged cluster ions are describedgly charged cluster ions are described
The characters of mercury-silver binary cluster ions HgThe characters of mercury-silver binary cluster ions HgnnAgAg++ and Hg and HgnnAgAg22++ are discussed are discussed
from size distributions and fragmentation pattern in chapter 3from size distributions and fragmentation pattern in chapter 3
The fragmentation pattern of doubly and triply charged cluster ions were argued in chapter 4The fragmentation pattern of doubly and triply charged cluster ions were argued in chapter 4
The fragmentation channel of multiply charged cluster ion is roughly classified into fission andThe fragmentation channel of multiply charged cluster ion is roughly classified into fission and
evaporationevaporation
XXnni+i+ rarrrarr XXmm
j+j+ + + XXn-mn-m(( i-j i-j ))++ ( ( i = ji = j evaporation evaporation i gt ji gt j fission ) fission )
The fission and the evaporation processes are competed The size which the fission and the evapo-The fission and the evaporation processes are competed The size which the fission and the evapo-
ration occurred with same probability is called appearance size The evaporation are prior to theration occurred with same probability is called appearance size The evaporation are prior to the
-5--5-
fission at cluster size larger than the appearance size The appearance sizes of doubly and triplyfission at cluster size larger than the appearance size The appearance sizes of doubly and triply
charged mercury and mercury-silver cluster ions were determined by direct observation of evapo-charged mercury and mercury-silver cluster ions were determined by direct observation of evapo-
ration and fission processes Furthermore the ration and fission processes Furthermore the QQ values which is the total energy difference be- values which is the total energy difference be-
tween initial and final states of doubly and triply charged mercury clusters were calculated usingtween initial and final states of doubly and triply charged mercury clusters were calculated using
both the metallic droplet model and the experimental data reported in ref [18] The asymmetricboth the metallic droplet model and the experimental data reported in ref [18] The asymmetric
fission channels were expected for the metallic droplet model however the van der waals bondingfission channels were expected for the metallic droplet model however the van der waals bonding
of small cluster ions leaded to the symmetric fission channels of doubly charged cluster ionsof small cluster ions leaded to the symmetric fission channels of doubly charged cluster ions
The lifetime and internal energy distributions of cluster ions produced by the sputtering methodThe lifetime and internal energy distributions of cluster ions produced by the sputtering method
are discussed in chapter 5 The fragmentation channels of Agare discussed in chapter 5 The fragmentation channels of Agn+n+11++ rarrrarr Ag Agnn
++ + Ag ( + Ag ( n n = 12 14 ) and = 12 14 ) and
HgHgn+n+11AgAg++ rarrrarr Hg HgnnAgAg++ + Hg ( + Hg ( n n = 8 - 14 ) were investigated At first the fragmentation rates of each = 8 - 14 ) were investigated At first the fragmentation rates of each
channels was obtained from experimental data The fragmentation rates were rather power func-channels was obtained from experimental data The fragmentation rates were rather power func-
tion than exponential one The lifetime distributions were calculated using the experimental frag-tion than exponential one The lifetime distributions were calculated using the experimental frag-
mentation rates It was carried out based on the consideration that the non-exponential nature wasmentation rates It was carried out based on the consideration that the non-exponential nature was
originated by superposition of different lifetime according to the different internal energy Theoriginated by superposition of different lifetime according to the different internal energy The
stabilities of cluster mercury-silver cluster ions were also discussed by the size dependence ofstabilities of cluster mercury-silver cluster ions were also discussed by the size dependence of
lifetime distribution The characteristic cluster Hglifetime distribution The characteristic cluster Hg1212AgAg++ which could understand by icosahedron which could understand by icosahedron
structure turned out to be rather stablestructure turned out to be rather stable
-6--6-
ReferencesReferences
[11] O Echt K Sattler and E Recknagel [11] O Echt K Sattler and E Recknagel Phys Rev LettPhys Rev Lett 47 47 (1981) 1121 (1981) 1121
[12] J E Campana T M Barlac R J Colton J J Wyatt and B I Dunlap [12] J E Campana T M Barlac R J Colton J J Wyatt and B I Dunlap Phys Rev LettPhys Rev Lett 4747
10461046
[13] W D Knight K Clemenger W A deHeer W A Saunders M Y Chou and M Cohen[13] W D Knight K Clemenger W A deHeer W A Saunders M Y Chou and M Cohen
Phys Rev LettPhys Rev Lett 52 52 (1984) 2141(1984) 2141
[14] I Katakuse T Ichihara Y Fujita T Matsuo T Sakurai and H Matsuda [14] I Katakuse T Ichihara Y Fujita T Matsuo T Sakurai and H Matsuda Int J MassInt J Mass
Spectrom Ion ProcessesSpectrom Ion Processes 7474 (1986) 33 (1986) 33
[15] C Br[15] C BrJJchingac M Broyer Ph Cahuzac G Delacretaz P Labastie and L Wchingac M Broyer Ph Cahuzac G Delacretaz P Labastie and L Wooste ste Phys RevPhys Rev
LettLett 60 60 (1988) 275 (1988) 275
[16] K Rademann Ber Bunsenges [16] K Rademann Ber Bunsenges Phys ChemPhys Chem 9393 (1989) 653 (1989) 653
[17] B Kaiser and K Rademann [17] B Kaiser and K Rademann Phys Rev LettPhys Rev Lett 6969 (1992) 3204 (1992) 3204
[18] H Haberland H Kornmeier H Langosch M Oschwald and G Tanner [18] H Haberland H Kornmeier H Langosch M Oschwald and G Tanner J Chem SocJ Chem Soc
Faraday TransFaraday Trans 86 86 (1990) 2473(1990) 2473
-7--7-
2 Experimental2 Experimental
2 1 Production of cluster ions2 1 Production of cluster ions
The cluster ions were produced by Xe ions bombardment on a sample material The silverThe cluster ions were produced by Xe ions bombardment on a sample material The silver
plate was used as the sample to produce silver clusters and silver amalgam in case mercury andplate was used as the sample to produce silver clusters and silver amalgam in case mercury and
mercury-silver binary clusters The primary ions ( Xenon ions ) were produced by a dischargedmercury-silver binary clusters The primary ions ( Xenon ions ) were produced by a discharged
type of a compact ion gun [21] and were accelerated up to several keV The discharge current wastype of a compact ion gun [21] and were accelerated up to several keV The discharge current was
kept constant at 03 - 04 mA in order to obtain the stable ion beam intensity by controlling thekept constant at 03 - 04 mA in order to obtain the stable ion beam intensity by controlling the
discharge voltage and the Xe gas pressure The secondary ions were extracted and accelerateddischarge voltage and the Xe gas pressure The secondary ions were extracted and accelerated
toward the mass spectrometer by the potential applied to the electrostatic lens system The sche-toward the mass spectrometer by the potential applied to the electrostatic lens system The sche-
matic diagrams of the primary ion gun and the electrostatic lens system are shown in Fig 2 1matic diagrams of the primary ion gun and the electrostatic lens system are shown in Fig 2 1
2 2 Double focussing mass spectrometer GEMMY2 2 Double focussing mass spectrometer GEMMY
The cluster ions were mass analyzed by the sector type mass spectrometer ldquoGEMMYrdquo [22]The cluster ions were mass analyzed by the sector type mass spectrometer ldquoGEMMYrdquo [22]
shown in Fig 2 2 The field arrangement is QQHQC ( Q denotes a electric quadropole H ashown in Fig 2 2 The field arrangement is QQHQC ( Q denotes a electric quadropole H a
homogeneous magnetic sector C a cylindrical electric sector ) The radii of magnetic sector andhomogeneous magnetic sector C a cylindrical electric sector ) The radii of magnetic sector and
electric sector were 125 m and 090 m respectively The maximum flux density of the magnet waselectric sector were 125 m and 090 m respectively The maximum flux density of the magnet was
18 T The flight path from the main slit to the detector slit was 7635 m The vacuum pressure of18 T The flight path from the main slit to the detector slit was 7635 m The vacuum pressure of
mass analyzer was about 10mass analyzer was about 10-7-7 Torr Torr
-8--8-
A
Electrostatic lens system
Sample chip
Primary ion source
Acceleration Voltage
DischargeVoltage
Gas inlet
Anode
Cathodes
Va
Va
Va + Vd ( kV )Vd = 7 - 9
Fig 2 1 Schematic diagram of ion source and electrostatic lens systemFig 2 1 Schematic diagram of ion source and electrostatic lens system
-9--9-
Fig 2 2 Grand scale sector type of mass spectrometer GEMMYFig 2 2 Grand scale sector type of mass spectrometer GEMMY
Ion source Q lens Magnetic sector
Q lens
Electronicsector
Detector
-10--10-
AD board
Low pass filter
Pre Amp
Electron MultiplierConversion dinode
Detector slit
Oscilloscope
~-15 kV ~-2 kV
( sixteen stages )
Ion+
e-
Fig 2 3 Schematic diagrams of detector and signal to AD boardFig 2 3 Schematic diagrams of detector and signal to AD board
-11--11-
2 3 Determination of fragmentation pattern of cluster ions2 3 Determination of fragmentation pattern of cluster ions
The cluster ions produced by the sputtering ion source have high internal energy enough toThe cluster ions produced by the sputtering ion source have high internal energy enough to
cause the spontaneous fragmentations The contour map modification method and the accelerationcause the spontaneous fragmentations The contour map modification method and the acceleration
voltage scan method are used in this study in order to determine the fragmentation pattern of singlyvoltage scan method are used in this study in order to determine the fragmentation pattern of singly
charged cluster ions The concept of two methods are same The kinetic energy of product ionscharged cluster ions The concept of two methods are same The kinetic energy of product ions
which could path through the cylindric electric sector which could path through the cylindric electric sector EE0 0 ( eV charge )( eV charge ) was fixed and changed thewas fixed and changed the
acceleration voltage acceleration voltage VVaa ( V ) related to kinetic energy of precursor ion The mass ratio of ( V ) related to kinetic energy of precursor ion The mass ratio of MMpre pre M Mpropro
are equal to are equal to VVa a E E00 for singly charged cluster ion where for singly charged cluster ion where MMprepre and and MMpropro are the mass of precursor and are the mass of precursor and
product ion because the kinetic energy of precursor ion is approximately equally divided intoproduct ion because the kinetic energy of precursor ion is approximately equally divided into
products in proportional to each of their massproducts in proportional to each of their mass
The most advantageous point of the contour map modification method is that the fragmenta-The most advantageous point of the contour map modification method is that the fragmenta-
tion occurred at entire region of mass spectrometer can be observed This makes it possible totion occurred at entire region of mass spectrometer can be observed This makes it possible to
discuss lifetime distributions ( Chapter 5 ) On the other hand the relatively narrow limitation ofdiscuss lifetime distributions ( Chapter 5 ) On the other hand the relatively narrow limitation of
MMpre pre M Mpropro is disadvantage point It was supplemented by the acceleration voltage scan method is disadvantage point It was supplemented by the acceleration voltage scan method
In order to increase the detection efficiency the ions passing through a detector slit were postIn order to increase the detection efficiency the ions passing through a detector slit were post
accelerated up to about 15 keV and exchanged to electrons using conversion dinode The con-accelerated up to about 15 keV and exchanged to electrons using conversion dinode The con-
verted electrons were detected by a conventional sixteen-stage electron multiplier Mass spectraverted electrons were detected by a conventional sixteen-stage electron multiplier Mass spectra
were obtained by scanning the magnet current in a linear mode and were recorded using a 486 PCwere obtained by scanning the magnet current in a linear mode and were recorded using a 486 PC
with an analog to digital converter The schematic diagram of the detector and recorder are shownwith an analog to digital converter The schematic diagram of the detector and recorder are shown
in Fig 2 3in Fig 2 3
-12--12-
which mainly investigated the fragmentations occurred between ion source and magnetic sectorwhich mainly investigated the fragmentations occurred between ion source and magnetic sector
The acceleration voltage scan method is useful to determine the fragmentation channels yieldingThe acceleration voltage scan method is useful to determine the fragmentation channels yielding
small product ionssmall product ions
2 3 1 Contour map modification method2 3 1 Contour map modification method
The procedure of the contour map modification method was is as follows (1) The potentialThe procedure of the contour map modification method was is as follows (1) The potential
of the cylindrical electric sector and the width of energy slit were kept constant so that the ions ofof the cylindrical electric sector and the width of energy slit were kept constant so that the ions of
EE00 plusmnplusmn EE ΔΔ ( eV charge ) could path through the sector (2) The acceleration voltage was changed( eV charge ) could path through the sector (2) The acceleration voltage was changed
within the certain limitation by within the certain limitation by VV ΔΔ ( V ) step The value of ( V ) step The value of VV ΔΔ was decided to satisfy the relationwas decided to satisfy the relation
VV ΔΔ = = 22EE ΔΔ (3) Mass spectra were obtained by scanning the magnetic field in a linear mode ( B(3) Mass spectra were obtained by scanning the magnetic field in a linear mode ( B
scanning ) for each acceleration voltage (4) The obtained mass spectra were modified as a form ofscanning ) for each acceleration voltage (4) The obtained mass spectra were modified as a form of
a contour map for visual understanding Microcal Origin ver 41 ( Microcal Software Inc ) wasa contour map for visual understanding Microcal Origin ver 41 ( Microcal Software Inc ) was
used for modificationused for modification
The appearance positions in a contour map or appearance mass in mass spectra were differ-The appearance positions in a contour map or appearance mass in mass spectra were differ-
ent according to the occurring places in spite of the same fragmentation channel For convenienceent according to the occurring places in spite of the same fragmentation channel For convenience
the mass spectrometer is divided into five regions and named as ( see Fig 2 4 )the mass spectrometer is divided into five regions and named as ( see Fig 2 4 )
region1 electrostatic lens in ion sourceregion1 electrostatic lens in ion source
region2 field free region between ion source and magnetic sectorregion2 field free region between ion source and magnetic sector
region3 magnetic sectorregion3 magnetic sector
region4 field free region between magnetic sector and electric sectorregion4 field free region between magnetic sector and electric sector
region5 electric sectorregion5 electric sector
The mass spectra at acceleration voltages of 5100V and 5430V are shown in Fig 2 5 TheseThe mass spectra at acceleration voltages of 5100V and 5430V are shown in Fig 2 5 These
mass spectra were the parts of a series of the mass spectra acquired to study the fragmentation ofmass spectra were the parts of a series of the mass spectra acquired to study the fragmentation of
mercury-silver cluster ions by the contour map modification method The experimental conditionsmercury-silver cluster ions by the contour map modification method The experimental conditions
-13--13-
Fig 2 4 Five regions of GEMMYFig 2 4 Five regions of GEMMY
region1 electrostatic lens in ion sourceregion1 electrostatic lens in ion source
region2 field free region between ion source and magnetic sectorregion2 field free region between ion source and magnetic sector
region3 magnetic sectorregion3 magnetic sector
region4 field free region between magnetic sector and electric sectorregion4 field free region between magnetic sector and electric sector
region5 electric sectorregion5 electric sector
region2region1 region3
region4
region5
-14--14-
Fig 2 5 The mass spectra at acceleration volteges of (a) 5100 V and (b) 5430V The figuresFig 2 5 The mass spectra at acceleration volteges of (a) 5100 V and (b) 5430V The figures
labeled each fragmentaion peaks indicated the fragmentaion channel and region For instancelabeled each fragmentaion peaks indicated the fragmentaion channel and region For instance
symbol symbol nn ( ( rr ) corresponded to Hg ) corresponded to Hgn+1n+1AgAg++ rarrrarr Hg HgnnAgAg++ + Hg occurred in region + Hg occurred in region rr
2200 2400 2600 2800 300010-3
10-2
10-1
100
Inte
nsity
( ar
b u
nits
)
mz
2200 2400 2600 2800 300010-3
10-2
10-1
100
11 ( 3 ) plateau11 ( 4 )
11 ( 2 )
10 ( 5 )13 ( 5 )12 ( 5 )11 ( 5 )
13 ( 1 ) 14 ( 1 )12 ( 1 )11 ( 1 )
( b ) 5430 V
( a ) 5100 VIn
tens
ity (
arb
uni
ts )
mz
-15--15-
the potential of cylindrical electric sector and the width of energy slit were fixed so that the ions ofthe potential of cylindrical electric sector and the width of energy slit were fixed so that the ions of
5000 5000 plusmnplusmn 5 ( eV charge ) could path through5 ( eV charge ) could path through
It is difficult to assign the corresponding fragmentation channel and region of fragment peaksIt is difficult to assign the corresponding fragmentation channel and region of fragment peaks
or plateau observed in mass spectra from only one mass spectrum One must investigate severalor plateau observed in mass spectra from only one mass spectrum One must investigate several
mass spectra of adjacent acceleration voltages to assign accurate fragmentation channel and re-mass spectra of adjacent acceleration voltages to assign accurate fragmentation channel and re-
gion However it is not rational to see over 50 - mass spectra one by one The contour map modi-gion However it is not rational to see over 50 - mass spectra one by one The contour map modi-
fication method is therefore very useful for visual understanding of fragmentation channels andfication method is therefore very useful for visual understanding of fragmentation channels and
region as a whole The symbols region as a whole The symbols nn ( ( r r ) shown in Fig 2 5 are the assigned fragmentation channels) shown in Fig 2 5 are the assigned fragmentation channels
and regionsand regions
Now let us discuss the correlation between the positions in a contour map and regions1-5 inNow let us discuss the correlation between the positions in a contour map and regions1-5 in
which fragmentation occurred Here fragmentation channel is which fragmentation occurred Here fragmentation channel is AA++ rarrrarr B B++ + C + C where where AA++ denote the denote the
precursor ion precursor ion BB++ the product ion and the product ion and CC the neutral loss The mass of the precursor and the product the neutral loss The mass of the precursor and the product
ion are ion are MMprepre and and MMpropro respectively The potential of cylindrical electric sector was fixed so that the respectively The potential of cylindrical electric sector was fixed so that the
ions of 5 ( keV charge ) could path throughions of 5 ( keV charge ) could path through
Assuming that the electrostatic lens system was a pair of parallel plates for simplicity prod-Assuming that the electrostatic lens system was a pair of parallel plates for simplicity prod-
uct ions yielded at distance uct ions yielded at distance xx ( ( x x = 0 to be start of lens system ) in the electrostatic lens system has= 0 to be start of lens system ) in the electrostatic lens system has
kinetic energykinetic energy
minus
minus=Lx
M
MM1VU
pre
propreapro == 5 ( keV ) 5 ( keV ) (( 0 lt x lt L 0 lt x lt L ))
where where VVaa is the acceleration voltage and is the acceleration voltage and LL is the length of electrostatic lens system is the length of electrostatic lens system The kineticThe kinetic
energy of product ion energy of product ion UUpropro must be 5 keV in order to reach the detector Accordingly the accelera- must be 5 keV in order to reach the detector Accordingly the accelera-
tion voltage must be set depending on tion voltage must be set depending on x x for 5 kV ( for 5 kV ( xx= 0 ) to 5= 0 ) to 5MMprepreMMpropro ( kV ) ( ( kV ) ( x = L x = L ) Considered) Considered
with the fact that the product ions are mass analyzed by the magnetic sector the fragmentationwith the fact that the product ions are mass analyzed by the magnetic sector the fragmentation
occurred at region1 expected to appear as lines parallel to the abscissa axis in the contour mapoccurred at region1 expected to appear as lines parallel to the abscissa axis in the contour map
-16--16-
region1 ( region1 ( VVaa mz mz ) = ( 5 lt ) = ( 5 lt VVaa lt 5lt 5MMprepre M Mpropro MMpropro ))
Fragmentation occurred at region2 - 4 ( from exit of ion source to entrance of cylindricalFragmentation occurred at region2 - 4 ( from exit of ion source to entrance of cylindrical
electric field (C) ) appeared at the same acceleration voltage in contour map In order to passelectric field (C) ) appeared at the same acceleration voltage in contour map In order to pass
through the electric sector precursor ions must be accelerated by 5through the electric sector precursor ions must be accelerated by 5MMprepre M Mpropro ( keV ) The appearing( keV ) The appearing
mzmz values are different according to the position of fragmentation so that are analyzed ions by values are different according to the position of fragmentation so that are analyzed ions by
magnetic sector The fragmentation occurred at regin2-4 appeared in contour mapsmagnetic sector The fragmentation occurred at regin2-4 appeared in contour maps
region2 the peak at ( region2 the peak at ( VVaa mz mz ) = ( 5) = ( 5MMprepre M Mpropro MMpropro ))
region3 the line at ( region3 the line at ( VVaa mz mz ) = ( 5) = ( 5MMprepre M Mpropro MMpro pro lt lt M lt MM lt Mprepre22 M Mpropro ))
( line connecting region2 and region4 fragmentation peak )( line connecting region2 and region4 fragmentation peak )
region4 peak at ( region4 peak at ( VVaa mz mz ) = ( 5) = ( 5MMprepre M Mpropro MMprepre22 M Mpropro ))
The precursor ions that have the kinetic energy of 5 - 5The precursor ions that have the kinetic energy of 5 - 5MMproproMMprepre decomposed at certain place decomposed at certain place
in the cylindrical electric sector could path through it and are detected The fragmentation in elec-in the cylindrical electric sector could path through it and are detected The fragmentation in elec-
tronic sector are shown as the linetronic sector are shown as the line
region5 ( region5 ( VVaa mz mz ) = ( 5 lt ) = ( 5 lt VVaa lt 5lt 5MMprepre M Mpropro VVaa M Mprepre 55 ))
( connecting peaks of region4 and not fragmented peak of ( connecting peaks of region4 and not fragmented peak of MMprepre ) )
In summary a typical contour map and an appearance positions in the contour map corre-In summary a typical contour map and an appearance positions in the contour map corre-
sponding to fragmentation channel sponding to fragmentation channel AA ++ rarrrarr B B ++ + C + C at each region are described in Fig 2 6 The at each region are described in Fig 2 6 The
lines at acceleration voltages 5100 and 5430 V are corresponding to the mass spectra of Fig 2 5lines at acceleration voltages 5100 and 5430 V are corresponding to the mass spectra of Fig 2 5
(a) and (b) It is understood that the fragmentation channels and regions of peaks appeared in mass(a) and (b) It is understood that the fragmentation channels and regions of peaks appeared in mass
spectra can assign easily The appearance position of the fragmentation channel Hgspectra can assign easily The appearance position of the fragmentation channel Hg1212AgAg++ rarrrarr Hg Hg1111AgAg++
+ Hg is shown in the contour map The values of + Hg is shown in the contour map The values of MMpre pre and and MMpropro are 25150 and 23144 respectively are 25150 and 23144 respectively
The appearance position decomposing in each region areThe appearance position decomposing in each region are
region1 ( region1 ( VVaa ( keV ) ( keV ) mz mz ) = ( 5 lt ) = ( 5 lt VVaa lt 543 2314lt 543 2314 ) region2 ( ) region2 ( VVaa mz mz ) = ( 543 2314) = ( 543 2314 ))
region3 ( region3 ( VVaa mz mz ) = ( 543 2314 lt M lt) = ( 543 2314 lt M lt 2733 ) region4 ( 2733 ) region4 ( VVaa mz mz ) = ( 543 2733) = ( 543 2733 ))
region5 ( region5 ( VVaa mz mz ) = ( 5 lt ) = ( 5 lt VVaa lt 543 2515 lt 543 2515 VVaa 5 )5 )
-17--17-
5000 5100 5200 5300 5400 55002200
2400
2600
2800
3000
Fig 2 5 (b)Fig 2 5 (a)
Acceleration Voltage ( V )
mz
Fig 2 6 The typical contour map ( upper ) and the appearence position dependence of fragmenta-Fig 2 6 The typical contour map ( upper ) and the appearence position dependence of fragmenta-
tion regions in contour map about the channel of which the mass of precursor and product ion aretion regions in contour map about the channel of which the mass of precursor and product ion are
MMprepre and and MMpropro respectively ( bottom ) Two lines parallel to mz axis were correspond to Fig 2 5 respectively ( bottom ) Two lines parallel to mz axis were correspond to Fig 2 5
(a) and (b) The appearence position dependence of fragmentation regions about the channel Hg(a) and (b) The appearence position dependence of fragmentation regions about the channel Hg1212AgAg++
rarrrarr Hg Hg1111AgAg++ + Hg were also described in contour map + Hg were also described in contour map
5 5M Mpre pro
region1
region2
region3
region4
region5
Acceleration Voltage (kV)
mz
Mpro
Mpre
Mpre2 M pro
-18--18-
2 3 1 Acceleration voltage scan method2 3 1 Acceleration voltage scan method
Since about one minute was necessary for one magnetic field scan it took about 2 hours inSince about one minute was necessary for one magnetic field scan it took about 2 hours in
order to make a contour map consisted with 100 mass spectra It was difficult to maintain the ionorder to make a contour map consisted with 100 mass spectra It was difficult to maintain the ion
source constant and stable for such a long time As a result the contour map modification methodsource constant and stable for such a long time As a result the contour map modification method
was available when the consisting mass spectra were less than 100 In other words the experimentwas available when the consisting mass spectra were less than 100 In other words the experiment
to investigate the fragmentation channels which mass ratio of precursor ions to product ions wereto investigate the fragmentation channels which mass ratio of precursor ions to product ions were
about about MMprepreMMpropro lt 3 An acceleration voltage scan method is available to study the fragmentation lt 3 An acceleration voltage scan method is available to study the fragmentation
channels of channels of MMprepreMMpropro lt 6 This method was generally applied for the fragmentation yielding small lt 6 This method was generally applied for the fragmentation yielding small
size of the product ion A acceleration voltage scan spectrum corresponded to trace of the linesize of the product ion A acceleration voltage scan spectrum corresponded to trace of the line
parallel to a acceleration voltage axis of a contour map The decompositions occurred at region2parallel to a acceleration voltage axis of a contour map The decompositions occurred at region2
which have higher intensities than others were mainly investigatedwhich have higher intensities than others were mainly investigated
The schematic diagram of the acceleration voltage scan method is shown in Fig 2 7 At firstThe schematic diagram of the acceleration voltage scan method is shown in Fig 2 7 At first
the strength of the magnetic and the electric field were fixed so that the product ions of giventhe strength of the magnetic and the electric field were fixed so that the product ions of given
kinetic energy and mass could path through to detector When the function generator received thekinetic energy and mass could path through to detector When the function generator received the
start signal ( TTL signal ) from the PC for scanning then outputs the signal shown in Fig 2 8start signal ( TTL signal ) from the PC for scanning then outputs the signal shown in Fig 2 8
which was used as the reference signal of acceleration voltage power source Two accelerationwhich was used as the reference signal of acceleration voltage power source Two acceleration
voltage spectra could obtain for one scan because the reference signal was going up and down Thevoltage spectra could obtain for one scan because the reference signal was going up and down The
acceleration voltage power supply output the voltage multiplied the reference signal by 5000acceleration voltage power supply output the voltage multiplied the reference signal by 5000
A typical acceleration voltage scan spectrum is shown in Fig 2 9 where the selected productA typical acceleration voltage scan spectrum is shown in Fig 2 9 where the selected product
ion is Agion is Ag1313+ + of 1 keV Three peaks observed in the spectrum were determined as Agof 1 keV Three peaks observed in the spectrum were determined as Ag1313
++ of (a) non- of (a) non-
fragmented (b) in fragmentation channels Agfragmented (b) in fragmentation channels Ag1414++ rarrrarr Ag Ag1313
++ + Ag and (c) Ag + Ag and (c) Ag1515++ rarrrarr Ag Ag1313
++ + Ag + Ag22 These These
were calculated from the observed acceleration voltages The peak (a) had wide-based tail towardwere calculated from the observed acceleration voltages The peak (a) had wide-based tail toward
to the peak (b) This was the product ions in Agto the peak (b) This was the product ions in Ag1414++ rarrrarr Ag Ag1313
++ + Ag at region1 + Ag at region1
-19--19-
AD board( PC )
FunctiongeneratorStart Signal
( TTL signal )
Reference signal
Accelerationvoltage
Power supplyDetector
Ion Signal
Mass spectrometer
Fig 2 7 Schematic diagram of acceleration voltage scan methodFig 2 7 Schematic diagram of acceleration voltage scan method
0 5 10 15 20 25
02
04
06
08
10
Ref
eren
ce V
olta
ge (
V )
Time ( sec )
Fig 2 8 Reference voltage transmitted from function generator to acceleration voltage powerFig 2 8 Reference voltage transmitted from function generator to acceleration voltage power
supplysupply
-20--20-
08 10 12 14 16 18 20 22 24 26 28 30
1E-3
001
01
( c )
( b )
( a )
Inte
nsity
( ar
b u
nits
)
Acceleration Voltage ( kV )
Fig 2 9 Acceleration voltage scan spectrum that the selected product ions was AgFig 2 9 Acceleration voltage scan spectrum that the selected product ions was Ag1313+ + of 1 keVof 1 keV
-21--21-
ReferencesReferences
[21] I Katakuse T Ichihara H Nakabushi T Matsuo H Matsuda Mass spectrom [21] I Katakuse T Ichihara H Nakabushi T Matsuo H Matsuda Mass spectrom 31 31 (1983) (1983)
1111
[22] H Matsuda T Matsuo Y Fujita T Sakurai I Katakuse Int J Mass spectrum Ion Pro-[22] H Matsuda T Matsuo Y Fujita T Sakurai I Katakuse Int J Mass spectrum Ion Pro-
cesses cesses 9191 (1989) 1 (1989) 1
-22--22-
3 Size distribution and fragmentation pattern3 Size distribution and fragmentation patternof mercury-silver binarycluster ionsof mercury-silver binarycluster ions
3 1 Introduction3 1 Introduction
The size distributions of mercury-alkali metal binary cluster ions ( HgThe size distributions of mercury-alkali metal binary cluster ions ( HgnnKK++ Hg HgnnCsCs++ Hg HgnnRbRb++ ) )
produced by the sputter ion source were already investigated [312] The magic numbers produced by the sputter ion source were already investigated [312] The magic numbers n n = 8= 8
12 14 18 22 25 and 31 were observed at small size region These were independent of includ-12 14 18 22 25 and 31 were observed at small size region These were independent of includ-
ing alkali metal and were quite similar to those of van der Waals cluster ions This fact indicateding alkali metal and were quite similar to those of van der Waals cluster ions This fact indicated
that the bonding force of mercury-alkali metal binary cluster ions were also van der Waals force atthat the bonding force of mercury-alkali metal binary cluster ions were also van der Waals force at
nn lt 30 The structures of stable mercury-alkali metal cluster ions believed to be icosahedral or lt 30 The structures of stable mercury-alkali metal cluster ions believed to be icosahedral or
double icosahedral structures where alkali metal ions were at the center of the clusterdouble icosahedral structures where alkali metal ions were at the center of the cluster
The size distribution of large HgThe size distribution of large HgnnCsCs++ ( ( nn lt1000 ) clusters was also investigated [32] It lt1000 ) clusters was also investigated [32] It
showed the wave like variation where the cluster sizes at bottom of valleys were roughly consistentshowed the wave like variation where the cluster sizes at bottom of valleys were roughly consistent
with those of predicted electronic shell closed numbers The authors concluded that this was origi-with those of predicted electronic shell closed numbers The authors concluded that this was origi-
nated from the metallic structure of neutral Hgnated from the metallic structure of neutral Hgnn Two kinds of clusters Hg Two kinds of clusters Hgnn and Hg and HgnnCsCs++ were were
created in the ion source and the wave like variation was the results of formercreated in the ion source and the wave like variation was the results of former
In this section the size distribution and fragmentation pattern of mercury-silver binary clus-In this section the size distribution and fragmentation pattern of mercury-silver binary clus-
ter ions were reported Silver atom has the one ter ions were reported Silver atom has the one ss valence electron ( 5 valence electron ( 5ss electron ) as well as alkali electron ) as well as alkali
metalsmetals
-23--23-
3 2 Results3 2 Results
3 2 1 Size distribution of mercury-silver binary cluster ion3 2 1 Size distribution of mercury-silver binary cluster ion
The mass spectrum The mass spectrum mzmz = 350 - 4250 is shown in Fig 3 1 (a) Each peak of the same size = 350 - 4250 is shown in Fig 3 1 (a) Each peak of the same size
seen as like one peak had own peak pattern because both mercury and silver were not monoisotopeseen as like one peak had own peak pattern because both mercury and silver were not monoisotope
elements At elements At mzmz lt 1500 the mass resolution was enough to separate each peak Thus I could lt 1500 the mass resolution was enough to separate each peak Thus I could
assign composition of each cluster peak by comparing with calculated peak pattern The peakassign composition of each cluster peak by comparing with calculated peak pattern The peak
patterns of cluster ions were calculated from the IUPAC isotopic compositions of the elementspatterns of cluster ions were calculated from the IUPAC isotopic compositions of the elements
[33] and the 1983 atomic mass table [ 34 ] For example enlarged mass spectrum of Fig 3 1 (a)[33] and the 1983 atomic mass table [ 34 ] For example enlarged mass spectrum of Fig 3 1 (a)
between between mzmz = 895 - 925 and calculated peak pattern of Hg = 895 - 925 and calculated peak pattern of Hg44AgAg++ under the condition that mass under the condition that mass
resolution 1000 are shown in Fig 3 1 (b) and (c)resolution 1000 are shown in Fig 3 1 (b) and (c)
As for the As for the mzmz gt 1500 however insufficient mass resolution prevented from assigning the gt 1500 however insufficient mass resolution prevented from assigning the
composition of cluster ions by comparing with calculated peak patterns Accordingly the peakscomposition of cluster ions by comparing with calculated peak patterns Accordingly the peaks
were assigned by appeared masses and extrapolation from the composition of smaller size clusterwere assigned by appeared masses and extrapolation from the composition of smaller size cluster
ions The dominant peaks shown in Fig 3 1 (a) had the ions The dominant peaks shown in Fig 3 1 (a) had the mzmz values of 2006 values of 2006 nn + 1079 thus they + 1079 thus they
were assigned to Hgwere assigned to HgnnAgAg++
The enlarged mass spectrum of Fig 3 1 (a) is shown in Fig 3 2 There were two smallerThe enlarged mass spectrum of Fig 3 1 (a) is shown in Fig 3 2 There were two smaller
peaks between Hgpeaks between HgnnAgAg++ and Hg and Hgnn+1+1AgAg++ peaks They were assigned to be Hg peaks They were assigned to be Hgnn++ and Hg and Hgnn-1-1AgAg22
++ because because
their appeared masses were their appeared masses were mzmz values of 2006 values of 2006 nn and 2006 ( and 2006 ( n n - 1 ) + 2158 respectively These- 1 ) + 2158 respectively These
two peaks could not resolve at the two peaks could not resolve at the nn gt 15 however Hg gt 15 however Hgnn-1-1AgAg22++ were dominant considering the were dominant considering the
appeared appeared mzmz values values
The size distribution of HgThe size distribution of HgnnAgAg++ ( ( nn = 1 - 45 ) is shown in Fig 3 3 Generally the size = 1 - 45 ) is shown in Fig 3 3 Generally the size
distributions of cluster ions produced by a sputtering ion source are well known to logarithmicallydistributions of cluster ions produced by a sputtering ion source are well known to logarithmically
decreased as the size increased On the contrary the suddenly intensity decrease was observed at decreased as the size increased On the contrary the suddenly intensity decrease was observed at nn
-24--24-
Fig 3 1 (a) Mass spectrum of cluster ions made by 10 keV Xe ions bombardment on silverFig 3 1 (a) Mass spectrum of cluster ions made by 10 keV Xe ions bombardment on silver
mercury amalgammercury amalgam
Fig 3 1 (b) Enlarged mass spectrum of Fig 3 1 (a) The observed peak pattern of HgFig 3 1 (b) Enlarged mass spectrum of Fig 3 1 (a) The observed peak pattern of Hg44AgAg++ (c) (c)
Calcurated peak pattern of HgCalcurated peak pattern of Hg44AgAg++
895 900 905 910 915 920 925000
002
004
006
008
010
012
Isot
opic
rat
io
mz
895 900 905 910 915 920 92500
02
04
06
08
10(c)(b)
Inte
nsity
( ar
b u
nits
)
500 1000 1500 2000 2500 3000 3500 400000
02
04
06
08
10 (a)
Inte
nsity
(arb
uni
ts)
mz
-25--25-
Fig 3 2 Enlarged mass spectrum of Fig 3 1 (a) Two peaks between the HgFig 3 2 Enlarged mass spectrum of Fig 3 1 (a) Two peaks between the HgnnAgAg++ (saturated(saturated
peaks) were Hgpeaks) were Hgnn++ and Hg and Hgnn-1-1AgAg22
++
Fig 3 3 Size distribution of HgFig 3 3 Size distribution of HgnnAgAg++ ( ( nn = 1 - 45) The figures are the predicted shell closed sizes = 1 - 45) The figures are the predicted shell closed sizes
and number of total valence electron ( in parentheses) based on electronic shell modeland number of total valence electron ( in parentheses) based on electronic shell model
4 8 12 16 20 24 28 32 36 40 44001
01
1 4
29
17109
(40)(34)
(8)
(58)
(18) (20)
Inte
nsity
(arb
uni
ts)
Cluster size of HgnAg+ ( n )
1600 1800 2000 2200 2400 2600 2800 3000000
001
002
003
004
005
Hg13Ag2+
Hg14+
Hg10Ag2+
Hg11+
Hg7Ag2+
Hg8+
Inte
nsity
(arb
uni
ts)
mz
-26--26-
lt 10 Whether such intensity reduction at small size was caused by characters of mercury-silverlt 10 Whether such intensity reduction at small size was caused by characters of mercury-silver
clusters or by the creation mechanism was very interesting It would be argued in later text takingclusters or by the creation mechanism was very interesting It would be argued in later text taking
account of fragmentation patterns tooaccount of fragmentation patterns too
Several variations were appeared in size distribution at Several variations were appeared in size distribution at nn lt 40 The conspicuous step like lt 40 The conspicuous step like
variations were observed at cluster size variations were observed at cluster size nn = 10 22 and the less were observed at = 10 22 and the less were observed at nn = 17 26 The size = 17 26 The size
distribution of Hgdistribution of HgnnAgAg++ was quite different from Hg was quite different from HgnnMM++ ( M alkali metals ) The observed charac- ( M alkali metals ) The observed charac-
teristic numbers teristic numbers nn = 10 17 could not be interpreted by icosahedron or double icosahedron struc- = 10 17 could not be interpreted by icosahedron or double icosahedron struc-
tures Moreover the magic numbers indicating geometrical stabilities ( tures Moreover the magic numbers indicating geometrical stabilities ( nn = 12 18 ) were not ob- = 12 18 ) were not ob-
served The total number of valence electrons in Hgserved The total number of valence electrons in HgnnAgAg++ was 2 was 2n n Considering the electronic shellConsidering the electronic shell
structures of Hgstructures of HgnnAgAg++ the predicted magic number would be the predicted magic number would be n n = 4 9 10 17 20 and 29 ( total= 4 9 10 17 20 and 29 ( total
valence electrons were 8 18 20 34 40 and 58 respectively ) which relatively consistent with myvalence electrons were 8 18 20 34 40 and 58 respectively ) which relatively consistent with my
experimental result It is well known that the internal energy of cluster ( or temperature ) is greatlyexperimental result It is well known that the internal energy of cluster ( or temperature ) is greatly
contributed to variety of stability whether geometrical or electronic The internal energy of clusterscontributed to variety of stability whether geometrical or electronic The internal energy of clusters
made by sputtering method were widly distributed ( see chapter 5 ) so that the geometrical andmade by sputtering method were widly distributed ( see chapter 5 ) so that the geometrical and
electronic stabilities would be competed The small size of Hgelectronic stabilities would be competed The small size of HgnnAgAg++ ( ( nn lt 40 ) was rather understood lt 40 ) was rather understood
by electronic shell structure than geometric one which was differed from the mercury-alkali metalby electronic shell structure than geometric one which was differed from the mercury-alkali metal
binary cluster ions It was believed that the delocalization of the charge at silver atom of Hgbinary cluster ions It was believed that the delocalization of the charge at silver atom of HgnnAgAg++
caused the metalic structure in the size distribution of Hgcaused the metalic structure in the size distribution of HgnnAgAg++
The mass spectrum of The mass spectrum of mzmz = 10000 - 68200 is shown in Fig 3 4 The abscissa is expressed = 10000 - 68200 is shown in Fig 3 4 The abscissa is expressed
in number of Hg atoms in cluster size of Hgin number of Hg atoms in cluster size of HgnnAgAg++ Each peaks were resolved up to Each peaks were resolved up to nn = 250 Taking = 250 Taking
account the energy window of the cylindrical electric sector the product ions Hgaccount the energy window of the cylindrical electric sector the product ions HgnnAgAg++ ( ( nn gt 200 ) gt 200 )
yielded by a Hg atom evaporation at region2 could also reach to the detector and would appear atyielded by a Hg atom evaporation at region2 could also reach to the detector and would appear at
cluster size about ( cluster size about ( n n - 2 ) The wave like variation was appeared in size distributions at the cluster- 2 ) The wave like variation was appeared in size distributions at the cluster
size lager than size lager than nn gt 30 The cluster size of gt 30 The cluster size of nn = 46 74 100 133 176 225 284 were the bottom of = 46 74 100 133 176 225 284 were the bottom of
-27--27-
Fig 3 4 Mass spectrum of HgFig 3 4 Mass spectrum of HgnnAgAg++ ( ( nn = 50- 340 ) The wave like variations were appeared The = 50- 340 ) The wave like variations were appeared The
cluster size at the bottom of valley and total number of valence electrons ( in parentheses ) werecluster size at the bottom of valley and total number of valence electrons ( in parentheses ) were
shownshown
Fig 3 5 The size distribution of HgFig 3 5 The size distribution of HgnnAgAg22++ ( ( nn = 4 - 39 ) = 4 - 39 )
60 80 100 120 140 160 180 200 220 240 260 280 300 320 340
10-3
10-2
10-1
284(568)
225(450)
176(352)
133(266)
100(200)
74(148)
Inte
nsity
(arb
uni
ts)
Cluster Size of HgnAg+ ( n )
4 6 8 10 12 14 16 18 20 22 24 26 28 30 32 34 36 38 40001
01
1
Inte
nsity
( ar
b u
nits
)
Cluster size of HgnAg2+( n )
-28--28-
valleys This wave like variation and sizes at bottom of valleys were quite similar to those ofvalleys This wave like variation and sizes at bottom of valleys were quite similar to those of
HgHgnnCsCs++ that already reported [32] that already reported [32]
The shell closing numbers predicted by a shell model based on Woods-Saxon potential wereThe shell closing numbers predicted by a shell model based on Woods-Saxon potential were
58 92 138 198 254 268 338 440 562 [35] The number of valence electrons at bottoms of58 92 138 198 254 268 338 440 562 [35] The number of valence electrons at bottoms of
valleys were roughly equal calculated shell closing numbers Taking the total valence electrons ofvalleys were roughly equal calculated shell closing numbers Taking the total valence electrons of
HgHgnnAgAg++ was 2 was 2nn into account into account there were agreement between the total number of valence electrons there were agreement between the total number of valence electrons
at local minima and the shell closing numbers This agreement was interpreted as well as Hgat local minima and the shell closing numbers This agreement was interpreted as well as HgnnCsCs++
[32] The production of mercury-silver cluster ions was competed with neutral mercury clusters[32] The production of mercury-silver cluster ions was competed with neutral mercury clusters
HgHgnn where neutral species were believed to be a major yield Size distributions of neutral species where neutral species were believed to be a major yield Size distributions of neutral species
would seriously influence on the ions It is considered that weak intensities of Hgwould seriously influence on the ions It is considered that weak intensities of HgnnAgAg++ at valley at valley
were indicating the strong intensities of Hgwere indicating the strong intensities of Hgnn since the number of valence electrons in Hg since the number of valence electrons in Hgnn and and
HgHgnnAgAg++ were the same ( = 2 were the same ( = 2n n ) as illustrated in Fig 3 4) as illustrated in Fig 3 4
The size distribution of HgThe size distribution of HgnnAgAg22++ ( ( nn = 4 - 39 ) is shown in Fig 3 5 The suddenly discontinu- = 4 - 39 ) is shown in Fig 3 5 The suddenly discontinu-
ous was observed at ous was observed at nn = 18 however it was hard to understand its stability by electronic shell = 18 however it was hard to understand its stability by electronic shell
model because Hgmodel because Hg1818AgAg22++ has 37 total valence electrons It is believed that the stable Hg has 37 total valence electrons It is believed that the stable Hg1818AgAg22
++
cluster ion has geometric double icosahedron structure ( see the picture in Fig 3 5 ) The silvercluster ion has geometric double icosahedron structure ( see the picture in Fig 3 5 ) The silver
dimmer ion Agdimmer ion Ag22++ considered to be behaved like an atom at the center of these complex cluster considered to be behaved like an atom at the center of these complex cluster
The interpretations of mass spectra whether geometrical or elecrical were changed accord-The interpretations of mass spectra whether geometrical or elecrical were changed accord-
ing to the number of silver atom in the mercury clusters The same phenomenon was also observeding to the number of silver atom in the mercury clusters The same phenomenon was also observed
for Hgfor HgnnKKii++ [31] where size distributions were interpreted geometrically for [31] where size distributions were interpreted geometrically for ii = 1 2 and 3 on the = 1 2 and 3 on the
other hand electrically for other hand electrically for ii = 4 = 4
-29--29-
3 2 2 Fragmentation pattern of mercury-silver binary cluster ion3 2 2 Fragmentation pattern of mercury-silver binary cluster ion
A typical contour map is shown in Fig 3 6 indicating the fragmentation in the flight of theA typical contour map is shown in Fig 3 6 indicating the fragmentation in the flight of the
mass spectrometer The electric field was kept constant so that the ions having 2000 mass spectrometer The electric field was kept constant so that the ions having 2000 plusmnplusmn 10 eV could 10 eV could
path through while the acceleration voltage was varied from 2 kV to 3 kV by 20 V step The masspath through while the acceleration voltage was varied from 2 kV to 3 kV by 20 V step The mass
spectra were obtained at each acceleration voltage by a magnetic field scan The observed massspectra were obtained at each acceleration voltage by a magnetic field scan The observed mass
range was range was mzmz = 195 - 4975 Hg = 195 - 4975 HgnnAgAg++ ( ( nn = 1 - 24 ) could be observed The curved lines on the = 1 - 24 ) could be observed The curved lines on the
contour map show predicted positions when precursor cluster ions emitted neutral atoms or clustercontour map show predicted positions when precursor cluster ions emitted neutral atoms or cluster
in region2 The labeled figures at the upside are corresponding to the number of emitted mercuryin region2 The labeled figures at the upside are corresponding to the number of emitted mercury
atoms Basically the fragmentation channels which emitted more than two mercury atoms couldatoms Basically the fragmentation channels which emitted more than two mercury atoms could
not be distinguished whether cluster emission or successive atoms emissions Considering thenot be distinguished whether cluster emission or successive atoms emissions Considering the
flight time in region2 ( 10flight time in region2 ( 10-6-6 - 10 - 10-4-4 sec) however the large cases of mercury atoms losses believed to sec) however the large cases of mercury atoms losses believed to
be cluster emissionsbe cluster emissions
The possible fragmentation channels of HgThe possible fragmentation channels of HgnnAgAg++ ( ( nn = 1 - 10 ) were investigated for discussing = 1 - 10 ) were investigated for discussing
the sudden intensity decrease at small cluster size the sudden intensity decrease at small cluster size nn lt 10 In this case we used the acceleration lt 10 In this case we used the acceleration
voltage scan method because the mass ratios of voltage scan method because the mass ratios of MMprepreMMpropro ( ( MMprepre denotes the mass of precursor ion denotes the mass of precursor ion
and and MMpropro mass of product ion) were too large to use the contour map modification method as mass of product ion) were too large to use the contour map modification method as
mentioned in section 2 3 1 In the acceleration voltage scan method the product ions of Hgmentioned in section 2 3 1 In the acceleration voltage scan method the product ions of Hgnn++ ( ( nn = =
1 - 10 ) and Hg1 - 10 ) and HgnnAgAg++ ( ( nn = 0 - 9 ) of 1 keV kinetic energy were selected = 0 - 9 ) of 1 keV kinetic energy were selected
A typical acceleration voltage scan spectrum is shown in Fig 3 7 where the field strength ofA typical acceleration voltage scan spectrum is shown in Fig 3 7 where the field strength of
the magnet and the electric sector was set to path through Hgthe magnet and the electric sector was set to path through Hg22++ of 1 keV The precursor ions were of 1 keV The precursor ions were
determined from appeared acceleration voltage The fragment peaks labeled with naked figure determined from appeared acceleration voltage The fragment peaks labeled with naked figure nn
were the peaks coming from precursor ions of Hgwere the peaks coming from precursor ions of HgnnAgAg++ and labeled with circled figure were from and labeled with circled figure were from
HgHgnn++
The intensities of fragmentation channels from HgThe intensities of fragmentation channels from HgnnAgAg++ ( ( nn = 1 - 10 ) are shown in Table 3 1 = 1 - 10 ) are shown in Table 3 1
-30--30-
Fig 3 6 Fragmentation patterns shown in a typical contour map The curved lines showed theFig 3 6 Fragmentation patterns shown in a typical contour map The curved lines showed the
predicted positions when precursor clusters emitted neutral atom or cluster in region2 The labeledpredicted positions when precursor clusters emitted neutral atom or cluster in region2 The labeled
figures are corresponding to the emitting numbers of mercury atomsfigures are corresponding to the emitting numbers of mercury atoms
2000 2200 2400 2600 2800 3000
500
1000
1500
2000
2500
3000
3500
4000
4500
9 12111087653 421
Acceralation Voltage ( V )
mz
-31--31-
10 15 20 25 30 35 40 45 50 551E-3
001
01
1
10
n HgnAg+
⑦⑥⑤
④
③
⑧108 9765
432
n Hgn+
Precursor ions
Selected product ion Hg2+
Inte
nsity
( ar
b u
nits
)
Acceleration Voltage ( kV )
Fig 3 7 The typical acceleration voltage scan spectrum where the field strength of the magnetFig 3 7 The typical acceleration voltage scan spectrum where the field strength of the magnet
and the electric sector was set to path through Hgand the electric sector was set to path through Hg22++ of 1keV of 1keV
-32--32-
Precursor ions ( HgnAg+)
n 1 2 3 4 5 6 7 8 9 10
Product ions(HgnAg+
Hgn+)
0 0 0
1 0 0 0 0
1 20 29 35 20 49 61
2 7 8 47 39 45 38 46 52
2 272 375 275 347 231 173 146 151
3 15 16 10 19 27 42 57 81
3 875 559 703 554 409 291 187
4 7 0 0 0 0 0 0
4 836 657 599 551 436 312
5 7 0 0 0 0 0
5 1012 337 302 297 275
6 2 0 0 0 0
6 988 186 125 171
7 3 0 0 0
7 1082 225 171
8 5 0 0
8 1116 147
9 7 0
9 1115
10 3
Table 3 1 The intensities of fragmentation channels of HgTable 3 1 The intensities of fragmentation channels of HgnnAgAg++ The grayed lines were indicating The grayed lines were indicating
the fragmentation channels yielding Hgthe fragmentation channels yielding Hgnn++ as product ions as product ions
-33--33-
The major channel of each precursor ions was an emission of one mercury atom The fragmenta-The major channel of each precursor ions was an emission of one mercury atom The fragmenta-
tion channels yielding mercury cluster ions were only observed for product ions of Hgtion channels yielding mercury cluster ions were only observed for product ions of Hgnn++ ( ( nn = 2 3 = 2 3
) however these were considerably minor channels with respect to the channels yielding Hg) however these were considerably minor channels with respect to the channels yielding HgnnAgAg++
The cluster ions produced by sputtering method have high internal energy that caused theThe cluster ions produced by sputtering method have high internal energy that caused the
chain or branch fragmentations from production time One could only recognize the fragmentationchain or branch fragmentations from production time One could only recognize the fragmentation
occurred 10occurred 10-7-7 sec after the production in this experimental conditions The product ions yeilded by sec after the production in this experimental conditions The product ions yeilded by
the fragmentations occurred before 10the fragmentations occurred before 10-7-7 sec are not distinguish from non-fragmented ions of same sec are not distinguish from non-fragmented ions of same
size The sudden intensity decrease at small size region in mass spectra could be interpreted if thesize The sudden intensity decrease at small size region in mass spectra could be interpreted if the
fragmentation channels Hgfragmentation channels HgnnAgAg++ rarrrarr Hg Hgmm++ + Hg + Hgn-mn-mAg would occur mainly before 10Ag would occur mainly before 10-7-7 sec The sec The
fragmentation channels during the flight time in mass spectrometer ( 10fragmentation channels during the flight time in mass spectrometer ( 10-6-6 - 10 - 10-4-4 sec ) were investi- sec ) were investi-
gated whether the fragmentation channels Hggated whether the fragmentation channels HgnnAgAg++ rarrrarr Hg Hgmm++ + Hg + Hgn-mn-mAg was dominant at small sizeAg was dominant at small size
However the intensity decrease at small size could not interpret by the fragmentation pattern ofHowever the intensity decrease at small size could not interpret by the fragmentation pattern of
HgHgnnAgAg++ ( ( nn = 1 - 10 ) Thus intensity decrease was believed to be originated from the creation = 1 - 10 ) Thus intensity decrease was believed to be originated from the creation
mechanism It is believed that the low density of Ag atoms in mercury sample caused the produc-mechanism It is believed that the low density of Ag atoms in mercury sample caused the produc-
tion of relatively large mercury-silver binary cluster ions As a result the size distribution whichtion of relatively large mercury-silver binary cluster ions As a result the size distribution which
the intensities of small cluster ions decreased were observed in this experimentthe intensities of small cluster ions decreased were observed in this experiment
The fragmentation pattern of cluster size The fragmentation pattern of cluster size nn = 25 - 100 is shown in Figs 3 8 - 10 The consist- = 25 - 100 is shown in Figs 3 8 - 10 The consist-
ing mass spectra were obtained under condition that the cylindrical electric field was kept constanting mass spectra were obtained under condition that the cylindrical electric field was kept constant
so that the ions having 2000 so that the ions having 2000 plusmnplusmn 20 eV could path through and acceleration voltage was varied from 20 eV could path through and acceleration voltage was varied from
2 to 3 kV by 20 V step The curved lines on the contour map show predicted positions when2 to 3 kV by 20 V step The curved lines on the contour map show predicted positions when
precursor cluster ions emitted neutral atom or cluster in region2 The labeled figures at the upsideprecursor cluster ions emitted neutral atom or cluster in region2 The labeled figures at the upside
are corresponding to the emitting numbers of mercury atoms The intensities of fragmentationare corresponding to the emitting numbers of mercury atoms The intensities of fragmentation
channels losing large cluster emissions were gradually decreased accompanied with size increasechannels losing large cluster emissions were gradually decreased accompanied with size increase
The mainly observed fragmentation channels were HgThe mainly observed fragmentation channels were Hgnn ( ( nn = 1 - 3 ) emissions and priority were = 1 - 3 ) emissions and priority were
-34--34-
Fig 3 9 The framentation pattern of HgFig 3 9 The framentation pattern of HgnnAgAg++ ( ( nn = 25 - 50 ) modified in contour map = 25 - 50 ) modified in contour map
2000 2040 2080 2120 2160
26
28
30
32
34
36
38
40
42
44
46
48
2 3 41C
lust
er s
ize
of H
g nAg+ (
n )
Acceleration Voltage ( V )
-35--35-
Fig 3 9 The framentation pattern of HgFig 3 9 The framentation pattern of HgnnAgAg++ ( ( nn = 50 - 74 ) modified in contour map = 50 - 74 ) modified in contour map
1980 2000 2020 2040 2060 2080 2100 2120 2140 2160 2180
50
52
54
56
58
60
62
64
66
68
70
72
744321
Acceleration Votage ( V )
Clu
ster
siz
e of
Hg nA
g+ ( n
)
-36--36-
Fig 3 10 The framentation pattern of HgFig 3 10 The framentation pattern of HgnnAgAg++ ( ( nn = 75 - 100 ) modified in contour map = 75 - 100 ) modified in contour map
1980 2000 2020 2040 2060 2080 2100 2120 2140 2160 2180
76
78
80
82
84
86
88
90
92
94
96
98
4321
Acceleration Voltage ( V )
Clu
ste
size
of H
g nAg+ (
n )
-37--37-
changed from Hg to Hgchanged from Hg to Hg22 emission and furthermore the Hg emission and furthermore the Hg33 emission as the cluster size increased emission as the cluster size increased
( Fig 3 11 ) As mentioned above the Hg( Fig 3 11 ) As mentioned above the Hgnn emission and successive emission and successive n n mercury atoms emissionsmercury atoms emissions
were basically indistinguishable however the Hgwere basically indistinguishable however the Hg22 and Hg and Hg33 emission were found out to be mainly emission were found out to be mainly
two or three successive Hg emission by paying attention to appearance position in counter map fortwo or three successive Hg emission by paying attention to appearance position in counter map for
both cases It would be interpreted in following textboth cases It would be interpreted in following text
At the large cluster size region HgAt the large cluster size region Hgnn+1+1AgAg++ rarrrarr HgHgnnAgAg++ + Hg ( region4 ) and Hg + Hg ( region4 ) and Hgnn+3+3AgAg++ rarrrarr
HgHgnn+2+2AgAg++ + Hg ( region2 ) were almost superposed In the same way Hg + Hg ( region2 ) were almost superposed In the same way Hgnn+2+2AgAg++ rarrrarr HgHgnnAgAg++ + Hg + Hg22 ( (
region4 ) and Hgregion4 ) and Hgnn+6+6AgAg++ rarrrarr HgHgnn+4+4AgAg++ + Hg + Hg22 ( region2 ) were also superposed ( region2 ) were also superposed
The appearance positions of fragmentation channel HgThe appearance positions of fragmentation channel Hgnn+1+1AgAg++ rarrrarr HgHgnnAgAg++ + Hg occurred at + Hg occurred at
region5 in the contour map was slant line connecting between non-fragmented peaks Hgregion5 in the contour map was slant line connecting between non-fragmented peaks Hgnn+1+1AgAg++ and and
fragmentation peaks of channel Hgfragmentation peaks of channel Hgnn+1+1AgAg++ rarrrarr HgHgnnAgAg++ + Hg + Hg ( region4 ) which was appeared just( region4 ) which was appeared just
like the lines between non-fragmented Hglike the lines between non-fragmented HgnnAgAg++ peak and fragmentation peak of channel Hg peak and fragmentation peak of channel Hgnn+3+3AgAg++
rarrrarr Hg Hgnn+2+2AgAg++ + Hg + Hg ( region2 ) These slant lines between non-fragmented peaks and Hg emission( region2 ) These slant lines between non-fragmented peaks and Hg emission
peaks were appeared in Fig 3 7 at the size region peaks were appeared in Fig 3 7 at the size region nn = 25 - 40 and gradually disappeared as the main = 25 - 40 and gradually disappeared as the main
Fig 3 11 The size dependence of the observed main fragmentation channelsFig 3 11 The size dependence of the observed main fragmentation channels
Cluster size1 50
One Hg atom emission
Two Hg atoms emission
Three Hg atoms emission
100
-38--38-
Fig 3 12 Differnce of appearence positions between (a) HgFig 3 12 Differnce of appearence positions between (a) Hgn+2n+2AgAg++ rarrrarr Hg HgnnAgAg++ + Hg + Hg22 ( region5 ) ( region5 )
and (b) successive fragmentaions of Hgand (b) successive fragmentaions of Hgn+2n+2AgAg++ rarrrarr Hg Hgnn+1+1AgAg++ + Hg ( region2 ) and Hg + Hg ( region2 ) and Hgnn+1+1AgAg++ rarrrarr
HgHgnnAgAg++ + Hg ( region5 ) + Hg ( region5 ) MMnn denotes the mass of Hg denotes the mass of HgnnAgAg++
n
n+1
n+2
n+3
n+4
Hgn+2Ag HgnAg + Hg2 rarr+ +
2000 2000Mn+1Mn
n
n+1
n+2
n+3
n+4
Hgn+2Ag Hgn+1Ag + Hg (region2) rarr+ +
Hgn+1Ag HgnAg + Hg (region5) rarr+ +
2000 2000Mn+1Mn 2000Mn+2Mn
(a)
(b)
( region5 )
2000Mn+2Mn
-39--39-
fragmentation channel proceeded to Hgfragmentation channel proceeded to Hg22 emission emission
There was difference between appearance positions in contour map of dimer emissionThere was difference between appearance positions in contour map of dimer emission
HgHgn+2n+2AgAg++ rarrrarr Hg HgnnAgAg++ + Hg + Hg22 ( region5 ) ( Fig 3 12 (a) ) and successive fragmentations of Hg ( region5 ) ( Fig 3 12 (a) ) and successive fragmentations of Hgn+2n+2AgAg++
rarrrarr Hg Hgnn+1+1AgAg++ + Hg ( region2 ) and Hg + Hg ( region2 ) and Hgnn+1+1AgAg++ rarrrarr Hg HgnnAgAg++ + Hg ( region5 ) ( Fig312(b) ) The + Hg ( region5 ) ( Fig312(b) ) The
position corresponding with Hgposition corresponding with Hg22 emission was seen at the lines between non-fragmented Hg emission was seen at the lines between non-fragmented Hgn+2n+2AgAg++
peaks and fragmentation peaks Hgpeaks and fragmentation peaks Hgnn+6+6AgAg++ rarrrarr Hg Hgnn+4+4AgAg++ + Hg + Hg22 ( region2 ) On the other hand posi-( region2 ) On the other hand posi-
tion for successive Hg emissions were appeared as the slant lines between Hgtion for successive Hg emissions were appeared as the slant lines between Hgnn+4+4AgAg++ rarrrarr Hg Hgnn+3+3AgAg++
+ Hg+ Hg ( region2 ) and Hg( region2 ) and Hgnn+6+6AgAg++ rarrrarr Hg Hgnn+4+4AgAg++ + Hg + Hg22 ( region2 )( region2 )
The slant lines between Hg and HgThe slant lines between Hg and Hg22 emission peaks were only seen at the cluster size emission peaks were only seen at the cluster size nn gt 40 gt 40
These lines were not indicating the HgThese lines were not indicating the Hg22 emission at region5 but the successive Hg atom emissions emission at region5 but the successive Hg atom emissions
at region2 and region5 The same concept for the cluster size at region2 and region5 The same concept for the cluster size nn gt 70 may applicable to Hg gt 70 may applicable to Hg33 emis emis--
sion where successive three Hg atom emission occurredsion where successive three Hg atom emission occurred
3 3 Conclusions3 3 Conclusions
The size distributions of two type of mercury-silver binary cluster ions HgThe size distributions of two type of mercury-silver binary cluster ions HgnnAgAg++ and Hg and HgnnAgAg22++
were investigated The size distribution of Hgwere investigated The size distribution of HgnnAgAg++ was quite different from Hg was quite different from HgnnMM++ ( M alkali ( M alkali
metal ) at metal ) at nn lt 30 that the magic numbers were rather interpreted in electronic shell model structure lt 30 that the magic numbers were rather interpreted in electronic shell model structure
On the other hand the charactoristic number of On the other hand the charactoristic number of nn = 18 was observed for Hg = 18 was observed for HgnnAgAg22++ The stable The stable
HgHg1818AgAg22+ + was considered to be geometrical double icosahedron structurewas considered to be geometrical double icosahedron structure
The fragmentation patterns of HgThe fragmentation patterns of HgnnAgAg++ was also investigated There were many fragmenta- was also investigated There were many fragmenta-
tion channels for small cluster ions At the cluster size tion channels for small cluster ions At the cluster size nn is larger than 20 the one atom evaporation is larger than 20 the one atom evaporation
was the dominate channelswas the dominate channels
-40--40-
ReferencesReferences
[31] I Katakuse T Ichihara H Ito T Sakurai and T Matsuo [31] I Katakuse T Ichihara H Ito T Sakurai and T Matsuo Surface Review and LettersSurface Review and Letters 3 (1)3 (1)
(1996) 551(1996) 551
[32] H Ito T Sakurai T matsuo T Ichihara and I Katakuse [32] H Ito T Sakurai T matsuo T Ichihara and I Katakuse Phys Rev BPhys Rev B 48 (7)48 (7) (1993) 4741 (1993) 4741
[33] IUPAC [33] IUPAC Pure Appl ChemPure Appl Chem 6363 (1991) 991 (1991) 991
[34] A H Wapstra G Audi [34] A H Wapstra G Audi Nucl PhysNucl Phys A432A432 (1985) 1 (1985) 1
[35] H Nishioka K Hansen and B R Mottelson [35] H Nishioka K Hansen and B R Mottelson Phys Rev BPhys Rev B 4242 (1990) 9377 (1990) 9377
-41--41-
4 Competition of fission and evaporation pro-4 Competition of fission and evaporation pro-cesses of multiply charged mercury cluster ionscesses of multiply charged mercury cluster ions
4 1 Introduction4 1 Introduction
The natures of multiply charged cluster ion are critically different from singly charged onesThe natures of multiply charged cluster ion are critically different from singly charged ones
because the coulomb repulsive force effects on their stabilities Roughly speaking when the clusterbecause the coulomb repulsive force effects on their stabilities Roughly speaking when the cluster
size is small enough the coulomb repulsive force is comparable to binding force of the cluster Insize is small enough the coulomb repulsive force is comparable to binding force of the cluster In
the case the cluster ion which has enough internal energy cause the fragmentation into two chargedthe case the cluster ion which has enough internal energy cause the fragmentation into two charged
fragments ie fission processfragments ie fission process
Experimental study about the multiple charged cluster ions was first reported for differentExperimental study about the multiple charged cluster ions was first reported for different
kinds of bonding metal clusters Pbkinds of bonding metal clusters Pbnn2+2+ ionic clusters (NaI) ionic clusters (NaI)nn
2+2+ and van der Waals clusters Xe and van der Waals clusters Xenn2+2+
[41] In this work doubly charged cluster ions above certain cluster size were recognized as at[41] In this work doubly charged cluster ions above certain cluster size were recognized as at
peaks half-size values of singly charged cluster ions in mass spectra These sizes were called ldquocriti-peaks half-size values of singly charged cluster ions in mass spectra These sizes were called ldquocriti-
cal size cal size nnccrdquo and were 33 for Pbrdquo and were 33 for Pbnn2+2+ 23 for (NaF) 23 for (NaF)nn
2+2+ and 53 for Xe and 53 for Xenn2+2+ respectively Authors con- respectively Authors con-
cluded that only if doubly charged cluster ions exceeded a critical size they survive from ldquoCou-cluded that only if doubly charged cluster ions exceeded a critical size they survive from ldquoCou-
lomb explosionrdquo This result about xenon cluster ions was coincident with the computer simula-lomb explosionrdquo This result about xenon cluster ions was coincident with the computer simula-
tions [42] that the lifetime of Xetions [42] that the lifetime of Xe55552+2+ ( 10 ( 10-4-4 sec ) was remarkably longer than Xe sec ) was remarkably longer than Xe5151
2+2+ ( ( 10 10-10-10 sec sec ) The) The
subsequent experimental work about critical sizes of subsequent experimental work about critical sizes of nnccz+z+ up to up to zz = 4 of van der Waals bonding = 4 of van der Waals bonding
clusters were reported The ratio of critical sizes was clusters were reported The ratio of critical sizes was nncc44++ nncc
33++ nncc22++ = 16 9 4 while the values of the = 16 9 4 while the values of the
critical sizes vary widely between different substances [43]critical sizes vary widely between different substances [43]
The metal clusters were known to have an analogues with atomic nuclei that both systemsThe metal clusters were known to have an analogues with atomic nuclei that both systems
consist of fermions moving nearly freely in a confined space The shell model of nuclear physicsconsist of fermions moving nearly freely in a confined space The shell model of nuclear physics
was successfully applied to electronic properties of metal cluster [13 4] The giant dipole reso-was successfully applied to electronic properties of metal cluster [13 4] The giant dipole reso-
-42--42-
nances in the excitation spectra of nuclei have their similarity in the plasmon resonances of metalnances in the excitation spectra of nuclei have their similarity in the plasmon resonances of metal
clusters [44] Finally the droplet model describing the fission of unstable nuclei was applied toclusters [44] Finally the droplet model describing the fission of unstable nuclei was applied to
fragmentation of highly charged metal cluster ions although the nuclei were uniformly chargedfragmentation of highly charged metal cluster ions although the nuclei were uniformly charged
droplets while metal clusters were surface charged objectsdroplets while metal clusters were surface charged objects
In the cluster cases the relative weight of repulsive and cohesive forces is expressed throughIn the cluster cases the relative weight of repulsive and cohesive forces is expressed through
the fissility parameter as well as nuclei the fissility parameter as well as nuclei XX = = EEcoulombcoulomb 2E 2Esurfacesurface The cluster ions thatThe cluster ions that fission parameterfission parameter
of of XX lt 1 are unstable to fission The fission parameter can also expressed as lt 1 are unstable to fission The fission parameter can also expressed as XX = ( = (ZZ22NN)()(ZZ22NN))critcrit
where (where (ZZ22NN))critcrit corresponding to corresponding to XX = 1 is ( = 1 is (ZZ22NN))critcrit = 16 = 16BBrrwsws33FFee22 Here Here rrwsws is the Wigner-Seitz is the Wigner-Seitz
radius radius ee is the elementary charge and is the elementary charge and FF is the surface tension The ( is the surface tension The (ZZ22NN))crit crit value of mercuryvalue of mercury
cluster ions is calculated to 06cluster ions is calculated to 06
In case of In case of XX lt 1 however the fragmentations of multiply charged cluster ions are competi- lt 1 however the fragmentations of multiply charged cluster ions are competi-
tion of evaporation ( neutral atom loss ) and fission ( split into two charged fragments ) processestion of evaporation ( neutral atom loss ) and fission ( split into two charged fragments ) processes
although physical underlying are distinct each other Generally speaking evaporation is prior toalthough physical underlying are distinct each other Generally speaking evaporation is prior to
fission at the cluster size lager than called ldquoappearance size fission at the cluster size lager than called ldquoappearance size NNaardquordquo whichwhich defined as the size evapora-defined as the size evapora-
tion and fission occurred with equal probabilitytion and fission occurred with equal probability
Direct observations of fission fragments from doubly charged alkali-metal [45-7] and noble-Direct observations of fission fragments from doubly charged alkali-metal [45-7] and noble-
metal [48-10] cluster ions were reported in succession before and after the 1990metal [48-10] cluster ions were reported in succession before and after the 1990
Almost all possible fission channels of doubly charged silver cluster ions made by sputteringAlmost all possible fission channels of doubly charged silver cluster ions made by sputtering
method which produced relatively high temperature cluster were observed [48] They were pre-method which produced relatively high temperature cluster were observed [48] They were pre-
ferred to emit the odd-size cluster which have even number of electrons especially Agferred to emit the odd-size cluster which have even number of electrons especially Ag33++ and Ag and Ag99
++
known as magic numberknown as magic number
The fragmentation of gold cluster ions AuThe fragmentation of gold cluster ions Aunn22++ ( ( nn = 12 - 18 ) made by LMIS ( liquid metal ion = 12 - 18 ) made by LMIS ( liquid metal ion
source ) were studied by collisions with stationary krypton gas [4910] The probabilities of fissionsource ) were studied by collisions with stationary krypton gas [4910] The probabilities of fission
channels have the odd-even alternation that the product ions having even number of electron werechannels have the odd-even alternation that the product ions having even number of electron were
-43--43-
prior especially the channel yielding singly charged trimer was dominant for all clusters Theprior especially the channel yielding singly charged trimer was dominant for all clusters The
appearance size were determined to appearance size were determined to NNaa2+2+ = 14 experimentally = 14 experimentally
The fragmentations around critical sizes of alkali metal cluster ions ( lithium sodium andThe fragmentations around critical sizes of alkali metal cluster ions ( lithium sodium and
potassium ) made by supersonic expansion method were also reported [45-7] The major fissionpotassium ) made by supersonic expansion method were also reported [45-7] The major fission
channels were emission of singly charged trimer and pentamer that have even-number of electronschannels were emission of singly charged trimer and pentamer that have even-number of electrons
Furthermore Furthermore zz-fold charged sodium and cesium cluster ions were reported up to -fold charged sodium and cesium cluster ions were reported up to zz = 7 and = 7 and zz
= 4 for potassium and rubidium [41112] The critical sizes for appearance of each charged states= 4 for potassium and rubidium [41112] The critical sizes for appearance of each charged states
in the mass spectra which were called ldquoeffective appearance sizesin the mass spectra which were called ldquoeffective appearance sizes N Naaeffeff rdquo were determined What rdquo were determined What
these experiments showed were appearance sizes lied in narrow interval of these experiments showed were appearance sizes lied in narrow interval of XX-values ( 025 lt -values ( 025 lt XX lt lt
035 ) irrespective of charge state 035 ) irrespective of charge state zz and substances It is simply considered the appearance sizes lie and substances It is simply considered the appearance sizes lie
so close to a line of constant so close to a line of constant ZZ22NN because the fission barrier heights will scale with the surface because the fission barrier heights will scale with the surface
energy ie energy ie NN2323 whereas the activation energy for the competing evaporation process is essentially whereas the activation energy for the competing evaporation process is essentially
independent of independent of NN
There were several reports about multiply charged mercury cluster ions The doubly chargedThere were several reports about multiply charged mercury cluster ions The doubly charged
mercury cluster ions made by both adiabatic expansion [413-15] and sputtering methods [416]mercury cluster ions made by both adiabatic expansion [413-15] and sputtering methods [416]
were reported The observed critical sizes of Hgwere reported The observed critical sizes of Hgnn2+2+ were were nncc
2+2+ = 5 for former and = 5 for former and nncc2+2+ = 2 for latter = 2 for latter
The triply charged mercury cluster ions HgThe triply charged mercury cluster ions Hgnn3+3+ made by adiabatic expansion method was only made by adiabatic expansion method was only
reported and its critical size was reported and its critical size was nncc3+3+ = 46 [415] = 46 [415]
As mentioned in chapter 1 metal to non-metal transition of mercury cluster ions was oc-As mentioned in chapter 1 metal to non-metal transition of mercury cluster ions was oc-
curred at cluster size curred at cluster size n n ~~ 20 The characteristics of multiply charged cluster ions are very interest-20 The characteristics of multiply charged cluster ions are very interest-
ing subjects while only the critical sizes are known In this section competition of fission anding subjects while only the critical sizes are known In this section competition of fission and
evaporation processes of doubly charged mercury Hgevaporation processes of doubly charged mercury Hgnn2+2+ mercury-silver cluster ions Hg mercury-silver cluster ions HgnnAgAg2+2+ and and
triply charged mercury cluster ions Hgtriply charged mercury cluster ions Hgnn3+3+ were reported and determined the appearance size from were reported and determined the appearance size from
experimental data The fission channels were also investigated and compared with calculated experimental data The fission channels were also investigated and compared with calculated QQ
-44--44-
value ( the total energy difference before and after )value ( the total energy difference before and after )
4 2 Determination of fragmentation channels of doubly and4 2 Determination of fragmentation channels of doubly andtriply charged cluster ionstriply charged cluster ions
The fragmentations of multiply charged cluster ions can classify into evaporation and fissionThe fragmentations of multiply charged cluster ions can classify into evaporation and fission
processes In this experiment the fragmentations occurred at region2 were observed The voltageprocesses In this experiment the fragmentations occurred at region2 were observed The voltage
applied to electric sector was fixed so that the ions of 5 keVcharge could path through itapplied to electric sector was fixed so that the ions of 5 keVcharge could path through it
4 2 1 Evaporation of multiply charged cluster ions4 2 1 Evaporation of multiply charged cluster ions
The schematic diagram of evaporation process of multiply charged ions is shown in Fig41The schematic diagram of evaporation process of multiply charged ions is shown in Fig41
The acceleration voltage must fix to 5The acceleration voltage must fix to 5MM00MM11 ( ( MM00 denotes the mass of precursor ion denotes the mass of precursor ion MM11 mass of mass of
product ion ) in order to detect the product ions when the kinetic energy of precursor ion is as-product ion ) in order to detect the product ions when the kinetic energy of precursor ion is as-
M0 M1
m+
mVa ( keV )
m+
Va = 5M0M1
mVa M1M0 ( keV )
mVa M1M0 = 5m
Fig 4 1 The schematic diagram of evaporation process of Fig 4 1 The schematic diagram of evaporation process of mm-charged ion -charged ion MM00m+m+
-45--45-
sumed to be divided into products proportional to their masses The appearance acceleration volt-sumed to be divided into products proportional to their masses The appearance acceleration volt-
age is larger than 5 kV because the mass ratio is age is larger than 5 kV because the mass ratio is MM00MM11 gt 1 gt 1
The evaporation processes were investigated by acquiring the mass spectra where the accel-The evaporation processes were investigated by acquiring the mass spectra where the accel-
eration voltage was changed from 5080 to 5280 V by every 20 V step The fragment peaks wereeration voltage was changed from 5080 to 5280 V by every 20 V step The fragment peaks were
appeared at appeared at mzmz values of product ions values of product ions
4 2 2 Fission of doubly charged cluster ions4 2 2 Fission of doubly charged cluster ions
The schematic diagram of fission process of doubly charged cluster ion is shown in Fig42The schematic diagram of fission process of doubly charged cluster ion is shown in Fig42
In case of fission processes both of fragments are singly charged ion and basically they can beIn case of fission processes both of fragments are singly charged ion and basically they can be
observed However I observed heavier fission fragment observed However I observed heavier fission fragment MM11 which has the kinetic energiy of 2which has the kinetic energiy of 2VVaaMM11
MM00 ( keV ) The appearance acceleration voltage 5 ( keV ) The appearance acceleration voltage 5MM00 2 2MM11 ( kV ) will be less than 5 kV because ( kV ) will be less than 5 kV because
the mass ratiothe mass ratio M M00MM11 is between 1 and 2 The most advantageous point for observing the fissionis between 1 and 2 The most advantageous point for observing the fission
processes under 5 kV acceleration voltage is the exclusion of the effect from evaporation processesprocesses under 5 kV acceleration voltage is the exclusion of the effect from evaporation processes
mainly that of singly charged ions Unfortunately fragmentation peaks can not be observed whenmainly that of singly charged ions Unfortunately fragmentation peaks can not be observed when
the mass ratio is the mass ratio is MM11MM00 = 12 ( ie the precursor ion is decomposed to two same fission fragments= 12 ( ie the precursor ion is decomposed to two same fission fragments
) because the fragments and same size of non-fragmented ions are not distinguishable) because the fragments and same size of non-fragmented ions are not distinguishable
4 2 3 Fission of triply charged cluster ions4 2 3 Fission of triply charged cluster ions
The schematic diagram of fission process of triply charged cluster ions is shown in Fig 4 3The schematic diagram of fission process of triply charged cluster ions is shown in Fig 4 3
In this case singly and doubly charged fission fragments are yielded when the precursor ions de-In this case singly and doubly charged fission fragments are yielded when the precursor ions de-
compose into two fragments The kinetic energies of singly and doubly charged product ions arecompose into two fragments The kinetic energies of singly and doubly charged product ions are
33VVaaMM11MM00 and 3 and 3VVaaMM22MM00 ( keV ) ( ( keV ) ( MM11 denotes the mass of singly charged product ion denotes the mass of singly charged product ion MM22 mass of mass of
doubly charged product ion ) respectively Furthermore the appearance acceleration voltages aredoubly charged product ion ) respectively Furthermore the appearance acceleration voltages are
55MM0033MM11 ( kV ) and 10 ( kV ) and 10MM0033MM22 ( kV ) respctively If the mass ratio of ( kV ) respctively If the mass ratio of MM11MM00 is more than 13 the is more than 13 the
-46--46-
2+ 1+ 1+
M0 M1 M2
2Va ( keV ) 2Va M1M0 ( keV )
Va = 5M0 2M1 lt 5
gt
2Va M1M0 = 5( ∵ 1 lt M0 M1 lt 2 )
Fig 4 2 The schematic diagram of fission process of doubly charged cluster ionsFig 4 2 The schematic diagram of fission process of doubly charged cluster ions
3+ 1+ 2+
M0 M1 M2
3Va ( keV )
Va = 5M03M1 lt 5
3Va M1M0 3Va M2M0
3Va M1M0 = 5
3Va M2M0 = 10
(i) M1M0 gt 13
Va = 10M03M1 lt 5
Fig 4 3 The schematic diagram of fission process of triply charged cluster ionsFig 4 3 The schematic diagram of fission process of triply charged cluster ions
-47--47-
4 3 Results4 3 Results
4 3 1 Observation of Hg4 3 1 Observation of HgnnAgAg2+2+ survived 10 survived 10-4-4 sec sec
The mass spectrum of The mass spectrum of mzmz = 1700 - 4400 is shown in Fig 4 4 (a) As mentioned in section = 1700 - 4400 is shown in Fig 4 4 (a) As mentioned in section
3 the dominant peaks were the Hg3 the dominant peaks were the HgnnAgAg++ ( ( n n = 8 - 21 ) and the peaks of Hg= 8 - 21 ) and the peaks of Hgnn+1+1++ and Hg and HgnnAgAg22
++ ( (nn = 8 - = 8 -
20) were observed between Hg20) were observed between HgnnAgAg++ and Hg and Hgnn+1+1AgAg++
The enlarged mass spectrum of Fig 4 4 (a) within the The enlarged mass spectrum of Fig 4 4 (a) within the mzmz = 1780 - 3080 is shown in Fig 4 = 1780 - 3080 is shown in Fig 4
4 (b) which I focused on the critical size of Hg4 (b) which I focused on the critical size of HgnnAgAg2+2+ The abscissa is expressed the cluster size of The abscissa is expressed the cluster size of
HgHgnnAgAg2+2+ The ions must survive at least 10 The ions must survive at least 10-4-4 sec in order to reach detector without fragmentation sec in order to reach detector without fragmentation
considering the flight time in the mass spectrometer at acceleration voltage of 5 kV The odd-evenconsidering the flight time in the mass spectrometer at acceleration voltage of 5 kV The odd-even
alternation was appeared in intensities of peaks observed at integer values but it seems to be notalternation was appeared in intensities of peaks observed at integer values but it seems to be not
reflecting the character of Hgreflecting the character of HgnnAgAg2+2+ Unfortunately the even size peaks of Hg Unfortunately the even size peaks of HgnnAgAg2+2+ were overlapped were overlapped
singly charged fragment will be observed at acceleration voltage under 5 kV On the other hand insingly charged fragment will be observed at acceleration voltage under 5 kV On the other hand in
case of the mass ratiocase of the mass ratio M M11MM00 lt 13 ( or lt 13 ( or MM22MM00 gt 23 ) the doubly charged fragment will be observedgt 23 ) the doubly charged fragment will be observed
at acceleration voltage under 5 kV As well as the doubly charged fission when the mass ratio isat acceleration voltage under 5 kV As well as the doubly charged fission when the mass ratio is
MM11MM00 = 13 fission fragments can not distinguish from same size of non-fragmented ions Fur-= 13 fission fragments can not distinguish from same size of non-fragmented ions Fur-
thermore doubly charged fragments are indistinguishable from the singly charged one which havethermore doubly charged fragments are indistinguishable from the singly charged one which have
the half mass of doubly charged ones For example fragmentation channels Hgthe half mass of doubly charged ones For example fragmentation channels Hg46463+3+ rarrrarr Hg Hg4040
2+2+ + Hg + Hg66++
is indistinguishable from Hgis indistinguishable from Hg46463+3+ rarrrarr Hg Hg2626
2+2+ + Hg + Hg2020++
The fission processes were investigated using the acceleration voltage scan method TheThe fission processes were investigated using the acceleration voltage scan method The
scanned acceleration voltage range was under 5 kV in order to exlude the evaporation of singlyscanned acceleration voltage range was under 5 kV in order to exlude the evaporation of singly
charged ionscharged ions
-48--48-
18 19 20 21 22 23 24 25 26 27 28 29 30
0002
0004
0006
0008
0010(b)
Cluster size of HgnAg2+ ( n )
2000 2500 3000 3500 40000
2
4
6
8
10(a)
Inte
nsity
(arb
uni
ts)
mz
Fig 4 4 (a) Typical mass spectrum of Fig 4 4 (a) Typical mass spectrum of mzmz = 1700 - 4400 (b) Enlarged mass spectrum of (a) = 1700 - 4400 (b) Enlarged mass spectrum of (a)
within the within the mzmz = 1780 - 3080 where the abscissa is expressed in the cluster size of Hg = 1780 - 3080 where the abscissa is expressed in the cluster size of HgnnAgAg2+2+
-49--49-
with Hgwith Hgn2n2CrCr++ and Hg and Hgn2n2FeFe++ The chromium and iron were originated from electrode of the primary The chromium and iron were originated from electrode of the primary
ion gun There were no peaks at the position of odd size of Hgion gun There were no peaks at the position of odd size of HgnnAgAg2+2+ smaller than cluster size smaller than cluster size nn = 21 = 21
There was ambiguity about critical size whether There was ambiguity about critical size whether nncc2+2+ = 20 or 21 = 20 or 21
Existence of the doubly charged mercury cluster ions HgExistence of the doubly charged mercury cluster ions Hgnn2+2+ survived at least 10 survived at least 10-4-4 sec was not sec was not
clear because the even and odd-size of ions were overlapped with Hgclear because the even and odd-size of ions were overlapped with Hgnn22++ and Hg and Hg((nn-1)2-1)2AgAg++ respec- respec-
tively The triply charged cluster ions Hgtively The triply charged cluster ions Hgnn3+3+ and Hg and HgnnAgAg3+3+ were also not observed were also not observed
4 3 2 Evaporation processes of Hg4 3 2 Evaporation processes of HgnnAgAg2+2+
The mass spectrum at acceleration voltage 5160V is shown in Fig 4 5 (a) The peaks la-The mass spectrum at acceleration voltage 5160V is shown in Fig 4 5 (a) The peaks la-
beled with open circle beled with open circle ( ( ) ) indicated the product ions of fragmentation channels Hg indicated the product ions of fragmentation channels Hgnn+1+1AgAg++ rarrrarr
HgHgnnAgAg++ + Hg ( region1 ) They appeared at + Hg ( region1 ) They appeared at mzmz = 2006 = 2006nn + 1079 ( + 1079 ( nn = 11 - 18 ) The peaks appeared = 11 - 18 ) The peaks appeared
between these peaks labeled with solid circle ( between these peaks labeled with solid circle ( ) were corresponding to the fragmentation ) were corresponding to the fragmentation
channels Hgchannels HgnnAgAg++ rarrrarr HgHgnn-1-1AgAg++ + Hg ( region5 ) The increasing of peak intensities at + Hg ( region5 ) The increasing of peak intensities at mzmz = 2900 - = 2900 -
3500 were caused by overlapping with fragmentation channels Hg3500 were caused by overlapping with fragmentation channels HgnnAgAg++ rarrrarr HgHgnn++ + Ag and Hg + Ag and HgnnAgAg22
++
rarrrarr HgHgnnAgAg++ + Ag ( region2 ) + Ag ( region2 )
The enlarged spectrum of Fig 4 5 (a) at The enlarged spectrum of Fig 4 5 (a) at mzmz = 2560 - 3565 is shown in Fig 4 5 (b) The = 2560 - 3565 is shown in Fig 4 5 (b) The
abscissa is expressed in the cluster size of Hgabscissa is expressed in the cluster size of HgnnAgAg2+2+ The peaks labeled with open star ( The peaks labeled with open star ( ) were ) were
indicating the product ions of the evaporation processes Hgindicating the product ions of the evaporation processes Hgnn+1+1AgAg2+2+ rarrrarr Hg HgnnAgAg2+2+ + Hg ( region2 + Hg ( region2 ))
The mass spectra at acceleration voltages 5220 - 5280 V are shown in Fig 4 6 The abscissaThe mass spectra at acceleration voltages 5220 - 5280 V are shown in Fig 4 6 The abscissa
expressed the cluster size of Hgexpressed the cluster size of HgnnAgAg2+2+ which correspond to mass region of which correspond to mass region of mzmz = 1460 - 2660 The = 1460 - 2660 The
peaks indicating product ions of fragmentation channels Hgpeaks indicating product ions of fragmentation channels Hgnn+1+1AgAg2+2+ rarrrarr Hg HgnnAgAg2+2+ + Hg ( region2 ) + Hg ( region2 )
were also labeled with open star ( were also labeled with open star ( ) The observed minimum product ion was Hg ) The observed minimum product ion was Hg1919AgAg2+ 2+ so thatso that
the Hgthe Hg2020AgAg2+2+ was the smallest ions came out from acceleration region ( region1 ) and cause the was the smallest ions came out from acceleration region ( region1 ) and cause the
evaporation In this case it took about 10evaporation In this case it took about 10-6-6 sec for passing through the acceleration region sec for passing through the acceleration region
-50--50-
25 26 27 28 29 30 31 32 33 34 35000
001
002
003
004
005
006
007
008
009
010
Cluster size of HgnAg2+ ( n )
2400 2600 2800 3000 3200 3400 3600 380000
02
04
06
08
10
12
14
( b )
( a )In
tens
ity (
arb
uni
ts )
mz
Inte
nsity
( a
rb u
nits
)
Fig 4 5 (a) The mass spectrum of acceleraion voltage 5160 V (b) The enlarged mass spectrum ofFig 4 5 (a) The mass spectrum of acceleraion voltage 5160 V (b) The enlarged mass spectrum of
(a) within the (a) within the mzmz = 2560 - 3565 which the abscissa is expressed in the cluster size of Hg = 2560 - 3565 which the abscissa is expressed in the cluster size of HgnnAgAg2+2+
The peaks labeled with open star ( The peaks labeled with open star ( ) were indicating fragmentation channels Hg ) were indicating fragmentation channels Hgnn+1+1AgAg2+2+ rarrrarr
HgHgnnAgAg2+2+ + Hg + Hg
-51--51-
Fig 4 6 (a) The mass spectrum of acceleraion voltage (a) 5220 V (b) 5240 V (c) 5260 V and (d)Fig 4 6 (a) The mass spectrum of acceleraion voltage (a) 5220 V (b) 5240 V (c) 5260 V and (d)
5280 V The peaks labeled with open star ( 5280 V The peaks labeled with open star ( ) were indicating fragmentation channels Hg ) were indicating fragmentation channels Hgnn+1+1AgAg2+2+
rarrrarr Hg HgnnAgAg2+2+ + Hg The observed minimum product ion was Hg + Hg The observed minimum product ion was Hg1919AgAg2+2+
14 15 16 17 18 19 20 21 22 23 24 25 26000002004006008010
14 15 16 17 18 19 20 21 22 23 24 25 26000002004006008010
(a) 5220 V
(b) 5240 V
(c) 5260 V
(d) 5280 V
Cluster size of HgnAg2+ ( n )
14 15 16 17 18 19 20 21 22 23 24 25 26000002004006008010
minimum product ion
Inte
nsity
( ar
b u
nits
)
14 15 16 17 18 19 20 21 22 23 24 25 26000002004006008010
-52--52-
The evaporation processes of HgThe evaporation processes of Hgnn2+2+ could not observe because these peaks were overlapped could not observe because these peaks were overlapped
with fragmentation peaks of Hgwith fragmentation peaks of Hgnn++ Hg HgnnAgAg++ and Hg and HgnnAgAg22
++ occurred at region1 occurred at region1
4 3 3 Evaporation processes of triply charged Hg4 3 3 Evaporation processes of triply charged Hgnn3+3+
The mass spectrum at acceleration voltage 5100 V is shown in Fig 4 7 (a) The peaksThe mass spectrum at acceleration voltage 5100 V is shown in Fig 4 7 (a) The peaks
mainly appeared in this spectrum corresponded to fragmentation channels Hgmainly appeared in this spectrum corresponded to fragmentation channels Hgnn+1+1AgAg++ rarrrarr Hg HgnnAgAg++ + +
Hg ( region1 ) HgHg ( region1 ) Hgnn+1+1AgAg++ rarrrarr Hg HgnnAgAg++ + Hg ( region5 ) superposition of Hg + Hg ( region5 ) superposition of Hgnn+1+1++ rarrrarr Hg Hgnn
++ + Hg and + Hg and
HgHgnnAgAg22++ rarrrarr Hg Hgnn-1-1AgAg22
++ + Hg ( region1 ) which were labeled with symbols + Hg ( region1 ) which were labeled with symbols and and respec- respec-
tivelytively
Enlarged spectrum of Fig 4 7 (a) at Enlarged spectrum of Fig 4 7 (a) at mzmz = 2450 - 4000 which abscissa expressed cluster size = 2450 - 4000 which abscissa expressed cluster size
of Hgof Hgnn3+3+ is shown in Fig 4 7 (b) The peaks labeled with open stars ( is shown in Fig 4 7 (b) The peaks labeled with open stars ( ) indicating the product) indicating the product
ions of evaporation channels Hgions of evaporation channels Hgnn+1+13+3+ rarrrarr Hg Hgnn
3+3+ + Hg ( region2 ) These peaks could not distinguish + Hg ( region2 ) These peaks could not distinguish
from Hgfrom HgnnAgAg223+3+ rarrrarr Hg Hgnn-1-1AgAg22
3+3+ + Hg ( region2 ) because of insufficient mass resolving power How- + Hg ( region2 ) because of insufficient mass resolving power How-
ever the latter channels were excluded from consideration It was believed that the multiply chargedever the latter channels were excluded from consideration It was believed that the multiply charged
mercury-silver binary cluster ions were difficult to produce in this experimental conditions in viewmercury-silver binary cluster ions were difficult to produce in this experimental conditions in view
of the triply charged evaporation processes of Hgof the triply charged evaporation processes of HgnnAgAg3+3+ were not observed The evaporation chan- were not observed The evaporation chan-
nels Hgnels Hgnn+1+13+3+ rarrrarr Hg Hgnn
3+3+ + Hg ( region2 ) were well resolved from fragmentation peaks of singly + Hg ( region2 ) were well resolved from fragmentation peaks of singly
charged cluster ions for only charged cluster ions for only n n = 3= 3mm+1 (+1 ( m m integer ) integer )
The mass spectra of acceleration voltage of 5120 and 5140 V which took notice on minimumThe mass spectra of acceleration voltage of 5120 and 5140 V which took notice on minimum
product ion of evaporation channels Hgproduct ion of evaporation channels Hgnn+1+13+3+ rarrrarr Hg Hgnn
3+3+ + Hg ( region2 ) are shown in Fig4 8 These + Hg ( region2 ) are shown in Fig4 8 These
peaks were also labeled with open stars peaks were also labeled with open stars (()) The observed minimum product ion was The observed minimum product ion was n n = 46= 46
As mentioned in section 3 the fragmentation channels of successive two atoms emissionAs mentioned in section 3 the fragmentation channels of successive two atoms emission
were prior to one atom emission in cluster size over were prior to one atom emission in cluster size over nn = 40 The mass spectra at acceleration = 40 The mass spectra at acceleration
voltage 5200 and 5220 V are shown in Fig 4 9 that payed attention to product ions yielded by twovoltage 5200 and 5220 V are shown in Fig 4 9 that payed attention to product ions yielded by two
-53--53-
38 40 42 44 46 48 50 52 54 56 58000
001
002
003
004
005
Cluster size of Hgn3+ ( n )
2500 3000 3500 4000 450000
01
02
03
04
In
tens
ity (
arb
uni
ts )
mz
Fig 4 7 (a) The mass sepctrum at acceleration voltage 5100 V (b) Enlarged spectrum of (a) atFig 4 7 (a) The mass sepctrum at acceleration voltage 5100 V (b) Enlarged spectrum of (a) at
mzmz = 2450 - 4000 which absicca is expressed in cluster size of Hg = 2450 - 4000 which absicca is expressed in cluster size of Hgnn3+3+
-54--54-
Fig 4 8 The mass spectra of acceleration voltage of 5120 V (a) and 5140 V (b) EvaporationFig 4 8 The mass spectra of acceleration voltage of 5120 V (a) and 5140 V (b) Evaporation
channels Hgchannels Hgn+1n+13+3+ rarrrarr Hg Hgnn
3+3+ + Hg ( region2 ) were labeled with open stars ( + Hg ( region2 ) were labeled with open stars ( ))
38 40 42 44 46 48 50 52 54 56 580000
0005
0010
0015
0020
0025
0030
minimum product ion
Inte
nsity
( a
rb u
nits
)
Cluster size of Hgn3+ ( n )
38 40 42 44 46 48 50 52 54 56 580000
0005
0010
0015
0020
0025
0030
Inte
nsity
( a
rb u
ntis
)
-55--55-
Fig 4 9 The mass spectra of acceleration voltage of 5200 V (a) and 5220 V (b)Fig 4 9 The mass spectra of acceleration voltage of 5200 V (a) and 5220 V (b)
Succesive emission of two Hg atoms from HgSuccesive emission of two Hg atoms from Hgnn+2+23+3+ were labeled with open stars were labeled with open stars (())
43 44 45 46 47 48 49 50 51 52 53 54 55 56 57
0000
0005
0010
0015
0020
0025
0030
minimum product ions
43 44 45 46 47 48 49 50 51 52 53 54 55 56 57
0000
0005
0010
0015
0020
0025
0030
Inte
nsity
( a
rb u
nits
)
Cluster size of Hgn3+ ( n )
-56--56-
successive Hg atoms loss Hgsuccessive Hg atoms loss Hgnn+2+23+3+ rarrrarr Hg Hgnn
3+3+ + 2Hg ( region2 ) which were corresponded to the + 2Hg ( region2 ) which were corresponded to the
peaks labeled with open stars (peaks labeled with open stars ( ) These fragmentation peaks were well resolved from others in) These fragmentation peaks were well resolved from others in
case case nn = 3 = 3mm + 1 and 2 When + 1 and 2 When nn = 3 = 3mm these peaks were superposed on the peaks corresponding tothese peaks were superposed on the peaks corresponding to
the fragmentation Hgthe fragmentation Hgmm+1+1++ rarrrarr Hg Hgmm
++ + Hg ( region1 ) however the former would be larger content + Hg ( region1 ) however the former would be larger content
The minimum size of product ions was The minimum size of product ions was nn = 44 The smallest triply charged mercury cluster sur- = 44 The smallest triply charged mercury cluster sur-
vived 10vived 10-6-6 sec was concluded in Hg sec was concluded in Hg46463+3+ from the results of both one and two atoms emission cases from the results of both one and two atoms emission cases
4 3 4 Fission processes of Hg4 3 4 Fission processes of Hgnn2+2+ and Hg and HgnnAgAg2+2+
The fission processes of doubly charged mercury and mercury-silver binary cluster ions wereThe fission processes of doubly charged mercury and mercury-silver binary cluster ions were
investigated using an acceleration voltage scan method by selecting the fission fragments of Hginvestigated using an acceleration voltage scan method by selecting the fission fragments of Hgnn++ ( (
nn = 2 - 19 ) and Hg = 2 - 19 ) and HgnnAgAg++ ( ( nn = 8 - 19 ) of 5 keV kinetic energy = 8 - 19 ) of 5 keV kinetic energy
The acceleration voltage scan spectrum is shown in Fig 4 10 (a) where the selected fissionThe acceleration voltage scan spectrum is shown in Fig 4 10 (a) where the selected fission
fragment is Hgfragment is Hg33++ Two peaks appeared at acceleration voltage 3333 V and 4166 V indicating the Two peaks appeared at acceleration voltage 3333 V and 4166 V indicating the
product ions from precursor ions Hgproduct ions from precursor ions Hg442+2+ and Hg and Hg55
2+2+ respectively In addition to fission peaks the respectively In addition to fission peaks the
peak corresponding to the charge transfer process with residual gas Hgpeak corresponding to the charge transfer process with residual gas Hg332+2+ + ( gas ) + ( gas )00 rarrrarr Hg Hg33
++ + (gas) + (gas)++
( region2 ) was observed at 2500 V( region2 ) was observed at 2500 V
The charge transfer process was observed for only doubly charged dimer and trimer TheThe charge transfer process was observed for only doubly charged dimer and trimer The
second ionization potential of neutral cluster is generally noted assecond ionization potential of neutral cluster is generally noted as V VIPIP2+2+ = A + Bn = A + Bn-13-13 As the cluster As the cluster
size decreases the ionization potential increases Moreover the electron affinity of doubly chargedsize decreases the ionization potential increases Moreover the electron affinity of doubly charged
cluster ion also increases The electron affinities of dimer and trimer are considered to be highcluster ion also increases The electron affinities of dimer and trimer are considered to be high
enough to cause the charge transfer with residual gasenough to cause the charge transfer with residual gas
The acceleration voltage scan spectrum is shown in Fig 4 10 (b) where the selected fissionThe acceleration voltage scan spectrum is shown in Fig 4 10 (b) where the selected fission
fragment is Hgfragment is Hg99++ The fission peaks were assigned from the acceleration voltages The acceleration The fission peaks were assigned from the acceleration voltages The acceleration
voltage to detect the fission fragment Hgvoltage to detect the fission fragment Hg99++ from Hg from Hgnn
2+2+ ( ( nn = 13 - 17 ) and Hg = 13 - 17 ) and HgnnAgAg2+2+ ( ( nn = 16 17 ) is = 16 17 ) is
-57--57-
2500 3000 3500 4000 4500 50000000
0001
0002
0003( b ) Selected product ions Hg9
+
Hg17Ag2+
Hg142+
Hg132+
Hg16Ag2+
Hg152+ Hg16
2+ Hg172+
Precursor ions ( fission )
Inte
nsity
( ar
b u
nits
)
Acceleration Voltage ( V )
2500 3000 3500 4000 4500 50000000
0002
0004
0006
0008
0010
0012
0014
0016
0018
0020 ( a )
Hg32+( Charge exchange )
Hg42+ ( Fission )
Hg52+ ( Fission )
Selected Product ions Hg3+
Inte
nsity
( a
rb u
nits
)
Acceleration Voltage ( V )
Fig 4 10 The acceleration voltage scan spectra where selected product ions are (a) HgFig 4 10 The acceleration voltage scan spectra where selected product ions are (a) Hg33++ and (b) and (b)
HgHg99++ of 5keV kinetic energies of 5keV kinetic energies
-58--58-
given by 1385given by 1385MMprepre ( ( MMprepre denotes the mass of precorsor ions where 2006 denotes the mass of precorsor ions where 2006nn for Hg for Hgnn2+2+ and 2006 and 2006n n ++
1079 for Hg1079 for HgnnAgAg2+2+ ) )
The intensities of fission channels of HgThe intensities of fission channels of Hgnn2+2+ ( ( nn = 3 - 22 ) are shown in Table 41 The fission = 3 - 22 ) are shown in Table 41 The fission
fragments which had the mass larger than half of precursorrsquos could observed at under 5 kV accel-fragments which had the mass larger than half of precursorrsquos could observed at under 5 kV accel-
eration voltage The open triangle ( eration voltage The open triangle ( ) showed the channels which decomposing into two same ) showed the channels which decomposing into two same
fission fragments Such a channel could not be observed The cross ( fission fragments Such a channel could not be observed The cross ( timestimes ) symbols showed the ) symbols showed the
channels which were not observed ( under detection limit )channels which were not observed ( under detection limit )
Any peak was observed corresponding fission fragments of HgAny peak was observed corresponding fission fragments of Hgnn++ ( ( nn = 14 - 17 ) and Hg = 14 - 17 ) and HgnnAgAg++
( ( nn = 8 - 18 ) from Hg = 8 - 18 ) from Hgnn2+2+ or Hg or HgnnAgAg2+2+ It was found out that intensities of doubly charged mercury It was found out that intensities of doubly charged mercury
cluster ions were considerably higher than that of doubly charged mercury-silver binary clustercluster ions were considerably higher than that of doubly charged mercury-silver binary cluster
ions It was conincident with assumption that multiply charged silver complex cluster ions wereions It was conincident with assumption that multiply charged silver complex cluster ions were
less produced in this experimental conditionsless produced in this experimental conditions
The largest precursor ion caused the fission processes was HgThe largest precursor ion caused the fission processes was Hg22222+2+ The appearance sizes of The appearance sizes of
doubly charged mercury and mercury-silver binary cluster ions were both determined as doubly charged mercury and mercury-silver binary cluster ions were both determined as NNaa2+2+ = 20 = 20
by taking account the result of evaporation processby taking account the result of evaporation process
4 3 5 Fission processes of Hg4 3 5 Fission processes of Hgnn3+3+
The fission processes of triply charged mercury cluster ions were also investigated using anThe fission processes of triply charged mercury cluster ions were also investigated using an
acceleration voltage scan method by selecting the product ions Hgacceleration voltage scan method by selecting the product ions Hgnn++ ( ( nn = 15 - 45 ) of 5 keV kinetic = 15 - 45 ) of 5 keV kinetic
energy and Hgenergy and Hgnn2+2+ ( ( nn = 30 - 45 ) of 10 keV kinetic energy The acceleration voltage scan spectra are = 30 - 45 ) of 10 keV kinetic energy The acceleration voltage scan spectra are
shown in Fig 4 13 where the selected fission fragments are Hgshown in Fig 4 13 where the selected fission fragments are Hg38382+2+ Hg Hg3939
2+2+ and Hg and Hg40402+2+ As men- As men-
tioned in section 4 2 3 even-size of doubly charged fission fragments such as Hgtioned in section 4 2 3 even-size of doubly charged fission fragments such as Hg38382+2+ and Hg and Hg4040
2+2+
are indistinguishable from half size of singly charged fragments Hgare indistinguishable from half size of singly charged fragments Hg1919++ and Hg and Hg2020
++ respectively For respectively For
example the fission channel corresponding to peak observed in Fig 4 11 (a) could not assignexample the fission channel corresponding to peak observed in Fig 4 11 (a) could not assign
-59--59-
Observed product ions ( Hgn+ )
Precursor ions( Hgn
2+)
2 3 4 5 6 7 8 9 10 11 12
3 108
4 28
5 139 32
6 78 8
7 81 31 1
8 59 4 times
9 47 15 2 times
10 22 7 times times
11 15 10 2 times times
12 10 5 times times times
13 18 8 3 times times times
14 14 6 6 times times
15 7 9 8 4 times
16 9 8 5 2
17 8 7 4 2
18 5 4 2
19 5 4 1
20 3 3
21 2 3
22 2
Table 4 1 Intensities of fission channels of HgTable 4 1 Intensities of fission channels of Hgnn2+2+ ( ( nn =3 - 22 ) The symbol of open triangle ( =3 - 22 ) The symbol of open triangle ( ) )
showed the channels that could not observe because the precursor ions were decomposed into twoshowed the channels that could not observe because the precursor ions were decomposed into two
same products The symbol of cross ( same products The symbol of cross ( timestimes ) showed the channels not observed ) showed the channels not observed
-60--60-
Fig 4 11 The acceleration voltage scan spectra of which the selected cluster ions of (a) HgFig 4 11 The acceleration voltage scan spectra of which the selected cluster ions of (a) Hg38382+2+ and and
HgHg1919++ (b) Hg (b) Hg3939
2+2+ and (c) Hg and (c) Hg40402+2+ and Hg and Hg2020
++
2500 3000 3500 4000 4500 5000
1E-3
001
01
Inte
nsity
( ar
b u
nits
)
(b) Selected Product ions Hg392+
Hg463+
Hg453+
2500 3000 3500 4000 4500 5000
1E-3
001
01
Acceleraion Voltage ( V )
(c) Selected Product ions
Hg20+ and Hg40
2+
Hg473+Hg46
3+
2500 3000 3500 4000 4500 5000
1E-3
001
01
Hg453+Hg44
3+
(a) Selected Product ions
Hg19+ and Hg38
2+
-61--61-
whether Hgwhether Hg45453+3+ rarrrarr Hg Hg3838
2+2+ + Hg + Hg77++ or Hg or Hg4545
3+3+ rarrrarr Hg Hg26262+2+ + Hg + Hg1919
++ However former would be plausible However former would be plausible
since the nearly same intense peak was observed in acceleration voltage scan spectrum selectingsince the nearly same intense peak was observed in acceleration voltage scan spectrum selecting
the odd size of doubly charged fission fragment Hgthe odd size of doubly charged fission fragment Hg39392+2+ ( Fig 4 11 (b) ) which was not selected ( Fig 4 11 (b) ) which was not selected
with singly charged fission fragmentswith singly charged fission fragments
The fission processes were increased for clusters smaller than HgThe fission processes were increased for clusters smaller than Hg47473+3+ The appearance size of The appearance size of
triply charged mercury cluster ions was determined as triply charged mercury cluster ions was determined as NNaa3+3+ = 46 The prior fission channels of triply = 46 The prior fission channels of triply
charged mercury cluster ions Hgcharged mercury cluster ions Hgnn3+3+ were emission of Hg were emission of Hg66
++ and Hg and Hg77++ In contrast to doubly charged In contrast to doubly charged
cluster ions the fission channels of triply charged mercury cluster ions were asymmetriccluster ions the fission channels of triply charged mercury cluster ions were asymmetric
4 3 6 Calculation of 4 3 6 Calculation of QQ value value
A schematic diagram representing fission process is shown in Fig 4 12 where A schematic diagram representing fission process is shown in Fig 4 12 where BBff is fission is fission
barrier and barrier and QQ is the total energy difference between initial and final states The total energy is the total energy difference between initial and final states The total energy EEtottot((nznz))
of of zz-charged -charged nn-atom cluster-atom cluster X Xnnz+z+ is defined as the energy required for the process is defined as the energy required for the process
X ni+
X n-mj+ +Xm
( i - j )+Q
Bf
Fig 4 12 A schematic diagram representing fission process where Fig 4 12 A schematic diagram representing fission process where BBff is fission barrier and is fission barrier and QQ is the is the
total energy difference between before and aftertotal energy difference between before and after
-62--62-
XXnnz+z+ rarrrarr ( ( n - z n - z )) e e-- + nX + nX++
EEtottot (( n z n z )) = - = - ( ( n - z )Vn - z )VIPIP -E -Eatat(( n n ))
where where VVIPIP is the ionization potential of the atom is the ionization potential of the atom XX and and EEatat(( n z n z ) is the atomization energy which is) is the atomization energy which is
the energy for the processthe energy for the process
XXnnz+z+ rarrrarr zX zX ++ + ( + ( n - z n - z )) X X
Using the Born-Herber cycleUsing the Born-Herber cycle
XXnn rarrrarr nXnXdarrdarr darrdarr
XXnnz+z+ rarrrarr zX zX ++ + ( + ( n - z n - z )) X X
one deducedone deduced
EEatat(( n z n z )) == E Eatat(( n n )) + zV + zVIPIP - V - VIPIPz+z+ (( n n ) )
where where EEatat( ( nn ) is the atomization energy of neutral cluster ) is the atomization energy of neutral cluster XXnn and and VVIPIPz+z+ (( n n ) is the ) is the zz-ionization-ionization
potential of potential of nn-atom neutral cluster The total energy is expressed as sum of the atomization and the-atom neutral cluster The total energy is expressed as sum of the atomization and the
ionization termionization term
EEtottot (( n z n z )) = -E = -Eatat(( n n )) - nV - nVIPIP + V + VIPIPz+z+ (( n n ) )
The The QQ value for fission process shown in Fig 4 11 is value for fission process shown in Fig 4 11 is
Q Q = = EEtottot (( m j m j ) ) + E+ Etottot (( n-m i-j n-m i-j ) ) - E- Etottot (( n i n i ))
The difference between the ionization potential for the state of charge The difference between the ionization potential for the state of charge z+z+ and ( and ( z z+1 )+ was+1 )+ was
considered to be an added term considered to be an added term ee2244BB0 0 rrwswsnn1313 for for z+z+1 with respect to 1 with respect to zz The second The second VVIPIP2+2+ (( n n ) and ) and
third third VVIPIP3+3+ (( n n ) ionization potentials are expressed as ) ionization potentials are expressed as
310
22
4)(2)(
nre
nVnVws
IPIP πε+= ++
310
23
43
)(3)(nr
enVnV
ws
IPIP πε+= ++
In the case of alkali metal clusters [417] first ionization potential is theorigically given byIn the case of alkali metal clusters [417] first ionization potential is theorigically given by
-63--63-
134)(
nre
WnVws0
2
IP πεα+= infin
+
where where WWinfininfin is the work function of the bulk and is the work function of the bulk and αα is 12 or 38 according to different authors Theis 12 or 38 according to different authors The
cluster ion is considered as metal droplet in this model although it is not true for mercury clustercluster ion is considered as metal droplet in this model although it is not true for mercury cluster
case The first ionization potential and atomization energy of mercury cluster used in the calcula-case The first ionization potential and atomization energy of mercury cluster used in the calcula-
tion were experimental data reported by Haberland tion were experimental data reported by Haberland et alet al [18] which represented in two straight[18] which represented in two straight
lines by Blanc lines by Blanc et alet al [415] They were [415] They were
VVIPIP++ (( n n ) = 1653 ) = 1653 n n --1313 + 1818 ( + 1818 ( nn gt 19 ) gt 19 )
= 4112 = 4112 n n --1313 + 6397 ( + 6397 ( nn ≦≦ 19 ) 19 )
andand
EEatat(( n n ) = 083) = 083 nn - 177 - 177 nn23 23 ( ( nn gt 17 ) gt 17 )
= 0228 = 0228 nn - 0228 - 0228 nn23 23 ( ( nn ≦≦ 17 ) 17 )
The The QQ values for fragmentation processes values for fragmentation processes
HgHgnn2+2+ rarrrarr Hg Hgmm
++ + Hg + Hgn-mn-m++
are calculated from equationare calculated from equation
4
)(2
)()()()()(
)2()1()1(
31ws0
2
IP
IPIPatatat
tottottot
nre
nV
mnVmVnEmnEmE
nEmnEmEQ
πεminusminus
minus+++minusminusminus=
minusminus+=
+
++
The calculated The calculated QQ values of precursor ion of Hg values of precursor ion of Hg20202+2+ using the experimental data and the metal using the experimental data and the metal
droplet model are shown in Fig 4 13 In the case of metal droplet model fragmentation channeldroplet model are shown in Fig 4 13 In the case of metal droplet model fragmentation channel
favored asymmetric at low fission parameter as it was observed for alkali or noble metal clusterfavored asymmetric at low fission parameter as it was observed for alkali or noble metal cluster
ions around appearance size However the van der Waals bonding of small mercury clusters causeions around appearance size However the van der Waals bonding of small mercury clusters cause
the symmetric fission even at near the appearance size which matched to our experimental resultsthe symmetric fission even at near the appearance size which matched to our experimental results
The The QQ values about precursor ions of Hg values about precursor ions of Hg20202+2+ Hg Hg1515
2+2+ and Hg and Hg10102+2+ are shown in Fig 4 14 These are shown in Fig 4 14 These
-64--64-
Fig 4 13 The Fig 4 13 The QQ-values for precursor ions of Hg-values for precursor ions of Hg20202+ 2+ calculated using experimental data and metalcalculated using experimental data and metal
droplet modeldroplet model
Fig 4 14 The Fig 4 14 The QQ-values for precursor ions of Hg-values for precursor ions of Hg20202+2+ HgHg1515
2+2+ and and HgHg10102+ 2+ calculated using experimen-calculated using experimen-
tal datatal data
00 01 02 03 04 05 06 07 08 09 10-12
-10
-08
-06
-04
-02
00
Hg202+ Hgm
+ + Hg20-m+ Experimental data ( Ref [18] )
Metal dropletQ
val
ue (
eV )
Size asymmetry ( m20 )
00 01 02 03 04 05 06 07 08 09 10-26-24-22-20-18-16-14-12-10-08-06-04-020002
Hgn2+ Hgm
+ + Hgn-m+
Precursor ions n = 10 n = 15 n = 20
Q v
alue
( eV
)
Size asymmetry ( mn )
-65--65-
Fig 4 15 The Fig 4 15 The QQ-values for precursor ions of Hg-values for precursor ions of Hg45453+ 3+ calculated using experimental data and metalcalculated using experimental data and metal
droplet modeldroplet model
00 01 02 03 04 05 06 07 08 09 10-2
0
2
4
6
8
10 Experimental data ( Ref [18] ) Metal droplet
Hg453+ Hgm
2+ + Hg45-m+
Q v
alue
( eV
)
Size asymmetry ( m45 )
-66--66-
calculations supported the symmetric fission occurred for Hgcalculations supported the symmetric fission occurred for Hgnn2+2+ ( ( nn ≦≦ 20 )20 )
The The QQ values for fragmentation processes values for fragmentation processes
HgHgnn3+3+ rarrrarr Hg Hgmm
2+2+ + Hg + Hgn-mn-m++
are calculated equationare calculated equation
13
2
13
2
443
)(3
)()(2)()()(
)3()1()2(
mre
nre
nV
mnVmVmnEmEnE
nEmnEmEQ
ws0ws0IP
IPIPatatat
tottottot
πεπε+minusminus
minus++minusminusminus=
minusminus+=
+
++
The The QQ values for precursor ion of Hg values for precursor ion of Hg45453+ 3+ which calculated using experimental data and metalwhich calculated using experimental data and metal
droplet model are shown in Fig 4 15 The asymmetric fission channels were favored in both casesdroplet model are shown in Fig 4 15 The asymmetric fission channels were favored in both cases
which roughly fitted to my experimental results There was slight difference about emitted clusterwhich roughly fitted to my experimental results There was slight difference about emitted cluster
ions between experimental results and ions between experimental results and QQ values calculations The singly charged 6-mer and 7-mer values calculations The singly charged 6-mer and 7-mer
emissions were prior channels for our experimental results compared to the singly charged dimeremissions were prior channels for our experimental results compared to the singly charged dimer
or trimer emissions likely to occur according to or trimer emissions likely to occur according to QQ values calculated However these calculations values calculated However these calculations
took into account neither the stabilities of product ions nor fission barriertook into account neither the stabilities of product ions nor fission barrier
4 4 Conclusions4 4 Conclusions
The appearance sizes of doubly and triply charged mercury cluster ions were experimentallyThe appearance sizes of doubly and triply charged mercury cluster ions were experimentally
determined as determined as NNaa2+2+ = 20 and = 20 and NNaa
3+3+ = 46 respectively Moreover appearance size of doubly charged = 46 respectively Moreover appearance size of doubly charged
mercury-silver cluster ion was determined to mercury-silver cluster ion was determined to NNaa2+2+ = 20 The fission parameters at appearance sizes = 20 The fission parameters at appearance sizes
were were XX = 033 in both doubly and triply charged cases It was coincident with the results reported = 033 in both doubly and triply charged cases It was coincident with the results reported
for multiply charged alkali-metal cluster of which fission parameter for multiply charged alkali-metal cluster of which fission parameter XX at appearance size was not at appearance size was not
-67--67-
ReferenceReference
[41] K Sattler J M[41] K Sattler J Mhhhlbach O Echt P Pfau and E Recknagel hlbach O Echt P Pfau and E Recknagel Phys Rev LettPhys Rev Lett 4747 (1981) 160 (1981) 160
[42] J G Gay B J Berne [42] J G Gay B J Berne Phys Rev LettPhys Rev Lett 4949 (1982) 194 (1982) 194
[43]O Echt D Kreisle E Recknagel J J Saenz R Casero and J M Soler [43]O Echt D Kreisle E Recknagel J J Saenz R Casero and J M Soler Phys Rev APhys Rev A 3838 (7) (7)
(1988) 3236(1988) 3236
[44] W A de Heer K Selby V Kressin J Masuri M Vollmer A Ch[44] W A de Heer K Selby V Kressin J Masuri M Vollmer A Chgtgttelain and W D Knighttelain and W D Knight
Phys Rev LettPhys Rev Lett 5959 (1987) 1805 (1987) 1805
[44] K Selby M Vollmer J Masui V Kresin W A de Heer and W D Knight [44] K Selby M Vollmer J Masui V Kresin W A de Heer and W D Knight Phys Rev BPhys Rev B 4040
(1989) 5417(1989) 5417
[45] C Br[45] C BrJJchignac Ph Cahuzac F Carlier and M de Frutos chignac Ph Cahuzac F Carlier and M de Frutos Phys Rev LettPhys Rev Lett 64 64 (24) (1990)(24) (1990)
28932893
[46] C Br[46] C BrJJchignac Ph Cahuzac F Carlier J Leygnier and A Sarfati chignac Ph Cahuzac F Carlier J Leygnier and A Sarfati Phys Rev BPhys Rev B 44 44 (20)(20)
(1991) 11386(1991) 11386
[47] C Br[47] C BrJJchignac Ph Cahuzac F Carlier and M de Frutos chignac Ph Cahuzac F Carlier and M de Frutos Phys Rev BPhys Rev B 49 49 (20) (1994) 2825(20) (1994) 2825
[48] I Katakuse H Ito and T Ichihara [48] I Katakuse H Ito and T Ichihara Int J Mass Spectrom Ion ProcessesInt J Mass Spectrom Ion Processes 9797 (1990) 47 (1990) 47
[49] W A Saunders [49] W A Saunders Phys Rev LettPhys Rev Lett 6464 (1990) 3046 (1990) 3046
[410] W A Saunders [410] W A Saunders Phys Rev APhys Rev A 4646 (1992) 7028 (1992) 7028
[411] T P Martin U N[411] T P Martin U Nher H Gher H G`lich and T Lange lich and T Lange Chem Phys LettChem Phys Lett 196 196 (1992) 113(1992) 113
depend on charge state depend on charge state zz
The fission channels of doubly and triply charged cluster ions were also investigated It wasThe fission channels of doubly and triply charged cluster ions were also investigated It was
interesting that the fission channels of doubly charged mercury cluster ions were symmetric whichinteresting that the fission channels of doubly charged mercury cluster ions were symmetric which
could not interpreted by metal droplet model It may be caused by the van der Waals bonding ofcould not interpreted by metal droplet model It may be caused by the van der Waals bonding of
small cluster ions On the other hand triply charged cluster ions caused the asymmetric fragmenta-small cluster ions On the other hand triply charged cluster ions caused the asymmetric fragmenta-
tion channelstion channels
-68--68-
[412] U N[412] U Nher S Frank N Malinowski F Tast I M L Billas and T P Martin her S Frank N Malinowski F Tast I M L Billas and T P Martin Z Phys DZ Phys D 3131
(1994) 191(1994) 191
[413] C Br[413] C BrJJchingac M Broyer Ph Cahuzac G Delacretaz P Labastie and L Wchingac M Broyer Ph Cahuzac G Delacretaz P Labastie and L W`ste ste ChemChem
Phys LettPhys Lett 120 120 (1985) 559 (1985) 559
[414] H Harberland B von Issendorff J Yufeng and T Kolar [414] H Harberland B von Issendorff J Yufeng and T Kolar Phys Rev LettPhys Rev Lett 6969 (1992) 3212 (1992) 3212
[415] J Blanc M Broyer M Sence J P Wolf and L Woste [415] J Blanc M Broyer M Sence J P Wolf and L Woste J Chem PhysJ Chem Phys 102102 (2) (1995) 680 (2) (1995) 680
[416] H Ito T Sakurai T Matsuo T Ichihara and I Katakuse [416] H Ito T Sakurai T Matsuo T Ichihara and I Katakuse Z Phys DZ Phys D 40 40 (1997) 102(1997) 102
[417] C Br[417] C BrJJchignac Ph Cahuzac F Carlier and J Leygnier chignac Ph Cahuzac F Carlier and J Leygnier Phys Rev LettPhys Rev Lett 6363 (1989) 1368 (1989) 1368
As a review of multiply charged metal cluster ions fission U NAs a review of multiply charged metal cluster ions fission U Nher S Bjher S Bjrrrnhorm S Frauendorfrnhorm S Frauendorf
F Garcias and C Guet F Garcias and C Guet Physics ReportPhysics Report 285285 (1982) 247 (1982) 247
-69--69-
5 Lifetime distribution of cluster ions from a5 Lifetime distribution of cluster ions from asputtering ion sourcesputtering ion source
5 1 Introduction5 1 Introduction
The interaction of keV energy ions with a solid leads to the sputtering of the clusters A lot ofThe interaction of keV energy ions with a solid leads to the sputtering of the clusters A lot of
experiments were carried out using this phenomenon to investigate the electronic state stability ofexperiments were carried out using this phenomenon to investigate the electronic state stability of
the cluster and so on [124 51-6] The ldquomagic numberrdquo appearing in size distributions providedthe cluster and so on [124 51-6] The ldquomagic numberrdquo appearing in size distributions provided
useful informations about stabilities and structures of clustersuseful informations about stabilities and structures of clusters
In addition to the size distribution the study of fragmentation pattern occurred within 10In addition to the size distribution the study of fragmentation pattern occurred within 10-6-6 - -
1010-4-4 sec presented useful data [51 5 6] to understand the more accurate characters of clusters It sec presented useful data [51 5 6] to understand the more accurate characters of clusters It
is well known that clusters made by sputtering are relatively ldquohotrdquo and cause the spontaneousis well known that clusters made by sputtering are relatively ldquohotrdquo and cause the spontaneous
fragmentations It would be advantage for investigating the fragmentation pattern On the otherfragmentations It would be advantage for investigating the fragmentation pattern On the other
hand spontaneous decompositions make difficult to know the mechanisms of cluster productionhand spontaneous decompositions make difficult to know the mechanisms of cluster production
by sputtering because the informations about nascent clusters are lostby sputtering because the informations about nascent clusters are lost
To say nothing of the internal energy distribution of the clusters at the production time it isTo say nothing of the internal energy distribution of the clusters at the production time it is
little known about the internal energy of clusters in the experimental time range ie 10little known about the internal energy of clusters in the experimental time range ie 10-7-7 - 10 - 10-4-4 sec sec
The main duty of mass spectrometer in cluster analyses is separate the cluster ions by their massesThe main duty of mass spectrometer in cluster analyses is separate the cluster ions by their masses
or sizes although the internal energies of cluster ions are considered to widely distribute even theyor sizes although the internal energies of cluster ions are considered to widely distribute even they
are same sizeare same size
According to a Rice-Ramsperger-Kassel ( RRK ) theory [ 57 ] the dissociation rate constantAccording to a Rice-Ramsperger-Kassel ( RRK ) theory [ 57 ] the dissociation rate constant
kk a reciprocal of lifetime of the cluster ion is correlated with the relative internal energy a reciprocal of lifetime of the cluster ion is correlated with the relative internal energy EEint int EEdd
k = kk = k00 (( 11- E- Ed d EEintint ) ) s s - 1- 1
-70--70-
where where EEintint is the internal energy is the internal energy EEdd is the dissociation energy and is the dissociation energy and ss is the number of modes Using is the number of modes Using
this theory investigation of lifetime distribution of cluster ions gives the information about internalthis theory investigation of lifetime distribution of cluster ions gives the information about internal
energy distributionenergy distribution
A simulation was carried out using molecular-dynamics ( MD ) on nascent AgA simulation was carried out using molecular-dynamics ( MD ) on nascent Agnn clusters [58] clusters [58]
The nascent AgThe nascent Agnn clusters sputtered by keV Ar clusters sputtered by keV Ar++ ions had an average internal energy about 1 eV per ions had an average internal energy about 1 eV per
constituent atom and branching or chain decay occurred in the time range of 10constituent atom and branching or chain decay occurred in the time range of 10-11-11 sec that is quite sec that is quite
early stage compared with experimental one Determination of the internal energy distribution ofearly stage compared with experimental one Determination of the internal energy distribution of
cluster ions from a sputtering ion source was only reported for sputtered Tacluster ions from a sputtering ion source was only reported for sputtered Tann++ ( ( nn = 4 - 8 ) about the = 4 - 8 ) about the
experimental time range of 10experimental time range of 10-9-9 - 10 - 10-4-4 sec [59] The authors concluded that the average internal sec [59] The authors concluded that the average internal
energy per constituent atom depended weakly upon their cluster sizesenergy per constituent atom depended weakly upon their cluster sizes
In this chapter one of the method for obtaining the lifetime distributions using a typicalIn this chapter one of the method for obtaining the lifetime distributions using a typical
double focusing mass spectrometer is introduced The time dependences of fragmentation ratesdouble focusing mass spectrometer is introduced The time dependences of fragmentation rates
within the experimental time range of 10within the experimental time range of 10-7-7 - 10 - 10-4-4 sec were studied about fragmentation channels sec were studied about fragmentation channels
HgHgnn+1+1AgAg++ rarrrarr Hg HgnnAgAg++ + Hg ( + Hg ( nn = 8 - = 8 - 14 ) and Ag14 ) and Agnn+1+1++ rarrrarr Ag Agnn
++ + Ag ( + Ag ( nn = 12 14 ) The dissociation = 12 14 ) The dissociation
energies of mercury and silver cluster ions were reported as about 02 eV [510] and 2 eV [511]energies of mercury and silver cluster ions were reported as about 02 eV [510] and 2 eV [511]
respectively that was quite different each other The lifetime distribution of each fragmentationrespectively that was quite different each other The lifetime distribution of each fragmentation
channel was calculated using fragmentation rate experimentally obtained Furthermore its sizechannel was calculated using fragmentation rate experimentally obtained Furthermore its size
dependence was argued about mercury-silver binary cluster ionsdependence was argued about mercury-silver binary cluster ions
5 2 Experimental conditions5 2 Experimental conditions
Fragmentation processes were observed by following procedures (1) The deflection poten-Fragmentation processes were observed by following procedures (1) The deflection poten-
tial of the cylindrical electric sector and energy slits were kept constant so that the ions of 5000 tial of the cylindrical electric sector and energy slits were kept constant so that the ions of 5000 plusmnplusmn
-71--71-
5 3 Results5 3 Results
5 3 1 Dissociation rate on time5 3 1 Dissociation rate on time
As a preparation to examine the lifetime distributions the fragmentation rate as a function ofAs a preparation to examine the lifetime distributions the fragmentation rate as a function of
time time FFexpexp(( t t )) = dI = dIff dt dt ( ( I Iff denotes the fragmentation intensity ) is investigated from experimental denotes the fragmentation intensity ) is investigated from experimental
data As an example the fragmentation channel Hgdata As an example the fragmentation channel Hg1313AgAg++ rarrrarr Hg Hg1212AgAg++ + Hg is explained in the + Hg is explained in the
followingsfollowings
The appearance of fragmentation channel occurred in each region was already descrived inThe appearance of fragmentation channel occurred in each region was already descrived in
section 2 3 1 In the case of channel section 2 3 1 In the case of channel HgHg1313AgAg++ rarrrarr Hg Hg1212AgAg++ + Hg + Hg the fragmentation peaks of the fragmentation peaks of
plateaus were appeared with in acceleration volgate of plateaus were appeared with in acceleration volgate of 5 lt 5 lt VVaa lt 5lt 5MM1313 M M1212 ( kV ) where ( kV ) where MM1313 and and MM1212
denoted the mass of Hgdenoted the mass of Hg1313AgAg++ and Hg and Hg1212AgAg++ respectively respectively The value of The value of 55MM1313 M M1212 is 54 ( kV) is 54 ( kV) TheThe
mass spectra of acceleration voltage 5100 V and 5400 V are shown in Fig 5 1 (a) and (b) Fourmass spectra of acceleration voltage 5100 V and 5400 V are shown in Fig 5 1 (a) and (b) Four
peaks and one plateau labeled with region peaks and one plateau labeled with region rr ( ( rr = 1 - 5 ) in Fig 5 1 (a) and (b) corresponded to the = 1 - 5 ) in Fig 5 1 (a) and (b) corresponded to the
fragmentation channel fragmentation channel HgHg1313AgAg++ rarrrarr Hg Hg1212AgAg++ + Hg + Hg occurred at each region occurred at each region
Basically fragmentation rate was derived from peak or plateau areas ( Basically fragmentation rate was derived from peak or plateau areas ( dIdIff ))rr ( ( rr = 1 - 5 = 1 - 5
denoted the each fragmentation region ) divided by travel time of cluster ions in each region ( denoted the each fragmentation region ) divided by travel time of cluster ions in each region ( dt dt ))rr
The representing time of given region was travel time from the start point of the electrostatic lensThe representing time of given region was travel time from the start point of the electrostatic lens
system in the ion source to the center of the region The ( system in the ion source to the center of the region The ( dIdIff dt dt ) )rr values at region1-5 were values at region1-5 were
obtained by following proceduresobtained by following procedures
The peaks that indicated the fragmentation occurred in region1 appeared in mass spectra ofThe peaks that indicated the fragmentation occurred in region1 appeared in mass spectra of
20 eVcharge could pass through the sector (2) The acceleration voltage was changed from 5000 V20 eVcharge could pass through the sector (2) The acceleration voltage was changed from 5000 V
to 6000 V for every 40 V step and mass spectra were obtained by scanning the magnet current in ato 6000 V for every 40 V step and mass spectra were obtained by scanning the magnet current in a
linear mode ( B scanning ) for each acceleration voltagelinear mode ( B scanning ) for each acceleration voltage
-72--72-
2500 2600 2700 2800 2900 3000
001
01
1
10
region3 region4
region2
region5
region1
Inte
nsity
(arb
uni
ts)
mz
2450 2500 2550 2600 2650 2700 2750 2800
001
01
1
10
(b) 5400 V
(a) 5100 V
Inte
nsity
(arb
uni
ts)
mz
Fig 5 1 The mass spectra at acceleration voltage of (a) 5100 V and 5400 V The labeled lettersFig 5 1 The mass spectra at acceleration voltage of (a) 5100 V and 5400 V The labeled letters
ldquoregion ldquoregion r r (( r = r = 1-5 )rdquo indicate the fragmentaion position of the peaks and plateau about fragmenta-1-5 )rdquo indicate the fragmentaion position of the peaks and plateau about fragmenta-
tion channel Hgtion channel Hg1313AgAg++ rarrrarr Hg Hg1212AgAg++ + Hg + Hg
-73--73-
acceleration voltages 5 lt acceleration voltages 5 lt VVaa lt 5lt 5MM1313 M M1212 The area of the peak in each mass spectrum at accelera- The area of the peak in each mass spectrum at accelera-
tion voltage tion voltage VVaa ( V ) was defined as ( ( V ) was defined as ( dIdIff ))11 Va Va Assuming that the electrostatic lens system was a pair Assuming that the electrostatic lens system was a pair
of parallel plates and fixing the acceleration voltage of parallel plates and fixing the acceleration voltage VVaa the kinetic energy of product ion the kinetic energy of product ion UUpro pro ( eV( eV
) the function of ) the function of x x asas
minus
minus=Lx
MMM
1VU13
1213apro ( 0 lt ( 0 lt xx lt lt L L ))
where where MM1313 and and MM1212 are masses of Hg are masses of Hg1313AgAg++ and Hg and Hg1212AgAg++ LL is length of lens system This relation can is length of lens system This relation can
be also expressed asbe also expressed as
minus
minus=
a
13
1213
proa
VM
MM
UVLx
The kinetic energy of product ions The kinetic energy of product ions UUpropro was limited by width of energy slit to 000 was limited by width of energy slit to 000 plusmnplusmn 20 eV20 eV
charge According to kinetic energy limitation the fragmentation place at given acceleration volt-charge According to kinetic energy limitation the fragmentation place at given acceleration volt-
age was also limited The very place limitation at each acceleration voltage was related directlyage was also limited The very place limitation at each acceleration voltage was related directly
with the travel times ( with the travel times ( dt dt ))1 Va1 Va
The fragmentation peaks ( region2 4 ) and plateaus ( region3 ) were observed in three mass The fragmentation peaks ( region2 4 ) and plateaus ( region3 ) were observed in three mass
spectra acquired at acceleration voltages neighboring the value of 5spectra acquired at acceleration voltages neighboring the value of 5MM1313 MM1212 ( keV ) caused by the ( keV ) caused by the
dispersive energy of secondary ions dispersive energy of secondary ions The fragmentation intensities of region2 - 4 ( The fragmentation intensities of region2 - 4 ( dIdIff ))2 - 42 - 4 were were
defined by summing up peak or plateau areas obtained from three mass spectradefined by summing up peak or plateau areas obtained from three mass spectra The travel times of The travel times of
region region rr ( ( rr = 2 - 4 ) could obtain by calculating the time of flight to each end of region = 2 - 4 ) could obtain by calculating the time of flight to each end of region rr These were These were
calculated from potential shape of acceleration region (electric field of lens system mentionedcalculated from potential shape of acceleration region (electric field of lens system mentioned
above) acceleration voltage 5above) acceleration voltage 5MM1313 MM1212 ( keV ) and the length of region ( keV ) and the length of region rr ( ( r r = 1 - 4 )= 1 - 4 )
As well as the case of region1 the peaks corresponded to fragmentation at region5 wereAs well as the case of region1 the peaks corresponded to fragmentation at region5 were
appeared in mass spectra at acceleration voltage of 5 lt appeared in mass spectra at acceleration voltage of 5 lt VVaa lt 5lt 5MM1313 MM1212 But it was difficult to But it was difficult to
determine the correlation between the fragmentation time and the acceleration voltage In order todetermine the correlation between the fragmentation time and the acceleration voltage In order to
derive ( derive ( dIdIff ))55 peak areas which were not overlapped with other fragmentation were averaged and peak areas which were not overlapped with other fragmentation were averaged and
-74--74-
multiplied by the number of spectrum within 5 lt multiplied by the number of spectrum within 5 lt VVaa lt 5lt 5MM1313 MM1212 since the peak area of each mass since the peak area of each mass
spectrum was almost same Travel time ( spectrum was almost same Travel time ( dt dt ))55 was obtained as well as region2 - 4 was obtained as well as region2 - 4
One must take attention to the effect from other fragmentation channels because the oneOne must take attention to the effect from other fragmentation channels because the one
neutral atom loss was not only fragmentation channels for both silver and mercury silver clusterneutral atom loss was not only fragmentation channels for both silver and mercury silver cluster
ions The intensities of fragmentation occurred in region1 were the most which need to pay atten-ions The intensities of fragmentation occurred in region1 were the most which need to pay atten-
tionstions
In case of the silver cluster ions there was odd-even alternation in the fragmentation patternIn case of the silver cluster ions there was odd-even alternation in the fragmentation pattern
The neutral dimmer loss AgThe neutral dimmer loss Agnn+2+2++ rarrrarr Ag Agnn
++ + Ag + Ag22 was comparable to one atom loss for odd- was comparable to one atom loss for odd-nn while while
little was observed for even-little was observed for even-n n It leaded to the fragmentation intensities of one neutral atom loss forIt leaded to the fragmentation intensities of one neutral atom loss for
only odd-only odd-n n occurred in region1 was expected to be increased by that of dimmer loss For thisoccurred in region1 was expected to be increased by that of dimmer loss For this
reason the argument of lifetime distribution about odd-reason the argument of lifetime distribution about odd-nn was excluded from discussion was excluded from discussion
In the case of the mercury-silver cluster ions there was little size dependence about fragmen-In the case of the mercury-silver cluster ions there was little size dependence about fragmen-
tation pattern however the successive atom emission was observed in this experimental time rangetation pattern however the successive atom emission was observed in this experimental time range
The successive two emissions of an atom occurred first in region1 and second in any region HgThe successive two emissions of an atom occurred first in region1 and second in any region Hgnn+1+1AgAg++
rarrrarr Hg HgnnAgAg++ + Hg ( region1 ) + Hg ( region1 ) rarrrarr Hg Hgnn-1-1AgAg++ + Hg ( region1-5 ) was not counted in the fragmentation + Hg ( region1-5 ) was not counted in the fragmentation
intensity of Hgintensity of Hgnn+1+1AgAg++ rarrrarr Hg HgnnAgAg++ + Hg ( region1 ) and that would be reduction factor The incre- + Hg ( region1 ) and that would be reduction factor The incre-
ment factors also existed such as the fragmentation channels Hgment factors also existed such as the fragmentation channels Hgnn+2+2AgAg++ rarrrarr Hg HgnnAgAg++ + 2Hg or Hg + 2Hg or Hg22
( region1 ) which a part of them was counted in The ratio of the increment and reduction factor was( region1 ) which a part of them was counted in The ratio of the increment and reduction factor was
unknown however the effect to the fragmentation intensity of one atom loss at region1 was thoughtunknown however the effect to the fragmentation intensity of one atom loss at region1 was thought
to be negligible as long as the dissociation rate on time was argued in logarithmic scale since theto be negligible as long as the dissociation rate on time was argued in logarithmic scale since the
two atoms losses at region2 were about a few dozens of percents of one atom loss at same regiontwo atoms losses at region2 were about a few dozens of percents of one atom loss at same region
The fragmentation rates on time of the channels HgThe fragmentation rates on time of the channels Hg1313AgAg++ rarrrarr Hg Hg1212AgAg++ + Hg and Ag + Hg and Ag1313++ rarrrarr
AgAg1212++ + Ag are shown in Fig 5 2 Both fragmentation rate and time are represented in logarithmic + Ag are shown in Fig 5 2 Both fragmentation rate and time are represented in logarithmic
scalesscales
-75--75-
103
Time ( sec )
102
10
110
-610
-5 10-4
region 1
region 2
region 3
region 4
region 5
dIf
dt
Ag13 rarr Ag12 + Ag++
Hg13Ag rarr Hg12Ag + Hg++
Fig 5 2 The fragmentation rate on time of the channels HgFig 5 2 The fragmentation rate on time of the channels Hg1313AgAg++ rarrrarr Hg Hg1212AgAg++ + Hg and Ag + Hg and Ag1313++ rarrrarr
AgAg1212++ + Ag Both fragmentation rate and time are represented in logarithmic scales + Ag Both fragmentation rate and time are represented in logarithmic scales
-76--76-
5 3 2 Lifetime distributions5 3 2 Lifetime distributions
The fragmentation rate The fragmentation rate FFexpexp (( t t ) was approximated by power function rather than by an expo-) was approximated by power function rather than by an expo-
nential one in both silver and mercury-silver binary cluster ions cases I assumed that the experi-nential one in both silver and mercury-silver binary cluster ions cases I assumed that the experi-
mental data were simulated by the following functionmental data were simulated by the following function
FFexpexp(( t t ) = ) = b t b t -a-a
and acquired constants and acquired constants aa and and bb using the least squares fitting using the least squares fitting
The fragmentation rate on time of the channel HgThe fragmentation rate on time of the channel Hg1313AgAg++ rarrrarr Hg Hg1212AgAg++ + Hg with fitted line are + Hg with fitted line are
shown in Fig 5 3 In case of fitting calculation the point of region2 was excluded in both casesshown in Fig 5 3 In case of fitting calculation the point of region2 was excluded in both cases
because of the wide range of flight time ( 10because of the wide range of flight time ( 10-6-6 - 10 - 10-4-4 order ) In Hg order ) In HgnnAgAg++ case the points superposed case the points superposed
with the other fragmentation channel were also excluded These points are shown with open circlewith the other fragmentation channel were also excluded These points are shown with open circle
in Fig 5 3in Fig 5 3
In case of lifetime In case of lifetime JJ fragmentation rate fragmentation rate FFJ J (( t t ) must be following function) must be following function
FFJ J (( t t ) = ) = expexp ( ( - t- t JJ ) ) JJ
The non-exponential nature of The non-exponential nature of FFexpexp(( t t ) shown in experimental data indicated that cluster ions of) shown in experimental data indicated that cluster ions of
same size have different lifetime of the fragmentation reaction By introducing the distributions ofsame size have different lifetime of the fragmentation reaction By introducing the distributions of
lifetimelifetime ΦΦ ((JJ) fragmentation rate was written as a superposition of the exponential functions) fragmentation rate was written as a superposition of the exponential functions
F F (( t t ) = ) = II ΦΦ ((JJ)) exp exp ( ( - t- t JJ ) ) JJ d dJJ
Comparing with the experimental function Comparing with the experimental function FFexpexp(( t t ) the lifetime distribution ) the lifetime distribution ΦΦ ((JJ) could deter-) could deter-
mine analytically asmine analytically as
ΦΦ (( ττ ) = ) = b b JJ -a-a ΓΓ ( ( aa ) )
Limitation of lifetime should be 10Limitation of lifetime should be 10-7-7 - 10 - 10-3-3 sec by taking the time window of this experimental sec by taking the time window of this experimental
conditions into account It is well known that the cluster ions decomposed through chain or branchconditions into account It is well known that the cluster ions decomposed through chain or branch
pathways from their production time and so that the derived lifetime distribution was not reflectingpathways from their production time and so that the derived lifetime distribution was not reflecting
the character of the nascent cluster ions but of the cluster ions 10the character of the nascent cluster ions but of the cluster ions 10-7-7 sec after their production sec after their production
-77--77-
10-6 10-5 10-41
10
100
1000
region5
region4region3
region2
region1
Dis
soci
atio
n ra
te (
dI f
dt )
Time ( sec )
Fig 5 3 The fragmentation rate on time of fragmentation channel HgFig 5 3 The fragmentation rate on time of fragmentation channel Hg1313AgAg++ rarrrarr Hg Hg1212AgAg++ + Hg with + Hg with
fitted line obtained using least mean squares fittingfitted line obtained using least mean squares fitting
-78--78-
There were two parameters There were two parameters aa and and bb for each fragmentation channel In the case of mercury-for each fragmentation channel In the case of mercury-
silver binary cluster ions we could argue the size dependence of the parameter The parameter silver binary cluster ions we could argue the size dependence of the parameter The parameter bb
indicated the intercepts of indicated the intercepts of FFexpexp (( t t ) so that the dissociation rate at 1 sec after the production time) so that the dissociation rate at 1 sec after the production time
Considering that the experimental time range 10Considering that the experimental time range 10-7-7 - 10 - 10-3-3 sec it was impertinence to argue the size sec it was impertinence to argue the size
dependence of the parameter dependence of the parameter bb
The size dependence of the The size dependence of the aa value of fragmentation channels Hg value of fragmentation channels Hgnn+1+1AgAg++ rarrrarr Hg HgnnAgAg++ + Hg + Hg
( ( nn = 8 - = 8 - 14 ) is shown in Fig 5 4 The 14 ) is shown in Fig 5 4 The aa value reflected the relative abundance of long and short value reflected the relative abundance of long and short
lived cluster ions The large lived cluster ions The large aa value indicated the less of long-lived precursor ions There were the value indicated the less of long-lived precursor ions There were the
singularity in size dependence ofsingularity in size dependence of a a value at value at n n = 12 This fact indicated that Hg= 12 This fact indicated that Hg1212AgAg++ was relatively was relatively
stable It may be understood as due to icosahedron structurestable It may be understood as due to icosahedron structure
The relationship between lifetime and relative internal energyThe relationship between lifetime and relative internal energy E Eintint EEdd could be expressed could be expressed
following equation according to a simple RRK theoryfollowing equation according to a simple RRK theory
k = k = 11JJ = gv = gv (( 11- E- Ed d EEintint ) ) 33n n - 7- 7
where where gg is a degeneracy factor equal to number of surface atom which is adopted the cluster size is a degeneracy factor equal to number of surface atom which is adopted the cluster size nn
in this case and in this case and vv is a typical vibrational frequency ( ca 10 is a typical vibrational frequency ( ca 101212 Hz ) The relative internal energy Hz ) The relative internal energy
EEintint EEdd as a function of lifetime is shown in Fig 5 5 It would be 18 to 26 in this experimentalas a function of lifetime is shown in Fig 5 5 It would be 18 to 26 in this experimental
time rage 10time rage 10-7-7 - 10 - 10-3-3 sec The corresponding internal energies of silver and mercury-silver binary sec The corresponding internal energies of silver and mercury-silver binary
cluster ions were quite different although the experimental time range were samecluster ions were quite different although the experimental time range were same
In order to know the internal energy distributions for wider range the lifetime shorter orIn order to know the internal energy distributions for wider range the lifetime shorter or
longer than this experimental time range has to be investigated The experiment to know about thelonger than this experimental time range has to be investigated The experiment to know about the
lifetime of cluster ions at experimental time rage of 10lifetime of cluster ions at experimental time rage of 10-9-9 - 10 - 10-4-4 sec was performed successfully by sec was performed successfully by
devising the shape of the acceleration potential [59] The ion trap method which could hold clusterdevising the shape of the acceleration potential [59] The ion trap method which could hold cluster
ions for long time spatially may be useful for experimental time range longer than 10ions for long time spatially may be useful for experimental time range longer than 10-3-3 sec sec
-79--79-
8 9 10 11 12 13 14073
074
075
076
077
078
079
080
081
082
083
084
rarr
Val
ue o
f par
amet
er a
Fragmentation channel Hgn+1Ag+ HgnAg+ + Hg ( n )
Fig 5 4 The size dependence of the Fig 5 4 The size dependence of the aa value of fragmentation channels Hg value of fragmentation channels Hgn+1n+1AgAg++ rarrrarr Hg HgnnAgAg++ + Hg + Hg
( ( nn = 8 - 14 ) = 8 - 14 )
10-9 10-8 10-7 10-6 10-5 10-4 10-3 10-2
1
2
3
4
Ein
t E
d
Lifetime ( sec )
Fig 5 5 Relationship between lifetime and relative internal energyFig 5 5 Relationship between lifetime and relative internal energy E Eintint EEdd
-80--80-
54 Conclusions54 Conclusions
The lifetime distributions of silver and mercury-silver binary cluster ions were investigatedThe lifetime distributions of silver and mercury-silver binary cluster ions were investigated
experimentally The widely distributed lifetime originated by spread of internal energy of clusterexperimentally The widely distributed lifetime originated by spread of internal energy of cluster
ions produced by a sputtering method was indicated The size dependence of lifetime distributionions produced by a sputtering method was indicated The size dependence of lifetime distribution
allowed one to discuss about cluster stability According to it Hgallowed one to discuss about cluster stability According to it Hg1212AgAg++ which was understood by which was understood by
icosahedron structure was rather stable than adjacent cluster ions The stability of Hgicosahedron structure was rather stable than adjacent cluster ions The stability of Hg1212AgAg++ was not was not
appeared as ldquomagic numberrdquo in size distribution ( see section 3 2 1 ) The investigation of lifetimeappeared as ldquomagic numberrdquo in size distribution ( see section 3 2 1 ) The investigation of lifetime
distribution might be the other useful method to know the stabilities of cluster ionsdistribution might be the other useful method to know the stabilities of cluster ions
-81--81-
ReferencesReferences
[51] I Katakuse T Ichihara Y Fujita T Matsuo T Sakurai and H Matsuda [51] I Katakuse T Ichihara Y Fujita T Matsuo T Sakurai and H Matsuda Int J Mass spectromInt J Mass spectrom
Ion ProcessesIon Processes 6767 (1985) 229 (1985) 229
[52] I Katakuse T Ichihara Y Fujita T Matsuo T Sakurai and H Matsuda [52] I Katakuse T Ichihara Y Fujita T Matsuo T Sakurai and H Matsuda Int J Mass spectromInt J Mass spectrom
Ion ProcessesIon Processes 6969 (1986) 109 (1986) 109
[53] H Ito T Sakurai T Matsuo T Ichihara and I Katakuse [53] H Ito T Sakurai T Matsuo T Ichihara and I Katakuse Phys Rev BPhys Rev B 4848 (1993) 4741 (1993) 4741
[54] H Ito T Sakurai T Matsuo T Ichihara and I Katakuse [54] H Ito T Sakurai T Matsuo T Ichihara and I Katakuse J Mass Spectrom Soc Jpn J Mass Spectrom Soc Jpn (( 質量質量
分析分析 ) ) 44 44 (1995) 29(1995) 29
[55] I Katakuse H Nakabushi T Ichihara T Sakurai T Matsuo and H Matsuda [55] I Katakuse H Nakabushi T Ichihara T Sakurai T Matsuo and H Matsuda Int J MassInt J Mass
spectrom Ion Processesspectrom Ion Processes 6262 (1984) 17 (1984) 17
[56] H Ito T Matsuo TSatoh T Ichihara and I Katakuse [56] H Ito T Matsuo TSatoh T Ichihara and I Katakuse J mass spectromJ mass spectrom 3535 168 (2000) 168 (2000)
[57] P J Robinson and K A Holbrook [57] P J Robinson and K A Holbrook Unimolecular ReactionsUnimolecular Reactions ( Wiley Lomdon 1972 ) ( Wiley Lomdon 1972 )
[58] A Wucher B J Garrison [58] A Wucher B J Garrison Phys Rev BPhys Rev B 4646 (1992) 4885 (1992) 4885
[59] N Kh Dzhemilev A M Goldenberg I V Veriovkin S V Verkhoturov [59] N Kh Dzhemilev A M Goldenberg I V Veriovkin S V Verkhoturov Nucl Instr andNucl Instr and
Meth BMeth B 2121 (1996) 245 (1996) 245
[510] H Haberland H Kornmeier HLangosch M Oschwald G Tanner [510] H Haberland H Kornmeier HLangosch M Oschwald G Tanner J Chem Soc FaradayJ Chem Soc Faraday
transtrans 86(13)86(13) (1990) 2473 (1990) 2473
[511] U Hild G Dietrich S Kr[511] U Hild G Dietrich S Krhhckeberg M Lindinger K Lckeberg M Lindinger K Lhhtzenkirchen L Shweikhard Ctzenkirchen L Shweikhard C
Walther and J Ziegler Walther and J Ziegler Phys Rev A Phys Rev A 5757 (1998) 2786 (1998) 2786
AcknowledgmentsAcknowledgments
I would like to express my sincere appreciation to Professor Itsuo Katakuse under whoseI would like to express my sincere appreciation to Professor Itsuo Katakuse under whose
guidance the work was conducted and completed I also express my gratitude to Associate profes-guidance the work was conducted and completed I also express my gratitude to Associate profes-
sor Morio Ishihara for many useful suggestion and advice I express my heartfelt thanks to Assis-sor Morio Ishihara for many useful suggestion and advice I express my heartfelt thanks to Assis-
tant Hiroyuki Ito for instructing many experimental ideas and techniques during a course of studytant Hiroyuki Ito for instructing many experimental ideas and techniques during a course of study
I express my warm appreciation to Assistant Michisato Toyoda for enlightening discussion aboutI express my warm appreciation to Assistant Michisato Toyoda for enlightening discussion about
mass spectrometrymass spectrometry
I greatly acknowledge to Mr Toshio Ichihara for technical supports I also express my thanksI greatly acknowledge to Mr Toshio Ichihara for technical supports I also express my thanks
to Mr Hiroki Sakae of CREST for helpful discussion and adviceto Mr Hiroki Sakae of CREST for helpful discussion and advice
I appreciate to colleagues Mr K Kumondai Mr D Okumura Mr Y Manabe Mr K SasakiI appreciate to colleagues Mr K Kumondai Mr D Okumura Mr Y Manabe Mr K Sasaki
Mr K Nishiguchi Mr T Oda Miss M Kiyotoshi Mr T Fujimoto Mr A Miwatari and Mr SMr K Nishiguchi Mr T Oda Miss M Kiyotoshi Mr T Fujimoto Mr A Miwatari and Mr S
Moriyama Especially I am indebted to Mr K Sasaki who helped my work by acquiring andMoriyama Especially I am indebted to Mr K Sasaki who helped my work by acquiring and
analyzing the experimental dataanalyzing the experimental data
Finally I am deeply grateful to my parents and wife for their daily supportsFinally I am deeply grateful to my parents and wife for their daily supports