Embed Size (px)
Citation preview

CEDA Information Paper
ENVIRONMENTAL MONITORING PROCEDURES
April 2015

2 | © CEDA 2015
Contents1. Preamble2. Environmental monitoring rationale3. Environmental monitoring3.1 Baseline monitoring3.2 Surveillance monitoring3.3 Compliance monitoring4. Environmental monitoring case studies4.1 Schelde, Belgium/the Netherlands4.2 Hudson River Superfund Site, New York, USA4.3 London Gateway Port, UK4.4 East English Channel, marine aggregate
dredging4.5 Fehmarnbelt, Denmark-Germany5. Conclusion and recommendationsReferencesAbbreviationsAcknowledgements
CEDA Information Paper:
Environmental Monitoring ProceduresApril 2015
Copyright noticeThe contents of this paper are © Central Dredging Association,
CEDA. Permission is given to reproduce this document in whole
or in part provided that the copyright of CEDA and the source
are acknowledged. All rights reserved.
CitationCEDA (2015) Environmental Monitoring Procedures. Information
paper. [Online] Available from: http://www.dredging.org/media/
ceda/org/documents/resources/cedaonline/2015-02-ceda_infor-
mationpaper-environmental_monitoring_procedures.pdf
Central Dredging Association – CEDARadex Innovation CentreRotterdamseweg 183c2629 HD DelftThe NetherlandsT +31 (0)15 268 2575E [email protected]
A CEDA INFORMATION PAPER
April 2015 | 3
ENVIRONMENTAL MONITORING PROCEDURESThe Central Dredging Association is committed to environmentally responsible
management of dredging activities and this paper – produced by the CEDA
Environment Commission – seeks to inform parties about environmental monitoring
associated with dredging.
1 PreambleThis paper describes why and how environmental monitoring is undertaken. Reference is made to different types of monitoring in relation to the different stages of a dredging project, and a series of included case studies illustrate monitoring methods and uses. The case studies contain different types of monitoring, including: baseline monitoring, surveillance monitoring and compliance mon-itoring. The examples illustrate the relevance of adapting the monitoring programmes as the understanding of the system and its response to pressures changes. Also illus-trated is how the dredging project may be adapted during the project period as a result of knowledge obtained by monitoring; see CEDA (2015) for further discussion on Adaptive Management in dredging projects.
2 Environmental monitoring rationaleLike many other activities, dredging is often a necessity for new developments in the marine environment and for maintenance of present waterways and harbours. Dredg-ing has the potential to change the quality of the envi-ronment positively and/or negatively. Monitoring allows for measuring and recording environmental parameters, at both spatial and temporal scales, to characterise the environment and to assess environmental change and potential impact (positive or negative). Based on such measurements the need for adaptation of dredging plans can be assessed; see Figure 1. Monitoring is typically undertaken to establish understanding of baseline envi-ronmental conditions and to assess the level and com-pliance of environmental change caused by dredging in relation to agreed environmental thresholds and/or quality standards. Accordingly, monitoring is implemented for one or more of the following reasons:
● to characterise and gain a good baseline under-standing of the environmental setting for a pro-posed project;
● to detect and quantify changes in the environment arising from dredging;
● to assess compliance with permit/licence/legal/con-tract requirements; and
● to calibrate and validate numerical models which are widely used to help predict the effects of dredging and are used in the design of dredging projects.

4 | © CEDA 2015
Monitoring is used to inform decision-making during the dredging period regarding the need for adapting dredging practices to achieve acceptability and avoid non-com-pliance. It does this by comparing baseline and during dredge conditions (surveillance monitoring). Surveillance monitoring provides the information necessary to assess the influence of the specific dredging activities and methods on the surrounding environment, and assess the efficacy of mitigation and compensation measures.
Figure 1: A schematic drawing showing how surveillance
monitoring can be used to provide feedback information to the
dredging design (green arrows in the figure) – this is a form of
Adaptive Management.
Collection of data prior to dredging works is crucial to first establish understanding of the aquatic system and sec-ondly to set the baseline for environmental management. This information is essential to design an acceptable dredging scheme and associated relevant monitoring programme. Insufficient baseline data may lead to unnec-essary and very expensive restrictions on the dredging scheme - or important aspects may be overlooked with negative consequences for the environment.
The foundation for designing moni-toring for dredging projects is iden-tification and characterisation of the sensitive resources (receptors) which exist in the area which might be affected by the dredging. In the early stages consideration should be given to: the locations of the receptors relative to the dredging; the changes that the dredging could induce in the environment; potential pathways between the dredging and the recep-tors; the factors (parameters) that the receptors are sensitive to and critical thresholds for the receptors. A source-pathway-receptor (S-P-R) model can be used to present the theoretical linkages (i.e. pathways) between the sources (i.e. dredging activities) and the receptors which
are identified as being of importance and may be affected by the works. Note that these can include physical, bio-logical and anthropogenic resources. The significance of environmental change is typically related to the duration and/or magnitude of the monitored activity.
Pre-dredge (baseline) monitoring and system analysis
Design dredging project to address environmental
compliance
Implement dredging activity
Monitor during dredging to measure environmental
change (Surveillance monitoring)
Licences/Permissions
If non-compliant: Adapt dredging activityIf compliant: Continue
Assess for environmental compliance
(Compliance monitoring)
Figure 2: Schematic illustration of a way in which the source-pathway-receptor model can be applied to a dredging scenario.

A CEDA INFORMATION PAPER
April 2015 | 5
Figure 2 shows schematically how an S-P-R model can be applied to environmental monitoring of dredging. In this example, the source (the dredging activity) induces an environmental change in the form of a sediment plume that has a pathway in the form of dispersion and deposition mechanisms. The receptor is identified in the form of a defined spatial area of sensitivity that may be affected. Monitoring of the receptor is undertaken to identify change at the receptor in the form of an impact, which can be assigned a quantitative or qualitative level of significance.In particular for flora and fauna, monitoring health impacts will not be noticeable immediately and secondary param-eters will steer the environmental management. In such
situations monitoring of these secondary parameters will be undertaken close to the source (the dredging) or between the source and the receptor (on the path-way) rather than at the receptor. This monitoring allows for early warning or for checking that predictions that were made (often by numerical modelling) concerning the effects of the dredging on environmental parame-ters (such as suspended sediment concentration) were correct. Monitoring can be important to inform deci-sion-making on whether to/how to modify the source (e.g. dredging method) and/or pathway (e.g. sediment plume). It should be noted that such modification can result in either an increase or a decrease in dredging (production) rate.
Baseline monitoringSurveillance monitoringCompliance monitoring
during the projectCompliance monitoring
Pre-dredging Dredging Post-dredging
3 Environmental monitoringMonitoring is undertaken during different phases of the dredging project for various reasons, as illustrated in Figure 3 and described below.
It is noted that, to date, there has been no common, worldwide terminology used to name the monitoring during different project phases. For example, Australia, the USA and the UK all use their own terminology, and since internationally operating engineering companies tend to export terminology from their home country this has resulted in a globally mixed terminology. The termi-nology used here is that which has previously been used and disseminated by CEDA and IADC, and that CEDA and IADC recommend is adopted universally.
3.1 Baseline monitoringBaseline monitoring is undertaken prior to dredging activities to define the existing or ambient environmental conditions and thereby assist with the designing and planning of the dredging. It establishes the starting point from where environmental change can be monitored. Further, the baseline monitoring supports and documents the understanding of the aquatic environment, of the physical, chemical and biological parameters (such as
water levels, currents, waves, salinity, temperature, sus-pended sediment concentration and turbidity) as well as water and sediment chemistry parameters and ecology
(such as water levels, currents, oxygen, contaminants, chlorophyll and biomass of benthic fauna). Part of the baseline monitoring is identification of and assessment of the sensitive receptors in the area. The receptors are species, resources, activities or items identified as being of importance which can be affected by the dredging operation. Examples of receptors potentially sensitive to dredging pressures may include, but not be limited to: benthic ecology; fish and epi-benthic ecology; marine mammals and turtles; birds; international and national nature conservation sites (habitats); navigation; infrastruc-ture; other marine users and archaeological heritage. The potential sensitivity of receptors is usually a reflection of the type of system that the dredging occurs within e.g. whether an environment is high or low energy in terms of its hydrodynamics and the level of industrialisation.
The analysis of the aquatic system, the mapping of the sensitive receptors and the prediction of the possible changes arising from the dredging lead to predictions of possible impacts to the sensitive receptors for given
Figure 3: Monitoring throughout a project which involves dredging.

6 | © CEDA 2015
dredging scenarios. ‘Change’ and ‘impact’ are not the same. Dredging can induce physical changes but if there is no sensitive receptor then there will not have been an impact. Potential changes to the physical environment arising from dredging include: seabed removal; sound and vibration; increased suspended solids concentra-tions (sediment plumes and re-suspension of fines); bathymetrically controlled changes to hydrodynamics (currents/waves/tides); increased sediment transport at the bed and sediment transport associated with changes to hydrodynamics. Predictions of changes to the sensi-tive receptors (impacts) are used to plan and optimise the dredging scheme and methods. Based on detailed baseline information contractors will be able to optimise their proposal considering their available equipment at best economical-environmental performance. Hence, the more uncertainties are cleared the more optimal contracts can be agreed, which is a win-win for contractors and project owners.
An important step in the early phases of a project is to assess what level of change arising from dredging will result in negative impact on sensitive receptors, and how severe that impact will be. Such changes are sometimes defined in the form of thresholds. Thresholds may be applied to a wide range of parameters (e.g. suspended sediment concentration, dissolved oxygen concentration or contaminant levels) depending on the nature of the environment, the nature of the project and the sensi-tive receptors.
Sometimes less information exists relating to sensitive receptors than the ideal, particularly where effects on ecology are concerned. In these circumstances the level of variability in the naturally occurring physical conditions at the site can be a useful guide to the setting of thresholds. If information is limited and there is therefore greater uncertainty with respect to the likely level of impact from a project, then a precautionary approach can be taken with respect to the early stages of the dredging and monitoring. This clearly needs to be taken account of in the planning and contractual arrangements for the work. The initial precautionary approach should be reviewed based on monitoring data as it is collected – this is a form of Adaptive Management, which offers a mechanism to deal with these types of uncertainties; see CEDA (2015).
Sometimes flora or fauna in the vicinity of the works which are not sensitive receptors (i.e. are not judged to be of high value) can respond to changes in the environment arising from dredging. These responses can sometimes be used to provide information about
the effects of the works and to inform how works may or may not be modified. Identifying and understanding any such indicator species is an important part of the baseline monitoring.
In order to predict impacts it is not only important to understand sensitive receptors and the environment, it is also important to understand the changes which are likely to result from the dredging and how these will vary in time and space. This is usually predicted via numerical modelling in advance of the works. Often there is an iterative process whereby the design of the works is modified in light of predicted environmental (and other) factors. Numerical modelling is a powerful and valuable technique but model predictions must be carefully checked and validated against field measurements and, if possible, against monitoring of relevant parameters during the dredging works.
3.2 Surveillance monitoringSurveillance monitoring compares baseline monitoring data to environmental measurements during dredging to determine whether environmental changes are occurring and are acceptable. Based on this it may be decided whether the dredging can continue unchanged or should be altered. Technological advances have allowed mon-itoring during the dredging process to be made on a continuous basis. Real-time observations and rapid data processing and evaluation systems can be used to identify environmental changes and, if necessary, trigger an alarm to inform decision-making about when, where and how to alter a dredging plan to control environmental changes to an acceptable level.
It is sometimes useful to try to incorporate ‘reference sites’ in the monitoring programme which are outside of a project’s impact range. This is often called ’background monitoring’. Background monitoring can allow monitoring of ambient parameters and evolution and help distinguish natural variability from project related impacts. The selec-tion of suitable reference sites can however be a chal-lenge, given the often complex near-shore environment in which dredging works are performed. Different locations often possess different physical and/or ecological char-acteristics and may, as such, experience different natural variability. It may not be possible to identify valid reference sites and caution is recommended. The correct interpre-tation of monitoring results is of significant importance and needs to be performed by qualified, experienced and knowledgeable persons.

A CEDA INFORMATION PAPER
April 2015 | 7
3.2.1 Feedback monitoring / adaptive monitoringFeedback monitoring (Europe and Asia) and adaptive monitoring (US) are terms used for the particular type of surveillance monitoring which is associated with mitiga-tion management (Europe and Asia) or Adaptive Man-agement (US) of the entire dredging project. The focus of feedback monitoring is the effective management/control of the dredging works to ensure that any negative envi-ronmental impacts remain consistent with (or less than) expectation/prediction. The parameters used for manag-ing works in this way are often fast responding as well as being linked to impact.
3.3 Compliance monitoringCompliance monitoring may be conducted during and after the dredging project to demonstrate whether dredg-ing complies with the requirements of environmental
protection mechanisms including legislation (e.g. permit conditions), contract conditions and, if relevant, sustain-ability protocols (e.g. polluter pays principle). Compliance monitoring can extend over short-term or long-term peri-ods post-dredging, depending on the time over which the environment reacts to/recovers from the changes caused by the project. It is worth noting that altered dredging methods may translate into altered monitoring needs. Care should be taken to ensure that sufficient flexibility exists within permits, contracts etc. to allow monitoring schemes to be reduced or increased if it is reliably estab-lished (and accepted by those in authority) that monitor-ing needs should be modified. Such changes are usually a substantial undertaking in terms of time and effort.
Some of the most commonly used terms in connection with monitoring in the aquatic environment in relation to dredging are listed in Table 1.
Term Short explanation
Adaptive Management A term used to refer to a management process whereby project effects are contin-uously evaluated to determine the need for modification of project execution and monitoring efforts; see CEDA (2015)
Baseline monitoring Baseline conditions are the environmental conditions prior to the start of a dredging project; that is, the existing physical, chemical, biological and human environment. Baseline monitoring is the measurements and characterisation of these initial environmental conditions. For dredging projects with long lead-in times, it may be necessary to predict the future state of the baseline when the project is to start. These predictions can be an important consideration for dynamic aspects of the environment that change naturally over time (e.g. ecological temporal trends such as seasonal variations and migrations) or change due to anthropogenic factors (e.g. climate change or change due to other nearby projects)
Compensation Measures to replace or substitute for significant adverse/negative environmental impacts associated with a project
Compliance monitoring Monitoring to demonstrate fulfilment of requirements set out in legislation/permits/licences and contract conditions; see also the main text above for a detailed description
Environmental impact (associated with dredging)
Changes to receptors resulting from a dredging project. The changes are measured against the baseline environmental conditions. Impacts may be adverse/negative or beneficial/positive, and their significance is typically defined by cross-referencing the magnitude of change with the sensitivity/value of the receptor
Table 1: Commonly used terms in connection with monitoring of dredging activities.

8 | © CEDA 2015
Term Short explanation
Mitigation Measures to avoid, reduce or remedy for significant adverse/negative environmental impacts associated with a project
Pathway The route by which a source (e.g. dredging) has the potential to affect a receptor (e.g. a sensitive habitat). Examples of pathways are routes along which sediment plumes arising from dredging move
Pressure/stressor A pressure or stressor is a physical, chemical or biological change that has the potential to cause environmental change. In dredging, the pressure results from a direct human intervention causing various physical changes (e.g. habitat loss due to sediment removal or increased turbidity, changes in wave conditions and tidal currents and sediment supply, increased sound volume), chemical changes (e.g. contaminant release [organic and inorganic substances], dissolved oxygen consumption) and biological changes (e.g. contaminant release [e.g. algal spores, bacteria], species entrainment). A pressure that induces environmental change does not necessarily result in an adverse impact
Receptor The receptors are species, resources, activities or items identified as being of importance which can be affected by the dredging operation. These can include biological resources such as fisheries or infrastructure such as water intakes for power-stations, or marine archaeology, or nearby villages or towns which might be affected by noise or light
Sediment losses (sediment spill)
The quantity of sediment released as a consequence of dredging and/or reclama-tion. Release may not just be direct (e.g. hopper overflow or reclamation effluent) but indirect (e.g. increased mobility and transport of sediment at the seabed as a consequence of dredging). Losses are sometimes defined as the material leaving the project work zone (such zones need clear definition as do the relevant time scales) and sometimes as the loss at the cutter head, at the grab, or at the overflow
Source Any part of the dredging process that potentially may lead to environmental change. For example, in dredging, there are various sources from which sediment plumes are released into the surrounding water column, such as overflows from hoppers, leakages from buckets/grabs etc. Sound and vibrations are other examples
Surveillance monitoring Monitoring which facilitates comparison of baseline data with similar data during dredging in order to detect potential change and impact; see also in Section 3.2 detailed description
TABLE 1 CONTINUED
A CEDA INFORMATION PAPER
April 2015 | 9
4 Environmental monitoring case studiesThe following case studies illustrate how environmen-tal monitoring was applied to ensure that impacts to receptors were minimised, while efficiently achieving other project goals. Through the selected case studies, good practices are identified that have been successfully employed during various situations. Although very diverse in scope, it appears that several common practices were applied in developing and implementing the monitor-ing programmes.
Each of the case studies provides a higher level of pro-cess detail based on very specific project conditions and requirements (e.g. regulatory or contractual). The studies represent a range of objectives, such as navigation channel deepening and environmental restoration, and aquatic sys-tems such as rivers, estuaries and marine environments; see Table 2 for an overview. Each case study concludes with key lessons learned that dredging practitioners should consider in developing and implementing monitoring pro-grammes for their project.
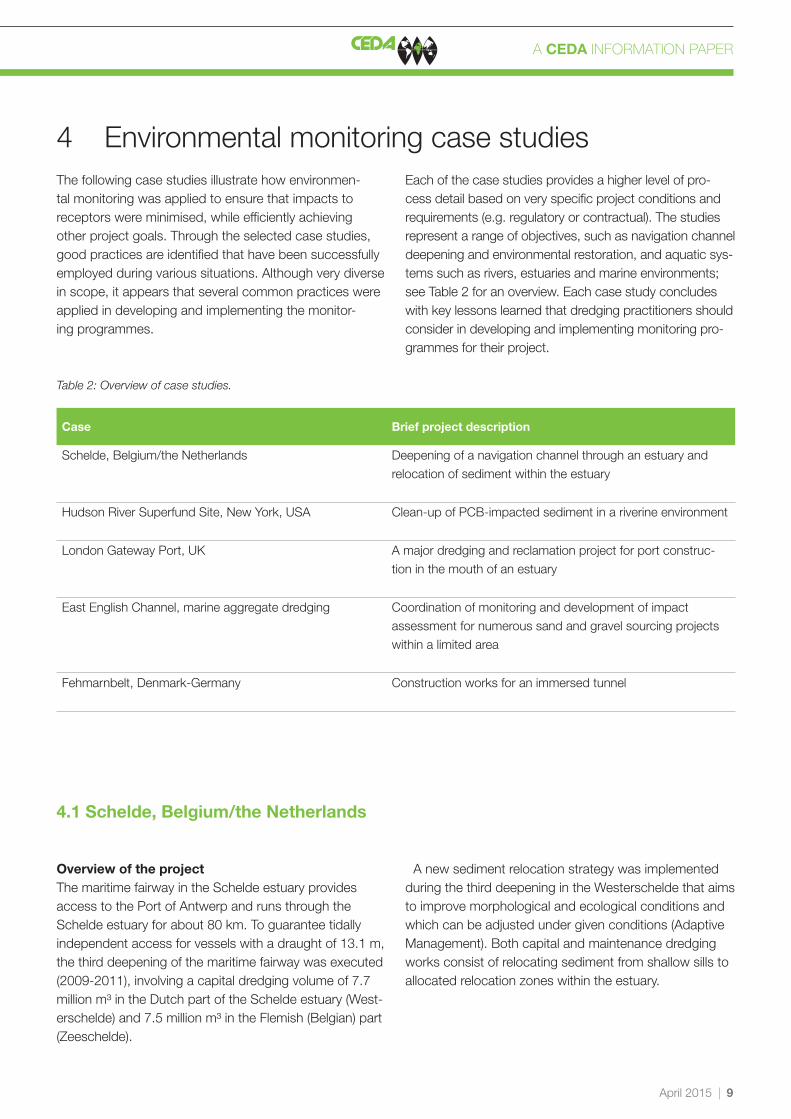
Table 2: Overview of case studies.
Case Brief project description
Schelde, Belgium/the Netherlands Deepening of a navigation channel through an estuary and relocation of sediment within the estuary
Hudson River Superfund Site, New York, USA Clean-up of PCB-impacted sediment in a riverine environment
London Gateway Port, UK A major dredging and reclamation project for port construc-tion in the mouth of an estuary
East English Channel, marine aggregate dredging Coordination of monitoring and development of impact assessment for numerous sand and gravel sourcing projects within a limited area
Fehmarnbelt, Denmark-Germany Construction works for an immersed tunnel
4.1 Schelde, Belgium/the Netherlands
Overview of the projectThe maritime fairway in the Schelde estuary provides access to the Port of Antwerp and runs through the Schelde estuary for about 80 km. To guarantee tidally independent access for vessels with a draught of 13.1 m, the third deepening of the maritime fairway was executed (2009-2011), involving a capital dredging volume of 7.7 million m³ in the Dutch part of the Schelde estuary (West-erschelde) and 7.5 million m³ in the Flemish (Belgian) part (Zeeschelde).
A new sediment relocation strategy was implemented during the third deepening in the Westerschelde that aims to improve morphological and ecological conditions and which can be adjusted under given conditions (Adaptive Management). Both capital and maintenance dredging works consist of relocating sediment from shallow sills to allocated relocation zones within the estuary.
10 | © CEDA 2015
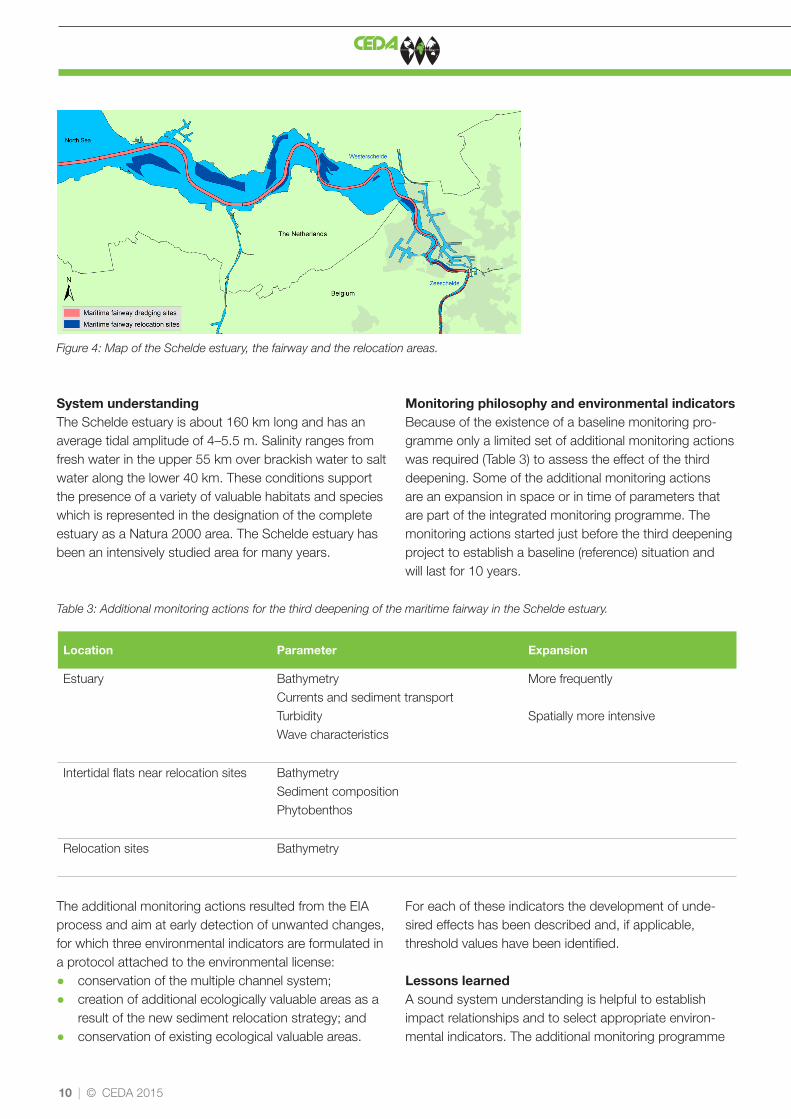
System understandingThe Schelde estuary is about 160 km long and has an average tidal amplitude of 4–5.5 m. Salinity ranges from fresh water in the upper 55 km over brackish water to salt water along the lower 40 km. These conditions support the presence of a variety of valuable habitats and species which is represented in the designation of the complete estuary as a Natura 2000 area. The Schelde estuary has been an intensively studied area for many years.
Monitoring philosophy and environmental indicatorsBecause of the existence of a baseline monitoring pro-gramme only a limited set of additional monitoring actions was required (Table 3) to assess the effect of the third deepening. Some of the additional monitoring actions are an expansion in space or in time of parameters that are part of the integrated monitoring programme. The monitoring actions started just before the third deepening project to establish a baseline (reference) situation and will last for 10 years.
Figure 4: Map of the Schelde estuary, the fairway and the relocation areas.
Location Parameter Expansion
Estuary Bathymetry Currents and sediment transport Turbidity Wave characteristics
More frequently Spatially more intensive
Intertidal flats near relocation sites Bathymetry Sediment composition Phytobenthos
Relocation sites Bathymetry
Table 3: Additional monitoring actions for the third deepening of the maritime fairway in the Schelde estuary.
The additional monitoring actions resulted from the EIA process and aim at early detection of unwanted changes, for which three environmental indicators are formulated in a protocol attached to the environmental license:
● conservation of the multiple channel system; ● creation of additional ecologically valuable areas as a
result of the new sediment relocation strategy; and ● conservation of existing ecological valuable areas.
For each of these indicators the development of unde-sired effects has been described and, if applicable, threshold values have been identified.
Lessons learnedA sound system understanding is helpful to establish impact relationships and to select appropriate environ-mental indicators. The additional monitoring programme

A CEDA INFORMATION PAPER
April 2015 | 11
needed to assess effects of a considered project is limited because of the existence of a baseline monitor-ing programme that covers the entire system. Results of the additional monitoring actions allow evaluation of the environmental indicators and help to further improve the system understanding.
4.2 Hudson River Superfund Site, New York, USA
Overview of the projectThe Hudson River Superfund Site is a sediment clean-up project being performed by the General Electric Com-pany (GE). The sediment being cleaned up is located along 65 km of the Hudson River north of Albany, New York, Figure 5. The US Environmental Protection Agency (USEPA) Record of Decision (ROD) for the Site issued in 2002 required environmental dredging targeting approx-imately 2 million m3 of PCB-impacted sediment in two phases. Phase 1 was completed in 2009 and removed approximately 220,000 m3 of sediment from 3 miles of the river; Phase 2 commenced in 2011 and will continue until the remainder of the target sediment is removed.
As part of remedy implementation, USEPA developed specific performance standards for resuspension, residu-als and productivity in an effort to meet human health and environmental protection objectives set forth in the ROD. In order to demonstrate compliance with these stand-ards during Phase 1, a robust monitoring approach was designed to allow for rapid, real-time assessment of data to evaluate conditions with respect to the various perfor-mance goals. This case study focusses on the monitoring conducted during Phase 1, follow-up evaluations of the Phase 1 monitoring programme, and resulting modifi-cations to USEPA’s resuspension performance standard and the Phase 2 monitoring plan.
Performance standards and monitoring philosophyThe monitoring programme includes several components. Extensive baseline monitoring and environmental assess-ments were performed prior to dredging to understand the distribution of PCBs within the river system and the potential impacts to receptors during and after the clean-up. Assessments were completed as part of a formal remedial investigation and feasibility study. Over 50,000 samples of sediment, surface water and fish tissue were collected and analysed prior to implemen-tation. Baseline monitoring was performed during the 4 years preceding the Phase 1 dredging work and was intended to provide an understanding of the variability (e.g. in flow rate and existing PCB transport rates) of system conditions.
USEPA specified a detailed monitoring regime with extensive performance standards for Phase 1. The resuspension performance standard was established to:
● ensure that water column PCB concentrations remained below the federal drinking water maximum contaminant level (MCL) of 500 ng/l;
● minimise release of PCBs during dredging; and ● minimise transport of PCBs downstream.
For Phase 1, 3 tiers of action levels that triggered engineer-ing evaluations, additional monitoring and potential work stoppage were applied based on various data (i.e. TSS and dissolved PCB concentrations) collected from near-field and far-field locations and at various duration aver-ages (e.g. 6-hour discrete and 7-day running averages).
Compliance with the resuspension standard required real-time, continuous measurement, rapid turn-around laboratory analyses and near real-time automated data assessment and reporting. A suite of custom applica-tions was developed and integrated with an existing environmental health and safety information management
PHASE 1 DREDGING
Far-�eld Monitoring
Figure 5: Phase 1 monitoring locations (Note: An exaggeration
was applied to the figure which increases the river width).
12 | © CEDA 2015
system. The applications received data directly from field monitoring equipment, including continuous recording devices. Automated data integration, quality control and assessment enabled project managers to achieve full compliance with regulatory monitoring and report-ing requirements, assess project performance metrics and automatically assess data against the performance standards as it was received. While the system was developed initially to manage the vast amount of data required to demonstrate compliance with standards, it also enabled rapid data evaluation and decision making as part of an Adaptive Management framework for moni-toring and operations.Some key findings of the Phase 1 monitoring included:
● Development of a functional near-real-time data col-lection and evaluation system to facilitate rapid eval-uations of possible exceedance events and response actions was feasible.
● Phase 1 dredging occurred during a high river flow year that varied from the assumptions used to develop the initial evaluation and control levels – these measurements, analyses and observations were used to assess the ability of the dredging programme to adhere to the performance standards.
● During dredging, turbidity was not found to be a good predictor for total suspended solids (TSS) concen-trations and therefore was removed as a requirement from Phase 2 performance standards. In addition, TSS concentrations were not a reliable predictor for total PCB transport downstream of the dredging operations based on comparison to dissolved PCB concentrations in the water column.
● Allowable net PCB loads were set as fixed amounts for Phase 1; in Phase 2, this allowance was changed to incorporate river flows and the daily mass of dredged PCB removal.
Subsequent analysis of these findings led EPA to revise the Resuspension Standard for Phase 2 and incorporate an Adaptive Management process for monitoring and data evaluation throughout implementation. Further, the Phase 2 standards have been simplified and streamlined to more directly reflect the conditions that were observed during the day-to-day operations of the dredging project. One of the key changes included the reduction of multi-ple-level, control criteria to fewer, adaptable criteria based on real-time conditions of PCB mass removal rates and river flow. The new approach allows modifications to the standards and the operations from year-to-year based on the experience of the previous year and knowledge of
the upcoming year’s geographic scope and production targets. The flexible data management system easily accommodates these changes.
Lessons learnedThe monitoring programme initiated during the Phase 1 dredging was among the largest and most complex pro-grammes implemented as part of a remedial action in the USA. It was designed to meet a complex set of perfor-mance standards developed by the USEPA to evaluate short-term and long-term environmental goals and project productivity. Key lessons learned based on evaluations for the resuspension performance standard include:
● Data collection during the Phase 1 monitoring pro-gramme occurred over 227 days and included over 1,500 water chemistry samples and over 9,600 TSS samples. In addition, 21 monitoring buoys produced continuous real-time turbidity, oxygen, pH, conduc-tivity and depth data and also collected composite samples for subsequent analyses. The development of a custom Environmental Data Management System facilitated rapid response to field situations and better efficiency in evaluating and reporting project achieve-ment of performance standards. Collecting the data directly into the comprehensive database also facilitated the post-Phase 1 evaluation of the data in a timely manner.
● The monitoring programme was useful in verifying model predictions regarding impacts of dredging on PCB levels in the river.
● The two-phased implementation of the Remedial Action allowed USEPA and GE to re-evaluate the initial performance/compliance framework and assess actual impacts of the river during implementation in comparison to baseline conditions. Modifications for the Phase 2 implementation plan:
� resulted in a more streamlined monitoring pro-gramme that still met the challenges of assessing achievement of the performance standards;
� included flexible criteria, in lieu of strict numerical standards, that considered real-time physical and project conditions (i.e. river flow and rate of con-taminant removal);
� included provisions for operational adjustments rather than hard decision points, which have reduced the potential for stoppages in dredging operations; and
� included an annual review process to facilitate continued data analysis and improvements to the Adaptive Management approach.

A CEDA INFORMATION PAPER
April 2015 | 13
● Lessons from the Phase 1 project monitoring evalu-ation highlighted the importance of all parties (project owners and regulators) working together to develop performance standards that are both considerate of meeting short-term and long-term environmental goals, as well as productivity goals.
4.3 London Gateway Port, UK
Overview of projectLondon Gateway Port (LGP) in the Thames estuary is the UK’s first 21st century major deep-sea container port. Construction of the port commenced in March 2010 and involved dredging of 30.5 million m3 of sediment and use of this for the building of a reclamation.
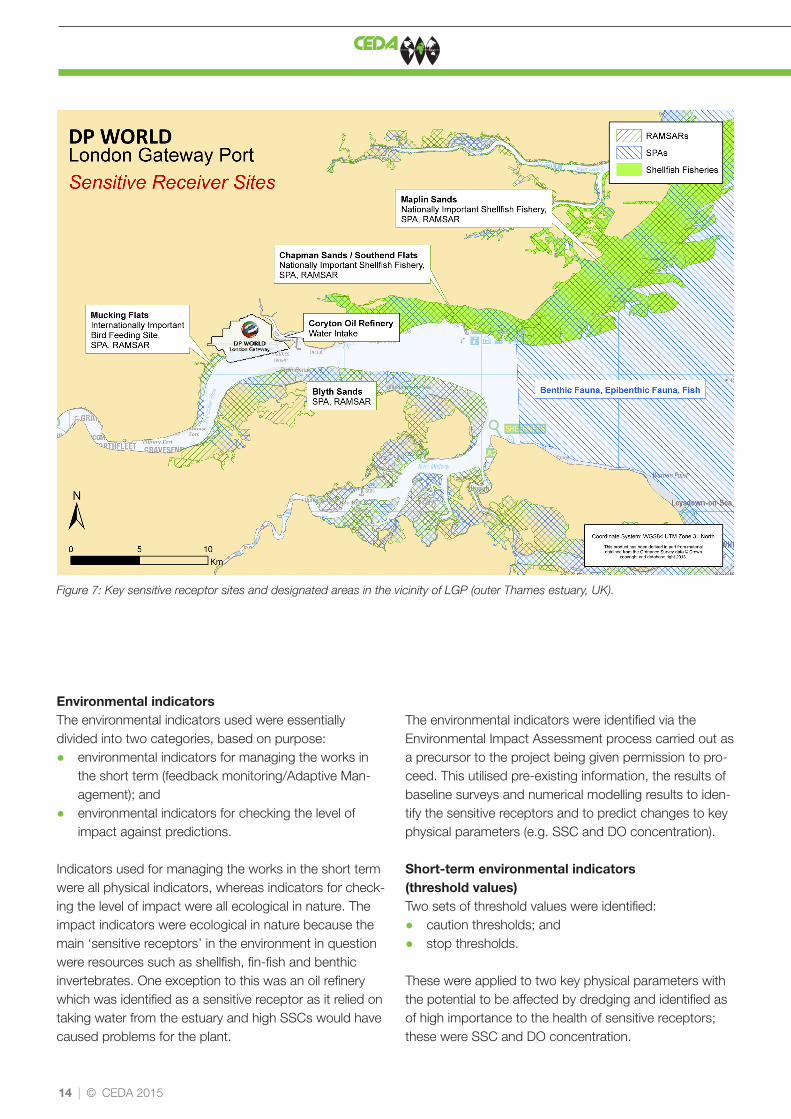
System understandingSurrounding the port and the navigation channel are sites of both national and international importance from an environmental, commercial and infrastructure perspective (Figure 7). These sites have been referred to as ‘sensi-tive receptors’. Examples include: a site of international importance as a habitat for birds immediately to the west of the site (Mucking Flats); a water intake for an oil refinery immediately to the east of the site (Coryton) and a nation-ally important shellfish fishery beyond Coryton (Figure 7).
Current speeds in the environment are relatively high on spring tides (up to ~1.5 m/s); this combined with the sed-imentary regime means that natural suspended sediment concentrations are also high (up to around 1,500 mg/l on spring tides, measured at 1 m above the bed of the estu-ary). Suspended sediment concentrations are to a large extent driven by tidal currents in the dredged channel and consequently clear patterns emerge when analysing both short and longer term data.
Monitoring of both physical parameters and ecology was undertaken at most sensitive receptor sites. During dredging the works were controlled using a network of monitoring buoys positioned close to the works.
Baseline monitoringIt was judged that baseline monitoring data collection was needed for:
● numerical model validation; and ● surveillance monitoring i.e. to allow change and
impact to be detected.
The data collection for numerical model validation was
a relatively small piece of work lasting for a few weeks and focussing on physical parameters such as sus-pended sediment concentration (SSC), currents and waves. Collection of baseline physical data for surveil-lance monitoring (undertaken by the Employer) lasted 12 months in order to capture seasonal variability in the key parameters measured (SSC, dissolved oxygen [DO] concentration, sediment and water chemistry and the level of the intertidal areas) and associated parameters (temperature, salinity, currents and waves). Additionally, the Contractor was required to collect similar data for at least 2 months prior to start of dredging, in order to demonstrate consistency with the Employer’s monitoring. In contrast, measurements of the health of the ecology of the areas (sensitive receptors) commenced much earlier (9 years before dredging began) but these tended to be single surveys on alternate years rather than meas-urements every 5 minutes, as was the case for some physical parameters.
Figure 6: London Gateway Port.
14 | © CEDA 2015
Environmental indicatorsThe environmental indicators used were essentially divided into two categories, based on purpose:
● environmental indicators for managing the works in the short term (feedback monitoring/Adaptive Man-agement); and
● environmental indicators for checking the level of impact against predictions.
Indicators used for managing the works in the short term were all physical indicators, whereas indicators for check-ing the level of impact were all ecological in nature. The impact indicators were ecological in nature because the main ‘sensitive receptors’ in the environment in question were resources such as shellfish, fin-fish and benthic invertebrates. One exception to this was an oil refinery which was identified as a sensitive receptor as it relied on taking water from the estuary and high SSCs would have caused problems for the plant.
The environmental indicators were identified via the Environmental Impact Assessment process carried out as a precursor to the project being given permission to pro-ceed. This utilised pre-existing information, the results of baseline surveys and numerical modelling results to iden-tify the sensitive receptors and to predict changes to key physical parameters (e.g. SSC and DO concentration).
Short-term environmental indicators (threshold values)Two sets of threshold values were identified:
● caution thresholds; and ● stop thresholds.
These were applied to two key physical parameters with the potential to be affected by dredging and identified as of high importance to the health of sensitive receptors; these were SSC and DO concentration.
Figure 7: Key sensitive receptor sites and designated areas in the vicinity of LGP (outer Thames estuary, UK).
A CEDA INFORMATION PAPER
April 2015 | 15
The purpose of the caution thresholds was to act as a warning that unacceptable physical conditions were possibly being approached. In such circumstances the Contractor was required to assess the situation and if necessary act (e.g. reduce dredger production rate) to prevent a stop threshold from being reached. If a stop threshold was reached the dredging was required to stop and either the dredger was required to re-locate to work elsewhere on the project or it was required to wait at the same location until the environmental conditions had returned to below the caution levels. The caution and stop levels (magnitude and duration) were primarily based on the naturally occurring physical conditions in the estuary and the temporal and spatial variability in these. Important considerations when developing the thresh-olds were:
● at what locations should they be measured; ● what water depth do they relate to; ● how are varying conditions along the estuary accom-
modated; and ● how are time varying natural conditions dealt with.
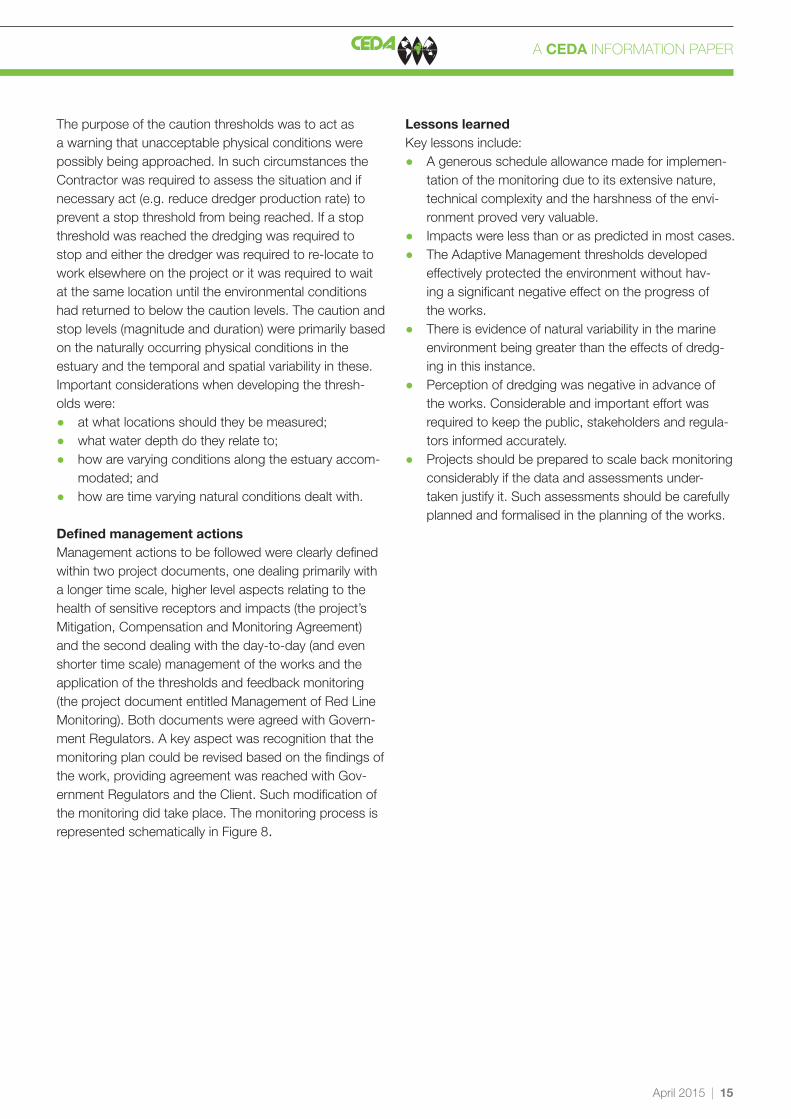
Defined management actionsManagement actions to be followed were clearly defined within two project documents, one dealing primarily with a longer time scale, higher level aspects relating to the health of sensitive receptors and impacts (the project’s Mitigation, Compensation and Monitoring Agreement) and the second dealing with the day-to-day (and even shorter time scale) management of the works and the application of the thresholds and feedback monitoring (the project document entitled Management of Red Line Monitoring). Both documents were agreed with Govern-ment Regulators. A key aspect was recognition that the monitoring plan could be revised based on the findings of the work, providing agreement was reached with Gov-ernment Regulators and the Client. Such modification of the monitoring did take place. The monitoring process is represented schematically in Figure 8.
Lessons learnedKey lessons include:
● A generous schedule allowance made for implemen-tation of the monitoring due to its extensive nature, technical complexity and the harshness of the envi-ronment proved very valuable.
● Impacts were less than or as predicted in most cases. ● The Adaptive Management thresholds developed
effectively protected the environment without hav-ing a significant negative effect on the progress of the works.
● There is evidence of natural variability in the marine environment being greater than the effects of dredg-ing in this instance.
● Perception of dredging was negative in advance of the works. Considerable and important effort was required to keep the public, stakeholders and regula-tors informed accurately.
● Projects should be prepared to scale back monitoring considerably if the data and assessments under-taken justify it. Such assessments should be carefully planned and formalised in the planning of the works.
16 | © CEDA 2015
Monitoring for Design Modelling
Po
st-D
red
gin
gD
red
gin
gP
re-D
red
gin
g
De�ne Project
Permissions, Licences & Conditions
Baseline Monitoring
Re-assess Conditions & Licences & Monitoring
Post-Dredge Monitoring
Project Completion
Construction & Dredging
Check Impacts VersusPredictions & Permissions
During DredgingMonitoring (for control
& impact detection)
Adaptive Management
Adaptive Management
Figure 8: Flow chart of the monitoring process for the London Gateway Port development .
A CEDA INFORMATION PAPER
April 2015 | 17
4.4 East English Channel, marine aggregate dredging
Overview of projectIn the UK, marine aggregate dredging is a strategi-cally important method of supplying sand and gravel to the construction industry. In the 1990s new sources of marine aggregate were sought, and prospecting indicated that large reserves were present in the East English Channel. A number of licence applications were commenced, which initially proceeded in isolation of one another.
After discussions, the companies operating in the region decided to co-operate in order to undertake a new form of environmental assessment in the UK – a Regional Envi-ronmental Assessment (REA) – and subsequent monitor-ing work, also on a regional basis.
System understandingThe REA for the East Channel region was completed in 2002 (Posford Haskoning, 2002), and involved data
collection and consultation, baseline characterisation of the environment in the region, specialist technical report-ing on the physical environment and coastal processes, benthic ecology, fisheries and fishing, archaeology and navigation and assessment of the regional effects of the proposed dredging over a 15 year time scale.
The East Channel region was a previously un-dredged system, where the aggregate resources consisted of immobile sands and gravels deposited originally (in the geological past) by rivers which flowed across the land-scape at times of lowered sea level. The regional seabed is, typically, gravelly and featureless and lies at depths between 35-60 m.
The regional monitoring programme was designed to review and test the predictions of the REA; with dredging plans, monitoring and mitigation for years 6-10 being informed by the findings of the years 1-5 of monitoring. The first regional monitoring review was based on data collected during the baseline monitoring, and subsequent monitoring during years 1-5 of dredging (2006-2010). Amongst the impacts predicted within the REA were:
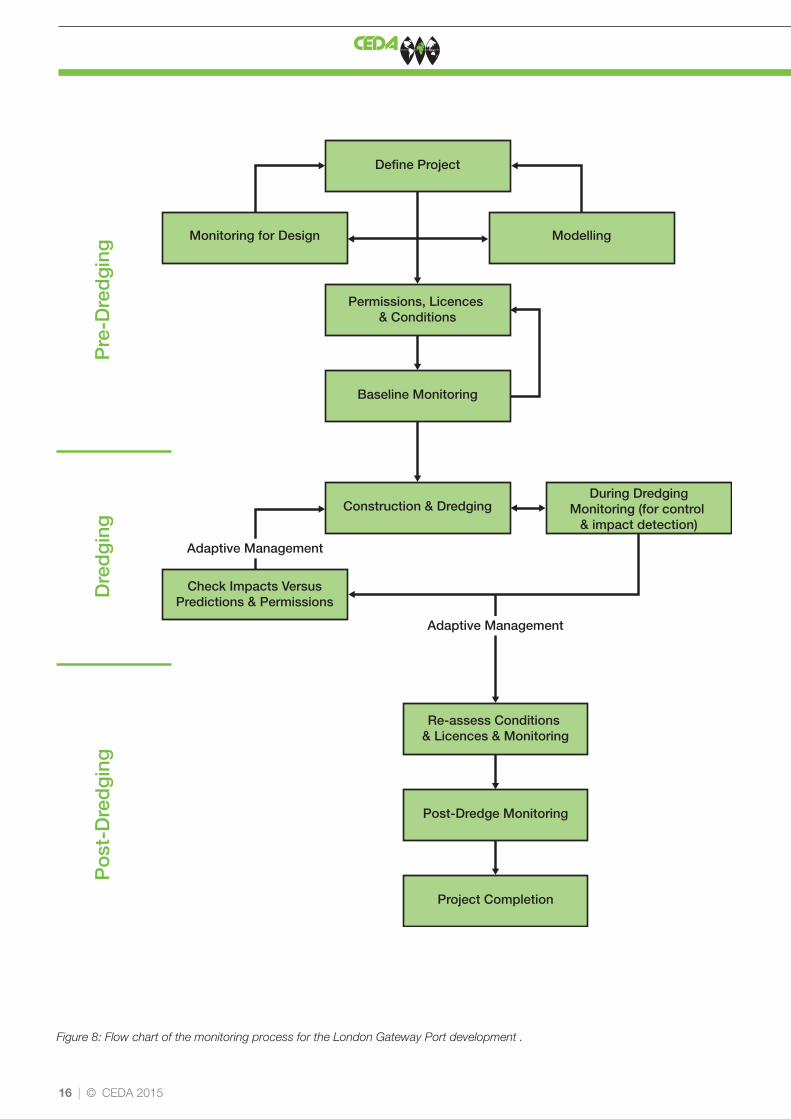
Figure 9: Overview of the East English Channel and the areas where permissions for dredging for marine aggregates have been given.

18 | © CEDA 2015
● effects on biological resources – community change, community recovery and species reproduction/health;
● plumes – depth averaged concentrations, near bed concentrations and deposition of mud/sand;
● seabed sediment transport – extents, scales and composition of bed-forms;
● fishing and fisheries – activity, and particular emphasis on herring spawning; and
● marine archaeology – prehistoric landscapes, ship and aviation wrecks.
MonitoringPhysical monitoring was not undertaken across the whole region but instead at a regional ‘type site’ (Area 473/2) and included multi beam bathymetry, side scan sonar, sediment samples (a total of 65 sample locations within the 37.7 km2 survey area) and camera and video surveys (10 Seabed Profile Image [SPI] camera locations; and approximately 11.2 km of video sled data along pre-scribed transects). Hydrodynamic conditions were meas-ured at two locations, for a time period in excess of a
lunar cycle, using an Acoustic Doppler Current Profiler to measure seabed currents and a 600 kHz Acoustic Wave and Current Meter for measuring waves and currents through the water column. No significant bed forms occur within the region, although data from repeat surveys are compared in order to monitor potential formation.
Biological monitoring occurred across the region, comprising benthic, fish, and shellfish data gathering and analysis. The benthic analysis was based on an initial survey array that consisted of a total of 341 sites which included 32 replicate sites. At each of the selected sites, grab samples were collected for both macro fauna and particle size analysis. A drop down camera system was also employed at each site to collect both video foot-age and stills of the seabed. A number of collated data assessments were also undertaken (Table 4), namely a fishing activity analysis, an assessment of herring spawn-ing potential and an archaeological assessment.
Table 4: Monitoring undertaken pre and during the first 5 years
of dredging in the East Channel Region.
Data sets and year of completion
Monitoring 2003-2005 2006 2007 2008 2009 2010
Regional Regional assessment
Habitat mapping
Physical monitoring: seabed sediment mapping
Yes Yes Yes
Physical monitoring: geophysical survey
Yes Yes Yes
Physical monitoring: sediment tracer/sediment plume study
Yes Yes
Benthic biological monitoring Yes Yes Yes Yes Yes
Herring spawning potential Yes Yes Yes
Archaeology Yes Yes

A CEDA INFORMATION PAPER
April 2015 | 19
The East Channel Regional Monitoring was designed to test the predictions of dredging impacts assessed in the Regional Environmental Assessment. The initial manage-ment, mitigation and monitoring requirements for dredg-ing in the East Channel Region were highly precautionary because of uncertainty regarding the impacts of dredg-ing in a region where such activities had not previously been undertaken.
Lessons learnedKey lessons include:
● Where conditions are relatively similar across a wide spatial area, then detailed monitoring of smaller, representative, dredging areas can be more useful to test the predictions of EIA than monitoring the whole region at a lower resolution.
● In the majority of cases impacts were less than pre-dicted, or as predicted.
● Ecological changes were only noted within the Active Dredge Zones.
● Smaller plumes were generated for a screened cargo compared with an unscreened cargo. A screened cargo is one where the water/sediment mix is passed over a mesh screen before entering the cargo hold. A proportion of the fine sediment and water falls through the screen and is returned to the sea while the coarser sediment is retained.
● The regional monitoring approach is adaptive, with monitoring requirements for the next 5-year period being reduced in light of the results obtained.
● Regulatory decision making has been made easier because of confidence in the data obtained.
● Findings from the monitoring programme have informed plans for future dredging, monitoring and mitigation in the region.
4.5 Fehmarnbelt, Denmark-Germany
Overview of projectA fixed connection between Denmark and Germany across the Fehmarnbelt is going to be built. The Feh-marnbelt is about 18 km wide at its narrowest point with a water depth of up to 30 m (Figure 10). The connection will consist of a tunnel below seabed level. The project will involve dredging of a tunnel trench, work harbours with access channels, land reclamation and more. Total dredging amount will be around 15 million m3. The spill from the dredging and reclamation work is estimated at 0.75 million m3 in situ volumes.
System understandingOne of many environmental requirements is that the connection must be designed in such a way that changes in the exchange of water between the North Sea and the Baltic Sea must be insignificant.
In the Fehmarnbelt the water transparency, measured by secchi-disk, is about 7 m on average. The benthic vege-tation extends down to about 20 m depth in areas where hard bottoms are dominating the sea bed. The vegetation in soft bottoms of bays and lagoons is dominated by eelgrass and along the coasts the hard bottom areas are dominated by red algae species. Mussels are widespread and make up the benthic fauna together with several in- and epifauna communities.
The response time of the sensitive receptors is, in this case, long compared to the various dredging operations. Therefore observed effects on these species cannot be used to adapt the dredging operations. Instead spill criteria were developed to ensure that the thresholds for impacts on receptors will not be exceeded. These criteria must be com-plied with and documented during the construction phase.
Baseline monitoringThe programme was based on a combination of fixed stations and vessel based surveys. In order to quantify the large scale hydrodynamics three monitoring stations were deployed inside an impact area predicted by early assessment models. These stations provided information on the general current pattern and wave parameters. Additionally, the stations were equipped with salinity/temperature sensors for every second metre throughout the water column and turbidity/fluorescence/dissolved oxygen sensors at three depths. These stations were configured in an online mode and data were transmitted to the data centre on an hourly basis.

20 | © CEDA 2015
Additionally, 10 stations were installed closer to the shore for measuring turbidity. The stations were light-weight enough to be moved according to the findings and were thus moved even closer to the shore after find-ing high turbidity flows very close to the shore (adaptive monitoring). Turbidity measurements were used for cal-culation of suspended sediment concentrations (following careful calibration) and light attenuation.
These fixed stations with measurements every 10 min-utes were supplemented with vessel based surveys on a monthly basis. These surveys visited more than 100 sta-tions for measuring profiles of water quality parameters. At 12 of the stations biological sampling was also under-taken. During the same time, dedicated surveys mapped submarine flora and fauna.
At a later stage, after the sensitive areas were identified, a more dedicated programme was set up in these areas. This included a more dense net of online stations and monitoring of more parameters including grain size dis-tributions and light attenuation. Also remotely controlled water samplers were installed.
Environmental indicatorsFrom the baseline investigations the species with the highest risk of impact were identified as red seaweed (Furcellaria lumbricalis) and eelgrass (Zostera marina). The most important predicted effects of the construction process are: increased suspended matter concentrations, increased depositions at the bed and loss of seabed.
The biomass of red seaweed may temporarily decrease in the area affected by the construction and dredging processes as the available sunlight will decrease as a consequence of the increased suspended sediment con-centrations. It is assessed that the construction will not threaten the existence and functionality of red seaweed.
Based on results of the baseline programme a sur-veillance programme will be defined. The programme will include control of the sediment spill from all relevant sources in the marine environment. If the sediment spill exceeds the thresholds derived in the EIA within certain environmental zones and periods of the year, mitigation measures will be initiated.
Figure 10: Left panel: Overview of the water bodies surrounding
the Fehmarnbelt. Right panel: Overview of fixed stations during
the baseline monitoring.

A CEDA INFORMATION PAPER
April 2015 | 21
Lessons learnedThe baseline monitoring programme provided high quality information on the required parameters thereby providing valuable input to not only the EIA documents but also for the coming planning of the monitoring during dredging as well as post dredging monitoring.
Prior to initiation of the project the knowledge about the area of concern was fairly limited and a comprehensive programme was initiated. The most important lessons learned are:
● Fixed stations are supreme providers of baseline data. It proved very valuable to keep the stations online for three reasons:
� the data could be utilised immediately after the measurement was taken thereby speeding up the system analysis;
� the ability to monitor the health of the stations kept data coverage up and at the same time gave the ability to optimise the service scheme; and
� data are measured also during bad weather. ● The near shore stations were kept lightweight. The
stations were physically moved after the first year of monitoring to better capture the variability of the nat-ural suspended sediment concentrations in the near coastal zone.
● The entire monitoring programme provided valua-ble information for identification of sensitive recep-tors and the effects that these receptors would experience as a consequence of the dredging and construction activities.
More information can be found in Brøker et al. (2014).
22 | © CEDA 2015
5 Conclusion and recommendations
Monitoring is performed to establish baseline environ-mental conditions and assess the level and compliance of environmental change caused by dredging in rela-tion to agreed environmental thresholds and/or quality standards. In some cases it is advantageous to develop a monitoring programme that is compatible with an Adaptive Management implementation approach. Such programmes are designed to adapt to changed condi-tions, while maintaining protection of the environment by focussing on quantifying and qualifying impacts that occur when sources and receptors intersect.
The examples, with their unique and site-specific con-ditions, illustrate why it is difficult to develop and apply a standard monitoring procedure to all projects. However, regardless of these differences several common lessons and recommendations exist and should be considered when developing and implementing a monitoring pro-gramme. These include:
● Monitoring programmes shall be designed in order to test the predictions of pressures and impacts identi-fied during the planning and EIA process.
● Environmental Data Management Systems are essen-tial to efficient and optimal use of the very expensive data collected in monitoring programmes, before, during and after dredging.
● For bigger projects, allowance shall be made for adaptation of the monitoring programme during all phases. This includes adjustments of the methods, extension or downscaling of monitoring in time and space etc.
● The data from the baseline monitoring programme are often used for calibration or validation of predic-tive modelling tools. Data from the monitoring during dredging are useful for further optimisation of the pre-dictive modelling tools for impact assessment. These tools can then be used with growing confidence to help guide the dredging works (feedback monitoring, Adaptive Management). Measurements will remain important though.
● The monitoring programme shall be designed to consider and document the natural thresholds and
variability of the environment in order not to restrict activities on an unjustified basis but to achieve successful protection of the environment in line with targets and legislation.
● The introduction of tiered action levels to control the dredging operation with different thresholds adds significantly to the ability to optimise and adapt the dredging schedule to the actual effects on the environment.
● Efficient and optimal monitoring is a pre- requisite for successful Adaptive Management of dredging projects.

A CEDA INFORMATION PAPER
April 2015 | 23
ReferencesBrøker, I., Sehested Hansen, I. & Middelboe, A. L. (2014) EIA
for the Fehmarnbelt crossing – the World’s longest immersed
tunnel. In: ICCE 2014: Proceedings of the 34th International
Conference on Coastal Engineering, 15-20 June 2014, Seoul,
Korea [Online] Available from: https://journals.tdl.org/icce/index.
php/icce/article/view/7708/pdf_967 [Accessed 20 January 2015].
CEDA (2011) Environmental control on dredging projects – les-
sons learned from 15 years of turbidity monitoring. Information
paper. [Online] Available from: http://www.dredging.org/media/
ceda/org/documents/resources/cedaonline/2011-ceda_infor-
mation_paper_environmental_control_ondredging_projects.pdf
[Accessed 20 January 2015].
CEDA (2015) Integrating Adaptive Environmental Management
into Dredging Projects. Position paper. [Online] Available from:
http://www.dredging.org/media/ceda/org/documents/resources/
cedaonline/2015-01-ceda_positionpaper-integrating_adaptive_
environmental_management_into_dredging_projects.pdf. [Accessed
10 March 2015].
IADC (2010) Facts about environmental monitoring. An informa-
tion update from the IADC. No.2–2010. [Online] Available from:
https://www.iadc-dredging.com/ul/cms/fck-uploaded/documents/
PDF%20Facts%20About/facts-about-envirnmental-monitoring.pdf
[Accessed December 2014].
Posford Haskoning ( 2002) Regional environmental assessment.
Report for the East Channel Association.
AbbreviationsAM Adaptive Management DO Dissolved OxygenEIA Environmental Impact Assessment LGP London Gateway PortMCL Maximum Contaminant LevelREA Regional Environmental AssessmentROD Record of DecisionS-P-R model Source-Pathway-Receptor modelSSC Suspended Sediment ConcentrationTSS Total Suspended SolidsUSEPA US Environmental Protection Agency

AcknowledgementsThis information paper is presented by the Central Dredging Association (CEDA), an independent, international organisation with an extensive professional network, a centre of expertise on dredging and reclamation and an easy-to-access forum for knowledge exchange. The paper has been prepared by a working group of international experts of broadly diverse back-grounds and range of expertise, under the remit of the CEDA Environment Commission.
Members of the CEDA Working Group Environmental Monitoring ProceduresIda Brøker, DHI, DenmarkSteve Challinor, Royal Haskoning DHV, UKAndrew Costen, BMT, Australia (corresponding)Rebecca Gardner, Anchor QEA AS, NorwayFrederik Goethals, DEME, BelgiumMark Lee, HR Wallingford, UKDafydd Lloyd Jones, Marine Space, UKUlrik Lumborg, DHI,DenmarkFrederik Roose, Ministry of the Flemish Community, Maritime Access Division, BelgiumMarcel Van Parys, Jan De Nul, Belgium
Central Dredging Association – CEDARadex Innovation CentreRotterdamseweg 183c2629 HD DelftThe NetherlandsT +31 (0)15 268 2575E [email protected]