Embed Size (px)
Citation preview
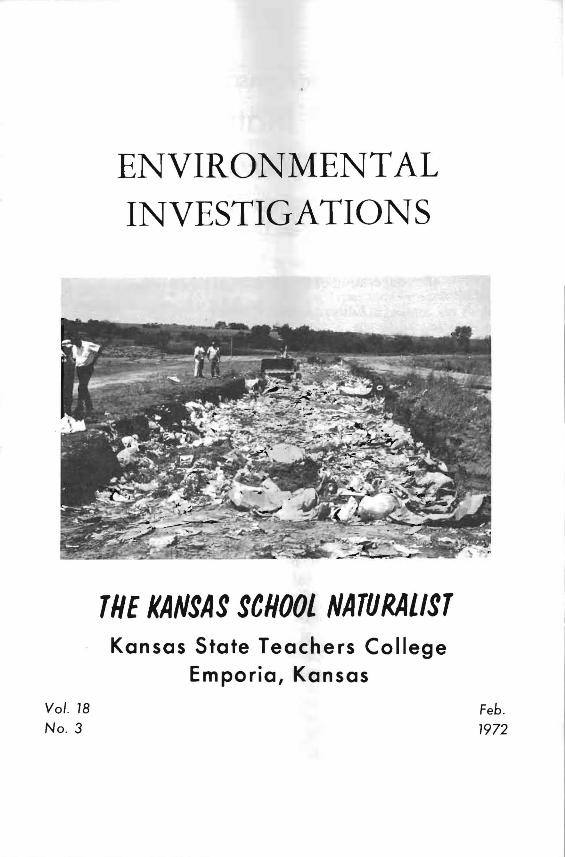
ENVIRONMENTAL INVESTIGATIONS
THE KANSAS SCHOOL NATURAL/ST Kansas State Teachers College
Emporia, Kansas
Vol. 18 Feb . No. 3 1972

The Kansas
School Naturalist Published by
The Kansas State Teachers College of Emporia Prepared and Issued by
The Department of Biology, with the cooperation of the Division of Education
Editor: Robert J. Boles
Editorial Committee: James S. Wilson, Robert F. Clarke, Gilbert A. Leisman, Harold Durst
Exofficio: Dr. Edwin B. Kurtz, Head, Dept. of Biology
The Kansas School Naturalist is sent upon request, free of charge, to Kansas teachers, school board members and administrators, librarians, conservationists, youth leaders, and other adults interested in nature education. Back numbers are sent free as long as supply lasts, except Vol. 5, No.3, Poisonous Snakes of Kansas. Copies of this issue may be obtained for 25 cents each postpaid. Send orders to The Kansas School Naturalist, Department of Biology, Kansas State Teachers College, Em poria, Kansas, 66801.
The Kansas School Naturalist is published in October, December, February, and April of each year by The Kansas State Teachers College, 1200 Commercial Street, Emporia, Kansas, 66801. Second-class postage paid at Emporia, Kansas.
"Statement required by the Act of October, 1962: Section 4369, Title 39, United States Code, showing Ownership, Management and Circulation." The Kansas School Naturalist is published in October, December, February, and April. Editorial Office and Publication Office at 1200 Commercial Street, Emporia, Kansas, 66801. The Naturalist is edited and published by the Kansas State Teachers College, Emporia, Kansas. Editor, Robert J. Boles, Department of Biology.

3
ENVIRONMENTAL INVESTIGATIONS Dr. Harold Durst
This issue of the Naturalist consists of several investigations selected from approximately 70 that were developed and tried out by participants in an institute in environmental biology and human ecology at the Kansas State Teachers College during the summer, 1970, under the direction of Dr.s. Thomas Eddy, John Ransom, Dwight Spencer, and Harold Durst. Since that time, the investigations have been used by a number of teachers and students. Suggestions for minor changes and modifications of the original materials were received and considered during the rewriting of those investigations selected for this issue of the Naturalist.
The names and addresses of the participants having the major responsibility for developing the original studies will be given at the end of each investigation. To be sure, the ideas for the investigations came from a variety of sources, but do represent studies that these persons considered appropriate for gaining a better understanding of the environment.
Dr. Durst, of the KSTC Biology Staff, is
aspeci<llist in Science Education. He is
interested in thc improvemcnt of science
instruction, and the development of new
<lnci innovative teaching techniques.
DIVERSITY STUDY OF ARTHROPODS ON PLANTS
Objectives: After completing this investiga
tion you should be able to:
1. Construct a model showing a plant and the various types of arthropods associated with that plant. The bases for determining types may be such things as what the organisms do in relation to the plant and each other, methods of feeding, or means of locomotion.
2. Identify some of the organisms associated with the plant being studied.
3. Predict how certain arthropods obtain their food when shown the mouthparts of representative individuals.
Materials:
1. A relatively undisturbed area containing the plant you wish to use in the study.
2. Notebook for recording field observations.
3. Pieces of colored ribbon or other materials to designate the plants to be observed.
4. Killing jar (see illustration at end of investigation).
5. Insect pins or other thin straight pins.
6. Insect net (see illustration at end of investigation).
7. References for identification of organisms.

4
8. Container such as a cigar box for holding speciments.
9. Forceps or tweezers. 10. Hand lens or dissecting micro
scope. 11. Cards 1 cm' for labeling organ
isms collected and killed. Procedure: 1. Study a variety of nearby areas
that could be visited daily for your study.
2. Select a particular kind of plant to study. (Example: dandelion, plantain, a shrub, or a tree). If possible, select a type of plant
Kind of Organism Observations
Day 1 I Day 2 I Day 3 I Day 5
4. You should collect one of each kind of organism found on the plant. Obviously you should not collect organisms such as birds in the event that a tree has been chosen for study. Start your collection on the first day and collect only newly observed types thereafter. However, you will observe and record data each day.
5. Remove organisms from the killing jar as soon as pOSSible, identify, pin, and label. You may want to restrict your observations and collections to insects and spiders. In the event that you do choose to collect other animals you will need to use other means for preservation and display.
6. Repeat the observations for four to five days and remember to
that is in bloom sometime during the study. It is best that you find several different plants of the same kind for observing so that you will not have to rely on a single plant for your data. Mark the plants selected for study in some manner so that they can be easily located each visit.
~3. Construct a chart similar to the one that follows for recording data. You may wish to construct a separate chart for each plant observed.
ActivityTotal Part of Plant
record only organisms found on the plant.
7. At the end of the observation period, four to five days, collect one of the plants or parts of one, press, glue to a sheet of paper, and place with your collection of animals.
8. At this point determine the number of different kinds of of organisms observed; the kind that was observed most frequently, the kind that was most numerous, and the part of the plant where the greatest number of organisms were observed.
Studying the Data: 1. Construct a table for placing the
organisms into different groups according to what they were doing on the plant. Examples are resting, feeding, etc., and if feeding, were they feeding on

plants or upon. other animals? What types were most numerous, and, is this what you expected?
2. Determine which organisms were permanent residents on the plants and which were visitors. Describe any differences between these two groups of organisms with respect to what they were doing while on the plants.
3. Construct either a food chain or
w/de -rnoulhe.dJar
/" / 0
..<./
.......... "
,", ' .............. ~
I / \ I rertoraled alcohol-soaked
ca'db:"~~CG.liT\o::on
KILLING JAR An insect-killing jar may be made from a
wide-mouthed jar, some absorbent cotton, and a piece of perforated cardboard. Do not use carbon tetrachloride as a killing agent, as the fumes are harmful if inhaled. Alcohol for saturating the cotton is much safer. The insects may also be killed or immobilized by placing them in the freezing compartment of a refrigerator.
a food web that includes the plant and the organisms found on the plant. This could be done by arranging a display of the organisms, plant and animals, that were collected.
4. Describe at least one additional investigation that could be done using techniques and organisms similar to the ones you used for this investigation. '
Kenneth Bishop, Garnett, Kansas Alva Van Etten, Haysville, Kansas
b,oom sfiGk.
hea"IWire- - 44 '
open mesh clofh - J1 '
(rna --D
~o \()
COLLECTING NET
A satisfactory net for collecting insects
may be made from an old broom stick, a
piece of wire, and a triangular-shaped piece
of cloth. The top part of old nylon hose
may be used to make a collecting net of a
smaller diameter.
5

6
TEMPERATURE STRATIFICATION IN FLUIDS
Objectives: Upon completing this investiga
tion, the student should be able to: 1. Construct an apparatus for
demonstrating temperature inversion in air.
2. Demonstrate temperature stratification in air and water.
3. Relate some of the effects of temperature changes in fluids to gross organismic behavior.
4. Describe the conditions necessary for the occurrence of temperature inversions under natural conditions.
Materials: Metal can, 15 cm diameter x 7)f
cm high Metal can, 10 cm diameter x 15
cm high Sheet clear plastic, 60 cm x 33
cm. Scotch tape 2 pieces plastic tubing (7 mm
I.D. ), 50 cm long Meter stick 2 thermometers Stiff wire, 20 cm long Tray of ice cubes Congo red Wire gauge Meter stick Cigarette Tin snips Scissors Vacuum pump 600 ml beaker Bunsen burner Ring stand Ring Aquarium
Procedure :
A. Temperature Inversion
1. Assembling the apparatus
a. Cut a ring about 2.5 cm wide from the top of the can that is 15 cm in height. Then, cut off the remainder of the can to a height of 7)f cm. ;
b. Tightly fit a 60 cm long cylinder of clear plastic into the 7)f cm tall can and tape the cylinder to the can rim.
c. Tape the seam of the plastic cylinder.
d. Place the previously cut can ring over the top of the cylinder and tape in place flush with the top of the cylinder.
e. Cut a hole in the cylinder large enough to receive the plastic tubing 25 cm from the bottom.
f. Insert the plastic tubing, letting it drop to about 2.5 cm from the bottom of the cylinder.
g. Reaching down through the cylinder, tape the tubing in place.
h. Tape around the tubing entrance through the hole in the cylinder to make it airtight.
g. Tape two thermometers to the meter stick so that the bulb of one thermometer will be at the 5 cm mark and the other will be at the 50 cm mark.
h. Insert the meter stick so that the thermometers are

~
-- n?e fer slick
Lsfiff wire- 20 em /on1 /(a longer wire n?<JY he used iJna'
loopedaround the yard sitek)
fal can- 2.5 em x 7- 5 etn
#' x60cm
- -Scotch fape .seam~ thermo
~ c'f/lnder of
-Fiexii:>/e
meier . fu6/ng
em long (7mm LD.)
,.., .... -- ......
8---md..1 Ciiln-J,5cmx
10 em
TEMPERATURE INVERSION
in center the cross over the top rim of cyl. section the cylinder. the wire ends
in so that by looping
i. hold meter and thermometers
bending the wire lifted out as ll(/'\..v~,,,a'
meter

8
2. The Demonstration that has been cooled with a. Center the cylinder in the ice into the aquarium and
large ( 15 cm diameter) observe. can. Fill the outer can 2. Demonstration without with ice up to the tape on dyes. Proceed as above but the cylinder. Record the hang two thermometers in temperatures until there is the aquarium, one with a 15° C difference between bulb at the bottom and an " the upper and lower ther other with bulb in water mometers. near the air-water interface,
b. Gently blow smoke into the and observe. A variation cylinder until it is )$ to )4 would be to use fish as infull. dicators of temperature
c. Gently remove the ice and stratification as cold water allow to stand undisturbed. was added. Record the temperatures 3. You might want to deterfor five minutes. mine if temperature inver
d. Record any changes in the sions can be produced in height and movements of water.
Oscar Brubaker, W estland, Michigan the smoke layer. 3. Studying the data AUTOMOBILE IN USAGE
1. What kind of temperature stratification has been pro Objectives: duced? After completing this investiga
2. 'Is this a stable or unstable tion the student should be able to: condition? 1. Design at least one investigation
.'3. Where could such condi in order to determine the eftions exist in nature? ficiency of automobile usage.
4. Why have temperature in 2. Construct tables for recording versions become objects of data and record data in tabular much concern to man? form .
B. Temperature Stratification in 4. Demonstrate an improved proWater ficiency in basic mathematical
1. Demonstration with dyes. operations. Fill an aquarium 2/3 full 5. Propose a more efficient mass with tap water and let set transit system than the one pretle. Siphon dyed water sently used in the community.
Date ____________________________ Time _______ __ _____ __ ____________ Location ____________________________ 1 Passenger 2 Pass. 3 Pass. I 4 Pass. 5 Pass. 6 or Pass.

Materials: Pencil and paper for recording
observation.
Procedure: 1. Prepare a table similar to the
one lower to the left for recording observations.
2. Choose several locations for observing and recording the number of passengers in each passing car. A busy street corner, a road leading to an industrial plant, and the entrance to the school parking lot are locations that could be used.
3. Using a check and tally system, record the number of cars passing the location in the appropriate column for a predetermined period of time, at least 15-30 minutes in length.
4. Depending on the sites chosen, you may want to repeat the observations at other times of the day. Also, repeat the observations for a given time for several days. Many variations in this experimental design can be developed. Let students help design a study.
Studying the Data: 1. Construct bar graphs to show
(a) the total number of cars passing each check point and (b) the average number of passengers per auto at each location for the different times of the day.
2. If an automobile may emit about 2400 lbs. of CO, 185 lbs of nitrogen oxides, 132 lbs. of hydrocarbons, and 11 lbs. of particulates per 1000 gallons of gaso
line used, calculate the amounts of these emissions for a certain distance, (eg. one mile), along the areas observed during the investigation.
3. Develop a priority system that might be used for assigning a limited number parking spaces in places as your school, downtown, and near a factory.
4. Design a transportation system that would be effective but reduce pollution and the utilization of reSOUl'ces. John Eckert, Hutchinson , Kansas Steve Morris, Wellsville, Kansas Douglas Everett , Phoenix, Oregon
PESTICIDES AND AQUATIC ORGANISMS
Objectives: Upon completing this investiga
tion the student should be able to: 1. Calculate the amounts of solutes
and solvents needed to prepare given concentrations of pesticides.
2. Identify the controlled, responding, and manipulated variables in an investigation.
3. Observe the effect of the manipulated variable and record the observations in a manner that aids in testing the hypothesis.
4. Formulate a hypothesis concerning the expected outcome of the investigation.
5. Analyze the data in order to accept or reject the hypothesis.
6. And state some of the limitations of the investigation in attempting to generalize the influence of pesticides upon natural populations.
9

10
Materials: l. Six to eight uniform-sized
aquaria (wide-mouthed jars are satisfactory) .
2. Seine, dip nets, or either equipment suitable for collecting freshwater organisms.
3. Any of the insecticides or herbicides.
4. Freshwater organisms (tadpoles, minnows, crayfish, or Daphnia).
5. Aquarium dipnet. 6. Balance, sensitive to hundredths
of a gram. Procedures: l. Fill aquaria with equal meas
ured amounts of water. 2. Allow to stand for 24 hours.
This will permit chlorine to es
ppm desired
grams of pesticide needed
Example: desire 5 ppm
grams pesticide
ppm desired
cape if using chlorinated water and provide time for water to adjust to room temperature.
3. Mix measured amounts of the pesticide into the aquaria. Vary the amounts so that the ppm of pesticide range from a few to several hundred, depending 011
your balances and the size of aquaria. Determine ppm as follows :
4. Label aquaria with the parts per million (ppm) of pesticide being used and one aquarium as a control.
.5. State what you think will happen to the organisms when introduced to the aquaria. This is :vour hypothesis.
1,000,000
grams of water in aquarium
in 4 liters of water. 4 liters = 4,000 g. of water, approx.
4,000
1,000,000
5 • 4,000 20,000 grams pesticide =
1,000,000 1,000,000
grams pesticide 0.2
6. Prepare a table for recording data, introduce animals, note the time, and record observations.
7. Continue observing frequently during the first 30-45 minutes and at longer intervals thereafter. Remove any dead animals and dispose of as you would discard preserved specimens.
Studying the Data: l. Construct a graph similar to the
example to the upper right.
2. From the data obtained try to determine more than one kind of relationship between con· centrations of the pesticide and behavior of the organisms used.
3. Design an investigation to determine the length of time that the pesticide retains its effectiveness upon being mixed into water.
4. Do the data support your hypothesis? If you were conducting the same type of investigation

11 .100
\
til !to \ -- SO ,P'p1'nE til ~..... 110 ' -'- 100,Pt"1'he III ,,70'"' '"' , .----- - ;ZODt"I"ff>0'" ·e.... ,,> '\
- '
, ..... Soo l"'pl'n'c: .~ ''0 , ,>< 50 " ,+'ern" ,,III .. 0 , ," >< " '.
, ,
, ~.<IJ .soPo. "-, '. ,.1.0 \
10 \ , , \
\ \ ~ 0
0 I l 3 1 5 , 7 8 oS
Time
using another pesticide, how might you a state a more precise hypothesis?
5. Which variables did you control in conducting this investigation? Were there variables which, if controlled, would have improved the investigation?
6. Were your concentrations in ppm of the active ingredients in the pesticide or for the total which would include solvents? You may want to study the label on the pesticide container.
7. How might you account for the fact that some organisms within a single aquarium were affected more or less than others? Robert Engel, Mankato, Kansas James Overmyer, 2012 Edith Avenue,
Fort Wayne, Indiana Glena Watt, Frontenac, Kansas
EFFECT OF DETERGENTS ON TERRESTRIAL ENVIRONMENTS
Objectives:
Upon completing this investigation the student should be able to:
10 II I~ la 14 IS I~ 17 18 19 ;Zo :1I ~1. .<3 2.1
in Minutes
1. Design a controlled experiment to determine the influence of certain chemicals on the numbers and kinds of organisms in a terrestrial environment.
2. Demonstrate the use of a classification system or the development and use of a classification system to categorize the organisms found in a study plot.
3. Demonstrate a proficiency in the skills required to conduct the studies - preparing the various concentrations, site selection and measuring, sampling, observing, data collection and recording, and data analysis.
Materials: This investigation is divided into
three sub-investigations. The materials listed below are required to establish the treated plots for any or all of these studies. 1. Four 1 m x 1 m plots. Each plot
should have similar vegetation, sunlight, and drainage.
2. Giant size box of detergent. 3. Several buckets. at least one gal
lon capacity.

12
4. Water (5 liters per plots per treatment) .
5. Sprinkling can or bucket with holes punched in bottom.
6. 16 stakes (4 per plot) 15 cm long.
7. Rod for stirring. 8. Meter stick. 9. Optional - camera and film to
take pre- and posttreatment pictures.
Procedure: 1. Four separate plots 1 m x 1 m
are measured and marked hy driving stakes at each of the four corners of each plot.
2. Label the plots A, B, C, and D . Plot A serves as the control and plots B, C, and D receive increasing concentrations of the detergent.
3. To arrive at an amount of detergent to use, you may want to use the manufacturer's suggested amount for washing a load of clothing to plot C, one-half that amount to plot B, and double the recommended amount for plot C.
Plot A - Control Plot B - Half strength Plot C - Full strength Plot D - Double strength
5 liters of water only. 5 liters of water + % detergent
for C. 5 liters of water + recommended
amount of detergent. 5 liters of water + 2 times deter
gent for C.
4. The rate of treatment may vary because of the ability of the soil
to absorb water as determined by soil texture and drainfall, but one treatment each week should be a minimum. Apply water evenly to the control, plot A, first and then apply detergent solutions to plots B, C, and D in that order. Rinse equipment when finished.
Investigation A. The Effects of Detergents on Plant Life.
Materials:
1. Two meter sticks. 2. String. 3. Paper and pencil.
Procedure :
1. Four separate plots 1 m x 1 m are measured and marked by driving stakes at each of the four corners of each plot.
2. String should be placed next to the ground and around the stakes to define the boundary for each plot.
3. The number of each kind of plant in each plot is counted. If the determination of plant names on the site is too difficult, assign unknown plants either a letter or number and collect a like kind plant from outside the plot, attach the letter or number designation, take to the classroom and identify using available reference materials.
4. Construct a table with headings as shown for recording data.
5. The counting of plants is facilitated if small segments of each plot are counted. One method is to divide the plot into small strips by placing the meter sticks

Plant type
NUMBER OF PLANTS
Plot CPlot BPlot A BeforeBefore I After
across the plot, count, and move across the plot until completed.
6. Determination of numbers of plant types should be done for all plots before and after the treatments. You may wish to record the condition of the plants, too.
Studying the Data:
l. How might you account for any changes in the total number and kinds of plants in the plot?
2. In case some kinds of plants have a beter survival rate, where do we commonly find those used in the experiment?
.'3. Among those plants which were damaged; describe the various signs of damage to the plants.
4. Where in our environment might plants be exposed to treatments similar to those used in the experiment?
Investigation B. Effect of Detergents on Below-Ground Organisms
Materials:
1. Four small metal cans of same size and with top removed.
2. Small spade or garden trowel. 3. Four plastic bags, each large
enough to hold contents of one can.
4. One, 2 .. 5 cm thick board. 5. One hammer. 6. Four Berlese funnels (see dia
gram ).
Before I AfterI After Plot D
Before I After
BERLESE FUNNEL A goose-necked reading lamp may be
substituted for the source of heat and light to drive the arthropods down into the killin~ fluid.
7. Isopropyl alcohol, rubbing alcohol.
8. Hand lens or stereomicroscope. 9. :\lasking tape.
10. Four small pieces of screen " 'ire or steel wool.
13

14
5
... 0
...... " "
" 2
'§'2zO 1
0
11. Cake pan or sheets of white to a plastic bag, tie shut, and paper. label.
12. Saucer or petri dish. ~l. Upon returning to the classroom, the contents of each bag 13. Medicine dropper or forceps. is placed in separate Berlese
Procedure: funnels.
1. The numbers of organisms in the 4. Fill each vial about )~ full with litter and in the soil to a depth alcohol. Attach the vial with of 2 cm is determined before the masking tape to the lower end first and after the last treatment. of the funnel spout. After putOne sample per plot is hardly ting the sample into the funnel indicative of the number of turn on the light. In about 24 kinds of organisms present. As hours the heat and the drying suming that you are identifying will drive most organisms down organisms to the order level, a into the alcohol. sample is taken and the number 5. To count the organisms collectrecorded in tabular form, and ed in the alcohol, pour the conthe total number of orders re tents of the vial into a saucer or corded on a graph. Sampling petri dish. Observe with hand is repeated until a stabilization lens or stereomicroscope. Place in the total number of orders is the organisms in groups or cateattained as shown by a plateau gories and name according to on the graph below. So long the amount of time and referas new orders are found, samp ence materials availables to vou ling should continue. for determining a classification
system and record in a table for 5 later use.
: L :
Studying the Data: "" ~~.-..-/ ~ E Q) ". ,D'C
/ §5 1. What evidence was obtained. z 1 • that would help you decide if
o the organisms were killed or if0 1 ? 5 o 1 4 5
Ntnnber of Samples Number of Samples thev were driven from the area Incomplete Sampling Complete Sampling bec'ause of disturbances?
2. The sample is collected by plac 2. \Vhat animals seemed to show ing the open end of the can over the greatest tolerance of the the litter, placing a block of addition of detergents to the wood on top the can, and ham areas? Was there any indicamering 2 cm into the soil. Slide tion of a relationship between the spade or trowel under the tolerance to detergents and the can cutting the soil as you do so. kinds of food the organismsTransfer the contents of the can consume?

15
Group CoHembola Arachnida Insect Larve Ant Beetle Diptera Sucking . Insect
NUMBER OF ORGANISIVIS Plot A Plot B Plot C
Before After Before
3. Would the substitution of other detergents and soaps produce the same results?
5. Design an investigation to determine the amount of time required for a return to the normal number and kinds of belowground organisms.
Investigation C. Determination of the Effect of a Detergent on Above-Ground Organisms.
Materials :
1. Insect net. 2. Four small jars or vials with lids. 3. Paper and pencil for recording
observations.
Procedure:
1. Using the insect net, make ten sweeps over each plot. Sweeps are made alternately to your left and to your right across all the area in each plot. Transfer the organisms to the collecting jars, identify and record results in a table similar to that for investigation B.
2. This procedure should be carried out before detergents are applied and again following the last application.
Studying the Data:
1. Do your data show any relation
After Before After Plot D
Before After
between the amounts of detergents applied and the numbers and kinds of above-ground organisms? How might you improve upon the investigation in order to make either more positive statements or an inference of greater validity?
2. How might you account for any increases in the number of kinds of insects in any of the experimental plots? the control plot?
3. What factors other than the addition of detergents might be responsible for fluctuations in the number and kinds of insects?
Further investigations:
1. If soil testing materials are available, you might compare the pH, phosphates, and nitrates for the plots.
2. Other treatments that may be used either singly or in combinations are detergents and soaps, pesticides and fertilizers.
3. Study the effects of detergents or other substances on a aquatic environment. This can be done by adding varying concentrations of the substance to a series of aquaria such as wide-mouthed jars. Wayne Drayer, Fairbury, Illinois Robert Moorhead, Ponca City, Okla.