Embed Size (px)
Citation preview

Final Report ISU-ERI-AMES-81400
GRANULAR BASE MATERIALS ,FOR FLEXIBLE PAVEMENTS
OWA HIGHWAY RESEARCH BOARD PROJECT HR-131
FOR IOWA STATE HIGHWAY COMMISSION
N COOPERATION WrTH FEDERAL HIGHWAY
ADMINISTRATON, BUREAU OF PUBLIC ROADS
. ERI Project 704-S
TAl
J.M.HOOVER
AUGUST1970
·-----] . Io8p 704=-S
rir:~l __ _ ENGINEERING RESEARCH INSTITUTE IO'V"VA. SI_.6...1E LJNI"V'E:::F<i!SU"T'Y .,6.,.1'v1ES, IO'V"/_.6... .!50010 LJS.,6.,.

I
· Iowa Highway Research
Board Project HR-131
Contribution No. 70-4 of the Soi I Research Laboratory
ISU-ERI-AMES-81400 ERI Pro;ect 704-S
ENG~NEERIN·G RESEARCH ENGINEERING RESEARCH
· ENGINEERING · .RESEARCH
·.ENGINEERING .RESEARCH ENGINEERING
.RESEARCH
FINAL REPORT
GRANULAR·. BASE MATERIAlS
FOR FLEXIBLE· PAVEMENTS J. M. Hoover
Project Director
· August 1970
Submitted to Iowa Highway Commission and Federal Highway Administration, Bureau of Public Roads
The opinions, linclings ancl conclusions express~c/ in this publication are those of the authors ancl not ·
necessarily those of the Iowa State Highway. Commission nor the Bureau of Public Roacls·.
ENGINEERING RESEARCH. INSTiTUTE.
IOWA STATE UNIVERSITY AMES
\ ~----------------

1. Report No. Government Acceuion No.
ISU-ERI-AMES-81400 4. Title and Subtitle
GRANULAR BASE MATERIALS FOR FLEXIBLE PAVEMENTS
1. Author(sl
J. M. Hoover, Project Director 9. Performing Organization Name and Address
Soil Research Laboratory Engineering Research Institute Iowa State University Ames. Iowa 50010
12. Sponsoring Agency Name and Address
Iowa State Highway Commission Ames, Iowa 50010
3.
5.
6.
8.
10.
11.
13.
Recipient's Catalog No.
Report Date
August 1970 Performing Organization Code
Performing Organization Report No.
ISU-ERI-AMES-81400 Work Unit No.
Contract or Grant No.
Project HR-131 Type of Report and Period Covered
Final Report
In cooperation with Federal Highway Administration, 14. Sponsoring Agency Code Bureau of Public Roads
15. Supplementary Notes
16. Abstract
The first phase of this project relates untreated and asphalt-treated Iowa materials to those used in the AASHO Road Test. Material coefficients of relative strength are established for use with the AASHO interim design procedure for flexible pavements. The analyses utilized rely on volumetric strain-axial strain data from a triaxial test, at a point of failure defined as minimum volume during shear.
The second phase of the project is basically two-fold and centers around (a) the response of asphalt-treated granular base materials to triaxial compression under repetitive axial loads and (b) the effect of fines content of untreat~d granular base materials under repetitive axial load triaxial tests.
17. Key Words
19. Security Classif. (of this reportl
Unclassified
18. Distribution Statement
Unlimited
20. Security Classif. (of this page)
Unclassified
21. No. of Pages 22. Price

i
CONTENTS
1. INTRODUCTION AND.OBJECTIVES
2. PHASE I: COEFFICIENTS OF RELATIVE STRENGTH
2. 1. MATERIALS
2.2. SPECIMEN PREPARATION
2.2.1. Compaction
2.2.2. Bituminous-Treated Materials
2.2.3. Untreated Materials
2.3. TESTING PROCEDURE
2.3.1. Bituminous-Treated Materials
2.3.2. Untreated Materials
2.4. METHODS OF ANALYSIS
2.4.1. Failure Criterion
2~4.2. Calculations
2.4.3. Statistical Analysis
2.5. RESULTS
2.5.1. Minimum Volume Criteria
2.5.2. Maximum Effective Stress Ratio Criteria
2.6. CONCLUSIONS
3. PHASE II: REPETITIVE LOAD RESPONSE
3. 1. BEHAVIOR OF GRANULAR MATERIALS UNDER TRIAXIAL COMPRESSION WITH PULSATING DEVIATOR STRESS
3.2. EFFECT OF FINES CONTENT OF GRANULAR MATERIALS UNDER REPETITIVE LOAD TRIAXIAL TESTS
3.2.1. Introduction
3.2.2. Materials
1
2
2
3
3
4
6
8
10
12
12
12
13
13
19
19
51
61
63
63
71
71
72

ii
3.2.3. Specimen Preparation
3.2.4. Triaxial Compression Apparatus
3.2.5. Results
3.2.6. Conclusions
3.3. MINIMUM VOLUME LOAD RESPONSE OF AN ASPHALTTREATED GRANULAR MATERIAL
ACKNOWLEDGMENTS
SELECTED REFERENCES
APPENDIX A
APPENDIX B
72
73
74
86
88
92
93
94
103

Fig. 1.
Fig. 2.
Fig. 3.
Fig. 4.
iii
FIGURES
Specimen preparation flow chart.
Double-bay triaxial compression testing machine.
Triaxial test cell, pore pressure unit, volume change device.
; '
Bituminous-treated materials specimen test procedure
4
8
9
flow chart. 11
Fig. 5. Representation of data.
Fig. 6. Correlation matrix.
Fig, 7. Flow chart indicating variables used at minimum volume conditions for correlation determinations.
Fig. 8. Flow chart indicating variables used at maximum effective ~tress ratio conditions for cor~elation determinations.
Fig. 9. Regression lines of 10 psi tests, all materials minimum volume criteria.
Fig. 10. Regression lines of 20 psi tests, all materials
14
15
16
17
22
minimum volume criteria. 22
Fig. 11. Regression lines of 30 psi tests, all materials minimum volume criteria. 23
Fig. 12. Comparison of volumetric strain-axial strain charac-teristics, minimum volume criteria. 23
Fig. 13. Triangular chart for determining CORS at 10 psi lateral pressure. 31
Fig. 14. Triangular chart for determining CORS at 20 psi lateral pressure. 32
Fig. 15. Triangular chart for determining CORS at 30 psi lateral pressure. 33
Fig. 16. Average density vs CORS determined on the basis of volumetric strain-axial strain at minimum volume, 10 psi lateral pressure. 39
Fig. 17. Modulus of deformation at 10 psi lateral pressure vs volumetric strain-axial strain CORS at 10 psi minimum volume. 40

iv
Fig. 18. Volumetric strain vs axial strain at m1n1mum 10 psi lateral pressure, field mixes.
Fig. 19. Volumetric strain vs axial strain at minimum 10 p·si ·lateral pressure, 4% lab mixes.
Fig. 20. Volumetric strain vs axial strain at minimum 10 psi lateral pressure, 5% lab mixes.
Fig. 21. Volumetric strain vs axial strain at minimum 20 psi lateral pressure, field mixes.
Fig. 22. Volumetric strain vs axial strain at minimum 20 psi lateral pressure, 4% lab mixes.
) Fig. 23. Volumetric strain vs axial strain at minimum
20 psi lateral pressure, 5% lab mixes.
Fig. 24. Volumetric strain VS axial strain at minimum 30 psi lateral pressure, field mixes.
Fig. 25. Volumetric strain vs axial strain at minimum 30 psi lateral pressure, 4% lab mixes.
Fig. 26. Volumetric strain vs axial strain at minimum 30 psi lateral pressure, 5% lab mixes.
volume,
volume,
volume,
volume,
volume,
volume,
volume,
volume,
volume,
Fig. 27. Volumetric strain vs axial strain at minimum volume, 10, 20 and 30 psi lateral pressures, untreated,
Page
43
43
44
44
45
45
46
46
47
optimum moisture content. 47
Fig. 28. Effective stress ratio vs cohesion at maximum effective stress ratio, 10 psi lateral pressure, field mixes.
Fig. 29. Effective stress ratio vs cohesion at maximum effective stress ratio, 10 psi lateral pressure, 4% lab mixes.
Fig. 30. Effective stress ratio vs cohesion at maximum effective stress ratio, 10 psi lateral pressure, 5% lab mixes.
Fig. 31. Effective stress ratio VS cohesion at maximum effective stress ratio, 10 psi lateral pressure, untreated, optimum moisture content.
Fig. 32. Triangular chart for determining CORS at 10 psi lateral pressure, maximum effective stress ratio criteria.
53
54
55
.56
58

v
Fig. 33. Effect of fines content on strain rates, Garner stone.
Fig. 34. Effect of fines content on strain rate, Bedford stone.
Fig. 35. Axial strain at 100 cycles vs fines content, Garner stone.
Fig. 36. Axial strain at 100 cycles vs fines content,
76
77
79
Bedford stone. 80
Fig. 37. Effect of dwell time on axial strain-fines content relationship, Garner stone. 82
Fig. 38. Effect of axial load on <i.Xial strain-.fines content relationship, Garner stone.
Fig. 39. Maximum stress ratio-maximum desirable fines content relationship.
84
85

vi
TABLES
Table 1. Optimum Moisture-Density Relationships for the Untreated Materials, by Vibratory Compaction.
Table 2. Material Properties and Related Variables.
Table 3. Regression Results.
Table 4. Average Dry Densities, pcf.
Table 5. Shear Strength Parameters at Minimum Volume.
Table 6. CORS Determined on the Basis of Volumetric StrainAxial Strain Relationships at Minimum Volume and
7
18
21
25
28
10 psi Lateral Pressure. 34
Table 7. CORS Determined on the Basis of Volumetric StrainAxial Strain Relationships at Minimum Volume and 20 psi Lateral Pressure. 35
Table 8. CORS Determined on the Basis of Volumetric StrainAxial Strain Relationships at Minimum Volume and 30 psi Lateral Pressure. 36
Table 9. Coefficients of Relative Strength (CORS) Determined from Single Variables.
Table 10. Coefficients of Relative Strength (CORS) Determined
49
from Single Variables. 50
Table 11. CORS Determined on the Basis of Effective Stress Ratio-Cohesion Relationship at Maximum Effective Stress Ratio Criteria, 10 psi Lateral Pressure. 60
Table A-1. Triaxial Test Results for Asphalt Cement-Treated Specimens at Minimum Volume (MV) and Maximum Ef-fective Stress Ratio (MESR) Conditions. 94
Table A-2. Triaxial Test Results for Optimum Moisture-Treated Specimens at Minimum Volume (MV) and Maximum Ef-fective Stress ratio (MESR) Conditions. 101
Table B-1. Correlation Matrix, Bituminous-Treated Field Mixes, Minimum Volume Conditions, 10 psi Lateral Pressure. 102
,..

1. INTRODUCTION AND OBJECTIVES
Performance of a flexible pavement structure is related to the
physical properties and supporting capacity of the various structural
components. The AASHO Interim Guide for the Design of Flexible Pavement
Structures, based on the pavement performance-serviceability concept
developed from the AASHO Road Test, utilizes the physical properties
and supporting capacity of granular base materials through an evaluation
of the materials coefficient of relative strength. The term coefficient
of relative strength implies that materials vary in their physical
properties, thus affecting the supporting capacity of the pavement
structure. The coefficients developed from.the AASHO road test are
indicative of a materials variance.
The first phase of this research project related Iowa materials to
' those used in the AASHO Road Test, establishing material coefficients
of relative strength for use with the AASHO interim design procedure
for flexible pavements. The test method and analyses utilized relied
heavily on those factors influencing the stability of granular base
course mixes developed under Iowa Highway Research Board project HR-991
The second phase of this project centered predominantly around the
response of asphalt-treated granular base materials to repetitive loads.
The equations developed from this study provide a more rational basis
for further studies of factors affecting deformation of granular
materials under stress conditions similar to those of a pavement sub-
jected to transient traffic loads.

2
2. PHASE 1: COEFFICIENTS OF RELATIVE STRENGTH
K. L. Bergeson, J. M. Hoover, D. E. Fox*
On the basis of laboratory tests only, coefficients of relative
strength (hereinafter referred to as CORS) for various bituminous
treated and untreated Iowa base course materials were determined. The
CORS established for the bituminous treated and untreated AASHO Road
Test base materials were utilized as the comparative control values.
2.1. MATERIALS
Twenty-one materials of varying aggregate types and sources were
studied, All untreated aggregates and bituminous treated field mixes
were furnished through cooperation of the office of the Research Engineer,
Iowa State Highway Commission (ISHC).
Bituminous-treated field mixed samples were obtained by ISHC
personnel from construction batch plants immediately following mixing
with asphalt. Aggregates used for all laboratory mixes were obtained
by sampling prior to hatching or from stockpiled materials. Asphalt
cement for the laboratory mixes, penetration grade 120-150, was also
furnished by the ISHC.**
Samples of AASHO Road Test base material were provided in a limited
quantity as obtained from the Road Test site. The base ·material included
-!<Respectively, graduate research assistant, associate professor and graduate research assistant, Civil Engineering Department and Engineering Research Institute, Iowa State University.
**Results of ASTM Standard D2171, asphalt viscosity-tem~erature tests were as follows: 77°F, 6.25 X 10⁵ poises; 100°F, 4.41 X 10 poises; 140°F, 9.50 X 10² poises; and 212°F, 20.1 poises.

3
a hard dolomitic limestone, recommended by the ISHC for use in an un-
treated condition, and a coarse graded gravel, recommended for use in
a bituminous treated condition.
Appendix A summarizes all materials tested, test results and testing
conditions as obtained from the study presented herein plus portions of
data supplied for each aggregate by the ISHC.
2.2. SPECIMEN PREPARATION
2.2.1. Compaction
All 4-in. diameter by 8-in. high cylindrical test specimens were
prepared by a vibratory compaction procedure utilizing a Syntron model
V-60 electromagnetic vibrator operating at a constant frequency of
3600 cycles/min and amplitude of 0.368 mm, a surcharge weight of 35 lb, I
and a vibration duration of 2 min. This procedure, previously reported
by Hoover1 , minimizes aggregate degradation and segregation while
producing uniform densities comparable to other methods. Figure 1
summarizes the specimen preparation procedure.
All densities given in this report are on the basis of weight per
unit volume and were obtained by unimmersed height, diameter, and
weight measurement of each specimen. As a means of comparison, a number
of specimens of several bituminous treated field mixes were immersed in
distilled water for volumetric measurement. The densities thus
calculated compared favorably with the Marshall compaction densities
supplied by the ISHC for each field mixed material.

FlEW MIXES
4
LABORATORY MIXES
SIEVE ANALYSIS OF AGGREGATES
COMBINING AND MIXING OF AGGREGATES
SIEVE ANALYSIS OF AGGREGATE MIXTURES
HEATING Of. AGGREG~TE AND ASPHALT . TO 25Q-260 F
MIXING OF AGGREGATES AND ASPHALT
HEATING OF SPECIMEN SIZE PORTIONS OF MIXES UNTIL 250-260°F TEMPERATURE WAS
MAINTAINED o
MOLDING OF TEST SPECIMENS IN HEATED MOLD
WEIGHING AND MEASURING OF SPECIMENS
CURING OF SPECIMENS
WEIGHING AND MEASURING PRIOR TO TRIAXIAL TEST
Fig. 1. Specimen preparation flow chart.
2.2.2. Bituminous-Treated Materials
Laboratory and field mixed materials were molded and tested in a
similar manner. The major difference was in the initial preparation
and combining with asphalt of the laboratory mixes, of known gradation,
and then molding as a one step operation. The field mixed samples,
by contrast, had to be reheated from a previously mixed condition arid
relatively unknown gradation and asphalt content •.
Field Mixes. Field mixed materials were separated into specimen-
sized portions and heated to 250-260°F. The mixture was placed in the
heated vibratory mold in three equal layers, each layer being rcidded

5
25 times with a 3/4-in. diameter rounded tip rod. The surcharge weight
was set in place and the specimen compacted. Following compaction the
height of the specimen was measured while the sample was in the mold.
The specimen was extruded, weighed and allowed to cool before being
transferred to the curing room. Curing was maintained for a minimum
of seven days at about 75°F. Prior to testing all samples were re
measured and reweighed.
Laboratory Mixes. Aggregates for the lab-mixed bituminous-treated
materials were blended in accordance with ISHC recommended proportions.
Sieve analyses were performed on the blended material and results
compared with the recommended gradation. The blend was adjusted, if
needed, to meet recommended gradation within +2% of each individual
sieve fraction.
Specimen-sized portions of blended material and asphalt were
.heated in controlled temperature ovens until a temperature of 250-
2600F was maintained. Two specimen-sized samples were combined and
mixed in a mechanical mixer whose bowl and mixing head were heated
before the addition of aggregate and asphalt. The mixing head consisted
of a rotating paddle and scraper attachment to minimize loss of fine
material by adherence to bowl sides.
After mixing, the material was separated into specimen-sized
portions and returned to the oven until a temperature of 250-260°F was
maintained throughout. Specimens were then molded, extruded, weighed
and cured in the same manner as the field-mixed specimens.
AASHO Control Mix. AASHO coarse graded gravel material, to be used
in a bituminous treated condition, was separated into individual sieve

6
fractions and blended in accordance with HRB Special Report 61B,
Table 37, page 74. A sieve analysis was performed on the blend which
was then adjusted to within one standard deviation from the AASHO
mean gradation for bituminous-treated base material. Test specimens
were molded at 5% asphalt content. Mixing, molding and curing
conditions were the same as for laboratory-mixed bituminous-treated
specimens.
2.2.3. Untreated Materials
Laboratory Mixes. Seven materials were selected for use in an
untreated condition, as representative of the various aggregate
types, Each was blended and adjusted in the same manner as the
laboratory-mixed bituminous-treated materials. Upon completion of the
blending process a portion of each sample was quartered and a moisture
density curve established for that material utilizing the vibratory
compactor. Table 1 summarizes optimum moistures and dry densities
determined for the untreated materials.
The remainder of each material sample was quartered into specimen
sized portions and weighed to a predetermined figure that would yield
a 4-in. diameter by 8-in. high specimen, plus about 200 g for moisture
content determination. An appropriate amount of distilled water, as
determined from the moisture-density curve, was added to the sample and
thoroughly mixed. The sample was introduced into a humid atmosphere
and remained undisturbed for at least five minutes. It was then remixed,
covered and allowed to stand an additional five minutes or more. The
sample was introduced into the compaction mold and compacted in a manner
similar to the bituminous-treated specimens, the only difference being
•

7
Table 1. Optimum Moisture-Density Relationships for the Untreated Materials, by Vibratory Compaction.
Optimum moisture, Dry density, Material % pcf
429 7.3 137.3
479 9.4 132.9
1485 7.3 131.4
1676 8.0 135.4
1846 7.0 140.0
1855 6.7 143.0
1904 5.3 144.0
that moisture samples were taken before the se'cond and third layers
were introduced into the mold.
Upon completion of compaction the height of" the specimen was
measured while in the mold. The specimen was extruded, weighed,
wrapped in two layers of saran wrap and sealed with a taped layer of
aluminum foil. Specimens were transferred to a curing room maintained
at about 75°F and 100% relative humidity until testing. Prior to
testing all samples were remeasured and reweighed.
AASHO Control Mix. The untreated AASHO crushed limestone material
was separated into individual sieve fractions and then blended in ac-
cordance with HRB Special Report 61B, Table 31, page 68. The blend was
subjected to successive sieve analyses and adjustments until it was
within one standard deviation from the AASHO mean gradation for un-
treated crushed limestone base material. Specimens were molded at 6% ·
moisture content.

8
Mixing, molding and curing methods were the same as for laboratory
mixed untreated materials.
2.3. TESTING PROCEDURE
This investigation utilized the consolidated-undrained triaxial
shear test for all specimens. All testing was performed in the twin-bay
triaxial compression machine shown in Figs. 2 and 3. The unit was
Fig. 2. Double-bay triaxial compression testing machine.
designed by the Engineering Research Institute (ERI) Soil Research
Laboratory and constructed by ERI Fabrication Shop. Two specimens may
be tested simultaneously under different lateral pressures but at the

9
Fig. 3. Triaxial test cell, pore pressure unit, volume change device.
same deformation rate. Each cell has an axial load capacity ofll,OOO lb
delivered to the specimen through calibrated proving rings. Deforma
tion rates may be varied from 0.0001 to 0.1 in./min. Pore pressures
are measured by a Karol-Warner Model 53-PP pore pressure device measuring
10
both positive and negative pore pressures. Specimen volume changes
. 3 can be measured to a precision of 0.01 in.
All·testing in this study was conducted at a deformation rate
of 0.01 in./min. A minimum of four tests were performed within each
material type (Field mix, 4% Lab mix, 5% Lab mix, and selected un-
treated mixes) at· 10, 20, 30, and 40 psi lateral pressure. Once a
series had been started in a cell for a particular material type, re-
maining tests were also performed in that cell to minimize cell varia-
tions.
2.3.1. Bituminous-Treated Materials
Immediately prior to testing, each specimen was removed from the·
curing room, reweighed, and the height and diameter remeasured. The
specimen was placed in a vacuum jar filled with distilled water and sub-
jected to a vacuum of about 29 in. Hg for a minimum of 45 min. Upon
completion of saturation the sample was transferred to a preheated
water bath and maintained at lQOOF until testing. The specimen was then
placed in the cell with saturated 1/2-in. corrundum stones on the top
and bottom and enclosed by a 0.025-in. thick seamless rubber membrane.
The cell was filled with de-aired distilled water and a circular coil
cell heater, located at the base of the cell, was turned on. The heater
was manually controlled by a powerstat voltage regulator. Thermocouple
wires, inserted through the top of the cell and connected to a potentiometer,
provided temperature monitoring. The temperature was maintained at
100 + 1°F for a minimum of 30 min after which the specimen was
consolidated, drainage being permitted, under cr3
lateral pressure for

11
a minimum of 36 min prior to shearing. Volume change, and deflection
data were recorded during consolidation. The specimen was then
sheared, drainage not being permitted, under constant lateral pressure
and temperature. The pore pressures, volume change and axial load
were recorded at vertical deflection intervals of 0.01 to 0.20 ~n.,
. every 0.025 to 0.400 in., every 0.05 to 0.60 in. deflection. The
test was normally terminated at or less than 0.6 in. deflection, which
is great enough to create more than maximum cr1
for each confining
pres sure with all mixes.
Figure 4 sununarizes the bituminous-treated materials specimen
test procedure.
SPECIMEN SATURATED UNDERWATER IN VACUUM JAR BY APPLYING FULL VACUUM
FOR MINIMUM OF 45 MIN A
I SPECIMEN PREHEATED UNDERWATER TO 100~
SPECIMEN PLACED IN TRIAXIAL CELL
CELL FILLED WITH DE-AIRED WATER. CELL HEATER TURNED ON AND 100°F. TEMPERATURE MAINTAINED
FOR AT LEAST 30 -MIN PRIOR TO AND DURING TESTING
SPECIMEN CON SO UDATED UNDER OJ LATERAL PRESSURE FOR MINIMUM OF 36 MIN. VOLUME
CHANGE DATA RECORDED o
.SPECIMEN SHEAREDo VOLUME CHANGE, AXIAL LOAD, DEFORMATION, AND PORE PRESSURE DATA RECORDED o
I TRIAXIAL TEST COMPLETE o
Fig. 4. Bituminous-treated materials specimen test procedure flow chart.

12
2.3.2. Untreated Materials
The test procedure was similar to that for asphalt-treated materials
except that (a) the specimens could not be saturated, and (b) were no.t
heated, but maintained at room temperature.
2.4. METHODS OF ANALYSIS
2.4.1. Failure Criterion
Results of this investigation were analyzed on the basis of two
criteria of failure:
(a) Minimum volume (MV), defined as that point of loading at which
the specimen has consolidated to its smallest volume during triaxial
shear. As the specimen is loaded, volume decreases to some minimum
value and pore pressure in the undrained specimen increases to its
maximum positive value. It is believed that at this point failure has
begun and may be considered a "proportional limit" when viewed in
conjunction with a stress/strain curve. On further axial loading
volume increases, and interparticle sliding and/or crushing will
begin. Pore pressur~ will also decrease. Further illustrations of
2 3 this concept are presented by Fish and Hoover and Ferguson and Hoover •
(b) Maximum effective stress ratio (MESR), defined as
in a triaxial shear test at which the effective stress ratio
t~at p~int
(Jl - CJ3 • ~s
CJ3
at a maximum. Effective stresses are intergranular stresses corrected
for pore pressures. At MESR the specimen volume has increased sub-
stantially and negative pore pressures normally exist. Further illustra-
2 tions of this concept are presented by Fish and Hoover and Best and
4 Hoover .

13
2.4.2. Calculations
A Fortran IV program, developed for the IBM 360/65 computer, was
used to determine stress, strain, volume change, and pore pressure
conditions at each data point in the shear portion of the triaxial
test.* This program was also capable of producing plots of effective
stress ratio, percent volume change and pore pressure versus percent
axial strain, utilizing a Calcomp Digital Incremental Plotter. The
program was designed so that initial calculated results were stored
in the computer memory and could be further manipulated by using
subroutines. In this manner values of cohesion, friction angle,
modulus of deformation2, and Poisson's ratio were determined from
each series of tests and output, at the appropriate failure criterion
being investigated. The printed output and graphical data were used
in the analyses of test results. A summary of test results is
presented in Appendix A.
2.4.3. Statistical Analysis
In the initial phases of this study it was recognized that some
means must be sought to adequately analyze the tremendous volume of
results being generated. One means investigated was the statistical
method of factorial analysis5
This method has recently been used by
hydrologists and agronomists to analyze a large number of observations
of a particular set of variables describing a specific system. The
>'<Copies of the computer program will be supplied to sponsors of the project upon request. Due to size of the program, it was not included in this report.

14
purpose of factorial analysis is to statistically manipulate data and
extract that combination of variables that is contributing the most
common variance to the system. The mechanics of this process becomes
highly complex and the interpretation of results therefrom have been
. d6 quest1.one As an initial step in factorial analysis, however, the
variables involved are put into what is termed a correlation matrix.
This is simply a matrix of correlation coefficients between all possible
pairs of variables involved. For example consider Fig. 5.
VARIABLE K K = 1 o o , n· 2 3 o n 0 0
x, 1 1 x,, 2 X 1, n
x2, 1
..., 0
0
0
N XN 1 X (1 N,n
Fig. 5. Representation of data.
The mean value of any variable K with N observations of that
variable is
If we define
X. k J'
~X. k(j = 1 :· N)
N

15
then for any two variables K and K the coefficient of correlation as X y
given by Spiegel6 is:
r X. k(K )x. k(K ) J, X J, y r = ----~~----------~--~--~-= 2 2 1/2 .
[(~ x. k(K ))(~ x. k(K ))J J, X J, y
The correlation coef.ficients determined for all the variables are put
into matrix form as indicated in Fig. 6.
~ 2 wt! ....I ' .:a,.... <(II 0:::~
~ 3 0
0
0
n
1
r2, 1
r3, 1
r 1 n,
VARIABLE K K-= 11 n
2 3 o ., o n
1
r3 2 1 I
r 2 r 3 1
n, A,
Fig. 6. Correlation matrix.
Thus this initial step in factorial analysis is in itself an ap-
propriate tool for determining if significant linear relationships
exist among large numbers of variables. The coefficient of correlation
is a very good measure of linear correlation between two variables
because it remains the same regardless of whether K or K is considered X y
the independent variable. The IBM 360/65 program utilized for computing
the correlation matrices was obtained from the Statistical Laboratory
at ISU. It should be emphasized that the correlation coefficients
developed are indicative of linear trends only. A low correlation

MIX TYPE
16
coefficient as used in this report means only that no significant linear
trend exists and consequently a nonlinear relationship may possibly
exist. The coefficient may vary from + 1 to - 1. A positive value
indicates positive linear correlation, a negative value indicates
negative linear correla~ion. A value of zero indicates no correlation
at all.
A flow chart indicating the variables- used for the correlation
matrix at minimum volume failure criteria is as indicated in Fig. 7.
9 10 11 12 13 14 15
FIELD MIX 1 0 psi - ES R 1 PP 1 £ 1 V 1 D; M 1 IJ 1
4% LAB 2 3 4 5 6 7 8
20 psi - ES R , PP, £ , V, D, M 1 IJ, MIX
% S SP c, M, l-l2 AC ,EQ,-#200, G, ¢, OR
5% OPT LAB Mt 30 psi- ESR, PP, £ , V, D, M, IJ, MIX
OPT MC
Fig. 7.
40 psi - ESR, PP, (, V, D, M, IJ,
Flow chart indicating variables used at minimum volume conditions for correlation determinations.
Correlation matrices were produced separately for the field mixes,
4% laboratory mixes, 5% laboratory mixes, and the untreated mixes, at
10, 20, 30, and 40 psi lateral pressures. Appendix B presents one
illustration of the correlation matrices used in this study. Figure 8
MiX TYPE
FIELD MIX
4% LAB MIX
5% lAB MIX
OPT MC
17
7 8 9 10 11
10 psi- ESR, PP, £ 1 V, D
2 3 4 5 6 20 psi- ESR 1 PP 1 f.,V 1 D
% S SP AC I EQ,- #2001 G, ¢, c OR OPT MC 30 psi- ESR 1 PP, £ , V, D
40 psi - ESR 1 PP, f. 1 V, D
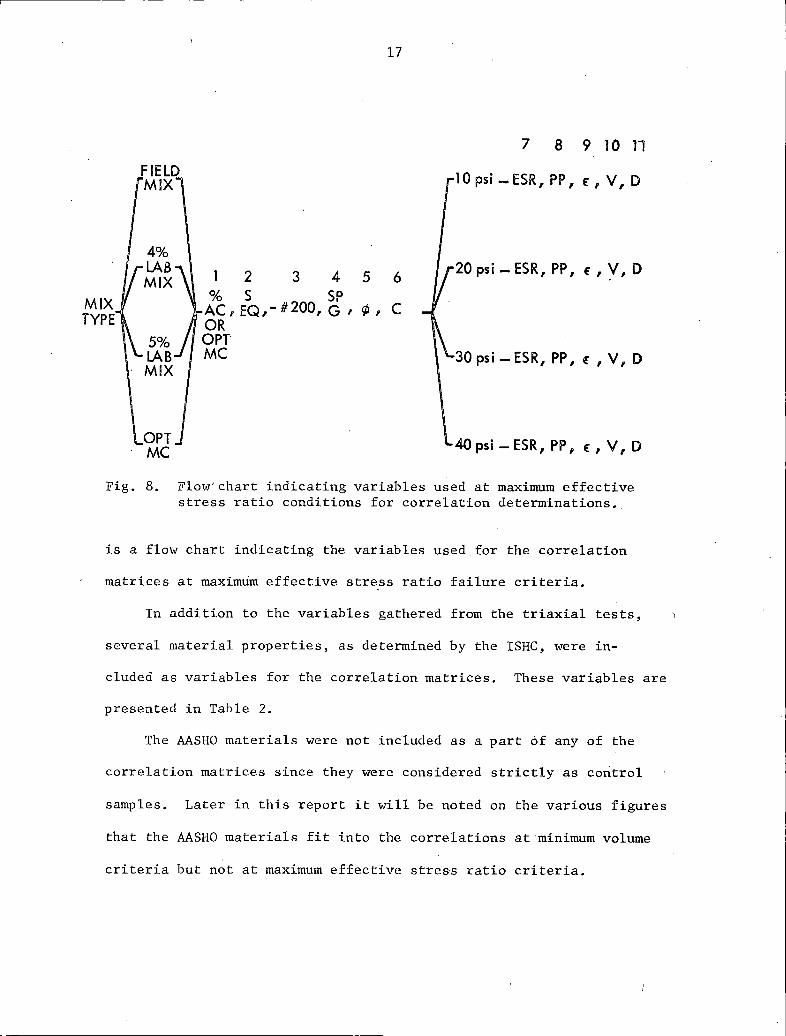
Fig. 8. Flow'chart indicating variables used at maximum effective stress ratio conditions for correlation determinations.
is a flow chart indicating the variables used for the correlation
matrices at maximum effective stress ratio failure criteria.
In addition to the variables gathered from the triaxial tests,
several material properties, as determined by the ISHC, were in-
eluded as variables for the correlation matrices. These variables are
presented in Table 2.
The AASHO materials were not included as a part of any of the
correlation matrices since they were considered strictly as control
samples. Later in this report it will be noted on the various figures
that the AASHO materials fit into the correlations at minimum volume
criteria but not at maximum effective stres-s ratio criteria.

18
Table 2. Material Properties and Related Variables.
Material number
429
479
728
1241
1269
1485
1676
1677
1743
1746
1750
1751
1788
1822
1846
1855
1903
Specific a gravity
2.660
2.695
2.694
2.690c
2.690c
2.680c
2.652
2.680
2.650
2.642
2.684
2.684
2. 743
2. 762
2.666
2.753
2. 720
Sanda equivalent
32
69
36
50
36
32
25
25
42
67
43
56
60
Minus {f200 lab mixes,
%
10.2
10.7
6.4
6.7
8.4
6.1
10.7
9.0
3.6
11.6
9.6
9.6
7.3
11.8
7.0
9.4
7.9
Minus {fo200a field mixes,
%
7.1
9.1
8.0
8.0
8,0
4.6
10.0
8.6
6.5
10.0
8.9
9.9
8.1
7.8
5.4
11.0
8.1
aValues for these variables are ISHC determinations obtained from the material identification sheets.
b Values for these materials were obtained by using the average sand
equivalent of all materials.
cThese are corrected values supplied by the ISHC. Incorrect values were used in the initial correlation determinations.

19
Table 2. Continued.
Minus 1/:200 Minus 11200 Material Specific
a a lab Sand mixes, field mixes,
number gravity equivalent % %
1904 2.720 60 7.9 8.3
2318 2.679 72 8.8 8.9
2Sl4 2.669 so 7.6 6.8
2SlS 2.669 so 7.6 6.8
The primary purpose of this phase of analysis was to determine
which pair, or pairs, of variables exhibited a significant degree
of correlation and was consistent between the various materials. The
value of these variables could then be compared to the value·of the
same variables of the MSHO control mixes and ranked accordingly, in
order to obtain the coefficient of relative strength (CORS).
2.S. RESULTS
2.S.l. Minimum Volume Criteria
Investigation of correlation matrices developed for the various mix
types (field mix, 4% laboratory mix; S% laboratory mix and untreated
mixes) at minimum volume failure conditions, indicated the highest
degree of correlation was obtained between volumetric strain~·: and axial
~·:volumetric strain is defined as percentage ratio of UI"\it volume change to original volume at start of shear phase of triaxial test. Volumetric strain thus referred to herein is the volumetric strain at the point of minimum volume failure criteria.
20
strain*. Such correlations were consistent for all lateral pressures
within each mix type and between mix types.
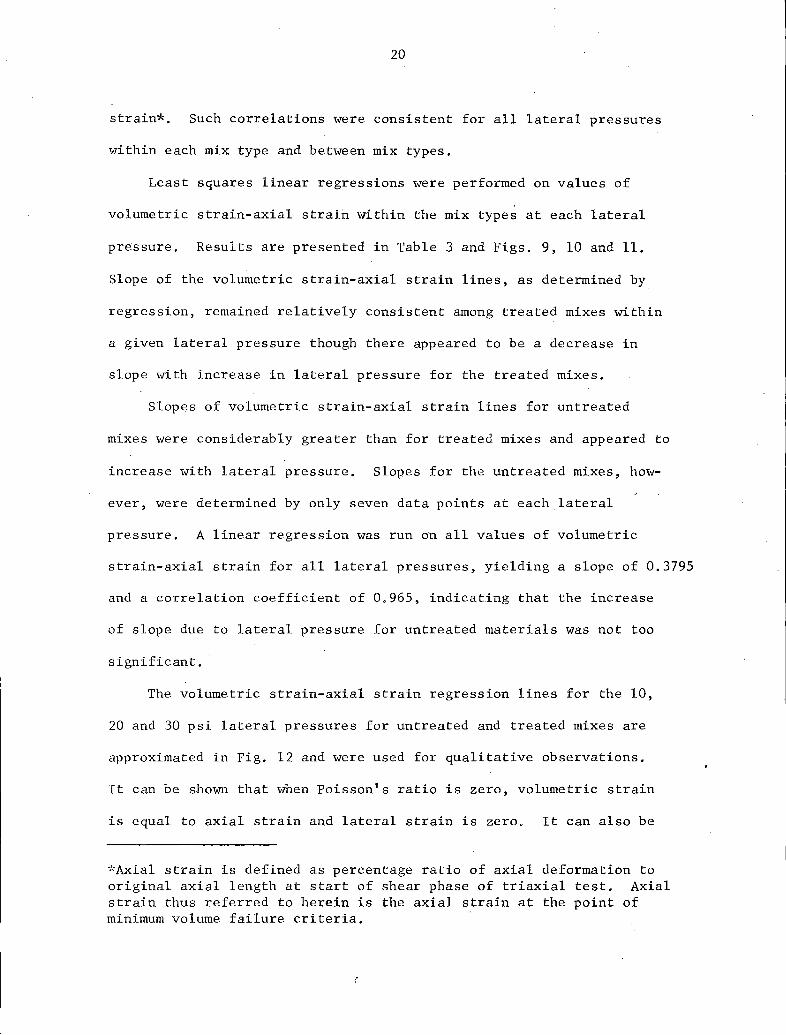
Least squares linear regressions were performed on values of
volumetric strain-axial strain within the mix types at each lateral
pressure. Results are presented in Table 3 and Figs. 9, 10 and 11.
Slope of the volumetric strain-axial strain lines, as determined by
regression, remained relatively consistent among treated mixes within
a given lateral pressure though there appeared to be a decrease in
slope with increase in lateral pressure for the treated mixes.
Slopes of volumetric strain-axial strain lines for untreated
mixes were considerably greater than for treated mixes and appeared to
increase with lateral pressure. Slopes for the untreated mixes, how-
ever, were determined by only seven data points at each lateral
pressure. A linear regression was run on all values of volumetric
strain-axial strain for all lateral pressures, yielding a slope of 0.3795
and a correlation coefficient of 0.965, indicating that the increase
of slope due to lateral pressure for untreated materials was not too
significant.
The volumetric strain-axial strain regression lines for the 10,
20 and 30 psi lateral pressures for untreated and treated mixes are
approximated in Fig. 12 and were used for qualitative observations.
It can be shown that when Poisson's ratio is zero, volumetric strain
is equal to axial strain and lateral strain is zero. It can also be
>'<Axial strain is defined as percentage ratio of axial deformation to o~iginal axial length at start of shear phase of triaxial test. Axial strain thus referred to herein is the axial strain at the point of minimum volume failure criteria.

21
Table 3. Regression Resultsa.
Material Lateral Correlation type pressure Intercept Slope coefficient
Field 10 - 0.016 - 0.243 0.855 mix
20 - 0.012 - 0.234 0.841
30 - 0.030 - 0.190 0.948
40 - 0.022 - 0.228 0.931
4% lab 10 - 0.017 - 0.243 0.816 mix
20 - 0.026 - 0.203 0.943
30 - 0.050 - 0.179 0.973
40 - 0.048 - 0.186 0.986
5% lab 10 - 0.006 - 0.267 0. 722 mix
20 - 0.010 - 0.241 0.860
30 - 0.049 - 0.167 0.881
40 - 0.060 - 0.191 0.945
Optimum 10 - 0.094 - 0.118 0.400 moisture content 20 - 0.028 - 0.321 0.903
30 0.023 0. 353 0.899
40 - 0.012 - 0. 377 0.966
aAASHO values were not included in the regressions.

22
-OG~~----------------------------~------------------~
-UNTREATED --4% LAB --· 5% LAB ······FIELD MIX
0.1 0.2 0.3 0.4 0.5 0.6 AXIAL STRAIN,%
0.8
Fig. 9. Regression lines of 10 psi tests, all materials minimum volume criteria.
-0.40r---------------------------------------------------~
-UNTREATED -- 4% lAB -·· 5% lAB •·· • · FIELD
~- 0.16 w
~- 0.12 ...J
~.- 0.08
- 0.04
0.1 0.3 0.4 0.5 0.6 AXIAL STRAIN I %
0.7
Fig. 10. Regression lines of 20 psi tests, all materials minimum volume criteria.

23
-0040~------------------------------------~------------~
-UNTREATED -- 4% lAB --· 5% LAB ....... FJELD
--· ' ...... ---~:;,~-- -·~---,;;......·-~ --~~· ........... .. ---...,..,--
-~r:J~· -~-~_.,.. AASHO TREATED
~~··· .....
OoOO.L---~----~-----L----~----~----L---~----~----~--~
OoO Ool 0.2 Oo3 Oa4 Oo5 0.6 Oo? 0.8 Oo9 loO AXIAL STRAIN, o/o
Fig. 11. Regression lines of 30 psi tests, all materials minimum volume criteria.
/ /
/ /
0.1
/ /
/
~OISSON 1S RATIO= 0
UNTREATED MATERIALS REGRESSIONS (APPROXIMATE)
BITUMINOUS TREATED MATERIALS REGRESSIONS
(APPROXIMATE)
Oo4 Oo5 Oo6 AXIAL STRAIN, o/o
LO
_Fig. 12. Comparison of volumetric strain-axial strain characteristics, minimum volume criteria.

24
shown that when Poisson's ratio equals 0.5, volumetric strain-is zero
·(incompressible) and axial strain equals twice the lateral strain.
These conditions are shown on Fig. 12.
Untreated materials exhibited greater slopes than treated materials
indicating that at a given value of axial strain the amount of volume
decrease is greater for the untreated materials. It also indicates that
both materials exhibited a limited amount of lateral strain although
volume was decreasing. Treated materials underwent more lateral strain,
at a given ax':ial strain, than untreated materials.
The variation in slopes between the untreated and treated materials
can be attributed to (a) test temperature (the treated materials were
tested at 100°F), (b) the density difference from untreated to treated
condition, (c) degree of saturation, or (d) the asphalt content. If it
is assumed that the temperature difference at testing was the cause of
the deviation, such should allow the asphalt treated specimens to undergo
volume decrease without lateral strain easier than if tested at room
temperature. This, however, would only tend to lessen the deviation
sine~ if temperature is contributing, it is tending to equalize and not
cause the variance.
Dry densities of the untreated specimens were generally higher
than those of treated specimens of the same material as indicated in
Table 4. This is probably due to the asphalt increasing specimen
volume by separation of soil particles with a film of asphalt and fines,
thereby decreasing the specimen weight. Also, the cohesive property of
asphalt ,does not allow as much freedom for particle reorientation during
compaction as water in the untreated specimens.

25
Table 4. Average Dry Densities, pcfa.
Material Field 4% lab 5% lab Untreated
429 129.3 129.4 130.3 136.5
479 124.8 125.1 126.2 131.2
1485 128.8 127.3 130.4 127.6
1676 127.6 124.8 128.4 132.1
1846 133.3 132.8 134.7 135.5
1855 129.3 134.0 133.5 138.0
1904 138.0 133.4 138.6
a Dry density of A.C. treated mixes computed on the basis of average
A.C. content.
If density is thus assumed to cause the deviation in volumetric
strain at a given vertical strain, it can be reasoned that the less
dense specimen of a given material would normally have a greater void
ratio and consequently should be able to undergo a volume decrease with-
out lateral strain easier than more dense specimens. This again would
tend to equalize the deviation and not contribute to it.
All field and lab mix bituminous-treated materials were vacuum
saturated. As previously indicated, the untreated material specimens
could not be saturated. The .latter was due to complete disintegration
of the specimens under vacuum saturation and severe flotation removal
of fines when capillary saturated.
Calculated degree of saturation of the untreated materials r~nged
from a low of less than 60% to near 95% saturation. Theoretically,
materials at a low percentage of saturation should undergo a greater
26
volumetric strain than materials at a higher percentage saturation.
No correlation was found between calculated degree of saturation and
volumetric strain. Instead, untreated materials of high saturation
exhibited both high and low volumetric strain. Similar data were
not~d for the low degree of saturation untreated materials.
Thus, by the process of elimination it can only be concluded
that the primary cause of deviation in regression slopes of the treated
materials to the untre~ted materials is the asphalt itself. It shpuld
not be concluded, however, that density and temperature have no effect
whatsoever. Instead, the effect of these variables would appear to
decrease the deviation. This behavior can possibly be explained by the
fact that the cohesive properties of the asphalt tend to lock the
individual particles together in a matrix of asphalt and fine material.
During the initial shear portion of a test, when the specimen is being
further consolidated, the particles are not as· able to reorient them
selves into a more compact state without a greater amount of lateral
strain than the untreated specimens, even though the latter are less
dense initially.
Referring again to Fig. 12, more solid materials such as concrete
mixtures will have slopes of volumetric strain-axial strain approaching
the line representing Poisson's ratio equal to zero. Such materials
exhibit very little lateral strain upon loading while stability is
primarily dependent on individual material properties. The other
extreme is fluids and fluid mixtures which are nearly incompressible and
will have slopes of volumetric strain-axial strain approaching Poisson's

27
ratio of 0.5. Fluids are entirely dependent upon lateral restraint to
support loads.
In Fig. 12 one can imagine a succession of lines beginning at
Poisson's ratio equal to zero and representing materials that derive
stability from individual material properties, to the line representing
Poisson's ratio equal to 0.5 and representing materials deriving their
stability primarily from lateral restraint. As the slope of this line
decreases, stability becomes more dependent on some form of lateral
restraint. Asphaltic concrete is a fluid-solid mixture and (from Fig. 12)
is more dependent on lateral restraint for stability than on individual
material properties.
3 Ferguson and Hoover in a study of cement treated granular base
materials advanced the hypothesis that the stability of untreated
granular bases may be a function of lateral restraint existing prior
to loading and its ability to increase the restraint through resistance
to lateral expansion. The results of this study appear to confirm this
hypothesis, extending it to include bituminous-treated base materials.
A study of the shear strength parameters of cohesion and friction
angle at minimum volume for the seven materials used in the treated
and untreated condition (Table 5) revealed that the addition of
asphalt generally reduced the angle of friction and slightly increased
cohesion but did not substantially alter overall shear strength charac-
teristics. This indicates that strength alone does not account for the
differences in stabilities of bituminous-treated and untreated base
materials.

28
Table 5. Shear Strength Parameters at Minimum Volume.
4% lab 5% lab Untreated c, ¢, c, ¢, c' ¢,
Material psi degrees psi degrees psi degrees
429 2.10 39.86 - 0.06a 42.69 - 4.51 45.18
479 - 1.15 42.05 1. 39 40.13 0.38 42.52
1485 - 0.16 33.54 1.84 32.01 1.15 38.93
1676 5.60 40.38 6. 71 35.71 3.00 41.79
1846 1. 04 37.60 2.38 36.31 - 1. 83 44.33
1855 1. 65 43.63 - 1. 35 44.15 - 3.16 46.55
1904 - 4.79 42.97 0.67 42.02
a . Negat1.ve values of cohesion are invalid and due in part to regres-sian.
A mechanism which may account, in part, for the stability differences
and may not be as nearly dependent on strength is suggested. Under
similar field conditions bituminous-treated materials will exhibit
more lateral strain per given amount of vertical strain than untreated
materials. This would give rise to greater lateral support from
adjacent material for the bituminous-treated materials, and hence
greater stability by virtue of being able to undergo lateral strain.
A study by Csanyi and Fung7 concluded that there was no dir.ect
relationship between performance of an asphaltic mix and its stability
regardless of the method used to determine stability. This indicates
that while asphaltic mixes may meet stability requirements and may
not fail in terms of shear, they may fail in performance from rutting
and channeling. It therefore seems that some measure of rutting ·
29
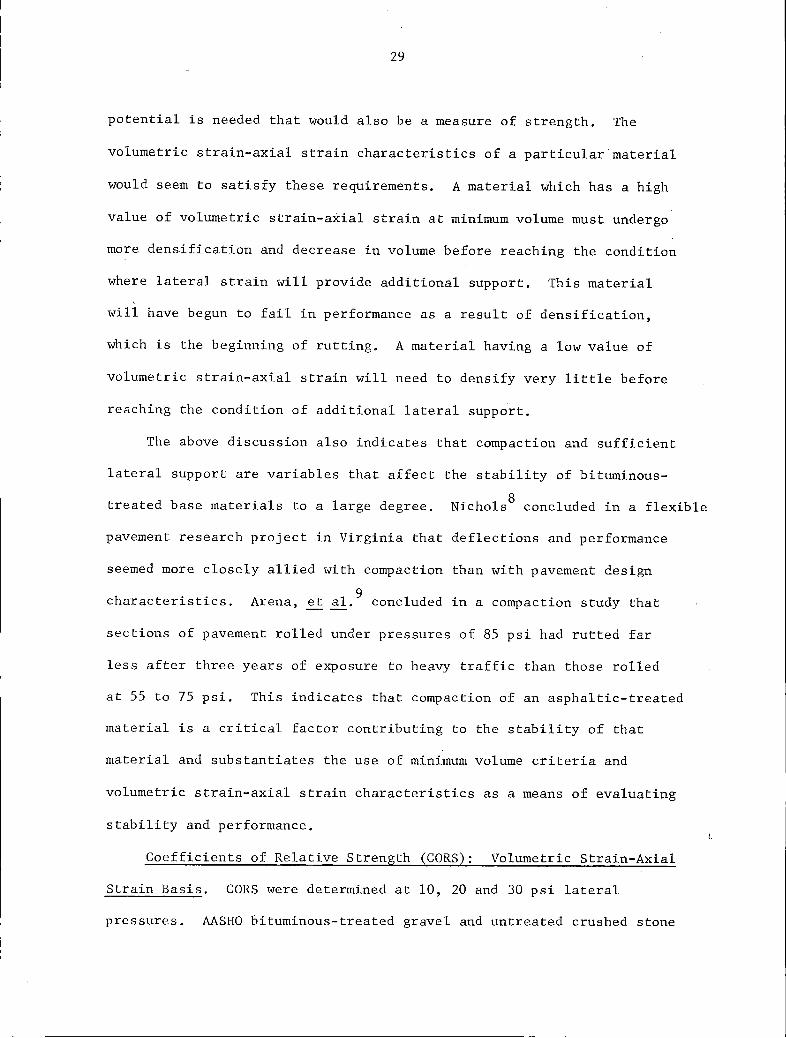
potential is needed that would also be a measure of strength. The
volumetric strain-axial strain characteristics of a particular material
would seem to satisfy these requirements. A material which has a high
value of volumetric strain-axial strain at minimum volume must undergo
more dens.ification and decrease in volume before reaching the condition
where lateral strain will provide additional support. This material
will have begun to fail in performance as a result of densification,
which is the beginning of rutting. A material having a low value of
volumetric strain-axial strain will need to densify very little before
reaching the condition of additional lateral suppo'rt.
The above discussion also indicates that compaction and sufficient
lateral support are variables that affect the stability of bituminous
treated base materials to a large degree. Nichols8 concluded in a flexible
pavement research project in Virginia that deflections and performance
seemed more closely allied with compaction than with pavement design
characteristics. 9 Arena, ~ al. concluded in a compaction study that
sections of pavement rolled under pressures of 85 psi had rutted far
less after three years of exposure to heavy traffic than those rolled
at 55 to 75 psi. This indicates that compaction of an asphaltic-treated
material is a critical factor contributing to the stability of that
material and substantiates the use of minimum volume criteria and
volumetric strain-axial strain characteristics as a means of evaluating
stability and performance.
Coefficients of Relative Strength (CORS): Volumetric Strain-Axial
Strain Basis. CORS were determined at 10, 20 and 30 psi lateral
pressures. AASHO bituminous-treated gravel and untreated crushed stone

30
were assigned CORS of 0.34 and 0.14 respectively in accordance with the
AASHO Interim Guide for the Design of Flexible Pavement Structures.
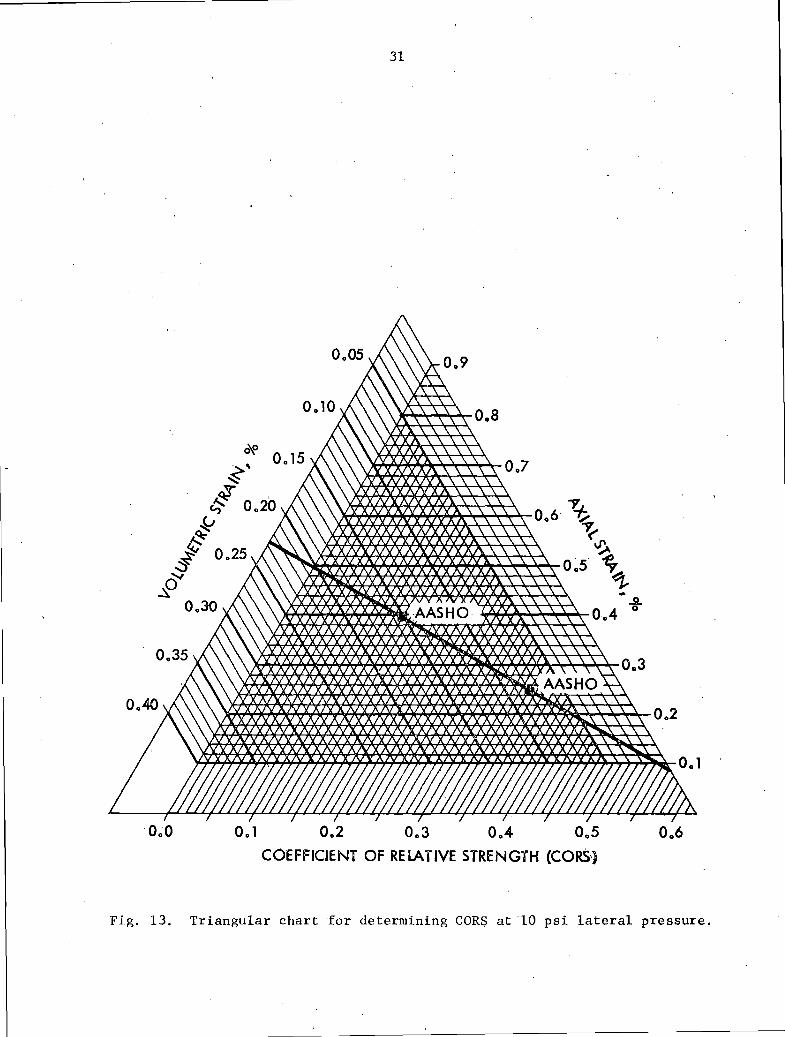
Each material was ranked according to its value .of volumetric strain-
axial strain (V-E), at minimum volume, on the triangular charts
shown in Figs. 13, 14 and 15- respectively the V-E minimum volume
vs CORS plots of 10, 20 and 30 psi lateral pressures. It is readily
noted that the final development of these charts relied on a straight-
line relationship between only two points of control; i.e., the two
AASHO samples recommended and supplied to the project. The charts
are used as follows:
a. Volumetric strain and axial strain, as computed from the
consolidated undrained triaxial shear test data at the point of minimum
volume during shear, are respectively entered from the left and right
sides of the chart.
b. At the intersection of the above values, a line is projected
down and to the left, to the CORS scale.
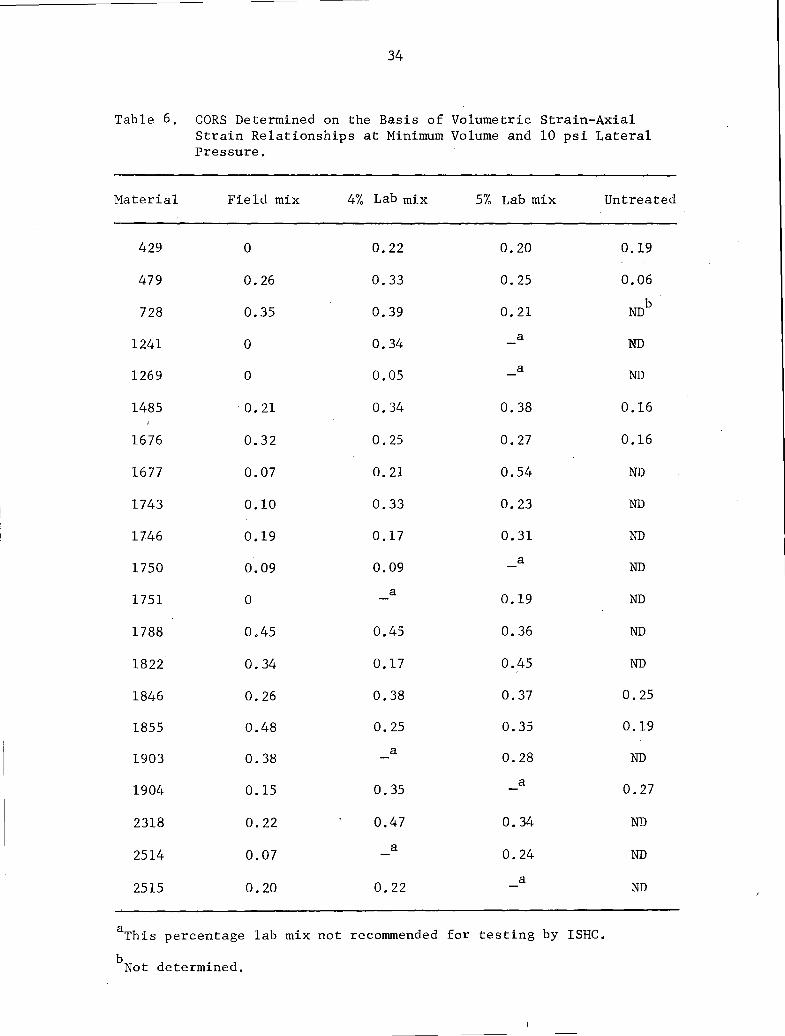
Tables 6' 7, and 8 summarize the CORS determined for each material
and mix type from Figs. 13' 14, and 15. >'c The validity of the CORS
thus determined, can only be fully ascertained after extensive analysis
of the pavement field performance where each material and mix type have
been used.
However, it is obvious from Tables 6, 7 and 8 that definite physical
property and supporting capacity differences exist among the various
materials and mix types. The CORS from untreated to either 4 or 5%
lab mix show that an optimum asphalt content could be significantly less
>'cSeveral CORS were determined as slightly negative values from Figs. 13, 14, and 15 but are.shown in Tables 5, 6, and 7 as zero.
31
0~0 0.'1 0.2 0.3 0.4 0.5
COEFFICIENT OF RElATIVE STRENGTH (CORS')
Fig. 13. Triangular chart for determining COR~ at 10 psi lateral pressure.

32
Jt+~~~~~-Oo 9
~ ~~~~AA~~~~ooal(
~
~~'Mt-!l~~~~~~~oo7\ ....2.. 0
.0. 0 o. 1 0.2 0.3. 0.4 0.5
COEFFICIENT OF RELATIVE STRENGTH (CORS)
Fig. 14. Triangular chart for determining CORS at 20 psi lateral pressure.

33
OaO Oal Oa2 Oa3 Oa4 COEFFICIENT OF RELATIVE STRENGTH (CORS)
Fig. 15. Triangular chart for determining CORS at 30 psi lateral pressure.
34
Table 6. CORS Determined on the Basis of Volumetric Strain-Axial Strain Relationships at Minimum Volume and 10 psi Lateral Pressure.
Material Field mix 4% Lab mix 5% Lab mix Untreated
429 0 0.22 0.20 0.19
479 0. 26 0.33 0. 25 0.06
728 0.35 0.39 0.21 NDb
1241 0 0. 34 a ND
1269 0 0.05 a ND
1485 . 0. 21 0.34 0.38 0.16
1676 0.32 0. 25 0.27 0.16
1677 0.07 0.21 0.54 ND
1743 0.10 0.33 0.23 ND
1746 0.19 0.17 0.31 ND
1750 0.09 0.09 a
ND
1751 0 a 0.19 ND
1788 0.45 0.45 0.36 ND
1822 0.34 0.17 0.45 ND
1846 0.26 0.38 0.37 0.25
1855 0.48 o. 25 0.35 0.19
1903 0.38 a 0.28 ND
1904 0.15 0. 35 a 0.27
2318 0.22 0.47 o. 34 ND
2514 0.07 a 0.24 ND
2515 0.20 0.22 a
ND
aThis percentage lab mix not recommended for testing by ISHC.
bNot determined.

35
Table 7. CORS Determined on the Basis of Volumetric Strain-Axial Strain Relationships at Minimum Volume and 20 psi L~teral Pressure.
Material Field mix 4% Lab mix 5% Lab mix
429 0.04 0 0.32
479 0.24 0.35 0.34
728 0.47 0. 25 0.35
1241 0.09 0.32 a
1269 0 0 a
1485 0.46 o. 36 o. 21
1676 0.24 0.35 0.38
1677 0.25 0.13 0.10
1743 0.22 0.34 0.21
i746 0.33 0.16 0.14
1750 0.23 0.12 a
1751 0.08 a o. 23
1788 0.45 0.43 0.27
1822 0.17 0.18 0.35
1846 0.27 0.28 0.31
1855 0.37 0.35 0.40
1903 o. 20 a I
0.45
1904 0.37 0.35 a
2318 0.45 0.45
2514 0.28 a 0.34
2515 0.16 0.24 a
aThis percentage lab mix not recommended for testing by ISHC.
bNot determined.
Untreated
0.14
0
NDb
ND
ND
0.18
0
ND
ND
ND
ND
ND
ND
ND
0
0.16
ND
0.21
ND
ND
ND

36
Table 8. CORS Determined on the Basis of Volumetric Strain-Axial Strain Relationships at Minimum Volume and 30 psi Lateral Pressure.
Material Field mix 4% Lab mix 5% Lab mix
429 0.15 0.22 0.28
479 0.34 0.29 0.37
728 0.31 0.34 0.47
1241 0.30 0.29 a
1269 0 0 a
1485 0,36 0.33 0.36
1676 o. 26 0.31 0.37
1677 0.18 0.06 ND
1743 0.29 0.32 0.07
1746 0.28 o. 26 0.29
1750 0.22 0 a
1751 0.22 a 0.06
1788 o. 25 0.34 0.31
1822 0.32 0.25 0.31
1846 0.29 0.37 0.32
1855 0.36 0.37 0.37
1903 0. 25 a o. 29
1904 0.33 0.33 a
2318 o. 35 0.33 0.34
2514 o. 29 a
0.29
2515 0.25 0.28 a
aThis percentage lab mix not recommended for testing by ISHC.
bNot determined.
Untreated
0.15
0.12
NDb
ND
ND
0. 28
0.12
ND
ND
ND
ND
ND
ND
ND
0.22
0.31
ND
0.30
ND
ND
ND

37
than 4% for some mixes, or higher than 5% for other mixes. Comparison
of untreated with treated CORS generally show the benefit of addition
of asphalt. Relation ~f CORS untreated, to those of the treated mixes,
could be ascertained on an equivalency basis, though not attempted in
this project.
Three pairs of field and laboratory mixes each used the same
aggregate source, i.e., mixes 1750-1751, 1903-1904, and 2514-2515."<
The variation of CORS due to asphalt content is apparent between the lab
and field mix types for each of the above materials in Tables 6 and 7.
Table 7 indicates little variance in CORS with asphalt treatment of the
above materials, probably due to the increase in lateral restraint, as
is later explained in this report.
Comparison of the untreated, 4% and 5% treated laboratory mixes
with their respective field mixes is difficult, however, Major in-
consistencies of comparison of the field mixes and their closest
laboratory mix asphalt content were noted during analyses. These in-
consistencies were apparently related to gradation differences~'d: and
h ff f h h . A d b lO . d" t e e ects o re eating t e m1xtures. stu y y Hveem 1n 1cates
that asphalts harden and become more brittle (lowering of initial penetra-
tion) on cooling from an elevated temperature. Therefore on reheating
and cooling an unknown additional amount of brittleness may have been
introduced in the field-mixed samples.
~'<Respectively a limestone-dolomite, gravel, and limestone.
~·•*The extracted gradations varied from recommended gradations. Project personnel were instructed by the ISHC to use only the recommended gradations.

38
There was no discernable trend for the variation of CORS with
aggregate type. Some gravels had a very low CORS, material 1269 in
particular, while some had relatively high CORS. Material 1750, a
dolomitic limestone, had a low CORS while other dolomitic materials had
high CORS. 11
The traffic simulator study by Csanyi et al. , concluded
that asphaltic mixes using softer aggregates tend to be displaced under
traffic less than mixes with harder aggregates and that there is no
direct relationship between stability and trafficability of a particular
mix. It would appear then that some mixes containing soft aggregates
could perform better under traffic than those containing hard aggregates
and vice versa.
The flexible pavement research study by Nichols8
concluded that
deflections and performance seemed more closely allied with compaction
than with pavement design characteristics. From this it would seem
that deflections would decrease and performance increase with increasing
density of the base course material. Figure 16 illustrates that, in
general, CORS of the various materials increased with increasing density.
A similar plot of density vs CORS of the field mixes was very erratic
and was considered indicative of the effect of asphalt brittleness due
to reheating and recooling.
Figure 17 illustrates a general trend for increasing CORS with
increasing modulus of deformation2
for the lab mixes only, at 10 psi
lateral pressure. This plot is indicative that volumetric strain-axial
strain at minimum volume is a measure of strength. A similar plot of
modulus of deformation vs CORS of the field mixes was very erratic and
was again considered indicative of the effect of asphalt brittleness.

--------------------------~- --
39
146 AASHO
• UNTREATED 145 STONE
144 19030 APPROX LINEAR FIT .
143 AASHO
142 TREATED •
728o GRAVEL
141
140 231&~~~5 017
01822
1241 1::1728 ..._ 139 u 1904o 0.. .. 0 >- 138 18550 1677 !::
V')
z 137 01485 w 17430 0
~136 4290 . 184~ ~ 2514o0 > 135 4291::1 <(
134
133 0 479
132 1::1 4% LAB MIXES
131 0479 0 5% lAB MIXES 1::11269
0479 0 UNTREATED
130 1::1479 MIXES (DRY DENSITY)
129
128
127 OoO Oo 1 Oo2 Oo3 OA Oo5 Oo6
CORS
Fig. 16. Average density vs CORS determined on the basis of volumetric strain-axial strain at minimum volume, 10 psi lateral pressure.

40
24.-~--------------------------------------------------~
23
22
21
20
19
8.18 ~
.. 17 z 0. ;:: 16
~ ·er:::: 15 0 u.. w 014 LL.
0 V') 13
.::J ...... ::J c 12 0 ~
11
10
9
8
7
0 5% LAB MIXES o 4% LAB MIXES A UNTREATED MIXES
01822
APPRQX LINEAR. FIT
01855
0728
1855A
429o 18220
16770
429o 1676~1746
1751o A
1485 0 1743 02514
AASHOA
A 01750 479
o2515
A429
o1269
~31801846
1746
. 0479
01743
01904
.AASHO 0 01485 o1241
01485
01677
6~------~--------~--------~--------~------~--------~ OoO Oo 1 0,.2 Oo3 0.4 0.5 0.6
VOLUMETRIC STRAIN -AXIAL STRAIN (CORS)
Fig. 17. Modulus of deformation·at 10 psi lateral pressure vs volumetric . strain-axial strain CORS at 10 psi minimum volume.

41
Comparison of the CORS for each individual material and mix type
from 10 to 20 to 30 psi lateral pressures shows less variation in value
than originally anticipated. At least a partial reason for this behavior
is that the range of volumetric strain-axial strain at minimum volume
I
. between untreated and treated materials increased with increasing lateral
pressure. A similar increase occurred between the two AASHO materials,
thus tending to provide similar CORS for the various materials at each
of the three lateral pressures.
It can be reasoned that as lateral restraint (pressure) is increased
to a point of near total confinement, all materials will tend to behave
similarly with their individual properties having much less effect than
at low lateral pressures. Such reasoning substantiates the use of
volumetric strain-axial strain as a means of flexible pavement materials
evaluation. However, the variation of CORS with lateral pressure
indicates that a knowledge of the lateral pressures that would exist
in the field under design loads must be known for the CORS to be valid.
Presently there is very little data available that indicate what lateral
pressures are developed in flexible pavement structures. A very rough
approximation utilizing a Boussinesq solution, assuming Poisson's ratio
as 0.5, a 100 psi point load, a 6-in. depth, and offset distance of 1 ft,
yielded about 13 psi. It must be recognized that none of the assump-
tions underlying the.Boussinesq solution are met in flexible pavement
structures and that Poisson's ratio is not 0.5 for soils. A decrease
of Poisson's ratio, however, decreases calculated lateral stresses.
Fish and Hoover 2 indicated that Poisson's ratio for the treated materials
at minimum volume was about 0.40+. The untreated materials in this

42
, study had a Poisson's ratio of about 0.30+. It is therefore likely that
the lateral stress developed would be less than the very approximate
figure of 13 psi calculated above. It would appear, from the previous
discussion, that the most applicable values of CORS would thus be those
obtained at 10 psi lateral pressure.
Variations in CORS within a particular material may occur due to
individual test variations and the recording of test data at set increments
of strain, and may lead to some minor inconsistencies in the CORS
determined for a material. Readings in the minimum volume portion of
the triaxial test were taken at intervals of 0.010 in. deflection.
Assuming an 8-in. specimen height, 0.010 in. between readings is about
0.1% axial strain. Volume change readings were recordable to 0.01 in.
of variation in water level in a l-in. diameter tube. Assuming a sample
volume of 100 cu in., a movement of 0.01 in. in the volume change tube
is appro~imately 0.01% volumetric strain. Volumetric strain therefore
changed more slowly than axial strain in this portion of the test,
increasing the importance for precise determination of axial strain
at which minimum volume occurs. It would be desirable in future
studies to obtain continuous monitoring of volume change and axial
deflection in order to firmly fix the point of minimum volume more
accurately.
The concept presented in the preceding paragraph can be noted in
the volumetric strain-axial strain data graphed in Figs. 18 through 27.
It can be seen that many points on the plots appear to be grouped
vertically. This results from the test data being taken at set intervals
of axial deflection during the shear phase of the test. Continuous

..
43 "
-0.36r-----------------------------------------------------~
01751
01743
. 1746 251 251 ~<t .'!!'"!1
. ~ 1~7 ~~5· AASHO ~ . 2318
1788 7 8 1822~479 01903
01241
0.1 0.3 0.4 0.5 Oo6 Oo7. Oo8 AXIAL STRAIN I %
Fig. 18. Volumetric strain vs axial strain at minimum volume, 10 psi lateral pressure, field mixes.
lol
- Oo24r---------------------------------------~------------~
. ~750b269
17460>1822 1677. 429
2515 0
167601855
0000~----~----~~----~----~------~----~------L-----~
OoO Oo l Oo2 0.3 Oo4 Oo5 0.7 AXIAL STRAIN, %
Fig. 19. Volumetric strain vs axial strain at minimum volume, 10 psi lateral pressure, 4% lab mixes.
and even more precise recording of test data would tend to separate the
vertical nature of the plot and result in greater precision of pin-
pointing a CORS value in the laboratory using the techniques described
in this report.
0.8

44
-D-24~----------~----------------------------------~
Do3 Do4 AXIAL STRAIN I o/o
Fig. 20. Volumetric strain vs axial strain at minimum volume, 10 psi lateral pressure, 5% lab mixes.
-Do32~------------------------------------~----------~
cfl._ Do28 .. Z_ Do24
~- D.2D V'l
~- Do 16 ~
1:1:;- Do 12
~- DoOB _, ~- DoD4
01269
01751
DoDO~--~--~----~--~~--~--~--~----~--~--~~~ DoD Do 1 Do2 Do3 Oo8 Oo9 1 o 1
. Fig. 21. Volumetric strain vs axial strain at minimum volume, 20 psi lateral pressure, field mixes.
It should be re-emphasized that the values of CORS obtained in this
study are based on a very limited number of tests of the AASHO control
materials. The quantity of material available was extremely limit.ed.
Four tests were run on each AASHO material at 10, 20, 30 and 40 psi

?fl.
45
-0.20~------------------------------------------------,
Fig. 22. Volumetric strain vs axial strain at minimum volume, 20 psi lateral pressure, 4% lab mixes.
-0.24~------·------------------------------------------,
01788
Ob3 0.4 AXIAL STRAIN, %
Fig. 23. Volumetric strain vs axial strain at minimum volume, 20 psi lateral pressure, 5% lab mixes.
lateral pressure. · This resulted in the CORS at each· lateral pressure
being determined on the basis of .two points (Figs. 13, 14 and 15), one
for the AASHO untreated and one for the AASHO treated materials.
CORS Based on other Variables. As previously indicated under
Section 2.5.1 of this report, the highest degree of correlation of

46
MATERIAL 1269 NOT PLOTTED
Fig. 24. Volumetric strain vs axial strain at minimum 1volume, 30 psi lateral pressure, field mixes.
-0.36~----------------~--------------------------------~
MATERIALS 1269 AND 1750 NOT PLOTTED
1.4 1.5
Fig. 25. Volumetric strain vs axial strain at minimum volume, 30 psi lateral pressure, 4% lab mixes.
data was obtained between volumetric strain and axial strain at minimum
volume. For comparative purposes only, CORS were developed for other
variables at minimum volume conditions using data showing lesser degreQS
of correlation than volumetric strain-axial strain. Development and use

47
-0.36r---------------------------------------------------~
'#. - 0.32
£- 0.28 ~ - 0.24 lIn - 0.20 u := - o. 16 n8 1 ~ - 0.12 3- 0.08
~- 0.04
OoOOOo3 0.4 Oo5
17510
o1743
o.6 o.7 o.8 o.9 1.0 · 1.1 1o2 1.3 AXIAL STRAIN, o/o
Fig. 26. Volm.netric strain vs axial .strain at minimum volume, 30 psi lateral pressure, 5% lab mixes.
-0.40~--------------------------------------~~~----__,
.. z- 0.28
~- 0.24 In
~- 0.20
:=-0.16 w .
~- o. 12 ....I 0- 0.08 >
- 0.04
o. 1 0.4 0.5 0.6 0.7 AXIAL STRAIN,. o/o
429.6 .6 AASHO 0479
0 10 psi
0 20 psi
.6 30 psi
Fig. 27. Volumetric strain vs axial strain at minimum volume, 10, 20 and 30 psi lateral pressures, untreated, optimum moisture content.
procedures were somewhat different than those noted with Figs. 13, 14
and 15, sin~e a single variable was plotted against the two AASHO-CORS
and the CORS for· each material and mix type were thus determined on' the ' .
1 • 1

48
basis of that single variable. Tables 9 and 10 present the CORS thus
determined for the individual variables of (a) volumetric strain,
(b) axial strain, (c) modulus of deformation, (d) effective stress
ratio, and (e) average modulus of deformation, each at 10 psi lateral
pressure and minimum volume. Table lOalso includes the single variable
of effective stress ratio (ESR) at maximum effective stress ratio (MESR)
failure criteria. The latter is discussed in the next section of this
report.
Reasonably good comparisons of single variable CORS based on the
volumetric strain (~V) and axial strain (€), at minimum volume, are
noted with those presented in Table 6. Such comparisons indicate the
potential of a simplified triaxial technique for determination of CORS
using 10 psi lateral pressure and calculating only the precise axial
strain at the precise, but continuously monitored, point of minimum
volume.>'(
CORS determined using the modulus of deformation 2 at 10 psi lateral
pressure varied widely within each mix type and material as well as
among the various materials. The average modulus of deformation 2 CORS
were not consistent with those determined using the modulus at 10 psi
and still varied widely within a material for the different mix types
although the variability among materials was considerably less.
CORS determined for 10 psi lateral pressure using the value of
effective stress ratio (ESR) at minimum volume (MV) indicated relatively
*Development of a simplified triaxial test machine to provide a means of quick but reasonably precise determination of test data for development of CORS on granular base materials was originally a part of this project but was rejected by the cosponsors, Bureau of Public Roads.
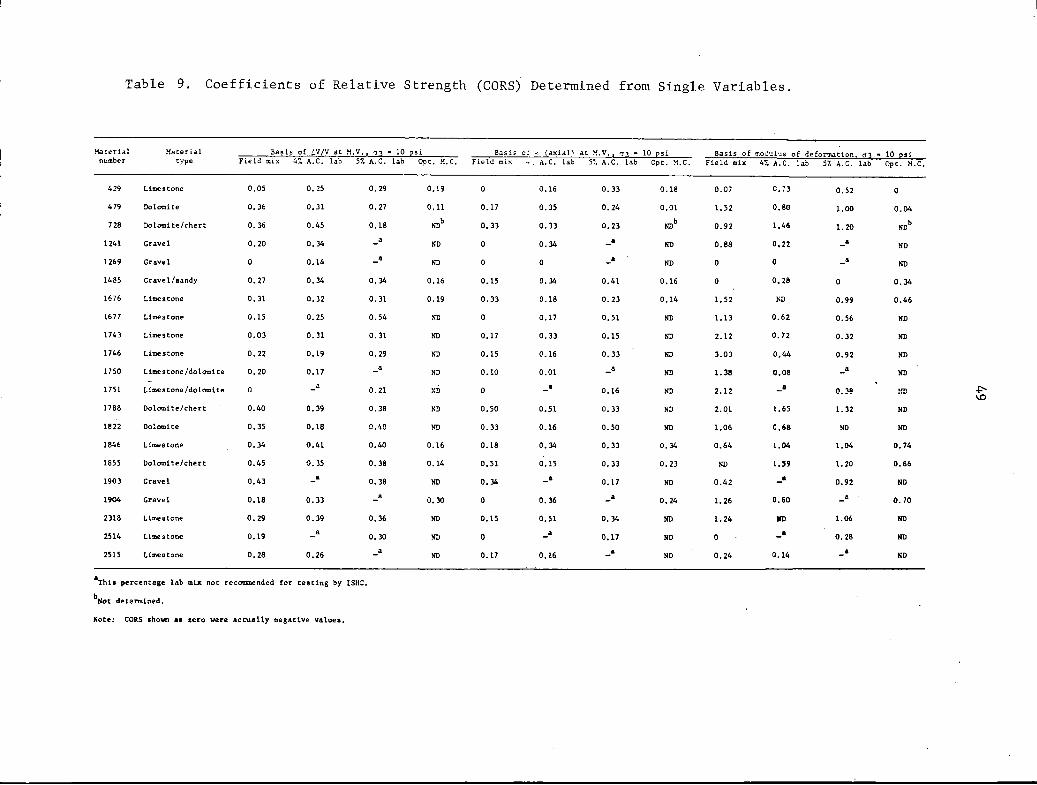
Table 9. Coefficients of Relative Strength (CORS) Determined from Single Variables.
Material number
Material type
Basis of t..V/V at M.V., '1'3"' 10 ':lsi Basis cf ~: (axial) at ~!.V,, '73 = 10 psi Field mix 4% A. C. lab 57. A. C. lab Opt. M.C. Field mix -. A. C. lab 5;; A. C. lab Opt. X. C.
429 limestone 0.05 0. 25
479 Dolomite o. 36 o. 31
728 Do1omi te/chert 0. 36 0.45
1241 Gravel o. 20 0.34
1269 Gravel 0 0.14
1485 Gravel/sandy 0. 27 0.34
1676 Limestone 0. 31 0.32
1677 Limestone 0.15 0. 25
1743 Limestone 0.03 0. 31
1746 Limestone o. 22 0.19
1750 Limes tone/dolomite o. 20 0.17
1751 Limestone /doLomite -· 1788 Dolomite/chert 0.40 0. 39
1822 Do!omite a. 35 0.18
1846 Limestone 0.34 0.41
1855 Dolomite/chert 0.45 o. 35
1903 Gravel 0.43 -· 1904 Gravel 0.18 0.33
2318 LimestonE o. 29 0. 39
2514 Limestone 0.19 -· 2515 Limeutone 0. 28 0.26
•rhls percentage la.b mix not recommended for testing by ISHC.
bNot determined.
Note: CORS shovn •• zero vere actually negative values.
0. 29
o. 27
0.18
-· -· 0.34
0. 31
0. 54
o. 31
o. 29
_a
0. 21
0.38
0.40
0,40
o. 38
o. 38
-· o. 36
0.30
_a
0.19 0 0.16
0.17 0.35
o. 33 0. 33
NO 0 0.34
NO 0 0
0.16 0.15 o. 34
0.19 0.33 0.18
SD 0 0.17
NO 0.17 o. 33
ND 0.15 0.16
ND 0.10 0.01
NO 0 -· ND 0.50 0.51
ND 0. 33 0.16
0.16 0.18 0.34
0.14 0.51 0.15
ND 0. 34 _a
o. 30 0 0. 36
NO 0.15 o. 51
NO 0 -· NO 0.17 0.16
0. 33
0.24
o. 23
-· -· 0.41
o. 23
o. 51
0.15
0. 33
-· 0.16
o. 33
0.50
0. 33
o. 33
o. 17
-· 0.34
0.17
-·
0.18
0.01
NOb
NO
ND
0.16
0.14
NO
ND
ND
NO
NO
NO
o. 34
o. 23
NO
0.24
NO
NO
ND
Basis of rnot:·..:l"....s of deformation, aJ • 10 psi Field mix 47. A.C. lab 57. A.C. lab Opt. M.C.
0.07
1.52
0.92
0.88
0
0
1. 52
1.13
2.12
3.03
1.38
2.12
2.01
1.06
0.64
ND
0.42
1. 26
1. 24
0
0.24
c. 73
0,80
1.46
o. 22
0
o. 28
I'D
0.62
0. 72
0.44
0.08
-· 1.65
C.68
1.04
1.59
-· 0.60
liD
-· 0.14
0. 52 0
1.00
1. 20
-· NO
NO
0 0.34
0.99 0.46
0.56 NO
0.32 NO
0.92 NO
-· NO
1. 32 NO
ND NO
1.04 0. 74
1. 20 0.86
0.92 NO
-· 0. 70
1.06 NO
0. 28 NO
-· NO

Table 10. Coefficients of Relative Strength (CORS) Determined from Single Variables.
Basis of ESR at ~E.SR, 73 = 10 psi Materia 1 number
Material tyoe Field mix 4'1G A.C. lab 5:'. A.C. l.ab Opt. ~1.C.
429 Limestone 0. 35 0.41
479 Dolomite 0.05 o. 39
728 Dolomite/chert 0.18 o. 31
1241 Gravel 0.01 0.44
1269 Gravel o. 38 0.49.
1485 Gravel/sandy 0.48 0.53
1676 Limestone 0 0.18
1677 Limestone 0.05 o. 39
1743 Limestone 0.04 0.41
1746 Limestone 0 0.50
1750 Limestone/dolomite 0.06 0.44
1751 Limes tone /dolom.i te 0 _a
1788 Dolomite/chert o. 24 o. 35
1822 Dolomite 0.34 o. 32
1846 Limestone 0. 35 0.40
1855 Dolomite/chert 0. 29 0
1903 Gravel 0.18 _a
1904 Gravel 0.04 0. 32
2318 Limestone 0.01 0. 27
2514 Limestone 0.34 -· 2515 Limestone o. 33 0. 35
4Thia percentage lab mix not re:01m1ended for testing by ISHC.
bNot determined.
Note: CORS shown as zero t.~ere Jctually zero values.
0. 37
o. 30
0.19
_a
-· 0. 53
0.19
ND
0.41
0.17
-· o. 38
0. 25
0.18
o. 33
0.15
0.34
_a
0. 29
0.44
-·
o. 23
o. 29
~"Db
ND
0. 42
o. 25
ND
ND
ND
SD
ND
ND
o. 28
0.10
ND
0.23
ND
ND
ND
3asis of ESR at !-t.V., :-3 = 10 psi Field :::ix 47~ A.C. lab 5'7.. A.C. lab Opt. ~t.C.
0. 30 0. 30 0. 14 0.12
0.4~ 0.10 0.32
0.12 0. 23 o. 34
o. 57 0.11 -· 0.47 0.15 _a ND
0.02 0.01 0 0.17
0.09 0.57 o. 35 o. 30
0.65 0.32 0.09 ND
0.66 0.09 o. 25 ND
o. 78 0.24 0. 20 NO
0.61 0.28 -· ND
o.8o -· 0. 21 ND
o.as 0 o. 21 ND
0.15 0.32 0.01 ND
o. 25 0.15 0.16 0.11
0.02 0.30 o. 24 o. 24
o.a4 -· 0.13 ND
o.a6 0.12 -· 0. 25
o. 39 0.12 0.16 ND
o. 25 -· 0. 20 ND
a. 21 0. 21 -· ND
Basis of average modulus of deformation Field mix ~7o A.C. lab SJ~ A.C. lab Opt. M.C.
o.o8
0.62
0. 39
o. 36
0
0
0.49
0. 36
0.46
0.80
a.J2
a. 38
o. 57
0.40
0.20
0.83
o. 20
0.44
0.42
0.15
0.14
0.19
0. 52
0.02
0
o. 01
o. 95
0. 24
0. 21
0
-· 0.58
0. 22
o. 29
0.66
-· o. 26
0.55
-· 0
0 0
0. 32 0
0.57
-· ND
_a ND
0.09 o. 21
0.49 0.10
0 ND
0.11 ND
0.24
NO
0 ND
0.54 ND
ND ND
0.24 0. 21
0.63 0.41
0. 26 ND
_a 0.34
0. 28 ND
0.09 ND
_a ND
VI 0

51
high variability within a material for different mix types as well as
among materials. A number of the field mix CORS were high, which may
be a reflection of the brittleness of the reheated and recooled mixes
when analyzed on a strength basis. It was generally concluded that CORS
developed on the basis of a strength parameter alone did not appear
valid.
2.5.2. Maximum Effective Stress Ratio Criteria
Specimen conditions at maximum effective stress ratio may not be
as indicative of actual field conditions as those at minimum volume.
3 Ferguson and Hoover concluded that stresses at the condition of minimum
volume in a triaxial shear test, may be more closely related to actual
field conditions than the stresses at maximum effective stress ratio.
This conclusion appears especially valid in view of the relatively high
·value of Poisson's ratio (0.~) for the bituminous-treated materials2
.
Loading past the point of minimum volume, results in a volume increase
and consequently increased lateral strain. Under field conditions this
increase of lateral strain would result in increased lateral pressure
from adjacent material. In the triaxial test, lateral pressure remains
constant, and therefore specimen conditions past the point of minimum
volume might not be indicative· of actual field response 4
Coefficients of Relative Strength (CORS), Effective Stress Ratio-Cohesion Basis
A study of the correlation matrices developed for each mix type
indicated that the only variables that had reasonably consistent cor-
relations (between mix types) were effective stress ratio and cohesion.

52
Correlations were consistent among mix types for the 10 psi tests but
dropped considerably within a mix type with increasing lateral pressure.
Any CORS which were to be developed on the basis of the effective stress,
ratio-cohesion variables were thus entirely dependent on the increasing
lateral pressure. As pointed out previously in this report, the most
applicable value of CORS would be those obtained at about 10 psi
lateral pressure. Consequently, the subsequent analysis deals only
with the materials' tested at 10 psi of lateral restraint.
Figures 28 through 31 present the plots of effective stress ratio
vs cohesion at 10 psi lateral pressure, on the basis of maximum effective
stress ratio criteria. A scattering of the data points is apparent and
may be due in part to the manner in_which axial load readings were
taken at the various increments of axial deformation previously
discussed. However, the scattering of data is much more significant
in Figs. 28- 31 than in Figs. 18- 27 (volumetric strain-axial strain
at minimum volume criteria) and are basically due to the following
considerations:
• Cohesion' is theoretically the same for a given material at all
lateral pressures but is determined on the basis of three or
more specimens at varying lateral pressures. Cohesion is thus
determined as the ordinate intercept of the best fit of the
failure envelope at its points of tangency, or near tangency
on a Mohr-Coulomb diagram for example.
• The above consideration of point of tangency thus indicates
a variation of maximum axial load between specimens of the
same material. Any variation of maximum cr1
is reflected in

22
20
16
0 1-
14 <( 0:::
V"l V"l w 0::: 12 1-V"l
'W
> 1-u w u. u. w
6
2
53
17510
1746o
01676
2318m1241
17500 ~9~743 AASHO ~NTREATEDD
TONE 19030 REGRESSION FIT
0 1788 INTERCEPT- 4o 1608 SLOPE- Oo3562
CORR COEFF- Oo8948
4 8 12 16 20 24 28 32 COHESION, psi
Fig. 28. Effective stress ratio vs cohesion at maximum effective stress ratio, 10 psi lateral pressure, field mixes.
0'1 - 0'3 determination of the effective stress ratio The
0'3
effective stress ratio (maximum) presented in Figs: 28- 31
is, however, at only one lateral pressure, i.e., 10 psi. There
appears to be little chance of using a maximum effective stress
ratio which accounts for MESR at all lateral pressures since it

20
18
16
. 14 0 ..... ~12 Vl Vl w 0:::
~10 w > ..... 8 u w LL LL w
6
4
2
54
18550
AASHO 0 TREATED STONE
2318 o· AASHO 1904 728 UNTREATED 1788 0 ° GRAVEL o
422 479 84lt 1677 1743
g 01241 2515 1750
0 12~9 0 1746
1485
4 8 12 16
REGRESSION FIT
INTERCEPT- 5o 1356 SlOPE- Oo2531
CORR COEFF- Oo8548
20 24 28 32 36 40 COHESION, psi
48
Fig. 29. Effective stress ratio vs cohesion at maximum effective stress ratio, 10 psi lateral pressure, 4% lab mixes.
52
is noted in Appendix A that MESR generally decreases significantly
with increasing lateral pressure. It will be noted in Appendix A
that effective stress ratio (ESR) for the minimum volume
condition remains somewhat more constant at all lateral
pressures.
• Pore pressures measured at maximum effective stress ratio range
from negative to positive values ii).:~~cating either slight ' . (.~·.

55
18
16
AASHO 14 UNTREATED ·
8sTONE
1855
012 0728 1- 1788
~ 0
. ~ 10 2318
0 w AASHO 1~46 ~79 0:: . 19 1- TREATED 9j 1677 INTERCEPT ..... 5o5534 V'l GRAVEL 0 0 ~ 8 75.P 429 SLOPE - "Oo27669
CORR COEFF- Oo8217 1- 02514 u w u.. 6 u.. w
0 4 1485
2
0o 20 24 28 COHESION, psi
Fig. 30. Effective stress ratio vs cohesion at maximum effective stress ratio, 10 psi lateral pressure, 5% lab mixes.
volume increase or particle interlocking preventing volume
increase, respectively. When crl and rr3 are corrected to crl
and 03
, the effect of negative pore pressure reduces the
maximum effective stress ratio from that at which the pore
pressure may be slightly positive.
Thus, the above considerations combine to create a definite scat-
tering of the effective stress ratio-cohesion data points in Figs. 28 - 31,

56
20~----------------------------------------------~----
~6
15
14
13
012 1-
~11
> 9 1-u 8 I.LI LL LL w
4
3
2
. 1
00
AASHO UNiREA TED o , STONE
18550
01904
COHESION,-' pal
REGRESS ION fIT INTERCEPT - 5 o6947
SLOPE - 0 o4259 CORR COEFF - Oo8776
Fig. 31. Effective stress ratio vs cohesion at maximum effective stress ratio, 10 psi lateral pressure, untreated, optimum moisture content.

57
questioning the advisability of using a strength criteria for determina
tion of CORS.
It was previously noted that the AASHO samples were not included
in any of the correlation matrices since they were considered strictly
as control samples. While the AASHO materials fit into the cor
relations at minimum volume, it is obvious in Figs. 28 - 31 that they
do· not fit into.the maximum effective stress ratio criteria. Instead
of falling on the ESR-C regression lines, the AASHO materials lay well
above same. However, a straight line drawn between the control
samples is nearly parallel to the regression fit of the Iowa
materials. A study of the dry densities in Appendix A indicates that
both the treated and untreated AASHO control mixes had higher densities
than their respective laboratory and field mixes. This isprobably due,
in part, to the very tight gradation control on the AASHO materials
previously discussed. It is believed that this density difference is
the cause of the AASHO control points lying above the regression line
for the Iowa materials. It was shown in Section 2.5 of this report
that the CORS determined on the basis of volumetric strain-axial strain
were partially a function of density, i.e., in general as density in
creased CORS increased. The AASHO materials volumetric strain-axial
strain values of minimum volume, however, compared favorably with their
respective laboratory and field mixes. This indicates that although
volumetric strain-axial strain data is somewhat dependent on density,
it is not nearly as sensitive to density changes as the strength
criteria of ESR-C.

58
It can be re-emphasized, however, that the data presented are
based on a very limited number of tests of the AASHO control materials
and the plots of same in Figs. 28 - 31 represent only one AASHO un-
treated and one AASHO treated specimen, at one lateral pressure.
Figure 32 ranks each material according to its value of effective
stress ratio-cohesion, at maximum effective stress ratio. The CORS
Oo 15 0_.,20 Oo25 OeJO Q.,J5 Oo40
COEFFICIENT Of RELATIVE STRENGTH (CORS)
Fig. 32. Triangular chart for determining CORS at 10 psi lateral pressure, maximum effective stress ratio criteria.

59
thus determined are presented in Table 11. Field mixes are not included
due to the high variability of the cohesion term. The extreme range
of cohesion in the field mixes (Fig. 28) are probably the result of
hardening of the asphalt an:d length of time prior to reheating for
production of test specimens.
Note in Table 11 that in general there is only limited variation
in CORS between materials and mix types. Materials 1485 and 1846
indicate no basic change of CORS from untreated to either 4 or 5%
asphalt treated. Material 1676 indicates a higher value of CORS for
the untreated than either treated mix, a rather unrealistic situation.
CORS for material 1855 ranged from 0.07 to a negative value to 0.14
for the untreated 4% and 5% lab mixes respectively. The three pairs of
lab mixes each using the same aggregate source, i.e., mixes 1750-1751,
.1903-1904, and 2514-2515*, show little variation between asphalt
content or aggregate source.
As a consequence of the above observations, CORS determined on the
effective stress ratio-cohesion basis at MESR criteria do not appear
valid for use in thickness design.
CORS Based on Effective·stress Ratio
The single variable o.f effective stress ratio (ESR) at maximum
effective stress ratio criteria was plotted against the two AASHO
CORS for each material and mix type. CORS were thus determined on
that single variable basis and are presented in Table 10. It will be
noted that there is a wider variation in CORS between materials and
mix types than with the combined ESR-C variables. However, the single
*Respectively, a limestone-dolomite; gravel, and limestone.

I /
60
Table 11. CORS Determined on the Basis of Effective Stress Ratio-Cohesion Relationship at Maximum Effective Stress Ratio Criteria, 10 psi Lateral Pressure.
Material 4% Lab mix 5% Lab mix Untreated
429 o. 29 0.23 0.18
479 0. 25 0.16 0.24
728 0.17 0 NDb
1241 0.26 a
ND
1269 0.30 a ND
1485 ,o. 37 0.39 0. 32'
1676 0.05 0 0.16
1677 0.22 0.20 NDb
1743 0. 26 0; 31 ND
1746 0.27 0.03 ND
1750 0. 29, a ND
1751 a
0.23 ND
1788 o. 24 0.13 ND )
1822 NDb 0 ND
1846 0. 25 0.23 0.24
1855 0 0.14 0.07
1903, a o.25 NDb
1904 0.20 a '0.14
2318 0.13 0.17 NDb
aTh\is percentage lab mix not recommended for testing by ISHC.
bNot determined.
Note: CORS shown as zero were actually negative values.

61
Table 10. Continued.
Material 4% Lab mix 5% Lab mix Untreated
2514 a 0.25 ND
2515 o. 29 a ND
variable ESR-CORS does not compare favorably with the combined ESR-C-CORS
or with any of the CORS obtained from the minimum volume criteria. In
fact, it is observed that some definite reversals occur in the single
variable ESR-CORS when compared to the.ESR-C-CORS.
2.6. CONCLUSIONS
CoefUcients of relative strength determined in this laboratory
study are based on a very limited number of control values established
from the AASHO materials and should be viewed with this in mind.
The validity of the CORS determined can only be fully ·ascertained
after extensive analysis of the pavement field performance where each
material and mix type have been used.
1. Volumetric strain-axial strain relationships appear to be
appropriate evaluation parameters for 'determining coefficients
o.f relative strength at minimum volume failure criteria.
2. Coefficients of relative strength determined on the basis
of volumetric strain-axial strain tend to vary slightly with
lateral pressure, all treated materials tending towards
similar values of CORS as lateral pressure is increased.

62
CORS determined at 10 psi lateral pressure are probably
more indicative of actual field conditions.
3. Coefficients of relative strength determined on the basis
of effective stress ratio-cohesion, at maximum effective
stress ratio criteria, do not appear valid for use in thickness
design.
63
3. PHASE II: REPETITIVE LOAD RESPONSE
The purpose of this phase of the project was to delve into the
relatively unknown area of repetitive, or cyclic, axial loading of
granular materials in an effort to evaluate the more dynamic stability
1mechanism(s) of treated and untreated Iowa crushed stones.
The predominant study of this phase centered around the response
of asphalt-treated granular base specimens to repetitive loadings,
developing equations which provide a more rational basis for further
studies of factors affecting deformation under cyclic stress conditions
similar to that of a pavement subjected to transient loads. The
second study of this phase centered around an unanticipated repetitive
load response of untreated crushed stone base ma'terials to slight I
v variations of fines cqntent (No. 200 sieve material) and suggests
maximum desirable quantities of fines for various loads. The third
and shortest study deals with the minimum volume load response of an
asphalt-treated field-mixed material after 100,000 cycles of repetitive
loading.
3.1. BEHAVIOR OF GRANULAR MATERIALS UNDER
TRIAXIAL COMPRESSION WITH PULSATING DEVIATOR STRESS
J. J. Marley and R. L. Handy*
12 Reference is made to the major report by Marley and Handy
for a detailed analysis of this portion of the repetitive load response
*Respectively, Assistant Professor, Civil Engineering, University of Notre Dame, and Professor, Civil Engineering~ Iowa State University.

64
study. Presented herein is but a summary of the conclusions and
potential applications of this research.
A model for behavior of granular material subjected to repeated
ioads was proposed. This model is based on bonds formed at inter-
particle contacts, resistance to rearrangement of particles, and internal
structure of the material. Stresses applied to the material are trans-
ferred through the bonds, and deformation of the material occurs by
breaking of bonds and rearrangement of particles. The total resistance
to deformation constitutes an energy barrier to deformation of the
material mass, termed the activation energy. This energy barrier
may be surmounted by bonds having sufficient thermal and mechanical
energy.
Based on this model of resistance to deformation, an equation was
developed beginning with the Arrhenius equation of chemical kinetics.
Separation of the contributions of various factors to the activation
energy enabled determination of their individual effects. Equation (1)
was shown to describe the observed behavior of both untreated and
asphalt-treated granular materials over the range of variables con-
side red.
where
ln e
e = strain rate
C a constant
6H* = activation enthalpy
k the Boltzman constant
T = the temperature at which shear occurs s
(1)

65
~=a material parameter,·~~ , where~· is the flow unit volume s
L = the deviator stress applied to the specimen
A = the cross-sectional area of the specimen
1J. = a parameter showing the effect of cell pressure on shear behavior of the specimen
p = the cell pressure
a = a parameter showing the effect of temperature on shear behavior of the specimen
T = the temperature of consolidation. c
Using the equation developed from the energy barrier concept and I
an empirically determined relations~ip between total strain and number.
of applications of stress, an integrated equation was developed to
relate number of applicatiorts of stress with other variables at fixed
levels of deformation:
ln N E:
. ~H* = ln M + kT
s
~L 2A + IJ.P + aTe ( 2)
where the coefficients C and M include the proportionality constants
for the relationships between shear and axial deformation, frequency
of load applications, and conversion of strain to percent strain.
Equation (2) describes material behavior over the ranges of deviator
stress considered, when other variables were held constant. However,
Eq, (2) does not describe observed material behavior over the range
of variables considered as well as Eq. (1) which was based only on
ene.rgy barrier concepts.
Experimental tests, consisting of 64 repeated load triaxial compres-
sion tests on an untreated and asphalt-treated granular material
provided the following observations:

.,
66
. I
1. Repeated load triaxial compression .tests yield a linear rela-
tionship between the logarithm of strain rate and deviator stress.
The proportionality coefficient may be used to evaluate volume ~f a
flow unit. This volume was considerably smaller than that reported by
others for·finer gt:aiinedlmaterials.
2. Activation enthalpies obtained from coefficients of the rela-
tionship between logarithm of strain rate and reciprocal of absolute
temperature of shear were about the same as the activation enthalpy
of the pore fluid.
3. Repeated load tests yielded a linear relationship between I
the logari.thm of stress applications at constant strain and deviator
stress. The proportionality coeffipient in the model equation was the
same as the coefficient for deviator stress-logarithm of strain rate
relationship. Experimentally determined values from each of the two
methods are, in most cases, in close agreement.
4. Activation enthalpies determined from Eq. (1), based on
strain rate, differ by about 50% from those determined from Eq. (2)
based on total strain. Because the multiple linear regression cor-
relation coefficients for Eq. (1) are higher than those of Eq. (2),
activation enthalpies determined from Eq. (1) are considered better
estimates.
5. Increased temperature of consolidation decreased the deforma-
tion rate, but the relationship is poorly defined since only two
levels of consolidation temperature were used.
6. Increased confining pressure in the triaxial cell decreased
the rate of deformation. This effect is interpreted as a decrease in
67
the size of flow units as the confining pressure is increased. Test
methods used in this investigation did not permit determination of
separate effects of normal stress and consolidation pressure.
This study of behavior of granular materials subjected to repeated
loads yielded equations which reasonably describe deformation behavior
of the materials. However, modification of Eq. (2) will probably be
required if it is to describe material behavior as well as Eq. (1).
Interdependency of some measured quantities (e.g. volume change, pore
pressure and confining pressure) may dictate other modifications of
the equations as their effects become more completely understood.
Further investigation based on the equations proposed herein seem
justified in order to confirm, and extend to a wider range of materials
and other variables, the findings of this investigation. The model
equation describes material behavior under stress conditions very
similar to those imposed on pavement structures in terms of fundamental
parameters which might be used as a rational basis for analysis of
pavement deformations.
Equation (2) relates the number of applications of stress to
produce a given deformation to those factors which affect the rate
of deformation, viz., activation enthalpy, temperature, imposed
stress, confining stress and flow unit size.
Application of this equation to design or analysis of prototype
pavements will require empirical correlations between laboratory
behavior and field performance. Because confining stress in a proto-
type pavement is variable depending on depth, vertical stress, and
material properties, conditions of confining stress in prototype pavements
68
·are difficult to simulate in laboratory tests, introducing the need
for correlations between laboratory test and pavement performance.
Activation enthalpy c'ari be determined in the laboratory and can
be considered constant for the duration of the testing procedure.
However, in the case of asphaltic concrete or asphalt-treated'· material,
the chemical changes occurring in asphalt cement due to several years
exposure to climatic elements may have considerable effect on activa
tion enthalpy of the material. This effect should be de.termined or
accounted for from experience to make the equations applicable to
pi:otol:ype pavements.
The dwell time of the imposed stress was held constant in this
investigation. Since experience has shown that the greatest distress
or deformation of flexible pavements occurs where traffic stress·· is
static or slow moving, it is probable the time that stress remains on
the pavement affects the rate and amount of deformation caused by a
given number of applications .. The effect on deformation due to
variable dwell time could be determined by laboratory experimenta.tion
and probably field correlation. Other variables also should be con
sidered, for example effects due to mixed traffic, such as wheel or
axle load equivalency. These variables have been·mentioned toil
lustrate some of the work necessary to extend findings from laboratory
research described here to applications in prototype installations.
This discussion has assumed that a criterion of pavement performance
can be based on limiting or specified deformations. This is tantamount
to saying that a pavement "fails" when it reaches some amount of
deformation, as opposed to rupture of the pavement mass. This

69
defonnational criterion of pavement perfonnance is essentially that
used in the analysis of results from the AASHO Road Test (Highway
Research Board Special Report 61E).
' In that analysis, a pavement was considered to have "failed" when
the present serviceability index (PSI) reached a given level. The
equation for PSI indicates it is a. function of measured pavement
defonnations represented by slope variance and rut depth, and
localized rupture represented by cracking and patching. The major
factor in serviceability loss was slope variance.
Since the equation used to analyze results of the AASHO road test
and Eq. (2) are both based on deformation criteria, it may be instructive
to compare Eq. (2) and the AASHO equation which was develope~ by using
curve-fitting techniques.
where
The AASHO equation is
(Co - p)
(c - c1) 0
p = the present serviceability index
C = the initial serviceability index 0
·c1
= the "failure" serviceability index
W = the weighted number of axle applications when the serviceability index is p
(3)
p = the weighted number of axle applications when p = c1 or the number of axle applications to cause "failure"
B = an exponential multiplier which accounts for imposed stress, axial configuration (single or tandem) and pavement structure.
Taking logs of both sides of Eq. (3) gives

70
c - p log (C
0 _C) = B(log W- log p).
0 1 (4)
For comparison, if the temperature is constant, the following
.equation may be written
3 RL e = Z't exp ~ exp - ~p
2A
where Z includes effects of activation enthalpy and consolidation
(5)
temperature. Making the same substitutions as in Eq. (2) to obtain
an expression in terms of number of applications,
e 3 = Z'N exp SL exp - ~p.
2A
Taking logs of both sides gives
~ 3 ln e • ln Z' + ln N + 2A - ~p.
(6)
(7)
Comparison of Eqs. (4) and (7) indicates that on the left side
of both equations is a logarithmic measure of deformation - service-
ability loss in the case of Eq. (4) and percent strain in the case of
Eq. (7). Both have a logarithmic intercept, p. in Eq. (4) and Z' in
Eq. (7). Both utilize a logarithmic measure of the number of load
applications, Win Eq. (4) and N in Eq. (7).
The nature of the effect of stress intensity is different in the
equations since this is included in the multiplier B in Eq. (4) and
as a separate additive term in Eq. (7). Equation (7) also inc~udes a
term to account for confining pressure. It may appear that no such
term is included in Eq. (4), but since confining pr~ssure i_n a proto-
type pavement is a function of depth, vertical stress intensity, and
material properties, an effect of lateral pressure is probably included

71
in Eq. (4). This is because the multiplier B includes effects of load
intensity in addition to depth and relative strength coefficients for
each layer of the pavement structure.
The relationships between AASHO equations and those developed in
this study cannot be determined without a more complete knowledge of
material behavior under repetitive loading conditions determined by
further laboratory studies and correlation with performance of proto-
type pavements. However, it is significant that the quantities that
control deformation based on theoretical considerations and experi-
mentally verified in this study, are remarkably similar to those
quantities which provided the best fit in the empirical curve-fitting
techniques used in analyzing AASHO test road results.
3.2. EFFECT OF FINES CONTENT OF GRANULAR MATERIALS
UNDER REPETITIVE LOAD TRIAXIAL TESTS
E. G. Ferguson and J. M. Hoover*
3~2~1;· .Introduction
Initially begun as a preparatory study of untreated materials to
repetitive loading response for use with the preceding study, this
portion of the project was expanded to enable a suggestion of maximum
desirable quantities of fines for various cyclic loadings. The variables
of primary interest were applied load, duration (time) of load
*Respectively, Instructor and Associate Professor, Civil Engineering, Iowa State University.

72
application and quantity of -//200 sieve material present in the t~.st
specimens.
3.2.2. Materials
Two crushed stones were used for this portion of the project.
Each was previously studied in project HR-99, thus providing significant
background information.
The materials are as follows:
1. A weathered, moderately hard limestone of the Pennsylvania
System obtained from near Bedford, Taylor County, Iowa. Hereafter
referred to as the Bedford sample. The system outcrops in nearly
half of the state. Formations in this system are generally soft and
contain relatively high amounts of clay.
2. A hard dolomite obtained from near Garner, Hancock County,
Iowa. Hereafter referred to as the Garner sample. From the Devonian
System, this material is very,uniform and has shown remarkable
similarity thrqugh several counties.
Reference is made to the HR-99 Final Report1 for the detailed mineralogical,
chemical and engineering properties of the Bedford and Garner samples.
3.2.3. Specimen Preparation
The specimens used for this investigation were compacted by vibratory
. 1 compa~t1on Previous work has shown that the moisture-density rela-
tionship for vibratory compaction differs somewhat from that determined
through use of standard Proctor compaction. Vibratory compaction

73
achieves standard Proctor density but at a slightly lower moisture
content, Therefore, the specimens were compacted at optimum moisture
content as determined by vibratory compaction studies. The procedure
for specimen preparation was as previously described in Section 2.2.2
of this report.
Following compaction, height of each specimen was measured while
in the mold. They were then extruded, weighed, wrapped in two layers ·
of Saran wrap and aluminum foil, and the ends sealed. The specimens
were then cured in an atmosphere of about 750F and near 100% relative
humidity. Prior to testing each specimen was again weighed and the
height and diameter measured.
3.2.4. Triaxial Compression Apparatus
The testing machine used in this study was fabricated by the
ISU Engineering Shop to specifications established by the Soil Research
Laboratory. The cell was a standard triaxial cell capable of handling
4-in. diameter by 8-in. high specimens.
Load was applied by a hydraulic cylinder, activated by an Enerpac
Program control center. Timer, counter and several pressure switches
manufactured by Enerpac provided control over the magnitude of the
applied load and length of dwell time that the load was maintained.
At the end of each dwell time (length of load application) the load
rapidly decreased to zero and was immediately reapplied. No control
of the rate of loading or unloading or the length of time at zero load
was attempted but was set as dictated by the system used. In all
cases the load dropped to zero and remained there for at least 0.1 sec
or more.

74
Measurement of applied load was accomplished, by use of a Dillon
Series 200, 15,000-lb capacity load cell .and Dillon Type B meter read
out.
Positive and negative pore pressures at the base of the specimen
were measured with a 0 to - 100 psia pressure transducer manufactured
by Consolidated Electrodynami~s and read by a Daytronic Corporation
Model 300D Amplifier-Indicator with Type 93 strain gage input
module. The indicator was calibrated to read directly in pounds
per square inch with an arbitrary zero reference taken at atmospheric
pressure.
Volume change was measured with a unit developed by the Soil
Research Laboratory having a direct reading precision of apput. ,, , -
0.05 cu im1.. · Vertical displacement was measured by an LVDT having a
direct reading precision of 0.003 in.
A six-channel Brush oscillograph was used to monitor all output
signals, allowing continuous recording of load, volume change, deflection
and pore pressure.
3.2.5. Results
A total of 52 Garner specimens were_used in this study. All were
te~ted at a lateral pressure of 10 psi so that the effe~t of cyclic
loading could be better studied at a lateral restraint condition
more closely approximating that of a granular base course. The
-variables of loading during the drained tests w.ere thus reduced to only
the magnitude of load and length of time load was applied (dwell time).

75
Five axial loads were used ranging from 1150 to 1700 lb resulting
in effective stress ratios"/( of from 9.16 to 14. 4. This range of
stress ratios was within the failure criterion of minimum volume and
~aximum effective stress ratio as determined by the standard test
previously described. Three dwell times were used: 0.25, 0.50, and
1. 00 sec.
Fifteen Bedford spec_imens were tested at a lateral pressure of
10 psi,.dwell time of 0.50 sec, and applied axial load of 700 lb, the
latter giving a maximum effective stress ratio of about. 5 •. 65.
The 700-lb axial load was at about the point of minimum volume as
determined by the conventional triaxial test.
In order to acquire information on the migration of moisture and
·fines during testing, each specimen following testing was divided
into three equal segments, i.e., top, middle and bottom. Moisture
content and particle size distribution of each segment was determined.
These results allowed calculation of variation of moisture content
and amount of No. 200 material. Though slight variation of both
moisture and fines was noticeable between top, middle and bottom of each
specimen, no discernible relationships were ascertained.
Twenty~one of the 52 Garner specimens were tested at an axial
load of 1700 lb and a dwell time of 0.50 sec. As testing on this
group progressed, it became evident that variation of fines content
had a pronounced effect on failure rate of the specimen. By dry
sieving only, the fines contents were altered in a less than rigorous
manner. Following repetitive testing, the variation of fines,
averaged for the three segments of each specimen, ranged from 2.11 to
crl >'(Effective stress ratios in this study are defined as ;::.
cr3

76
17.8% by total dry weight. The amount of fines present in each
specimen prior to compaction was not determined. Consequently, the
amount of degradation occurring during compaction and loading was not
determinable. Though it is possible that the fines content observed
fo.llowing testing was somewhat greater than that of the original
material, interpretation of degradation from Project HR-991 'indicate·
a likely maximum increase of fines of about 1% by dry weight •
. Previous studies have shown that excess fines are detrimental . ' 4
to the performance of a granular base course material • Significance
of fines content can best be illustrated by ifs a~fect on rate of
axial strain during loading, shown in Fig. 33, which presents the
axial strain of a number of specimens vs number of cycles, All tests
16
15
14 13
12
11
z 10
~ 9 1- 8 ~
..... ~ 7 X 6 c(
5
4 3
2
1
GARNER UNTREATED
AXIAL·LOAD == 1700 lb O'J = 10 psi
OWE LL = 0 o50 sec NUMBERS INDICATE %OF - 11200 MATERIAL
00 400 600 1000 1600 1800 2000 2200 2400
Fig. 33. Effect of fines content on strain rates, Garner stone.
·!

77
shown have an axial load o~ 1700 lb applied in conjunction with a con-
·fining pressure of 10 psi, giving a maximum effective stress ratio of
about 13.4. Dwell time was set at 0.50 sec, thereby reducing the
variables to those of the material and not of the loading conditions .
. The wide variation of results indicate the rapid response.of rate of
strain increase with increased fine content.
Figure 34 shows similar results for the Bedford crushed stone, only
with a much more pronounced effect. The axial load for the Bedford
tests was 700 lb, considerably less than that used for the Garner
series. A lateral pressure of lO psi was used giving a maximumef-
fective stress ratio of 5.65 as opposed to 13.4 for the Garner.
16~.~~r-~----~~--------------~--~r-----------------,
15 14
11
z1o 3 9 t;;B
~7 ~ 6
5 4
Fig. 34.
BEDFORD UNTREATED
AXIAL LOAD = 700 lb a3 = 10 psi
DWELL= Oo50 sec
NUMBERS INDICATE% OF- 1200 MATERIAL
Effect of fines content on strain rate~ Bedford stone.

78
The three tests shown on Fig. 34 as having fines contents of 16%
or less were rtot tested to failure. The test shown with 16.0% fines
was terminated after 25,000 cycles and had undergone only 4.3% axial
strain. The test with 10.4% fines developed 3.5% axial strain at
30,000 cycles termination and at 5.3% fines, 14,000 cycles of loading
resulted .in less than 1% axial strain. It is readily apparent that
for this loading condition, a very slight increase of fines can change
a relatively stable material to one that will fail after a relatively
:few heavy load applications.
The effect of fines content can better be presented by plotting
axial strain produced after 100 cyeles of loading vs fines content
after testing, as shown in Figs. 35 and 36. For both materials there
appears to be a maximum desirable fines content above which the amount
of strain after 100 cycles of axial load increases rapidly with
increased fines. aelow this point, variation in fines content has
little affect on the amount of strain developed. The maximum desirable
fines content for the Garner crushed stone was around 9% while for the
Bedford it was closer to 16% for the load conditions noted. Fines
contents exceeding these amounts appear to decrease the stability of
the specimens.
The results presented in Figs. 33-.36 are for one loading condition
and one dwell time. Thus the question arises. as to whether these
results are unique for these conditions and will vary with changes in
stress or dwell time. For the Bedford series all tests were run with
a dwell time of 0.50 sec, and axial load of 700 lb, thus providing
little insight into this question. The Garner series however covered
a wider range of test conditions and were used for analysis of this problem.

,....-----------------~ -
79
lOr-------------------------------------------------~
.9
8 GARNER UNTREATED AXIAL LOAD= 1700 lb
OJ= 10 psi DWELL = 0.50 sec ·
7
V')
~ 0
~ 6 u 8 .... 1- 5 < 0 / z. ~ 1-~ 4 _, 0 ~
~ 0
Fig, 35. Axial strain at 100 cycles vs fines content, Garner stone.

. 80
20~--------------------------------------~--------~
18
15. "" ~ ~14 u g13 -
8
7
6
,5
2
BEDFORD UNTREATED
AXIAL LOAD = 700 lb. ~ .=: 10 psi
DWE.LL = Oo50 sec
0
0 0 2 4 6 8 1 0 12 14 16 1 8 20 22 24 26 28 30 .
TOTAL% - 1200
Fig. 36. Axial strain at 100 cycles vs fines content, Bedford stone.

81
.Six Garner specimens were tested at the same stress conditions as
shown in Fig. 35 but at dwell times of 0.25 and 1.00 sec and are
~hown in Fig. 37, in addition to the tests having dwell times of 0.50 sec.
Unfortunately the range in fines content of these specimens was quite
- 1 imited, but each tend to lie within the total range of the 0. 50 sec
tests. The four tests at dwell time of 0.25 sec appear to agree with
the concept of a rapid increase in strain with a small increase in fines
content as is shown by the tests having ·a 0.50 sec dwell time. Since
no additional dwell tests having fines contents of less than 9% were
performed, it is not certain whether the same trend will occur, though
since there is close agreement at this point it appears that the maximum
·desirable fines content of 9% might also be valid for a dwell time of
0.25 sec. Only two tests were conducted having dwell time of 1.00 sec,
with one test generally agreeing with the 0.50 sec tests.
Variations of. dwell time, within the range used in Fig. 37, did
not appear to have noticeable affect on the test results. It was observed
from the recorder charts that essentially all deflection occurred at
the instant of application of the load, with (Only a small additional
amount occurring during the initial portion of the dwell period. As
dwell time was increased no change from that noted above was detectable.
Tests having dwell times of longer duration than those in this study
may exhibit a form of progressive failure, or creep, within the period
of load application, but it would appear that within the range of
0.25- 1.00 sec, length of dwell time would produce no form of progres
sive failure.
. I

82
10.-------------------------------------------------~
TOTAL% ..11200
Fig. 37. Effect of dwell time on axial strain-fines content relationship, Garner stone.

83
The majority of the Garner specimens were tested with an axial
load of 1700 lb. A limited number of tests were conducted at lower . ~· . .
axial loads and are shown in Fig. 38 in addition to the axial strain-
percent fines rela,tionship established for _the 1700-1~ axial load
condition presented in Fig. 35. The specimens tested with an axial
load of 1550 lb had fine contents exceeding 9% and therefore showed
no inflection point that would indicate a maximum desirable fines
content. The test·s generally tended to parallel those for the 1700-lb
load but at a lower amount of axial strain .. The four tests at. an axial
load of 1400 lb had a pattern similar to the 1700-lb series but ap-
peared to have a higher optimum fines content of near 11%. The three
specimen·s tested at 1150 lb axial load tend to indicate optimum fines
of greater than 11%. Generally there appeared to be an increase in the
desirable fines content as the applied load decreased.
IBy assuming that the relationship between axial strain and fines
content consists of two straight line segments with the point of inter-
section being the maximum desirable fines content, from Fig. 38, it is
possible to observe a potential effect of stress condition ori quantity I
of fines. The number of Garner samples tested at the lower loads are
quite limited but tend to follow the same pattern established in Fig. 35.
Lines drawn through these points, parallel to the 1700-lb series, and
having a decrease in strain proportionate to the decrease in load, I
provide at least a hint of the maximum desirable fines content for the
load conditions. As was previously noted there appears to be an
increase in maximum desirable fines content as. the load is decreased.

84
10~----------------------~------------------------------
9
8
7
..,., ~ ~6 u 8 ..... .... <s z -~ .... ..,., -'4 ~ .·
X <
AX~L tOAD -1700 lb' 6. lSSO fb 0 1-400 g, 0 nso rb
_ ...... -- ------- ------ ---
GARNER UNTREATED · DWELL= o
0so sec era=, psi
I I
I I
I I
0
Fig. 38. Effect of axial load on axial strain-fines content relationship, Garner stone.
,~··
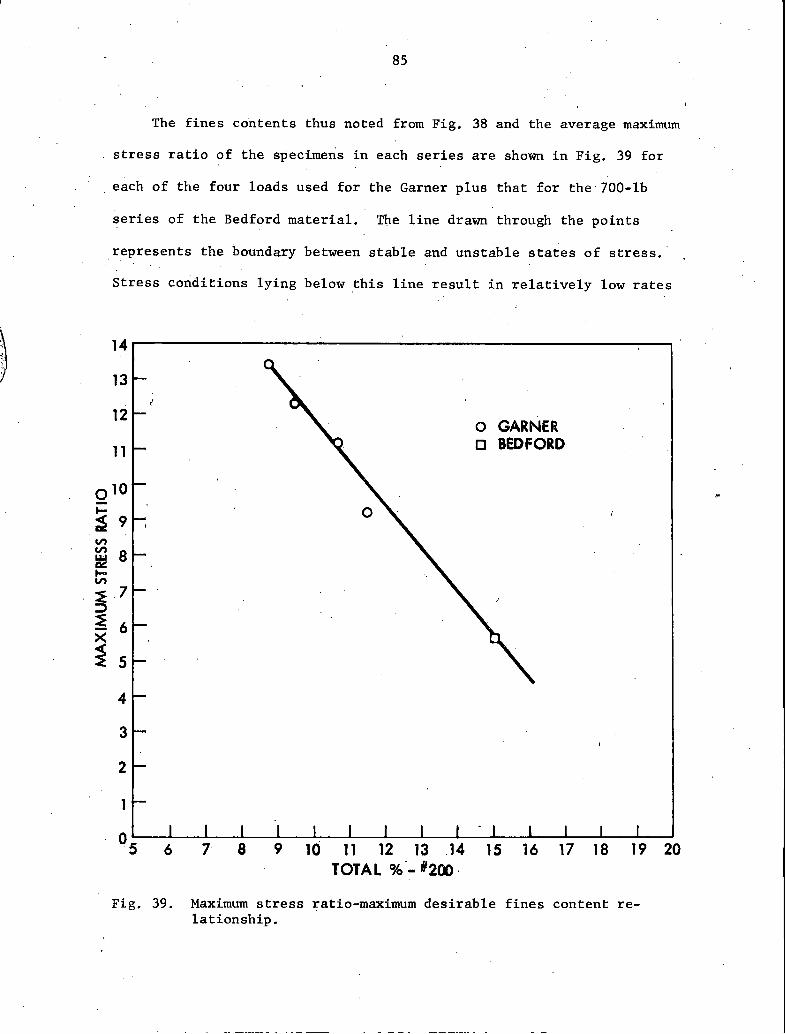
~ ' '
85
The fines contents thus noted from Fig. 38 and the average maximum
stress ratio of the specimens in each series are shown in Fig. 39 for
each of the four loads used for the Garner plus that for the·700-lb
series of the Bedford material. The line drawn through the points
represents the boundary between stable and unstable states of stress.·
Stress conditions lying below this line result in relatively low rates
14
13
12 0 GARNER
11 0 BEDFORD
010 .... ~ V) V)
~ .... V)
~ :::,:)
~ X
~
9
8
.7
6
5
4
3
2
6 7 8 9 11 12 13 .14 15 16 17 18 TOTAL %·- 1200 ·
Fig. 39. Maximum stress ratio-maximum desirable fines content relationship.
20

86
of strain for repetitive loading conditions while above this line the
rate of strain becomes much more rapid. Below the line, variations
in fines content may have relatively little affect on the stability,
whereas for stress conditions above the line, slight variations in
fines may greatly alter the performance of the material under cyclic
loading. The fact that the Bedford agrees with the four load conditions
used for the Garner suggests the possibility that maximum fines
content· is dependent upon stress and may be independent of other
physical properties of the materials.
3.2~6. Conclusions
Reaction to repetitive loading of the two granular base course
materials appears to be highly dependent upon the amount of No. 200
sieve material present within the specimens upon completion of test.
At the lower fines contents, an increase in the fines resulted in a
slight increase in the amount of axial strain occurring after a set
number of cycles of load had been applied. This increase appears to
be linear, with the increase in fines cmntent, up to a maximum desirable
fines content, beyond which an increase in fines results in a much
larger increase in axial strain that will develop after a fixed
number of load cycles. In this area variations in fines content have
a pronounced effect upon the resistance of the material to cyclic
loading. Below this point, variation in fines content apparently
have relatively little effect on stability. As was shown for the
Bedford material, a specimen having a 16.0% fines content developed
only 4.3% axial strain after 25,000 load applications while a
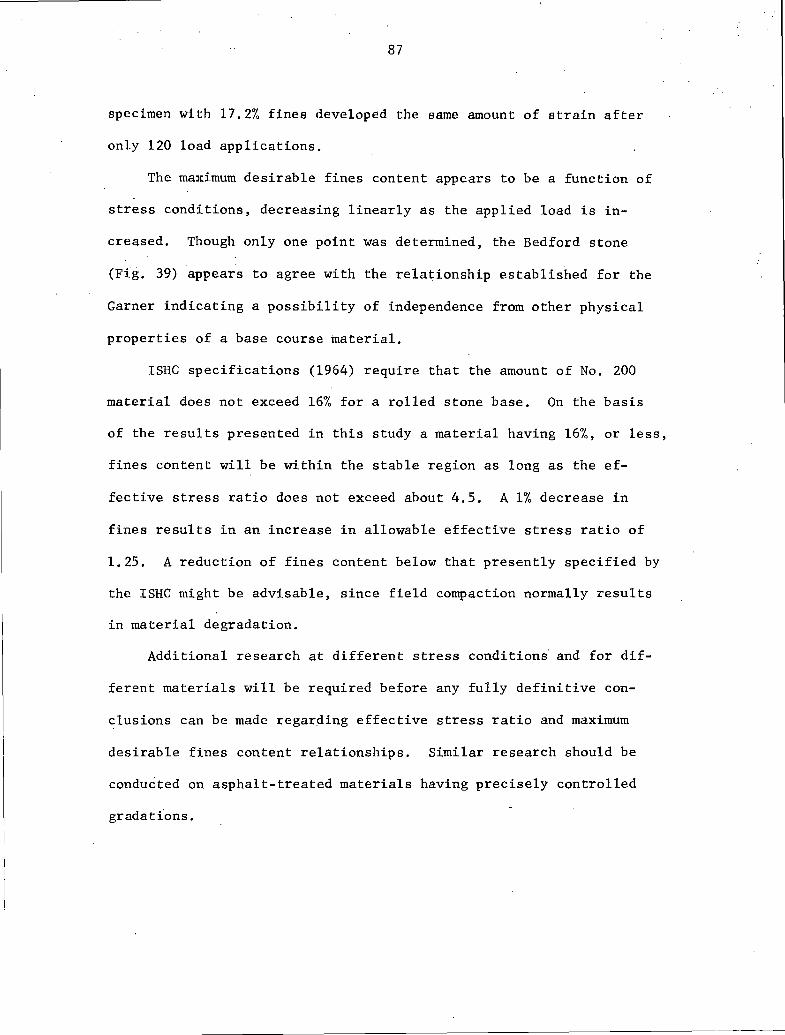
87
specimen with 17.2% fines developed the same amount of strain after
only 120 load applications.
The maximum desirable fines content appears to be a function of
stress conditions, decreasing linearly as the applied load is in
creased. Though only one point was determined, the Bedford stone
(Fig. 39) appears to agree with the relationship established for the
Garner indicating a possibility of independence from other physical
properties of a base course material.
ISHC specifications (1964) require that the amount of No. 200
material does not exceed 16% for a rolled stone base. On the basis
of the results presented in this study a material having 16%, or less,
fines content will be within the stable region as long as the ef
fective stress ratio does not exceed about 4.5. A 1% decrease in
fines results in an increase in allowable effective stress ratio of
1.25. A reduction of fines content below that presently specified by
the ISHC might be advisable, since field compaction normally results
in material degradation.
Additional research at different stress conditions and for dif
ferent materials will be required before any fully definitive con
clusions can be made regarding effective stress ratio and maximum
desirable fines content relationships. Similar research should be
conducted on asphalt-treated materials having precisely controlled
gradations.

88
3.3. MINIMUM VOLUME LOAD RESPONSE OF AN
ASPHALT-TREATED GRANULAR MATERIAL
D. E. Fox and J. M. Hoover
It was observed from Project HR-99, as well as the project reported
herein, that during a conventional consolidated-undrained triaxial
shear test, the granular base specimen undergoes an initial volume
decrease as axial load is applied. A point of minimum volume is reached
after which the specimen increases in volume during the remainder of
the test. Strain and load at minimum volume are less than at maximum
effective stress ratio load. Both strain and load at minimum volume
appear to produce a 11 proportional limit 11 indica:ting that failure of
the specimen may have started. The question is then asked whether or
not a specimen wi~l withstand a large number of repeated load applica
tions of the magnitude existing at the point of minimum volume failure
criteria.
To examine this question, three saturated field-mixed asphalt
treated specimens* of material 1846 (Appendix A) were tested at lateral
pressures of 10, 20, and 30 psi under repeated loads at a test tempera
ture of 100°F. The axial loads applied to each specimen were the
loads determined at the point of minimum volume during the CORS study
in the conventional consoltdated-undrained tria~ial test apparatus.
The minimum volume axial load at 10 psi lateral pressure produced a
stress in the test specimen of about 70 psi, comparable to that
*Extra specimens molded, though unused, for the CORS study.

89
created in a flexible base course by a passing truck. The minimum
volume loads at 20 and 30 psi lateral pressures were equivalently
higher. Each specimen was consolidated for 36 min under the
lateral pressure. Load application dwell time was maintained at
0.50 sec for each specimen, with 100,000 applications of load the
arbitrary cutoff point. Strain, volume change and pore pressure
were continuously recorded during testing.
Within the first few applications of repetitive axial load, each
specimen underwent a volumetric strain decrease, and axial strain and
pore pressure increase. Each of these parameters continued their
respective increase or decrease up to 30,000- 50,000 cycles, after
which there was only negligible change in each. At 100,000 cycles,
the above parameters were still somewhat less than the corresponding
CORS tested specimens.
The post-repetitive test condition of each specimen was analyzed
by retesting under~the conventional consolidated-undrained triaxial
test using the identical test conditions of the CORS study. Examination
of the data showed each specimen exhibited a slight volume decrease,
axial-strain increase, and increasing pore pressure to the point of
minimum volume, coupled with increasing effective stress ratio. Three
factors were indicated:
1. None of the specimens had 'tiailed."
2. During removal from the repetitive apparatus, resaturation
process, and placement in the conventional apparatus, each specimen
may have partially rebounded elastically.
3. Because of the continued volume decrefi,Se>·during cyclic loading,
each specimen had apparently increased in density.

90
Further analysis of the cyclic/conventional test data indicated
each specimen had higher strength characteristics and effective stress
ratios, than the corresponding conventionally tested CORS specimens.
This factor, coupled with the density increase, may have contributed
to the lack of full elastic rebound following the repetitive loading
tests of each specimen.
In addition, the cyclic/conventional test data indicated that
axial .strain to reproduce minimum volume was less than the corresponding
conventionally tested CORS specimens. This indicates a hardening
effect of the treated specimens during cyclic loading.' However, by
adding the axial strain produced during the cyclic loading only,
the combined or total axial strain of the cyclic/conventional tested
specimens was nearly identical to the corresponding conventionally
tested CORS specimens.
Volumetric strain and pore pressure, after cyclic/conventional
tests, followed the same pattern as axial strain. By adding the values
of each, obtained during cyclic loading only, the combined values of
total volumetric strain and total pore pressure were nearly identical
to the conventionally tested CORS specimens.
It therefore appeared likely that the slow, progressive movements
(possibly creep conditions) associated with the original conventional
triaxial tests, were not fully mobilized in the repetitive tests,
though minimum volume loads were utilized. This indicates two factors:
either (a) the response of the recording equipment was too slow, or
(b) somewhat larger loads can be applied to a treated granular base
material before minimum volume failure criteria is reached. It is felt

91
that the latter is more likely. If so, minimum volume failure criteria
from a conventional triaxial test could produce a factor of safety
against failure of a base course from transient traffic loads.
It is reasoned that the results of this series of tests indicate
a further potential feasibility of the use of minimum volume failure
criteria for analysis of the coefficient of relative strength'in
thickness design of a granular base material.
92
ACKNOWLEDGMENTS
Sincere appreciation is extended to the following organizations
and personnel: the Iowa Highway Research Board~ Iowa State Highway
Commission and US Bureau of Public Roads for their individual recogni
tion of the importance and value of research; Messers. S. E. Roberts,
Research Engineer, and Bernard Ortgies, Bituminous Engineer, Iowa
State Highway Commission, for their assistance and counseling.
In addition to those authors noted with the various sections of
this report, a special thanks to the following personnel of the
Engineering Research Institute, Soil Research Laboratory for their
untiring and valuable contributions to the research involved in this
project: Dr. Turgut Demirel, Professor of Civil Engineering, for his
efforts relating to the study by Marley and Handy (Ref. 12); to Messers.
Dick Johnson, Tim Peterson, Anthony Fung, Mike Lindebak, Don Davidson,
Brad Moses, Ed Basart, Dick Leland, Linda Bientema, Janice Kreamer
and John Schomburg who assisted as laboratory technicians at various
periods throughout the project; and to Mrs. Edna Wiser, secretary,
Soil Research Laboratory, who pulled her hair so often while typing
and retyping reports that a wig was needed to cover what was left.

93
SELECTED REFERENCES
1. J. M. Hoover, "Factors Influencing Stability of Granular Base Course Mixes," Final Report, Iowa Highway Research Board Project HR-99~ Engineering Research Institute, Iowa State-University, Contribution No. 67-10 of the Soil Research Laboratory (1967).
2. Russell 0. Fish,.t:I. M. Hoover, "Deformation Moduli of Asphalt ' Treated Granular Materials," Special Report, Iowa Highway Research Board Project HR-131. Engineering Research Institute, Iowa State University, Contribution No. 69-4 of the Soil Research Laboratory (1969).
3. E. G. Ferguson, J. M. Hoover, "Effect of Portland Cement Treatment of Crushed Stone Base Materials as Observed from Triaxial Shear Tests," Highway Research Record 255, pp. 1-15 (1968).
4. T. W. Best, J. M. Hoover, "Stability of Granular Base Course Mixes Compacted to Modified Density," Special Report, Iowa Highway Research Board Project HR-99. Engineering Research Institute, Iowa State University, Contribution No. 66-15 of the Soil Research Laboratory (1966).
5. H. H. Harmon, "Modern Factor Analysis," 2nd ed. revised, University of Chicago Press (1967).
6. N. C. Matalas, B. J. Reiher, "Some Comments on the Use of Factorial Analysis," Water Resources Research, l_: 1, 213-223 (1967).
7. L. H. Csanyi, H. P. Fung, "Traffic Simulator for Checking Mix Behavior," Highway Research Record 51, pp. 57-67 (1964).
8. H~c.H•.;lN:i.chols, "Flexible Pavement Research in Virginia," Highway Research Board Bulletin 269, pp. 35-50 (1960).
9. P. Arena, S. G. Shah, V. Adam, "Compaction Type Tests for Asphaltic Concrete Pavement," Highway Division Newsletter, American Society of Civil Engineers, p. 5 (Feb 1967).
10. F. H. Hveem, "Effects of Time and Temperature on Hardening of Asphalts," Highway Research Board, Special Report 54 ( 1960).
11. L. H. Csanyi, R. E. Cox, C. R. Teagle, "Effect of Fillers on Asphaltic Concrete Mixes," Highway Research Record 51, pp. 68-88 (1964).
12. J. J. Marley, R. L. Handy, "Behavior of Granular Materials under Triaxial Compression with Pulsating Deviator Stress," Special Report, Iowa Highway Research Board Project HR-131. Engineering Research Institute, Iowa State University, Contribution No. 69-5 of the Soil Research Laboratory (1969).

94
APPENDIX A

Table A-1. Triaxial test results for asphalt cement treated specimens at minimum volume (MV) and
maximum effective stress ratio (MESR) conditions.
ADphA1t Lateral Test Effective Pore pressure, Axial etrain, Volumetric Hodulua of Average
content. Coheeion 1 281 ~. desreea pre• sure, density. stress ratio sl 7:. a trai!\ '%. defon::ta.tion. ~ulUII, Poiaaon' e ratio
Material '1. MV HESR MV HESR psi pcf MV HESR Max ~[\' l'IESR MV HESR MV HESR H. psi H. poi Eq. 13!1 Eq. 211
429 4. 27 3. 57 13.16 43.56 42.38 10.0 134.4 5. 21 8. 55 0.3 0.3 - 0.3 0.602 1.687 - 0.182 0.083 8,900 a. 399.,
Li.e•tone 20.0 135.5 ~ 7.04 10.27 0.4 0.4 0.0 o. 759 l. 517 - 0.169 - 0.016 21,200 0.409::;:
30.0 135.4;; 4.37 5. 35 0.4 0.4 0.0 1.006 2.640 - o. 224 0.0 12,000 0.4390 40.0 134.0 .... 4.69 5.27 0.8 0:8 0.2 1.692 3.625 - 0.464 - o. 315 9,800 0.425
60.0 134.7 4.69 4.95 o. 7 0.6 0.4 l. 758 3.390 - 0.397 - 0. 316 12,980 0. 347
4. 27"' 2.10 7.82 39.86 39.58 10.0 136.7 5.19 7.38 0.3 0.3 - 0.8 0.37} 1. 257 - 0.111 0.270 13,200 0.408
4.34 0 20.0 134.4 "! 3.50 4.44 0.9 0.9 - 0.4 0.876 3.002 - o. 240 0,016 6,600 0.431;::
4.31 ~ 30.0 135.5 ~ 4.01 5.23 0.5 0.5 - 0.5 o. 749 2. 371 - 0. 224 0.064 12,800 0.431~
4.31 ~ 40.0 133.5 .... 3. 79 4.01 1.0 1.0 0.4 1.844 4.916 - 0. 391 - 0.188 . 6,000 0.4560 9,650 0. 379
5.02 - 0.06 13.06 42.69 37.06 10.0 137.4 3. 70 7.48 0.3 0.3 - 1. 2 0.253 l. 518 - 0.095 0. 355
5.02 8 10.0 dup 137.6 ~ 5.09 8.30 0.3 0.3 - 0.8 0.384 1. 279 -· 0.129 0.162 11,800 0.403;:;
4.98 • 20.0 136.0 ~ 3.89 5. 39 0.5 0.5 - l.O 0.632 2.529 - 0.169 0.250 9,400 0.441'":
4.98 .... 30.0 136.1 ... 4.27 4.79 1.5 1.4 - 0.6 1.371 3.489 - 0. 293 0.095 7,300 0.4490 9,4a0 0.382
479 4.27 9.39 33.06 40.41 38.11 10.0 129.3 6.85 15.40 0.1 0.1 - 0.2 0.374 1.122 - 0.070 0.281 18,800 0.434,..
0o10011te 20.0 130.1..o 6.17 11.61 0.1 0.1 - 0.1 0.504 1. 387 - 0.131 0. 262 25,900 0.427~
30.0 129.3 g 4. 73 7.44 0.1 0.1 - 0.1 0.499 1. 373 - 0.119 0.150 28,500 0.4340
40.0 131. 3 .... 4.09 6.39 0.1 0.1 0.0 0.508 1.651 - 0.121 0.282 32,000 0.432 \0
60.0 130.4 4.33 5.45 0.2 0.2 o.o 1.006 2.011 - 0.193 0.064 VI
26,300 0.421
::~::; - 1.15 10.77 42.05 40.28 10.0 130.4 3.38 7.69 0.2 0.2 - 0.9 0.246 l. 232 - 0. 087 0.342 13,700 0.405,..
20.0 130.8 ~ 3.87 6.19 0.4 0.4 - 0.4 0. 372 1.488 - 0.103 0.254 16,200 0.438~
4.26..; 30.0 130.0 g 3.94 5.13 0.3 0.3 - 0.3 0.613 1.839 - 0.151 0.071 18,000 0.4340
4.40 40.0 130.3 .... 3.88 4.80 0.5 0.5 - 0.1 0.863 3.082 - o. 257 - 0.056 14,400 0.432 15,580 0. 382
5.00 0 1.39 15.73 40.13 40.38 10.0 ~~;:~ ~ 5.33 9.90 0.3 0.3 - 1.0 0.323 1.163 - 0.102 0.253 14,950 0.406.,
5.00 0 20.0 3.92 7 .OJ 0.3 0.3 - 0. 7 0.388 l. 681 - 0.107 0.287 18,600 0.427~
5.00..; 30.0 132.1: 3.14 5.80 0.3 0.3 - 0.6 0.384 1. 793 - 0.122 0,163 21,300 0.429.Q
5.00 40.0 133.2 4.04 5.42 o.a 0.8 - 0.1 0. 777 2.072 - 0. 257 - 0.108 19,100 0.411 18,460 0. 352
728 4.47 - 2.27 22.35 41.25 39.53 10.0 135.2 3.58 12.40 0.1 0.1 - 0.6 0. 249 1.118 - 0.071 0.362 14,400 0.422,....
Dolcuite 20.0 135.0 ~ 2.86 8. 38 o. 2 0.2 - 0.3 0.251 1.255 - 0.048 0.305 22,300 0.454~
(cherty) 30.0 135.5,; 3.61 6.45 0.2 0.2 - 0.6 0.609 2.069 - 0.123 0. 384 19,800 o.438o
40.0 135.4::: 4.02 5.94 0.3 0.3 - 0.6 0.517 l. 937 - 0.166 0.191 24,800 0.427
60.0 136.0 3. 71 5.09 0. 3 0.3 0.0 0.884 2.400 - 0. 288 0.098 20,320 0.403
4.46 - 1.63 15.33 40.92 42.68 10.0 139.2 4.55 9.63 0.1 0.1 - 1.9 0.254 1. 270 - 0. 040 0. 703 17,900 0.452 0
4.49 ~ 20.0 139.6 ~ 2.36 7.67 o. 3 0. 3 - 1.8 0. 259 1.556 - 0.099 0.575 18, zoo 0.415:i
4.49 ..; 30.0 139. 7 ~ 4.19 6. 77 0.4 0.4 - 1. 2 0. 518 1. 682 - 0.116 0.406 25, zoo 0.4310
4.51 40.0 l38. 7 .... 3. 31 5.68 0.4 0.3 - 0. 7 o. 385 1.923 - 0. 124 0.288 31,000 0.423 23,100 0.410
5.00 10.22 29.58 31.98 38.52 10.0 141.7 5.50 12.10 0.6 0. 6 - o. 7 0. 327 1.047 - 0.136 0.297 16,300 0. 361
4. 98 g: 20.0 m:~: 5.37 10. l1 0.3 o. 3 - 1. 3 0. 325 1.4.11 - 0.089 0.646 29.700 0.42Q~
5.00 . 30.0 ).14 6.98 0.4 0.4 - 1.4 0.)26 1.824 - 0.122 0.546 23,000 0.429·:
4.9a ~ 40.0 140. g:! 2.99 6.05 0.6 0.5 - 1.1 0. 391 1.826 - 0.167 0.209 28,700 0. 399"' 24,400 0. 377
aSee eelected rll!fererace 2.

,-------------------------------------------------------------------------------------------------------------------------------------------------------------------------------------
Table A-1. Continued.
Asphalt Lateral Teat Effective Pore pressure, Axial strain, Voltmetric Hodu1WJ of Average content, Coheslon 1 2a1 ~. dc~ees prealJUre, density a tress ratio si ~ strain
1 ~ deformation, ~ulua, Poiaaon' • ratio Material 't MV MESR MV MESR poi pcf I!V MESR Max MV MESR '!IV MESR '!IV. MESR M, psi M, pal Eq. 1311 Eq. 211
1241 4.3 11.85 40.71 36.17 31.53 10,0 139.5 7.55 16.09 0. 2 0.2 - 0.5 0.647 1.554 - 0.130 0.220 14,200 0.411,., Gravel 20.0 l38. 7 6.62 9.23 0.4 0.4 - 0.2 0.641 1.538 - 0.196 0.008 18,400 o.4os::;
30.0 139.9"! 4. 21 7.38 0.4 0.1 - 0.8 0,645 2.064 - 0.131 0.246 24,400 0.426ci 40.0 140. 7~ 3.40 5.53 0.1 0.1 - 0.2 1.034 2.326 - 0.187 0. 228 20,800 0.424 40.0 dup 140,8""' 2.44 5.88 0,5 0.4 - 0,5 0.389 1.815 - 0. 067 0. 267 60.0 137.4 3. 78 4,62 0.5 0.5 0.0 1.143 2.922 - 0,195 0.098
19,450 0.396 4. 24 o. 70 11.62 35.53 34.89 10.0 138.7 3.47 6. 76 0.3 0.3 - 1,6 o. 249 1.244 - 0.078 0.298 9,900 0.439.., 4. 21 ..:1' 20.0 139.8"": 2.60 4. 70 0.3 0,3 - 1. 3 0.377 2.136 - 0.127 9.420 11,300 0.435j 4. 24 ~ 30.0 139.1~ 2.92 3.95 0. 7 0.6 - 1.1 0.624 2.62{1 - 0.165 0.362 10,100 0.453ci 4. 29 "" 40.0 139.9""' 2.86 3.85 0.4 0.4 - 0.9 0.502 2. 257 - 0.096 0.385 15,500 0.468
11,700 0.473
{ 10.0 !io 5~ mix
20.0 30.0 40.0
1269 3.90 6.50 10.30 36.68 35.73 10.0 130.1 6.69 7.99 0.5 0.5 0.1 1.036 1. !143 - 0. 250 - 0.042 7,010 0.468.., Gravel 20.0 129.7 4.42 4.90 0.4 0.4 0.0 1.015 2.665 - 0. 299 - 0.097 7,610 0.422j
30.0 130.8.-. 3.43 3.60 0.6 0.6 0.6 2. 294 3.059 - 0.486 - 0.478 2,920 0.463ci 40.0 129. JC:: 3.44 3.81 1.1 1.1 0. 7 3.005 4.884 - 0. 731 - 0.626. 4,590 0.434 40.0 dup 131.8::: 3.60 3. 76 0,8 0.8 0.5 2. 317 3.862 - 0.480 - 0.422 60.0 130.0 3.53 3.58 1.2 1.1 1.1 5.415 5.667 - 0.862 - 0.862 \.0
5,530 G. 34S 0'\ 3.98 1.46 9.42 38.35 33.50 10.0 131.4 3. 77 5.69 0.6 0.6 - 0.5 0.507 2.154 - 0.151 0.231 6,510 0.423 3.95 20.0 131.2 ... 3. 74 4.27 0.3 0.3 0.2 1. 515 3.788 - o. 344 - 0. 216 3,310 0.450~ 3.95 ~ 30.0 130. 7~ 3.42 3.76 1.6 1,5 1.3 2.395 4.413 - 0.498 - 0.458 2,830 0.462"": 3. 76 ..; 40.0 129.8- 3.34 3. 34 2.1 2.1 2.1 5.627 5.627 - o.8:ro - o.8:ro 0
3.98 40.0 dup 130.1 3. 21 3.30 2.3 2.2 1.9 4.464 7.652 - 0.920 - 0.855 1,500 0.471 3,530 0.384
ro.o No 5~ mix
20.0 30.0 40.0
1485 3.93 - 3.48 4,53 36.02 40.57 10.0 133.5 2. 71 5.63 0.1 0,1 - 0.5 0.387 1.808 - 0.104 0.553 6,000 0.445-Gravel 20,0 134.3 2.25 5.04 0.2 0.2 - 0.1 0. 260 1.691 - 0.065 0.562 12,000 0.450"' (sand) 20.0 dup 134 0~ 1. 75 4,49 0.1 0.1 - 0.4 0.254 2.159 - 0.079 0.938 j
30.0 134:3::; 2.15 4.70 0.3 0.3 - 0.9 0. 391 2.344 - 0,133 0.624 15,000 0.435 ci 40.0 133.4- 2.51 4.03 0.2 0.2 - 0.2 0.661 2.643 - 0.167 0.551 12,000 0.454 60.0 133.6 2;68 4.05 0.4 0.4 • 0.5 0. 772 2.444 • 0.182 0.207
11,250 0.422 3. 89 • 0.16 4.20 33.54 37.90 10.0 132.2 2.53 4.80 o. 2 0. 2 - 1. 2 o. 245 1.471 • 0.077 0.497 10,300 0.427.., 3.89 ;;:: 20.0 132. o": 2.38 3.92 0.3 0.3 • 1.9 0.366 2.195 - 0.092 0.641 11,300 0.451 j
3. 91..; 30.0 13l.S:::: 2.42 3. 71 0.5 0.4 1. 3 0.489 2.324 0.148 o. 397 11,200 0. 448 ci
3. 96 40.0 133.1- 2.48 3.63 0.6 0.5 - 0.8 0.616 2. 773 • 0,173 0.467 13,000 0.448 11,450 0.409
4.99 1.84 ),05 32.01 41.17 10.0 136.5.., 2.44 4.63 0.2 0.2 • 1. 3 0.196 1.436 • 0.078 0.592 7,418 0.446 0
4.99g 20.0 137.1..; 3.18 4.91 0.6 0.6 • 0.9 0.529 1.72{1 • 0.141 0.332 9,953 0.441 j
5.02,; 30.0 136.1: 2.34 4. 21 0.4 0.3 • 1. 3 0.394 2.103 • 0.133 0.475 15,687 0.434 0 5.02 40,0 137.8 2. 37 4.13 0.4 0.4 . 1.0 0. 397 1.984 • 0.126 0.413 20,084 0.440
13,285 0. 397
4 See selected reference 2.

Table A-1. Continued.
Asphalt Lateral Test Effective Pore pressure, Axial strain, Volumetric Modulus of Average content. Cohesion 1 281 11!. de~eea preailure, density, stress ratio oi 't • train 7. ~eform&tion, ~1W>, Pols•on 1 1 rati~
Kate:rial 1. KV MESR HV MESR poi pcf HV MESR ~tax HV MESR HV MESR HV MESR 11. poi 11, poi Eq. 13• Eq. 21&
. 1676 3.87 4.22 37.26 39.92 34.83 10.0 132.3 3. 29 16.90 0.2 0.2 - 0.4 o. 257 1.029 - 0.089 0.341 18,600 0. 366
Limestone 20.0 132.1.,., 5.60 9.69 0.2 0.2 - 0,2 0. 513 1.155 - 0.129 0.185 23,700 0.41~ 30.0 132.J:;i 4.16 6.90 0.4 0.3 - 0.4 0. 767 l. 918 - 0.139 0.229 21,800 0.429~ 40.0 133.0o-< 4.43 6.54 0.3 0.3 - 0.1 0.902 1.804 - 0.141 0.083 25,800 • 0.438
60.0 132.7 4.57 4.99 1.0 1.0 0.3 1,660 2.426 - 0.507 - 0.407 22,480 0.406 -
3.95 5.60 21.40 40.38 36.58 10.0 129.1,... 7.55 12.39 0.2 0.2 - 0.4 0.367 0.857 - 0.085 0.132 41,800 0. 328.,
3.94~ 20.0 129.2.,: 4.13 6.58 0.2 0.2 • Ot4 0.367 1.347 - 0.101 .. 0. 232 52,800 0.311::;
3.94..; 30.0 130.:1!:: 4.41 5.48 0.4 0.4 - 0.2 0.617 1.481 - 0.117 0.078 18,600 0.4500
3.96 40.0 130.4 4.40 5.24 0.4 0.4 - 0.1 0.986 2.219 - 0. 245 - 0.079 18,600 0.422 32,970 0. 282
5.06 6.71 26.26 35.71 38.26 10.0 135,2N 5.59 12.47 0.2 0.1 - 1.2 0.330 1.188 - 0.088 o. 267 14,876 0.423~
5.06~ 20.0 135.8.,; 4.32 8. 78 0,4 0.2 - 0.8 0. 397 1.457 - 0.069 o. 319 23,971 0.44)_j
5.00.,; 30.0 135.4:::: 3.37 6.88 0.2 0.2 - 1.0 0.395 1. 713 - 0.110 o. 262 25,270 0.4270
5.00 40.0 134.4 3.57 5. 77 0,5 0.5 - 0.8 0.525 2.101 - 0.143 0.244 25,bd4 0.4~7
22,450 0.390
1677 4.00 9.93 31.58 40.01 36.30 10,0 141.3 8.29 15.38 0.3 0,3 - 0.2 0,510 1.276 - 0,145 0.194 15,800 0.396,.,
Llme•toue 20.0 141,4N 5,01 9.49 0.3 0,3 - 0.3 0.508 1.396 - 0.121 0.137 21,800 0.411:; 30.0 139.1o 5.33 6.56 0,3 0.3 - 0.2 0.884 2.020 - 0. 234 0.016 17,800 0.4160 40.0 138.~ 5.10 6.04 0.3 0.3 0.0 0.997 2.118 - 0.184 0.032 22,200 0.437
60,0 141,4 4.09 5.03 0.9 0.9 0.2 1.151 2.814 - o. 295 - 0.082 \0 19,400 0.406
.....,.
4,03 4.51 13.66 40.12 37.41 10.0 136.4 5.30 7. 79 0,1 0.1 - 0.5 0.372 0.993 - 0.109 0.086 12,500 0.418
4.038 20.0 135.2"'! 4.87 6.51 0.3 0.3 - 0.4 0.611 1.711 - 0.170 ii.070 12,800 0.430';:;
4.044 30.0 136,4~ 4.24 4.79 0.6 0.6 0.2 1.232 2.464 - o. 300 - 0. 229 10,500 0.427~
4.04 40.0 136.3 ... 4.10 4.41 1.6 1.5 0.5 1. 728 3.702 - 0.450 - 0.316 8,200 0.433"' 11,000 0.346
4.96 .... - o. 73 14.26 43.02 38.74 10.0 1J6.4N 3.26 8.57 ~.3 0.3 - 0.4 0.123 1.349 - 0.008 0.531 12,100 0.4935:
4.96": 20.0 138.8.0 4.74 6.66 0.6 0.5 - 0. 7 0.625 2.126 - 0.184 0.176 11,100 0.433~
. 4.984 40.0 139.4:::: 4.07 4.74 1.5 1.3 0.2 1.383 3.143 - 0.435 - 0. 274 9,600 0.424° 8,200 0.376
1743 4.27 12.88 35.47 36.76 31.83 10.0 132.2 8.40 15.55 0.6 0.6 - 0.3 0.374 0.998 - o:l9o 0.071 22, zoo 0.304,...
Llme•tone 20.0 131. 7«> 5.53 8.25 0.9 0.9 - 0.1 0.492 1.108 - 0.148 0.016 21,200 0.404~
30.0 133.9.< 4.58 5.98 o. 7 0. 7 0.1 0,632 1. 391 - 0.153 - 0.016 20,100 0.431o
40.0 133.0:::: 4. 79 6.01 0.5 0.5 - 0.1 0. 751 1.627 - 0. 231 - 0.048 23,600 0.412
60.0 133.2 3.65 4.16 1. 2 1.3 0.6 1.121 2.366 - o. 302 - 0.183 21,780 0.390
4.08 0.23 10.58 39.12 39.28 10.0 134.4 3. 26 7.32 0.2 0. 2 - 0.9 0. 255 1.021 - 0.088 0.384 13,100 0.406~
4.08~ 20.0 134. 7"'! 3. 76 5. 75 0.4 0.4 - 1.1 0. 382 1. 273 - 0.105 0.257 16,500 0.435~
4.044 30.0 133. 6;:1; 3.35 4.91 0.3 0.3 - 0.8 0.508 2.288 - 0.153 0. 339 17,200 0.4310
4.04 40,0 133.6- 3.44 4.52 0.6 0.6 - 0.4 0.631 2.399 - 0,185 0.169 20,300 0.421 16,700 0.401
5.01 2.2.) 6.20 40.41 44.84 10.0 1l6. 5.,. 4. 74 7. 26 O.l O.l • o. 1 o. 381 1.162 • O.OM o. 2~2 10,500 0.438 ~ 0,522 1. 567 - 0.141 0. 232 16,300 0.418 ~·
5.o1:. 20.0 138. 6,D 4.12 6.61 0.5 0.5 - 1.2 0.449 0 4.944 30.0 136~8!:: 4.03 5.57 0.4 0,4 - 0.8 1.031 2.448 - 0.148 0.363 14,500
Membrane fD.ilure 13', 770 0.414
4.94 40.0 135.5
• See eelected reference 2.

Table A-1. Continued.
Asphalt Lateral Test Effective Pore pressure~ Axial strain, Volumetric Modulua of Average content, Cohea ion. E!Si ~. des:reea pressure, density, etress ratio si 7. I train 7. deforms.tion. !!!odulua. Poi•aon' a ratio
Ka.terial t MV MESR MV MESR psi pcf MV MESR Max :1V MESR MV MESR MV MESR M, psi M, psi Eq. 13& Eq. 21B
1746 4.07 8.18 39.54 44.24 37.75 10,0 133.9 9.66 19.64 0.0 0.0 - 0.4 D. 385 1.025 - D. 120 D. 256 28,100 0.367g Limestone 20.0 134.9 N 5. 73 11.54 0.0 0.0 - o. 2 0. 390 1.040 - o. 107 0.049 29,800 0.409.,.
30.0 130.3 .d 5, 87 7.58 o. 1 0.1 o.o 0.618 l. 360 - 0.181 - 0.055 27,400 0.406o .40.0 135.1:::: 5.84 7.49 0.4 0.4 - 0.1 0, 778 1.686 - 0.174 0.033 32,800 0.419 60.0 136.9 5.21 5.80 0.8 0. 7 - 0.2 1.179 2. 358 - o. 228 - 0.068
29,530 0.399 3.87 - 1.09 12.42 44.38 41.45 10.0 134.2 4.64 9.43 0.5 0.5 - 0.5 o. 370 1.232 - 0.132 0.186 11,300 0.398.., 3. 87 20.0 134.1 "! 4.24 6.47 0.5 0.4 - 0.4 0.625 1. 749 - 0.134 0,150 16,000 0.425~ 4.18 30.0 135.3;;!; 4. 22 5.66 0.5 0.5 - 0.4 0.642 2.310 - 0.212. 0.073 20,000 o.401o 4.18 40.0 135.0 ... 4.66 5.35 0.8 0.6 - 0,1 0.996 2.490 - o. 224 - 0.016 16, 5{)0 0.439
15,950 0.416 5.04 2.52 23.03 40.34 38.95 10,0 140.D 4. 27 12.62 0.3 0,3 1.0 o. 256 1.410 - O.D97 D.411 14,300 0.402 5.35 20.0 139.0"! 4.62 7.86 0.4 0.4 - o. 7 0.635 2.161 - 0,145 0.378 15,530 o.4zs::l 5.35 30.0 138.4:!: 4.15 6.32 0.4 0.4 - 0.8 0.635 2.160 - 0.146 0.162 19,070 0.435 ~ 5.04 40.0 141.0 ... 3.81 6.08 2. 3 1. 7 2.1 0.773 2.898 - 0.198 0.259 18,070 0.432°
16,740 0.408
1750 4.33 3. 78 22.01 41.90 39.81 10.0 136.5 7.95 14.99 0.3 0.3 - 0. 7 0.515 1.289 - 0.130 0.243 17,500 0.393 Lice stone 20.0 132.6'"' 4.53 6.97 0,3 0.3 - 0.5 0,494 1.729 - 0.141 0.157 11,700 0.445~ do1ocoite 30.0 133.2 i 3.90 6. 23 0.6 0.6 - 0. 2 0.882 2.268 - 0.153 0.088 18,400 0,431 ~
40.0 135.9 ... . 4.43 6.25 0. 3 o. 3 - o. 2 0,768 1.920 - 0. 230 0.049 26,600 0. 397° 60.0 134.9 4.42 5.05 1.0 1.0 0.2 1.395 2.536 - o. 349 - 0.211 \I)
18,550 0.382 00 3.90 1.86 8. 79 41.05 37.85 10.0 126.2"' 5.03 6.59 0.2 0.1 - 0.2 0.488 1.220 - 0.140 0.062 8,940 0.422.., 3.90 20.0 127.8...: 3.99 5.10 0.6 0.6 - 0.2 0. 724 3.015 - 0.124 0. 25'j 10,950 0.450on 4.00 30.0 129.1::: 4.09 4.33 1.2 1.2 0.8 2.184 3.854 - 0.404 - 0. 330 4,010 0.500~ 4.00 40.0 128.4 4.08 4.14 1.3 1.2 1.0 3.867 5.156 - o. 7U7 - 0.660 3,780 0.452°
6,920 0.343
1751 5.5 11.58 31.96 40.76 40.37 10.0 136.9 13.95 21.49 0.5 0.5 - 0.2 0.617 l. 357 - o. 235 0.008 22,200. 0.339.., L~stone 20.0 139.2.., 5.81 8.58 o. 7 0.6 - 0.3 o. 763 1. 780 - 0.137 0. ~17 16,900 0.433~ do1ccite 30.0 141.6..; 4.27 8.18 0.6 0.4 - o.s 0.880 2.38a - 0.178 0.371 19,400 0.4200
(1750) 40.0 140.6!: 4. 78 7. 23 1. 8 1.4 1. 2 1.138 2.529 - 0.227 0.114 21,300 0.420 40.0 dup 136.7 4.27 7.27 0.6 0.5 - 0. 2 o. 762 2.414 - 0.165 - 8:U? 60.0 136.6 4.78 5.92 0.6 0.6 - 0.1 1,373 2.622 - 0. 326
19,950 0.371 4.90 - 1.86 11.97 44.43 38.63 10.0 130.6 0 4.32 7.96 0.2 0,2 - 0.5 0.376 1.503 - 0.126 0. 275 10,900 0.405,.. 4.90 20.0 130.3...; 4.00 5.98 0.2 0.1 - 0.2 0.500 1.999 - 0.136 0.296 13,800 0.433~ 4.99 30.0 132.5: 4.16 4.86 0. 8 0.8 o.o l. 249 3.436 - 0. 309 - 0.059 8,300 0.4390 4.99 40.0 130.7 4.57 4,63 1.3 1.1 1.0 3,051 3.662 - 0.607 - 0.591 5,200 0.447
9,55Q 0.326 1772 Emulsion 0.59 1.55 37.28 37.03 10.0 127 .o 3.51 4.07 0.3 0.3 0.0 0.491 l. 717 - 0.116 0.000
Gravel 20.0 125.6 .... 3.10 3.11 1. 9 1. 9 1.7 3.644 4.858 - 0. 564 - 0. 564 30.0 127. 9::i 3.12 3.19 2.5 2.5 2.4 3.194 4.471 - 0.548 - o. 532 40.0 130.3 ... 3.17 3. 25 2.0 2.0 1.8 3.035 4.288 - 0.630 - 0.617
aSee selected reference 2.

Table A-1. Continued.
Asphalt Lateral Teat -Effective Pore preseure, Axial strain, Volumetric Modulus of. Average
content, Cohesion, 21ili ~. desrees pressure, dennity. stress ratio s! 7. strain 7.. de fonnation. modulus. Poisson 1 a ratio
Material ':. HV M£SR HV MESR psi pcf MV M£SR Max XV MESR MV HESR MV M£SR M, psi H. pa! Eq. n" Eq. nZ
1788 4.20 - 4.12 23.13 44.33 40.30 10.0 140.9 2.92 11.07 o. 2 0.2 - 2. 2 0.127 1.013 - 0. 056 0.669 21,500 0. 396
Dolomite 20.0 139.9 "! 3.07 8. 27 0.4 0.4 - 1.5 o. 257 1. 283 - 0. 081 0.445 23,700 0.4198
w1 th chert 30.0 139.7 ~ 4.00 7.20 0.8 0.8 - 1. 3 0. 729 1.823 - 0.170 o. 262 20,200 0.416 ""':
40.0 140.9 ~ 4.65 6.53 0.6 0.5 - 1. 3 0.632 1.644 - o. 250 0.161 31,600 0.370°
60.0 13!.5 4.10 5.01 0.9 0.9 - o. 7 0.889 2. 285 - 0.195 0.081 24,250 0.188
4.04 - 6.85 10.37 46.36 43.77 10,0 136.6 2.37 8,61 0.1 0.1 - 1.4 0.122 0.856 - U.061 0,375 19,200 0.390
4,04 20.0 136. r: 3.13 6. 72 0.2 0.1 - 1.4 o. 247 1.481 - 0.094 0.507 20,000 0.423:::!
4.05 30.0 138.1 ~ 4.05 6.33 0.5 0.4 - 0.6 0.494 1.481 - 0.125 o. 241 31,700 0.405""':
4.05 40.0 137.2 ~ 4.44 5.56 0.4 0.4 0.5 0. 742 1.856 0.165 0.142 27.300 0.424 ° 24,550 0.394
5.03 4.23 16.93 37.65 41.72 10.0 140.2 4.32 10.89 0. 2 0.2 - 0.8 0.252 1.008 - 0,063 0.411. 17,100 0.425.,
5.03 20.0 139.4 '"": 4.51 7 0 38 0.4 0.4 - 1.8 0.501 1.627 - 0.103 0.481 20,100 0.430~
5.01 30.0 139.9 ~ 3. 74 6.62 0.5 0.5 - 1.0 0,629 1.635 - 0.119 0.421 25,400 0.4240
5.01 40.0 139.3 ~ 3.46 5. 70 0.6 0.5 - 1. 7 0.501 2.129 - 0.128 0.440 31,500 0.421 23,530 0.379
1846 3.80 2.47 13.37 39.01 39.68 10.0 137.6 4.69 8.65 0.1 0.1 - 1.1 0.367 1.224 - 0.077 0.400 12,600 0.436
i..i•stone 10.0 rep 138.0 3.87 8.96 0.1 0.1 - 0. 7 0.249 0.872 - 0.071 o. 251
20.0 140.0 3,59 5.80 0.2 0.1 - 2. 2 o. 375 2.373 - 0. 166 0. 719 17,100 0.392~
20.0 rep 138.6 ~ 4.03 7. 78 0.1 0.1 - 0.5 0.250 0.625 - 0.063 0.118 ~
30.0 138.2 ~ 3.60 5.55 0.4 0.4 - l.O 0,632 2. 528 - 0.154 0.479 16,000 0.4370
30.0 rep 138.8 .. 4.95 7.53 0.4 0.4 - 0.5 0.383 0.638 - 0.118 - 0, 008 \.0
40,0 137.5 4.09 5.09 0.8 0.8 - 0.2 o. 740 2.836 - o: 278 0.072 17,300 0.414 \.0
60.0 138.5 3.43 4.40 0.5 0.5 - 0.4 0.994 3.231 - 0. 263 0.032 15,750 0.363
!:~~ :g 1.04 10.73 37.60 41.40 10.0 138.0 N 3. 76 7.64 0.1 0.1 - 2.2 0.248 1.613 - 0.054 0.691 15,200 0.439,..,
20.0 t:!?;a 00 3.54 6 26 0.3 0.3 - 1.1 0.499 1. 745 - 0.094 0.383 14,900 0.391!;
4.06.,; 30.0 137 0 9::: 2.91 5_49 0.3 0.3 - 1.0 o. 376 2.128 - 0,120 o. 367 16,600 0.4430
4.06 40.0 139.2 3.36 5.02 0.4 0.4 - 1.0 0.502 2, 258 - 0.144 0.327 23,400 0.433 17,530 0.403
5.00 2.38 10.94 36.31 43.90 10.0 141.6~ 3.88 9.12 0.2 0.2 - 0.9 0.255 1.276 - 0.056 0.451. 15,200 0.437 ~
5.00 g:: 20.0 142.2...: 3. 25 7.13 0.6 0.6 - 1.0 0.385 1.670 - 0.131 0.409 14,600 0.421 ~
4,96..; 30.0 140.8 :=; 3.43 6.11 0.5 0.5 - 1.1 0.510 2.169 - 0.155 0.480 17,800 0.427 0 4.96 40.0 141.0 3.05 5. 79 0.8 o. 7 - 1.0 0.513 2.566 - 0.189 0.444 19,500 0.423
16,780 0.388
1855 4.13 - 1. 79 18.96 45.43 42.45 10.0 134.2 2.69 10.14 0.1 0.1 - 1.2 0.124 0.993 - 0.039 0.484
Dolomite 20.0 133.4.., 5. 75 9.51 0.1 0.1 - 0.4 0. 369 0.984 - 0.086 0.156 30,800 0.424:::
cherty 30.0 134.7..; 4.35 7.29 0.2 0.2 - 0.3 0.375 1.249 - 0.142 0.087 30,300 0.402~
40.0 135.9::: 4.88 6.19 0.4 0.4 - 0.1 0,623 1.620 - 0.185 0.000 29,400 0.413°
60.0 134.9 4.68 5.44 0."4 0.4 0,0 0. 756 1. 764 - o. 248 - 0.128 30,200 0. 358
4.24 1.65 50.93 43.63 30.43 10.0 140.8.., 5. 22 18.50 0.1 0.1 - 0.9 o. 389 1.295 - 0.074 0.082 18,800 0.415.,
4.24~ 20.0 142.9.,; 5.18 11.02 0.3 0.3 - 0.2 o. 393 1.441 - 0.091 0.497 26,500 0.425~
4.24_; 30.0 137.5::: 4. 36 7.68 0.2 0.2 - o. 2 o. 377 1. 382 - 0.105 0.177 33,300 o.420o 4.44 40.0 138.0 4. 74 6.59 0.2 0.2 0.0 0.631 1.766 - 0.122 0.130 27,500 0.446
26' 50(' 0.439
5.03 - 1. 35 12.ll 44.15 49.70 10.0 137.8 ... 4.65 13.11 0.2 0.2 - 0, 7 0.255· 1.020 - 0.065 0.290 16,200 0.430.,.
5.00 0 20.0 141.7 0 4.29 10.56 0.3 0.3 - 1. 3 0.325 1.302 - 0.087 0.387 23,1100 0.428 ~ 5.03..; 30.0. mJ:=; 3.83 7.59 0.2 0.2 - 0.1 0.382 1.911 - 0,114 o. 383 27 •. ~00 8:mo 5.00 40.0 4.65 8.26 0.4 0.4 - 0.5 0.529 1.720 - 0.144 0.246 35,400
25,750 0. 392
8 See •elected reference 2.

Table A-1. Continued.
Asphalt Lateral Test Effective Pore pressure, Axial stra.in, Volumetric Modu1ua of Average
content, Cohesion 1 2e1 0, deB:reea pressure, density, stress ratio si '); strain 't deform.atioc., ~ulus, Poi aeon' B ratio
Material %. MV MESR MV MESR psi pcf MV liESR Max ~ MESR MV MESR MV MESR M. psi !1. psi Eq. 131 Eq. 21.
1903 5. 33 - 2.24 19.61 42.82 43.90 10.0 147.4 2.81 12.41 1.1 0.5 0.3 0.250 1. 622 - 0.047 0.644 11,200 0.452~
Gravel 20.0 148.1 "'! 3. 91 9.35 0. 2 0.1 - 0.1 0.507 1.900 - 0.160 0.433 14,800 0.414:i 30.0 147.6::; 4,45 8.90 0.4 0.3 - 0.5 0. 751 2. 252 - 0.151 0.318 21,300 0.427 0 40.0 147.8 ~. 3. 53 6.53 0, 7 0.5 0.0 o. 753 2. 636 - 0. 214 0.427 16,000 0,434 60.0 146.9 4.10 5.76 0.9 0.8 0. 2 1.494 3.486 - 0. 853 - o. 274
15,830. 0.394
5.06 - 4. 79 a. 10 42.97 45.56 10.0 143.1 3.66 8.83 0.4 0.4 - 1.1 0.374 0.698 - 0.063 0.644 14,400 0.429 5.06 20.0 144 9 ... 2. Z3 6. 75 o. 7 0.5 - 3. 2 o. 251 1.885 - 0.080 0.590 17,600 0.431:;:
5.07 30.0 144:6 ;; 3.45 6.52 0.9 0.8 - 0.3 0.618 2.224 - 0.142 0.354 18,300 0.431 ~ 5.07 40.0 143.0 ~ 3.83 6.01 0. 7 0.6 - 0.3 o. 737 2.455 - o. 211 0.164 18,300 0.430°
17.150 0.385
1904 3.80 4. 37 28.52 40.84 39.48 10.0 142.8 7. 79 15.98 0.6 0.6 - 0.9 0.500 1.500 - 0.134 0.307 16,700 0.390
Gravel 20.0 144.0,., 4.55 9.52 0.2 0.2 - 1 •. 3 0.371 1.485 - 0,086 0.476 22,400 0.436::! (1903) 30.0 142.8 ;; 3.62 6.40 0.5 0.5 - 1:4 0.500 1.999 - 0.134 0.443 20,600 0.429 ~
40.0 143.6 ~ 4.40 6.47 o.s o.s ·- 1.1 0. 746 2.ll2 - o. 222 0.348 25,800 0,403°· 60.0 143.1 4.17 5.58 0.6 0.6 - 0.3 0.995 2.486 - 0. 238 0.103
21,380 0.390 4.09 2.61 12.67 36.14 41.60 10.0 138.0 ... 3.54 9. 26 0.2 0. 2 - 0.8 0.234 '1.403 - 0.081 0.444 12,400 0.422.,. 4.09'~ 20.0 139.3,.; 3.55 6.61 0. 3 0.0 - 1.5 0.386 2.186 - 0.098 0.561 .16,100 0.440"' ...... 4.09 .q 30.0 138.3:::: 3.64 5. 76 0.6 - 0.1 0.6 0.489 2. 323 - 0.133 0.376 17,100 0.443~ 0 4.09 40.0 140.1 2.83 5.37 0. 7 0.7 . - 1.0 0.505 3.470 - 0.169 0.469 23,500 0.414 ° . 0
17,275 0.406
2318 4. 7 2.46 39.45 37.96 31.75 10.0 140.4 6.()() 16.12 0.2 0.2 - 1.1 0.381 1.142 - 0.096 0.385 16,600 0.410.., Limeotone 20.0 140.4 "! 2. 77 8. 25 0.5 0.5 - 2.0 0.247 1.361 - 0.078 0.515 19.700 0.432~
30.0 139.2 ~ 3.18 6.53 0.1 0.1 - 0.4 0.501 1.754 - 0.103 0.555 21,200 0.4410 40.0 139.1 ~ 3.61 5.80 0.6 0.6 - 1.5 0.~40 2.047 - 0.130 0.464 25,900 0.449 60.0 137.1 0.41 0.50 5.0 5.0 3.0 1.134 1. 765 - 0. 219 - 0.081
20,850 0.412 3.86 - 1. 77 16.98 41.20 41.32 10.0 137.7"' 3. 57 10.49 0.1 0.1 - 1.5 ·.0.124 0.869 - 0.055 0.368 3.86 20.0 137.4...: 2. 91 7.53 0.4 0.4 - 1.2 0.249 1.367 - 0.079 0.456 23,400 0.420;:; 3.94 30.0 137.6:::: 4.21 6.39 0.3 0.1 - 1;6 0.494 1.607 - 0.133 0.368 23,500 0.428~
3.94 40.0 137.7 3.35 5.83. 0.4 0.4 - 1.2 0.620 1.859 - 0.134 0.300 24,900 0.4340 23,900 0.384
4. 76 - 1.16 14.81 40.99 42.97 10.0 139.4 3.89 10.07 0.2 0.2 - 1.6 0.254 1. 270 - 0.072 0.522 15,300 0.419 4.81 20.0 1J9.6 ~ 3.06 7.34 0,4 0.4 - 2.1 o. 378 '1. 892 - 0.096 0.632 13,800 0.444j 4, 76 30.0 140.2:;; 3. 79 6.58 0.4 .. 0 .• 3 - 1.8 0.507 1.900 - 0.112 0. 521 19.300 0.447 . 4.81 40.0 139.9 ~ 3.67 5.86 0.0 - 0.5 - 1.0 0.632 1.895 - 0.104 0.394 22,200 0.457 0
17,650 0.458
aSee selected reference 2.
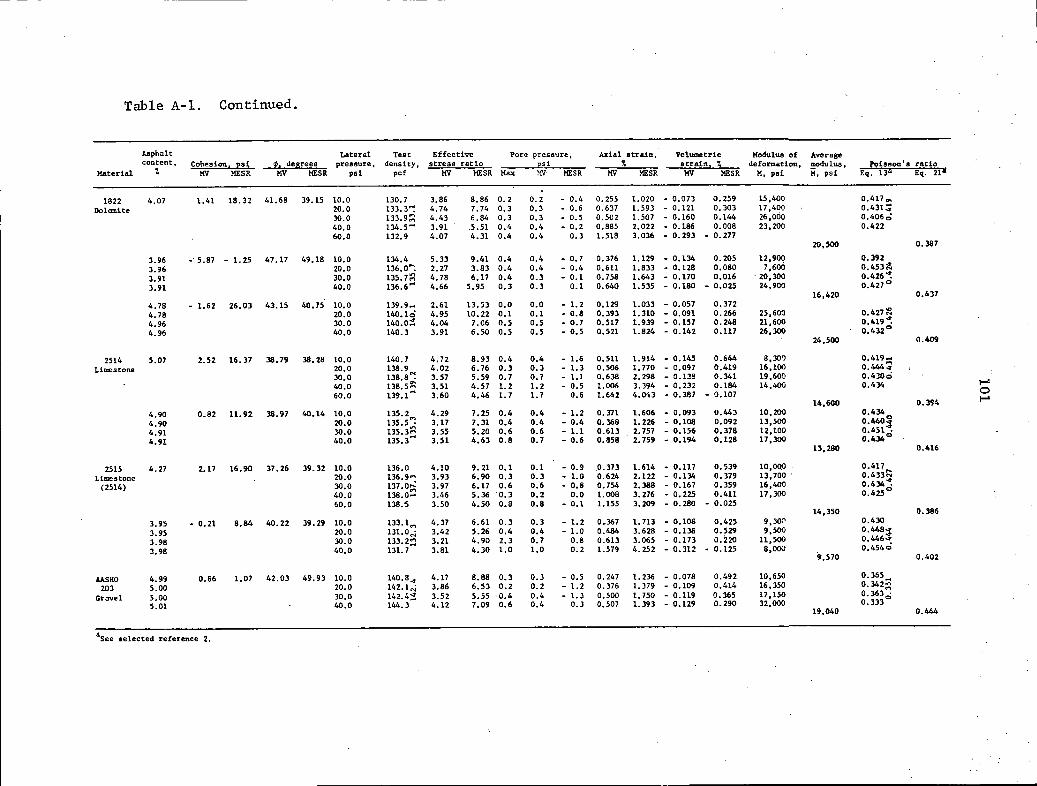
Table A-1. Continued.
Anphalt Lateral Teat Effective Pore preseure, Axial atrain, Volumetric llodulua of Average content. Coheeion 1 2s1 $: 1 deB!ees pressure, density, stress ratio osi 'r. strain
1 'r. deformation, _!Odulua, Poieeon 1 s ratio Material '1. MV MESR MV MESR psi pcf MV MESR Max ~!V MESR MV MESR HV MESR M, psi M, psi Eq. t3ll Eq. n•
1822 4.07 1.41 18.32 41.68 39.15 10.0 130,7 3.86 8.86 0.2 o. 2 - 0.4 0.255 1.020 - 0.073 0.259 15,400 0.417"' Dolomite 20.0 133. 3~ 4.74 7. 74 0.3 0.3 -. 0.6 0.637 l. 593 - 0. 121 o. 303 17,400 0.431::;
30.0 133.9::l 4.43 6,84 0.3 0.3 - a. 5 0.502 l. 507 - 0,160 a.t44 26,000 o.406o 40.0 134.5- 3.91 .5.51 a.4 0.4 - a. 2 0.885 2.a22 - 0.186 a.oos 23,200 0.422 60,0 132.9 4.07 4.31 0.4 0.4 0.3 1.518 3.036 - 0. 293 - 0. 277
20,500 0.387
3.96 -· 5.87 - 1. 25 47.17 49.18 10.a 134.4 5. 33 9.41 0.4 0,4 - o. 7 0. 376 1.129 - 0.134 0.205 12,900 0.392
3.96 20.0 136.0": 2.27 3.83 0.4 0.4 - 0.4 a.6ll 1.833 - 0.128 0.080 7,600 0.453Ci!i
3. 91 30.0 135. 7::l 4. 78 6.17 0.4 0.3 - 0.1 0.758 1.643 - 0.170 0.016 . 20,300 0.426'":
3.91 40.0 136.6 .. 4,66 5. 95 0,3 0.3 0.1 0.640 1.535 - 0.180 - 0.025 24,900 0.427° 16,420 0.437
4. 78 - 1.62 26.03 43.15 40.75 10.0 139.9 .. 2.61 13.53 0.0 0.0 - I. 2 0.129 1.033 - 0.051 0.372 4. 78 20.0 140.1o 4.95 10.22 0.1 0.1 - 0.8 0.393 1.310 - 0,091 0.266 25,600 0.427:!l 4.96 30.0 14o.o;:!; 4.04 7.06 0.5 0.5 - 0. 7 0.517 1.939 - 0.157 0.248 21,600 0.419'":
4.96 40.0 140.3 3.91 6.50 0.5 0.5 - 0.5 0.521 1.824 - 0.142 0.117 26,300 0.432° 24,500 0.409
2514 5.01 2.52 16.37 38.79 38.28 10.0 140.7 4.72 8.93 0.4 0.4 - 1.6 0.511 1.914 - 0.145 0.644 8,30'1 0.419.-
Limestone 20.0 138.9 4.02 6. 76 0.3 0.3 - l. 3 0.506 1.770 - C,097 0.419 16,100 0.444~ 30.0 138.8~ 3.57 5.59 o. 7 0. 7 - 1.1 0.638 2.298 - 0.138 0.341 19,600 o.4JOo 40.0 138.5~ 3.51 4.57 1.2 1.2 - 0.5 1.006 3.394 - 0. 232 0.184 14,400 0.434 t-'
60.0 139.1- 3.60 4.46 1. 7 1. 7 0,6 1.642 4.043 - 0.387 - 0.107 0 14,600 0.394 t-'
4.90 0.82 11.92 38.97 40,14 10.0 135.2 4.29 7.25 0.4 0.4 - 1.2 0.371 1.606 - o. 093 0.443 10,200 0.434
4.90 20.0 135.5': 3.17 7.31 0.4 0.4 - 0.4 0.368 1.226 - 0.108 0.092 13,500 0.440~ 4.91 30.0 135. 3~ 3.55 5.20 0.6 0.6 - 1.1 0.613 2. 757 - 0.156 0.378 12,100 0.451 •
4.91 40.0 135.3- 3.51 4.63 0.8 0. 7 - 0.6 0.858 2.759 - 0.194 0.128 17,300 0.434 ° 13,2110 0.416
2515 4.27 2.17 16.90 37.26 39.32 10.0 136.0 4.10 9.21 0.1 0.1 - 0.9 .0.373 1.614 - 0.117 0.539 10,000 0.417,... Limestone 20.0 136,9M 3.93 6.90 0.3 0.3 - l.O 0.624 2.122 - 0.134 0.379 13,700 ~::~~ (2514) 30.0 m.o:;; 3.97 6.17 0.6 0.6 - 0.8 0.754 2.388 - 0.167 0.359 16,400
40.0 138.0- 3.46 5.36 0.3 0.2 0.0 1.008 3.276 - o. 225 0.411 17,300 0.425°
60.0 138.5 3.50 4.50 0.8 0.8 - 0.1 1.155 3.209 - o. 280 - 0.025 14,350 0.386
3.95 - o. 21 8.84 40.22 39.29 10.0 133.1.., 4.37 6.61 0.3 0.3 - 1. 2 0_367 1. 713 - 0.108 0.425 9,300 0.430
3.95 20.0 131.a.; 3.42 5.26 0.4 0.4 - l. 0 0.484 3.628 - 0.138 0.529 9,500 0.448~
3.98 30.0 133.2::: 3.21 4.90 2.3 0. 7 0.8 0.613 3.065 - 0.173 o.220 11,500 0.446 ...
3.98 40.0 131.7 3.81 4.30 l.O l.O 0.2 1.579 4.252 - 0.312 - 0.125 8,000 0.4540 9',570 0.402
MSHO 4.99 0.86 1.07 42.03 49.93 10.0 140.8_,. 4.17 8.88 0.3 0.3 - 0.5 o. 247 1.236 - o.a78 0.492 10,650 0.365_
203 5.00 20.0 142.1.; 3.86 6.53 0.2 0.2 - l. 2 0.376 1. 379 - 0.109 0.414 16,350 0.342::;:
Gravel 5.00 30.0 142.4~ 3.52 5.55 ·0.4 0.4 - l. 3 a.500 1. 750 - 0.119 0.365 17,150 g:~jo 5.01 40.0 144.3 4.12 7.09 0.6 0.4 a.J 0,507 1.393 - 0.129 0.290 32,000
19,040 0.444
a.See &elected reference 2.

•
Table A-2.
Moi•ture Material content, 't
429 7. 37 7.52 ~ 7.21,..: 7.45
479 9.45 0
9.81-<t 9.27 ci. 9.05
1485 6.97 7.26~ 6.83,..: 7.65
1676 7.90.., 7.95 ": 7.83 .... 8.24
1846 6.91 6.70~ 6.89.; 6.67
1855 6.08 7.02~ 6.16.; 7.04
1904 5.31 5.57~ 5. 47.; 5. 35
AASHO 6.00 295 6.00
crushed 6.00 atone 6.00
Triaxial test results for optimum moisture-treated specimens at minimum volume (MV) and maximum effective stress ratio (MESR) conditions.
Lateral Dry Effective Axial Volumetric Moduluo of Average. Cohesion 1 E:Si ~ 1 deEees pressure, density, stress ratio Pore 2ressure 1 E;Si strain
1 t strain1 '%. deformation, IJO<iulus, Poimaon'• ratio
Min vo1 MESR Min vol MESR psi pcf Min vol MESR Hax Min vol MESR Min vol MESR Min vol MESR psi psi Eq. 13& Eq. 13"
- 4.51 12.20 45.18 45.56 10.0 136.48 .... 3.56 11.23 2.0 0.8 0.6 0.364 2.425 - o. 131 1.054 8,393 0.409 20.0 136.46 ": 3.10 8.13 1.9 1.0 1.5 0.515 2.577 - 0.197 0.683 10,676 0.409 ~ 30.0 137.26 ~ 4.07 7.39 1.8 1.0 1.4 0.896 3. 201 - 0 •. 295 0. 730 12,997 0.406 ""; 40.0 135.71 ~ 4.42 6.41 2. 3 1.2 2.1 1. 31! 3. 277 - 0.484 0.221 12,802 0.392 °
11,217 0.333
0.38 8.40 42.52 47.29 10.0 132.78 4.81 10.0 0.3 0.3 - 1.0 0.491 1.842 - 0.162 0.663 8,675 0.407 20.0 130.51 iii 3.90 7.01 1. 2 0.9 0.3 0.870 3.729 - 0. 275 0.984 7,578 0.421 c:; 30.0 130.92,..; 4.29 7.66 1.2 D.9 0.8 0.886 3.166 - 0.353 D. 763 13,478 0.388 ""; 40.0 130.58:::: 4.23 6.34 1.1 1.D 0.1 1.138 3.161 - 0.441 D.321 14,409 D.387 °
11,D35 0.336
1.15 5.87 38.93 44.16 10.0 126.99"' 3.98 7.03 D.2 D.2 - D.3 0.378 1.258 - D.142 0.507 10,596 D. 390 2D.D 127.69 ~ 3.74 6.03 D.1 0.1 - 0.8 0.502 1.882 c 0.183 o. 732 14,439 0.401: 30.0 128.05 :::; 3.33 5.68 0.3 0.3 - 0.2 D.508 1.777 - D. 243 D.388 19,622 a.3TJ ~ 40.0 127.85 .... 3.58 5.18 a.3 0.3 - 0.2 a. 741 2.161 - D. 301 D.321 19,405 a. 388 o
16,D15 D.315 3.00 14. ro 41.69 45.62 10.0 132.85 .... 5.14 10.75 0.4 0.3 - 0.9 0.393 1.638 - 0.132 0. 737 11,422 D,405 ....
20.D 131.64 .... 4.68 8.99 D. 7 0.3 - 0.2 0.656 1.967 - 0. 256 0.429 13,028 0,390"' 30.D 132.18 ::i 4.64 7.46 D.5 D.5 0.2 0.920 2.301 - o. 366 0.262 14,049 o. 386 ~ 40.0 131.78 .... 4.19 6.62 1. 3 1.2 1.0 1,043 2.608 - 0.421 0.107 15,4i3. 0.3@:!
0
ll,498 D. 307 - 1.83 7.92 44.33 48.64 10,0 135.45 ~ 3.49 10.14 o.s 0.5 - 0.5 0.249 1.866 - 0.142 0. 789 13,291 0.347""
20.0 135.23.; 4.88 8.13 0.9 D.8 - D.a D.746 2.486 - D. 302 0.778 12,495 D. 375 ~ 30.0 135.D7 :::: 3.85 7.20 1.1 D.4 D.D a.632 2.527 - 0. 274 0.597 17,822 a.J79 0 40.0 136.22 4.51 7.15 1.0 0.8 - 0.1 0.869 2.593 - o. 368 0.437 21,008 0,369
16,154 0.318
- 3.16 17.32 46,55 47.86 10.0 139.21:!: 4.64 14.19 0.8 0.7 - 0.4 0.324 1.684 - 0.151 1.023 14,041 0.350 20.D 137.18,..: 4.82 10.65 0.5 0.5 - 0. 3 0.510 1.914 - 0.194 0.802 18,221 0 384~ 30.0 137.53:::: 3.81 8.50 0.2 0.2 - 0.5 O.S07 1.646 - 0.161 0.524 23,460 o:401:;; 40.0 137.87 5.20 8.02 0.6 0.6 - 0.3 0.778 2. 269 - o. 316 0. 237 26,787 0.369
20,627 0.331
0.67 15.67 42.02 44.80 1D,O 1J9,53 N 4.67 11.35 D.2 0.2 - D.9 0.318 1.656 - D.092 0.987 12,977 D.420
20.0 138.70 ~ 4.30 8.70 o. 7 0.4 - o. 2 0.489 1.833 - 0.162 0.664 16,719 0.405§ 30.0 138.49 ~ 3.80 7.31 0.4 0.3 - 0.8. 0.507 2.219 - 0.185 0. 766 21,320 0.4030 40.0 137.75 .... 4.26 6, 53 0.3 0,3 - 0. 7 0.644 2.255 - 0. 213 0.479 25;390 0.406
19,101 0.360 - 5. 74 11.!0 49.01 50.17 10.0 144.2 3. 72 13.32 0,6 0.4 - 0.1 0.393 2.486 - 0.150 0.935 9,350 0.232
20.0 147.6 "' 3. 79 9.61 o. 7 0.6 - 0.1 0.525 2.623 - a. 203 0. 797 13,300 0.251;;!; 30,0 145.6 "' 5.63 9.65 1. 3 1.0 0.7 0.928 2.981 - 0. 290 0.704 17,850 0.307 ~ 40.0 144.5 ::! 5.18 7. 97 1.1 0.9 o. 7 1.176 3. 266 - o. 512 0.128 17,500 o. 226 °
14,490 0.336
"see oelected reference 2.
1-' 0 N

103
APPENDIX B

Table B-1. Correlation matrix, bituminous-treated field mixes, minimum volume conditions, 10 psi lateral pressure.
Average Effective Percent Sand Minus No. Specific modulus of Poisson's stress Pore Axial Volumetric Modulus. of Poisson' a asphalt equivalent 200 sieve gravity <b Cohesion deformation ratio 8 ratio pressure strain strain deformatiou ratiob Density
Percent asphalt 1.000
Sand equivalent - 0,094 1.000
Minus Mea 200 sieve 0.159 - o. 267 1.000
Specific gravity 0.248 - 0,161 0.392 1.000
~ 0.092 - 0. 232 0.530 0.685 l.OOO
Cohesion 0.030 - 0.463 0.224 - 0.129 - 0.356 1.000
Average modulus of defol"ttL!ltion - 0.044 - 0.172 0.661 0.539 0.512 0.152 1.000
Poisson• s rat.io 8 0.097 0.192 - 0.048 - 0.142 - 0.418 0.289 - 0,091 1.000
Effective streG• ratio 0.244 - 0.500 0,303 - 0,011 - 0.139 0.828 0.146 0.159 1,000
Pore r!"~,~·Jre 0.339 - 0,028 - 0.097 0.015 - o. 232 0.300 - 0,372 - 0.019 0.353 1.000
Axial strain 0.005 - o. 202 0.116 - 0.598 0.497 0.540 - 0. 583 0.138 0.534 0.441 1.000
VolUIOJetric strain - 0.123 0.375 0.082 0.396 0.408 - 0.632 0.444 - 0.054 - 0.690 - 0.602 - 0.855 1,000
Modulus of deformation - 0.021 - 0. 312 o. 724 0,487 0.519 0.244 0.911 - o. 206 0.318 - 0. 210 - 0;435 0.205 1.000
Poisson's ratiob - 0.102 0.496 - 0. 292 - o. 341 - 0.091 - 0. 535 - 0.485 0.052 - 0.566 - 0. 262 0.116 0.328 - 0.614 1.000
Density 0.428 0.280 - 0.037 0.245 0.126 - o. 211 - 0.041 - 0.126 - 0,032 0.311 - 0.121 0.190 - 0.119 0.083 1.000
aEquatiotJ (21). selected reference 2.
bEquatlon (13). selected reference 2.
~ 0 ~
![BANNED ITEMS RECOGNITION BY OWA OPERATOR · (OWA) Ordered Weighted Averaging (OWA) is the central concept of information aggregation, was originally introduced by Yager.[3] OWA facilitates](https://img.dokumen.tips/doc/110x75/5d01f61c88c993c2488b952b/banned-items-recognition-by-owa-operator-owa-ordered-weighted-averaging-owa.jpg)