Embed Size (px)
Citation preview

Energy Transition in the Power Sector in China: State of Affairs in 2016 Review on the Developments in 2016 and an Outlook
ANALYSIS
* RES-Share on power consumption
*

Energy Transition in the Power Sector in China: State of Affairs in 2016
IMPRINT
ANALYSIS
Energy Transition in the Power Sector in China: State of Affairs in 2016
Review on the Developments in 2016 and an Outlook
COMMISSIONED BY:
China National Renewable Energy CentreRoom B2204-2209Guohong MansionMu xidi Beili, Jia No. 11Xicheng District | Beijing 100038 | Chinawww.cnrec.org.cn
Agora EnergiewendeAnna-Louisa-Karsch-Straße 210178 Berlin | Germany www.agora-energiewende.de
AUTHORS:
Energy Brainpool Brandenburgische Str. 86/8710713 Berlin | Germany
Simon Göß Marie-Louise Niggemeier
116/06-A-2017/ENPublication: June 2017Revised version
Layout: UKEX GRAPHIC, Germany Urs KarcherCover image: own illustration
Please cite as: Energy Brainpool (2017): Energy Transition in the Power Sector in China: State of Affairs in 2016. Review on the Developments in 2016 and an Outlook. Analysis on behalf of Agora Energie-wende and China National Renewable Energy Centre.
www.agora-energiewende.dewww.cnrec.org.cn
MANY THANKS TO:
Sandra Retzer and Xinnan Wang (GIZ)

3
Preface
Dear readers,
Last year, China overtook Germany as the world’s leader for installed solar capacity. In 2016 alone, 34 GW solar PV were installed in China, while Germany merely added a single GW. This is not China’s only distinction. China has also started an energy transition with its own dynamics and charac-teristics. However, this transition resembles what we have already observed in Germany and Europe.
While it is true that China is still the largest energy consumer and emitter of greenhouse gases, its rapid surge of coal-fired power plants has slowed, and the increase in emissions has come to a halt. Further-more, the government has begun a rapid expansion of renewable energy. In the diplomatic arena, the Chinese government has reiterated its commitment to
the Paris climate agreement, despite the USA’s recent volte-face.
In this annual review, we provide a more compre-hensive picture of the latest development of China’s power system. The review focuses on recent data regarding the supply and demand of power from renewable and conventional sources.
Your feedback is more than welcome. We hope you enjoy reading this review.
Wang ZhongyingChina National Renewable Energy CentrePatrick GraichenDirector Agora Energiewende
Total electricity generation increased by five per cent in 2016, or by about 300 TWh. At 65 per cent, coal provides the largest share of total generated electricity. Renewables account for 25 per cent. Consumption increased by 283 TWh, comparable to the entire consumption of Spain.
However, there is a clear trend towards renewable energy. Since 2010, the share of renewables in the power mix has increased by 8 percentage points, while coal has decreased by 11 percentage points.
Curtailment of renewable energy is high, averaging 17 per cent. Some provinces, like Gansu and Xinjiang, plan to slow down wind capacity expansion in the coming years. Furthermore, the government is encouraging expansion of the transmission grid.
Use of conventional power plants is decreasing. Full load hours for coal plants decreased from more than 5,000 hours in 2013 to 4,165 hours in 2016, and energy-related emissions have stagnated at 2013 levels. However, the government is reviewing its plans for new coal plants, and another 200 GW of coal-fired power plants are under construction and are expected to go online by 2020.
Key findings
4
3
2
1

4
Content
Data and Methodology 5
1. Power generation 6
2. Power consumption 9
3. Development of renewable energy 11
4. Development of conventional energy 17
5. Outlook 20
References 21

ANALYSIS | Energy Transition in the Power Sector in China: State of Affairs in 2016
5
Data and Methodology
Compiling an annual review within the first half of a following year always comes with certain obsta-cles – this is true for Germany, Europe and even more so globally. Reliable and recent data sources are sometimes hard to find, and even if reliable sources exist, some compromises regarding completeness of data have to be made. For this review, we have asked Energy Brainpool to compile the most appropriate data to provide a comprehensive and consistent pic-ture of the Chinese power system in 2016.
If not indicated otherwise, data are sourced from the annual electricity statistics provided by the China Electricity Council. Many of the data sources used in this report are Chinese language policy documents or statistics. They have been sourced from China Energy Portal, a website that collects Chinese policy docu-ments, news, and statistics, and offers [partial] trans-lations of these.1 Over the years the annual electric-ity statistics (2009-2016) changed slightly in their composition and degree of detail. English translations of the annual electricity statistics can be found on the China Energy Portal.2 Furthermore, no detailed or consistent information on capacities and generation by oil, geothermal, waste, biomass, offshore wind and concentrated solar power are available. Generation denoted as “other” is not defined in the data source. In this report, it denotes energy generation from oil, geothermal, waste and biomass.
Whenever an exchange rate is used for conversion from Chinese Yuan to Euro we refer to the exchange rate of April 3, 2017 of 1 CNY = 0.136108 EUR.
1 chinaenergyportal.org/en/
2 chinaenergyportal.org/en/2010-detailed-electricity- statistics/

6
Agora Energiewende | Energy Transition in the Power Sector in China: State of Affairs in 2016
1. Power generation
In 2016, Chinese power generation increased by more than 5 per cent, or 296 terawatt hours, compared to 2015, reaching a total of 5,990 terawatt hours (Euro-pean Union: 3,211 terawatt hours). In 2016, the bulk of Chinese electricity was produced by thermal power plants, mainly coal, which accounted for 65 per cent (or 3,906 terawatt hours) of the country’s total power generation.
This is an increase of more than 40 per cent, or 1,761 terawatt hours, compared to 2010. Of this total, fossil fuel power plants generated an additional 870 ter-awatt hours (mainly coal, with 680 terawatt hours). Wind contributed 190 terawatt hours of the addi-tional electricity, solar PV 66 terawatt hours, nuclear 140 terawatt hours, and hydro power almost another 500 terawatt hours. In relative shares, renewable
energy (excluding biomass)3 grew by 8 percentage points, from 17 to 25 per cent, while coal-fired gener-ation declined 11 percentage points.
In 2016, the share of renewable energy in power gen-eration amounted to 24.8 per cent, or 1,488 terawatt
3 In general, renewable energy includes: hydro (run-of river and pumped storage), wind (onshore and offshore), PV and biomass. However, detailed data are not available for onshore and offshore wind. Also, no data are available on concentrated solar power. Therefore, data on hydro in this report contains both run-of-river and pumped hydro, data on wind includes onshore, and probably off-shore, and data on solar only includes PV. Data on power from biomass are not consistent. Therefore, no separate biomass statistics are considered in this report. Along with oil, geothermal, and waste, biomass is considered as “other” generation in this report. Biomass is also not considered in the capacity data in this report. Biomass capacity stood at about 15 GW at the end of 2016.
Power generation mix in China 2010 and 2016: while the share of coal is declining, the share of renewables is increasing. Figure 1
“Other” includes biomass, waste incineration, geothermal and oil, due to limited data availability. China Electricity Council
Coal65 %
Renewables 25 %
Gas3 %Gas
2 %
Other3 %
Other3 %
Nuclear4 %
Generation in 2010: 4,230 TWh Generation in 2016: 5,990 TWh
Hydro 16 %
Hydro 20 %
Wind power1 %
Solar power1 %
Wind power4 %
Renewables 17 %
Coal76 %
Nuclear 2 %
+ 40 %

ANALYSIS | Energy Transition in the Power Sector in China: State of Affairs in 2016
7
hours. To put this into perspective: In Europe, renew-able energy accounted for 29.6 per cent of total power generation, and only 23.8 per cent if biomass is excluded.4
Year-over-year, all generating technologies produced more electricity than in the previous year. However, there are stark differences between the individual technologies. In 2015-2016, the lowest increase on a year-over-year basis came from coal-fired gen-eration, which only grew 1.3 per cent, while wind grew by 30 per cent, solar PV by 72 per cent, nuclear by 24 per cent, and gas by 13 per cent. Hence, new generation from wind and solar outstripped new generation from coal- and gas-fired thermal power plants, the latter of which grew by 84 and 73 terawatt hours, respectively. Including hydro, new generation from renewable sources was higher than the addi-
4 Agora Energiewende and Sandbag, 2017.
tional generation from all conventional power plants, including nuclear. Electricity production by nuclear power plants grew by 42 terawatt hours compared to 2015.
Annual power generation by energy source in 2010–2016: the share of power generation from renewables is growing faster than total power generation. Figure 2
China Electricity Council
6,000
5,000
4,000
3,000
2,000
1,000
02010 2011 2012 2013 2014 2015 2016
Renewables Nuclear CoalGasOther
4,228
3,224 3,7073,713
3,9814,027 3,854
3,906
75 8798
112133
171213
78 109110
116133
167188
115 8597
120139
162195
736 743962
1,0391,243
1,3361,488
4,981
5,3675,676
4,731
5,6905,990

Agora Energiewende | Energy Transition in the Power Sector in China: State of Affairs in 2016
8
Year-on-year increase (2015 to 2016) of generation from all technologies in terawatt hours: new
generation from renewable energy outstripped new generation from conventional generation. Figure 3
China Electricity Council
70
60
50
40
30
20
10
0
[ Cha
nge
from
20
15 to
20
16 in
TW
h ]
Coal Gas Nuclear Hydro Wind Solar
52
21
42
69
56
28
Year-on-year increase (2015 to 2016) of generation from all technologies in per cent: while new
generation growth from coal was low, new generation growth from wind and solar,
as well as nuclear, were considerably high. Figure 4
China Electricity Council
80 %
70 %
60 %
50 %
40 %
30 %
20 %
10 %
0 %
[ Per
cen
t ch
ange
of g
ener
atio
n ]
Coal Gas Nuclear Hydro Wind Solar
1 %
13 %
24 %
6 %
30 %
72 %

ANALYSIS | Energy Transition in the Power Sector in China: State of Affairs in 2016
9
2. Power consumption
Since 2010, China’s net power consumption grew by 1,720 terawatt hours, roughly half of Europe’s total electricity consumption in 2015.5 Consumption grew in all sectors6, but the manufacturing industry (sec-ondary sector) is clearly dominating, with demand increasing by 1,060 terawatt hours since 2010. The biggest percentage increase between 2010 and 2016 however took place in the services industry (tertiary sector) with 78 per cent, which indicates the sectoral shift the Chinese economy is undergoing. House-holds increased consumption by 58 per cent. Over the years, the absolute growth of electricity consumption gradually levels off. While total consumption grew by 12 per cent from 2010 to 2011, the year-on-year
5 ENTSOE, 2016.
6 Primary industry: Agriculture; Secondary industry: Mining, manufacturing, construction; Tertiary industry: Service, knowledge, retail
increase from 2015 to 2016 only stood at 5 per cent and even stagnated the previous year.
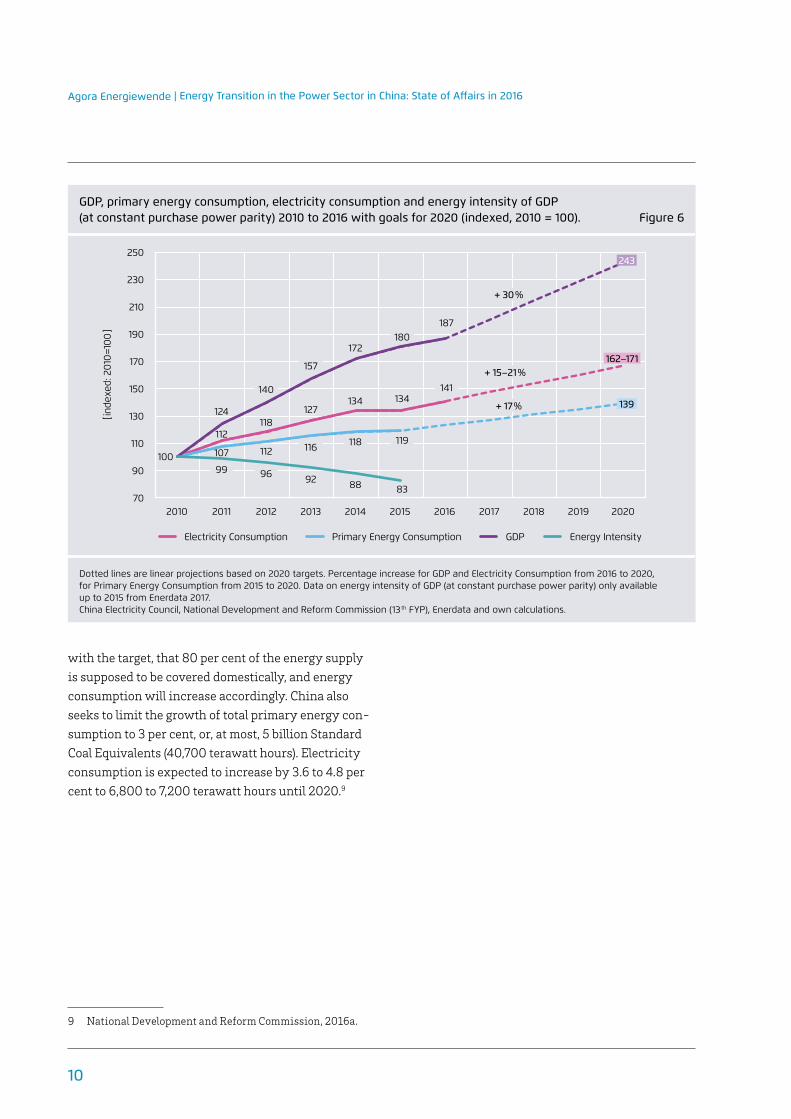
While China’s economic growth and energy con-sumption are closely linked, China’s economy is becoming less dependent on energy consumption to fuel GDP growth. The adoption of energy efficiency technologies, particularly within energy intensive industries, and the growth of China’s service sector, are lessening the energy intensity of GDP, as Figure 6 shows.7
In its 13th Five-Year Plan (2016-2020)8, the Chi-nese government aims to achieve GDP growth of at least 6.5 per cent to 92.7 trillion Yuan in 2020. Along
7 IEA, 2016; Financial Times, 2016; KPMG, 2016.
8 Central Committee of the Communist Party of China, 2016.
Chinese sectoral power consumption, 2010–2016. From 2010 to 2016 the share of the tertiary and the residential power consumption grew faster than total power consumption. Figure 5
China Electricity Council
6,000
5,000
4,000
3,000
2,000
1,000
0
2010 2011 2012 2013 2014 2015 2016
Primary sector Residential electricity consumptionTertiary sectorSecondary sector
[ Pow
er C
onsu
mpt
ion
per
Sect
or in
TW
h ]
4,702
5,342
5,920
5,639 5,637
4,966
4,200
509
562623
679694 727
805
510569
627667 716
796
448
3,1453,528 3,672 3,933 4,177 4,093 4,211
98 101 100 103 101 102 108
Agora Energiewende | Energy Transition in the Power Sector in China: State of Affairs in 2016
10
with the target, that 80 per cent of the energy supply is supposed to be covered domestically, and energy consumption will increase accordingly. China also seeks to limit the growth of total primary energy con-sumption to 3 per cent, or, at most, 5 billion Standard Coal Equivalents (40,700 terawatt hours). Electricity consumption is expected to increase by 3.6 to 4.8 per cent to 6,800 to 7,200 terawatt hours until 2020.9
9 National Development and Reform Commission, 2016a.
GDP, primary energy consumption, electricity consumption and energy intensity of GDP (at constant purchase power parity) 2010 to 2016 with goals for 2020 (indexed, 2010 = 100). Figure 6
Dotted lines are linear projections based on 2020 targets. Percentage increase for GDP and Electricity Consumption from 2016 to 2020, for Primary Energy Consumption from 2015 to 2020. Data on energy intensity of GDP (at constant purchase power parity) only available up to 2015 from Enerdata 2017. China Electricity Council, National Development and Reform Commission (13th FYP), Enerdata and own calculations.
250
230
210
190
170
150
130
110
90
702010 2011 2012 2013 2014 2015 2016 2017 2018 2019 2020
[ inde
xed:
20
10=1
00
]
100
838892
116
127
157
118
134
172
119
134141
180187
9699
107
124
112
112
118
140
243
+ 30 %
+ 17 %
+ 15–21 %162–171
139
Electricity Consumption Primary Energy Consumption GDP Energy Intensity

ANALYSIS | Energy Transition in the Power Sector in China: State of Affairs in 2016
11
3. Development of renewable energy
In 2016, renewable energy generated 24.8 per cent of China’s total electricity, and covered about 25.1 per cent of the country’s power consumption. The share of renewables in power consumption was 1.1 per-centage points higher compared to 2015, and 7.6 per-centage points higher compared to 2010.
The targets of the 12th FYP, covering the period 2010–2015, with 290 GW for hydropower, 100 GW for wind and 21 GW for PV, were exceeded by 30 GW for hydropower, 30 GW for wind and more than 20 GW for PV.10 From 2010 to 2016, about 115 GW of hydro power, almost 120 GW of wind power, and more than 77 GW of solar power were connected to the Chinese power grid.
10 National Development and Reform Commission, 2016b.
11
In terms of electricity generated, hydro power con-tributed the most to renewable generation, with 1,180 terawatt hours in 2016 (80 per cent of the total renewable electricity). Wind turbines generated 241 terawatt hours (16 per cent of the total renewable generation), and solar energy 66 terawatt hours (4 per cent of the total renewable generation).12 Electricity output from hydropower fluctuates due to its strong dependence on precipitation patterns, as only 1-2 per
11 2020 targets include 5 GW of concentrated solar power and 5 GW of offshore wind power.
12 Biomass is not included in renewable generation here due to data integrity and consistency. If it were included, its share in renewable generation in 2016 would have been in par with PV, standing at roughly 4 per cent.
Renewable generating capacity from 2010 to 2016 and targets for 2020 10: very moderate capacity additions for hydropower are expected when compared to wind and solar. Figure 7
China Electricity Council, National Development and Reform Commission (13th FYP)
Wind SolarHydro
700
600
500
400
300
200
100
02010 2011 2012 2013 2014 2015 2016 2020
[ Ins
talle
d G
ener
atio
n Ca
paci
ty in
GW
]
262305
346
411
474
551
558
660
3046
6177
97131
149210
233 249 280 305 320 332 340
23
1625
43
77
216
110

Agora Energiewende | Energy Transition in the Power Sector in China: State of Affairs in 2016
12
cent of China’s hydro power generation comes from pumped-hydro stations13.
The 13th FYP for Renewable Energy14 includes gener-ation targets for solar power (at least doubling today’s generation), wind (almost doubling today’s genera-tion) and hydro (only a slight increase).
Wind and solar power in China are being supported by a feed-in tariff (FiT), which is differentiated according to so-called geographical resource types or
13 Hydro data includes all types of hydro power: dam hydro, run-of-river and pumped hydro. The generation share of pumped-hydro during 2010-2016 was in the range of 2 per cent of the entire hydro generation. The capacity share of pumped-hydro stands at 7 per cent of the total hydropower generating capacity (deviation between capacity and generation due to different production pat-terns of run-of-river and pumped-hydro).
14 National Development and Reform Commission, 2016b.
categories.15 Depending on solar irradiation or wind speed, the feed-in tariff is adjusted to create similar economic conditions across the country. The feed-in tariff is guaranteed for a period of 20 years for PV. For wind onshore, projects have to be approved by a ten-dering process before getting a FIT granted.
With 34 GW newly installed PV capacity, China set a new world record in 2016. Triggered by a reduction of the FIT in the second half of the year, 22 GW were installed in the first six months.16 These astonishing installation rates were possible due to a strong growth
15 The area of Tibet is not included in these resource areas, but specific rules apply for Tibetan projects.
16 China Electricity Council, 2016a; Projects that have been approved until the end of 2015 and built before the 30th of June 2016 could still apply for the 2015 feed-in tariffs. Projects where construction was finished after June 30, 2016 fell under the new feed-in tariff regime.
Power generation from renewable energies (hydro, wind, and solar) from 2010 to 2016 and targets for 2020: accordingly, the share of wind and solar in total renewable power generation is projected to grow from 20 per cent in 2016 to 30 per cent in 2020. Figure 8
China Electricity Council, National Development and Reform Commission (13th FYP).
2,000
1,800
1,600
1,400
1,200
1,000
800
600
400
200
0
2010 2011 2012 2013 2014 2015 2016 2017 2018 2019 2020
687
1,250
668856 892
1,060 1,112 1,181
49
420
8
2439
66
145
4
74
103138
160185
241
[ Gen
erat
ion
in T
Wh
]
Wind SolarHydro
ANALYSIS | Energy Transition in the Power Sector in China: State of Affairs in 2016
13
in PV module fabrication that drove down prices for PV panels. In the second half of 2016, new module fabrication capacity of 12 GW was constructed.17
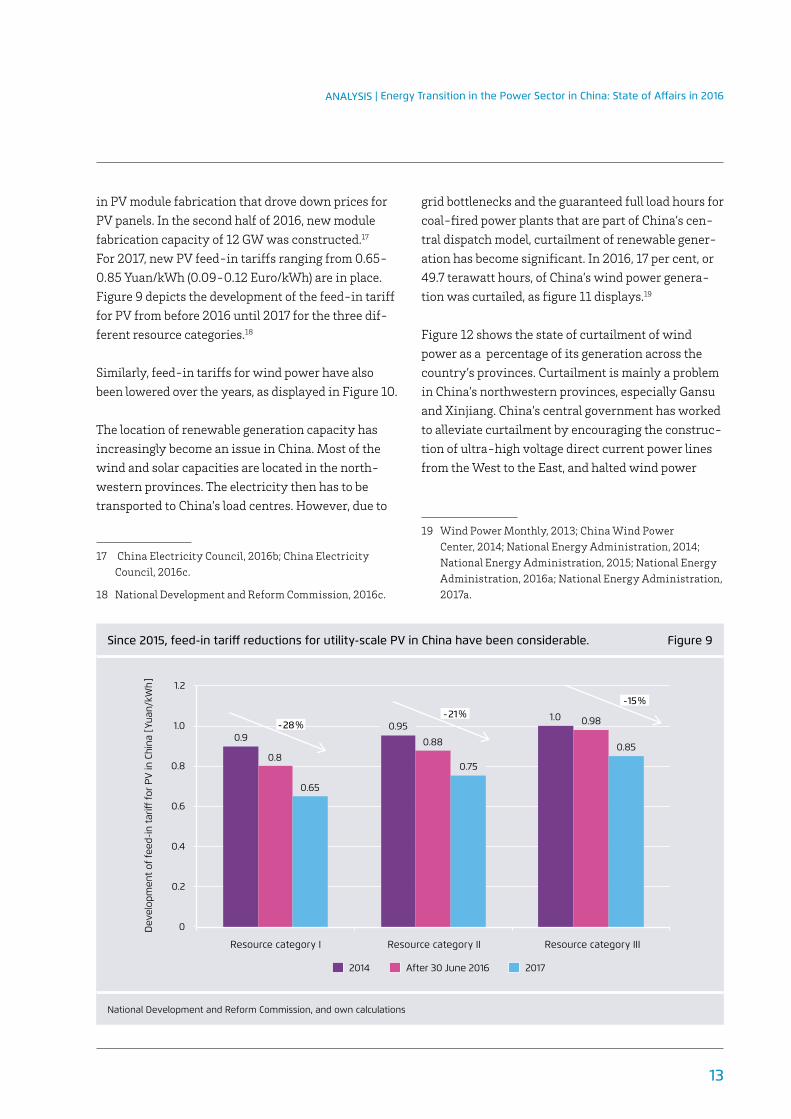
For 2017, new PV feed-in tariffs ranging from 0.65-0.85 Yuan/kWh (0.09-0.12 Euro/kWh) are in place. Figure 9 depicts the development of the feed-in tariff for PV from before 2016 until 2017 for the three dif-ferent resource categories.18
Similarly, feed-in tariffs for wind power have also been lowered over the years, as displayed in Figure 10.
The location of renewable generation capacity has increasingly become an issue in China. Most of the wind and solar capacities are located in the north-western provinces. The electricity then has to be transported to China’s load centres. However, due to
17 China Electricity Council, 2016b; China Electricity Council, 2016c.
18 National Development and Reform Commission, 2016c.
grid bottlenecks and the guaranteed full load hours for coal-fired power plants that are part of China’s cen-tral dispatch model, curtailment of renewable gener-ation has become significant. In 2016, 17 per cent, or 49.7 terawatt hours, of China’s wind power genera-tion was curtailed, as figure 11 displays.19
Figure 12 shows the state of curtailment of wind power as a percentage of its generation across the country’s provinces. Curtailment is mainly a problem in China’s northwestern provinces, especially Gansu and Xinjiang. China’s central government has worked to alleviate curtailment by encouraging the construc-tion of ultra-high voltage direct current power lines from the West to the East, and halted wind power
19 Wind Power Monthly, 2013; China Wind Power Center, 2014; National Energy Administration, 2014; National Energy Administration, 2015; National Energy Administration, 2016a; National Energy Administration, 2017a.
Since 2015, feed-in tariff reductions for utility-scale PV in China have been considerable. Figure 9
National Development and Reform Commission, and own calculations
After 30 June 2016 20172014
0.9
0.8
0.88
0.65
1.2
1.0
0.8
0.6
0.4
0.2
0
Resource category I Resource category II Resource category III
Dev
elop
men
t of
feed
-in t
ariff
for
PV
in C
hina
[ Yu
an/k
Wh
]
- 28 %- 21 %
- 15 %
0.95 0.98
0.85
1.0
0.75

Agora Energiewende | Energy Transition in the Power Sector in China: State of Affairs in 2016
14
The wind power curtailment situation in China showed improvement until 2014, but worsened again during the past two years. Figure 11
National Energy Administration
12.3
20.8
33.9
49.7
16.212.3
60
50
40
30
20
10
0
18 %
16 %
14 %
12 %
10 %
8 %
6 %
4 %
2 %
0 %
2011 2012 2013 2014 2015 2016
[ Cur
tailm
ent
in T
Wh
]
Curt
ailm
ent
Rat
e of
Win
d Po
wer
Pro
duct
ion
14 %
17 %
11 %
8 %
15 %
17 %
Feed-in tariff reductions for onshore wind power in China have been lower than those for PV since 2009. Figure 10
Years denote the eff ective date of the feed-in tariff . National Development and Reform Commission and own calculations 19
2015 2016a2009 2016b 2017
0.510.54
0.56
0.61 0.61 0.6 0.58 0.570.54
0.510.49
0.520.5
0.47
0.58
0.480.49 0.470.44
0.4
0.7
0.6
0.5
0.4
0.3
0.2
0.1
0Resource category I Resource category II Resource category III Resource category IV
Dev
elop
men
t of
feed
-in t
ariff
for
Win
d in
Chi
na [
Yua
n/kW
h ]
- 22 %- 13 %
- 16 %- 7 %

ANALYSIS | Energy Transition in the Power Sector in China: State of Affairs in 2016
15
expansion in six provinces, Xinjiang, Ningxia, Gansu, Heilongjiang, Jilin and Inner Mongolia.21
Full load hours for hydro power fluctuated between 3,000 and 3,700 hours per year. Wind turbines had an average of 1,740 hours, and PV power plants just
20 For projects that have been approved since the start of 2016, or approved before 2016, but where construction has not commenced by the end of 2017, the 2016a feed-in tariff applies. For projects that will be approved after the beginning of 2018, the 2016b feed-in tariff is valid. For projects that will be approved from beginning of 2018 or before 2018, but where construction has not commenced by the end of 2019, the 2017 feed-in tariff applies.
21 Central Committee of the Communist Party of China, 2010 (12th Five-Year-Plan), State Grid Corporation of China, 2017; National Energy Administration, 2017b.
above 1,100 hours in 2016. Figure 13 shows a clear downward trend for full load hours of wind and solar PV, a trend that is explained by curtailment rates and increasing capacity deployment in less resource-rich locations.22 Solar irradiation values across China reach about 1,500 kWh per m² (Germany: ~1,050 kWh/m²). However, China possesses a large number of sites with very good resources. For exam-ple, Beijing is located further south than Madrid and considerable PV capacities are installed in areas as far south as Northern Africa and the Mediterranean Sea. Thus, full load hours of PV are significantly higher than Germany’s 980 hours per year.23
22 National Energy Administration, 2016b.
23 Solargis, 2017.
Curtailment rates for wind power in diff erent Chinese provinces in 2016. Figure 12
own illustration
> 20
10–20
< 10
Wind power curtailment 2015
Tibet
Qinghai
Ningxia13 % (13 %)
Yunnan4 % (3 %)
Gansu43 % (39 %)
Hebei9 % (10 %)
Inner Mongolia21 % (18 %)
Xinjiang38 % (32 %)
Heilongjiang19 % (21 %)
Jilin30 % (32 %)
Shanxi9 % (2 %)
Shaanxi7 % (– %)
BeiingTianjin
Shandong
Jiangsu
Anhui
Zhejiang
Fujian
GuangdongGuangxi
Guizhou
Chongqing
Hunan
Hubei
Henan
Sichuan
Taiwan
Hainan
Jiangxi
Shanghai
Liaoning
(x %)

Agora Energiewende | Energy Transition in the Power Sector in China: State of Affairs in 2016
16
Full load hours of hydro, wind and solar power from 2010 to 2016. Figure 13
Full load hours already include curtailment; theoretically, full load hours are higher; for PV, no accurate data is available prior to 2012. China Electricity Council
4,000
3,500
3,000
2,500
2,000
1,500
1,000
500
0
2010 2011 2012 2013 2014 2015 2016
Full
Load
Hou
rs o
f RE
plan
ts [
> 6
MW
, ave
rage
] 3,404 3,591 3,669 3,621
2,047 1,929
1,4231,235
1,105
1,9001,742
Hydro Wind Solar

ANALYSIS | Energy Transition in the Power Sector in China: State of Affairs in 2016
17
4. Development of conventional energy
Despite the tremendous growth in Chinese renewable energy, the country’s power system is based on con-ventional thermal generation. In 2016, China’s con-ventional power generating capacity stood at about 1,050 GW, which represents an increase of more than 40 per cent (equivalent to 300 GW) over the last seven years. With 943 GW of installed capacity in 2016, coal-fired power plants clearly dominate the picture. Figure 14 shows the capacity build-up from 2010 to 2016, including the targets of last year’s 13th Five-Year Plan for energy for 2020.24
While coal capacity has witnessed steady growth in recent years, the generation of electricity from coal-fired power plants has been stagnate since 2013 (at between 3,900 and 4,000 terawatt hours).
24 National Development and Reform Commission, 2016a.
Accordingly, and due to increased capacity, the full load hours of thermal power plants decreased by almost 1,000 hours.25 With about 4,160 full load hours in 2016, Chinese plants experienced their lowest level of full-load operation in the past three decades (see figure 16).
Although China’s electricity system is oversupplied, load centres on the East coast experience situa-tions with tight supply during peak load times. This is mainly due to the re-location of coal plants away from consumption centres to reduce air pollution. In order to tackle power imbalances between the gener-ation bases in less populated areas and the load cen-tres, China is expanding its transmission system.26
25 Liu, J. Zhang, J., Tian F., Mi, Z., 2017; IHS Markit, 2016; China Electricity Council, 2016d.
26 China Electricity Council, 2015,
Capacity build-up, 2010–2016, with 2020 goals for conventional generation. Figure 14
Coal capacity-build up is limited to 1,100 GW. China Electricity Council, National Development and Reform Commission (13th FYP)
Gas NuclearCoal
1,400
1,200
1,000
800
600
400
200
02010 2011 2012 2013 2014 2015 2016 2020
[ Ins
talle
d G
ener
atio
n Ca
paci
ty in
GW
]
672710
811859
923993
1,046
1,268
9 34
3843
5766
70
110
660755 796 841 895 943
1,100
1311
1315
2027
34
652
58

Agora Energiewende | Energy Transition in the Power Sector in China: State of Affairs in 2016
18
Power generation in thermal power plants in China, 2010–2016: thermal power generation has remained on a similar level since 2013. Figure 15
China Electricity Council
4,500
4,000
3,500
3,000
2,500
2,000
1,500
1,000
500
0
[ Gen
erat
ion
in T
Wh
]
2010 2011 2012 2013 2014 2015 2016
NuclearCoal Gas
3,376
3,224 3,7073,713
3,9814,027 3,854
3,90675
87 98112 133 171 213
78
109 110116 133 167 188
3,9274,214 4,298
3,9094,196 4,307
Full load hours of thermal power plants are at a decade low, due to overcapacities in the thermal sector and increased generation from renewables. Figure 16
China Electricity Council
8,000
7,000
6,000
5,000
4,000
3,000
2,000
1,000
0
2010 2011 2012 2013 2014 2015 2016
Full
Load
Hou
rs [
aver
age
]
7,840 7,7597,855 7,874 7,787
7,4037,042
5,031 5,3054,982 5,021
4,7784,364 4,165
Thermal Nuclear

ANALYSIS | Energy Transition in the Power Sector in China: State of Affairs in 2016
19
The central government has started a number of ini-tiatives regarding coal-fired power plants. The 13th Five-Year Plan for Energy calls for a two-year mora-torium on the approval of new coal-fired power sta-tions in provinces with a power surplus, which will be reviewed after three years. Furthermore, 20 GW of less efficient capacity will be shut down until 2020, while old coal-fired power plants are required to undergo strict efficiency upgrades, and the construc-tion of new ones will be limited to a total capacity addition of 200 GW up to 2020.27
27 National Development and Reform Commission, 2016a.
The stagnating electricity generation from coal-fired power plants, and the government’s initiatives, has had a strong impact on the country’s CO₂ emissions while also stirring hopes that China’s carbon emis-sions could peak earlier than envisioned by the Chi-nese government. A Greenpeace analysis shows that Chinese energy-related carbon emissions have not risen since 2014.28
28 Greenpeace: Energydesk, 2017.
Year-on-year percentage changes of CO₂-emissions of China’s fossil fuels, 2010–2016: emissions remained on a similar level since 2014 and have even decreased in 2015. Figure 17
Greenpeace
10
8
6
4
2
0
-2
-4
20112010 2012 2013 2014 2015 2016
Yea
r-on
-yea
r ch
ange
of C
O₂-
emis
sion
s fr
om fo
ssil
fuel
s in
Chi
na [
in %
] 5.1
8.4
2.22.8
0.2 0.3
-2.2

Agora Energiewende | Energy Transition in the Power Sector in China: State of Affairs in 2016
20
5. Outlook
The 13th FYP calls for a further shift toward inno-vation and aims at balancing economic growth with environmental protection. The Chinese gov-ernment has established targets for the country’s energy and power sector.29 By 2020 China aims to have an installed power generating capacity of about 2,000 GW, an increase of more than 300 GW from 2016 levels.
Coal-fired power plants should at most make up 200 GW of newly installed capacity. At the same time, investment into renewables will amount to approx-imately 340 billion euros up to 2020. By that time,
29 National Development and Reform Commission, 2016a.
total wind and solar power capacities are forecasted to reach at least 210 and 110 GW, respectively.30
The reform of China’s power market that was initi-ated in March 2015 has already impacted the coun-try’s power sector. The reform’s influence will only grow in years to come, especially due to the introduc-tion of power trading, as a surge in long-term power trading platforms was seen last year, and a pilot spot market is planned for 2018.31
30 National Development and Reform Commission, 2016b.
31 China Electricity Council, 2016e.
Installed generating capacity of China’s power sector in 2016 and 2020 in GW: a capacity increase of more than 20 per cent, or more than 300 GW, is planned. Figure 18
China Electricity Council, National Development and Reform Commission (13th FYP)
Solar: 77.4Solar: 110
Gas: 70.1 Gas: 110
Nuclear: 33.6 Nuclear: 58
Capacity in 2016: 1,604 GW
Capacity in 2020: 1,928 GW
Hydro: 332.1
Hydro: 340
Wind:148.6
Wind:210
Coal:942.6
Coal:1,100

21
References
Agora Energiewende and Sandbag, 2017, Energy Transition in the Power Sector in Europe: State of Affairs in 2016, Review on the Developments in 2016 and Outlook on 2017.
Central Committee of the Communist Party of China, 2010, The 12th Five-Year Plan for economic and social development of the People’s Republic of China 2010-2015, Beijing, Central Committee of the Com-munist Party of China. English translation available via chinaenergyportal.org/en/12th-five-year-plan/
Central Committee of the Communist Party of China, 2016, The 13th Five-Year Plan for economic and social development of the People’s Republic of China 2016-2020, Beijing, Central Committee of the Com-munist Party of China.
China Electricity Council, 2015, CEC publishes the Demand/Supply Analysis and Forecast of China Power Industry 2014, english.cec.org.cn/No.105.1534.htm
China Electricity Council, 2016a, PV: Celebration over first half of 2016; some concern for second half. www.cec.org.cn/xinwenpingxi/2016-08-04/ 156563.htmlEnglish translation available via chinaenergyportal.org/en/pv-celebration-first-half-2016-concern-second-half/
China Electricity Council, 2016b, Still much opportunity for PV after June 30th, www.cec.org.cn/xinwenpingxi/2016-08-17/157136.html . English translation available via chinaenergyportal.org/en/still-much-opportunity-pv-june-30th/
China Electricity Council, 2016c, At new low in elec-tricity prices PV enterprises facing big test, www.cec.org.cn/xinwenpingxi/2016-10-13/159451.html English translation available via chinaenergyportal.org/en/new-low-electricity-prices-pv-enterprises- facing-big-test/
China Electricity Council, 2016d, Serious coal over-capacity might lead to industry-wide losses, www.cec.org.cn/xinwenpingxi/2016-08-15/ 156979.html
China Electricity Council, 2016e, 13th Five-Year-Plan for the electricity sector, www.cec.org.cn/yaowenkuaidi/2016-11-08/160744.html English translation available via chinaenergyportal.org/en/13th-fyp-for-the-electricity-sector-full-text/
China Wind Power Center, 2014, Wind power cur-tailment analysis report in China, www.cwpc.cn/cwpp/en/services/cwpc-news- service/wind-power-curtailment-analysis-report- china/
CREIA, Chinadialogue, 2016, Green Power Purchas-ing Intention of Chinese Customers, chinadialogue- production.s3.amazonaws.com/uploads/content/file_en/9259/Green_Power_ Purchasing_Intention_of_Chinese_Consumers.pdf
Enerdata, 2017, Energy intensity of GDP at constant purchasing power parities, Global Energy Statisti-cal Yearbook 2016, yearbook.enerdata.net/energy- intensity-GDP-by-region.html
ENTSOE, 2016, Electricity in Europe 2015, Brussels, European Network of Transmission System Oper-ators for Electricity, www.entsoe.eu/Documents/ Publications/Statistics/electricity_in_europe/ entsoe_electricity_in_europe_2015_web.pdf
Financial Times, 2016, China GDP: Out with the old economy, www.ft.com/content/a82ca2de-02a6-11e6-99cb-83242733f755
Greenpeace: Energydesk, 2017, China coal consump-tion falls for third year running, energydesk.green-peace.org/2017/02/28/china-carbon-CO₂-emissions-coal-oil-energy-2016/

Agora Energiewende | Energy Transition in the Power Sector in China: State of Affairs in 2016
22
IEA, 2016, Energy Efficiency Market Report 2016, www.iea.org/eemr16/files/medium-term-energy- efficiency-2016_WEB.PDF
IHS Markit, 2016, China’s power sector overcapac-ity to last through 2020 and beyond, news.ihsmarkit.com/press-release/china-power/chinas-power- sector-overcapacity-last-through-2020-and-beyond-ihs-markit-s
KPMG, 2016, The 13th Five-Year Plan – China’s trans-formation and integration with the world economy, assets.kpmg.com/content/dam/kpmg/cn/pdf/en/ 2016/10/13fyp-opportunities-analysis-for-chinese- and-foreign-businesses.pdf
Liu, J. Zhang, J., Tian F., Mi, Z., 2017, Analysis on the accommodation of renewable energy in northeast China, Earth Environmental Sciences, iopscience.iop.org/article/10.1088/1742-6596/52/1/012008/meta
National Development and Reform Commission, 2010, 12th Five-Year-Plan for Energy of the People’s Republic of China, Beijing, National Development and Reform Commission.
National Development and Reform Commission, 2016a, 13th Five-Year Plan for Energy of the People’s Republic of China, Beijing, National Development and Reform Commission. English translation available via chinaenergyportal.org/en/13th-fyp- development-plan-energy/
National Development and Reform Commission, 2016b, Notice on the publication of the 13th Five Year Plan for the development of renewable energy by the National Development and Reform Commission, zfxxgk.ndrc.gov.cn/Attachment/%e5%8f%af%e5%86%8d%e7%94%9f%e8%83%bd%e6%ba%90%e5%8f%91%e5%b1%95%e2%80%9c%e5%8d%81%e4%b8%89%e4%ba%94%e2%80%9d%e8%a7%84%e5%88%92.pdf English translation available via chinaenergyportal.org/en/13th-fyp-development-plan-renewable- energy/
National Development and Reform Commission, 2016c, Notice on adjustments to feed-in tariffs for onshore wind and PV power, PV: zfxxgk.ndrc.gov.cn/Attachment/1%e3%80%81%e5%85%a8%e5%9b%b d%e5%85%89%e4%bc%8f%e5%8f%91%e7%94%b5%e6%a0%87%e6%9d%86%e4%b8%8a%e7%bd%91%e 7%94%b5%e4%bb%b7%e8%a1%a8(1).pdfWind: zfxxgk.ndrc.gov.cn/Attachment/2%e3%80 %81%e5%85%a8%e5%9b%bd%e9%99%86%e4%b8%8a%e9%a3%8e%e5%8a%9b%e5%8f%91%e7%94%b5%e6%a0%87%e6%9d%86%e4%b8%8a%e7%bd%91%e7 %94%b5%e4%bb%b7%e8%a1%a8(1).pdfEnglish translation available via chinaenergyportal.org/en/notice-on-adjustments-to-feed-in-tariffs-for-onshore-wind-and-pv-power/
National Energy Administration, 2014, 2013 wind power installations and production by province, www.nea.gov.cn/2014-03/06/c_133166473.htm English translation available via chinaenergyportal.org/en/2013-wind-power-installations- production-province/
National Energy Administration, 2015, 2014 wind power installations and production by province, www.nea.gov.cn/2015-02/12/c_133989991.htm English translation available via chinaenergyportal.org/en/2014-wind-power-statistics-by-province/
National Energy Administration, 2016a, 2015 wind power installations and production by province, www.nea.gov.cn/2016-02/04/c_135073627.htm English translation available via chinaenergyportal.org/en/2015-wind-installations-and- production-by-province/
National Energy Administration, 2016b, 2016 Q1 PV installations utility and distributed by province, www.nea.gov.cn/2016-04/22/c_135303838.htm English translation available via www.chinaenergy-portal.org/en/2016-q1-pv-installations-utility-and- distributed-by-province/

ANALYSIS | Energy Transition in the Power Sector in China: State of Affairs in 2016
23
National Energy Administration, 2017a, 2016 wind power installations and production by province, www.nea.gov.cn/2017-01/26/c_136014615.htmEnglish translation available via chinaenergyportal.org/en/2016-wind-power-installations- production-province/
National Energy Administration, 2017b, Circular on 2017 wind power investment monitoring and early warning results, zfxxgk.nea.gov.cn/auto87/201702/t20170222_2604.htm English translation available via www.chinaenergy-portal.org/en/2017-wind-power- investment-monitoring-early-warning-results/
Solargis, 2017, upload.wikimedia.org/wikipedia/commons/9/9d/SolarGIS-Solar-map-World-map-en.png
State Grid Corporation of China, 2017, Extension Project of 1000 kV Southeast Shanxi-Nanyang-Jingmen UHV AC Demonstration Project put into Use, www.sgcc.com.cn/ywlm/projects/12/267755.shtml
Wind Power Monthly, 2013, Analysis – Chinese wind curtailments double in 2012, www.windpowermonthly.com/article/1171987/anal-ysis---chinese-wind-curtailments-double-2012

24
IN ENGLISH
The Cost of Renewable Energy A critical assessment of the Impact Assessments underlying the Clean Energy for All Europeans-Package
Future Cost of Onshore Wind Recent auction results, long-term outlook and implications for upcoming German auctions
The Energiewende in a nutshell 10 Q & A on the German energy transition
Energy Transition in the Power Sector in Europe: State of Affairs in 2016 Review on the Developments in 2016 and Outlook on 2017
Assessing the Winter Package in Light of the Energy Union Objectives
FAQ EEG – Energiewende: What do the new laws mean? Ten questions and answers about EEG 2017, the Electricity Market Act, and the Digitisation Act
Reducing the cost of financing renewables in Europe A proposal for an EU Renewable Energy Cost Reduction Facility (“RES-CRF”)
Refining Short-Term Electricity Markets to Enhance Flexibility Stocktaking as well as Options for Reform in the Pentalateral Energy Forum Region
Energy Transition in the Power Sector in Europe: State of Affairs in 2016 Review on the Developments in 2016 and Outlook on 2017
The Power Market Pentagon A Pragmatic Power Market Design for Europe’s Energy Transition
Energy Transition in the Power Sector in Europe: State of Affairs in 2015 Review of the Developments and Outlook for 2016
Projected EEG Costs up to 2035 Impacts of Expanding Renewable Energy According to the Long-term Targets of the Energiewende
Eleven Principles for a Consensus on Coal Concept for a stepwise decarbonisation of the German power sector (Short Version)
The Integration Costs of Wind and Solar Power An Overview of the Debate of the Effects of Adding Wind and Solar Photovoltaics into Power Systems
12 Insights on Germany’s Energiewende A Discussion Paper Exploring Key Challenges for the Power Sector
Publications of Agora Energiewende

25
IN GERMANY
Die deutsche Braunkohlenwirtschaft Historische Entwicklungen, Ressourcen, Technik, wirtschaftliche Strukturen und Umweltauswirkungen
Charta für eine Energiewende-Industriepolitik Ein Diskussionsvorschlag von Agora Energiewende und Roland Berger
Neue Preismodelle für Energie Grundlagen einer Reform der Entgelte, Steuern, Abgaben und Umlagen auf Strom und fossile Energieträger
Smart-Market-Design in deutschen Verteilnetzen Entwicklung und Bewertung von Smart Markets und Ableitung einer Regulatory Roadmap
Energiewende und Dezentralität Zu den Grundlagen einer politisierten Debatte
Wärmewende 2030 Schlüsseltechnologien zur Erreichung der mittel und langfristigen Klimaschutzziele im Gebäudesektor
Publications of Agora Energiewende
All publications are available on our website: www.agora-energiewende.de

116/06-A-2017/EN
About Agora Energiewende Agora Energiewende develops evidence-based and politically viable strategies for ensuring the success of the clean energy transition in Germany, Europe and the rest of the world. As a think tank and policy laboratory we aim to share knowledge with stakeholders in the worlds of politics, business and academia while enabling a productive exchange of ideas. Our scientifically rigorous research highlights practical policy solutions while eschewing an ideological agenda. As a non-profit foundation primarily financed through philanthropic donations, we are not beholden to narrow corporate or political interests, but rather to our commitment to confronting climate change.
About China National Renewable Energy Centre The China National Renewable Energy Centre is the national institution for assisting China’s energy authorities in renewable energy policy research, and industrial management and coordination. As a think tank and knowledge centre, it develops research tools and methodology, provides well researched input for national policies, supports the Chinese RE industry through capacity building and provides a platform for collaboration among industry, education and research. Being a non-profit institute, the China National Renewable Energy Centre aims to push the development of the Chinese RE industry sustainably.
Agora Energiewende is a joint initiative of the Mercator Foundation and the European Climate Foundation. The cooperation of Agora Energiewende and the China National Renewable Energy Centre in China is kindly supported by the Deutsche Gesellschaft für Internationale Zusammenarbeit.
Agora Energiewende
Anna-Louisa-Karsch-Straße 2 | 10178 Berlin
P +49 (0)30 700 14 35-000
F +49 (0)30 700 14 35-129
www.agora-energiewende.de
China National Renewable Energy Centre
Room B2204-2209
Guohong Mansion
Mu xidi Beili, Jia No. 11
Xicheng District | Beijing 100038 | China
www.cnrec.org.cn