Embed Size (px)
Citation preview
Air Force Institute of TechnologyAFIT Scholar
Theses and Dissertations Student Graduate Works
3-26-2015
Energy Harvesting & Recapture from HumanSubjects: Dual-Stage MEMS Cantilever EnergyHarvesterNicholas P. Sullivan
Follow this and additional works at: https://scholar.afit.edu/etd
This Thesis is brought to you for free and open access by the Student Graduate Works at AFIT Scholar. It has been accepted for inclusion in Theses andDissertations by an authorized administrator of AFIT Scholar. For more information, please contact [email protected].
Recommended CitationSullivan, Nicholas P., "Energy Harvesting & Recapture from Human Subjects: Dual-Stage MEMS Cantilever Energy Harvester"(2015). Theses and Dissertations. 61.https://scholar.afit.edu/etd/61
ENERGY HARVESTING & RECAPTURE FROM HUMAN SUBJECTS: DUAL-STAGE MEMS CANTILEVER ENERGY HARVESTER
THESIS
Nicholas P. Sullivan, Second Lieutenant, USAF
AFIT-ENG-MS-15-M-068
DEPARTMENT OF THE AIR FORCE AIR UNIVERSITY
AIR FORCE INSTITUTE OF TECHNOLOGY
Wright-Patterson Air Force Base, Ohio
DISTRIBUTION STATEMENT A. APPROVED FOR PUBLIC RELEASE; DISTRIBUTION UNLIMITED.

The views expressed in this thesis are those of the author and do not reflect the official policy or position of the United States Air Force, Department of Defense, or the United States Government. This material is declared a work of the U.S. Government and is not subject to copyright protection in the United States.
AFIT-ENG-MS-15-M-068
ENERGY HARVESTING & RECAPTURE FROM HUMAN SUBJECTS: DUAL-STAGE MEMS CANTILEVER ENERGY HARVESTER
THESIS
Presented to the Faculty
Department of Electrical and Computer Engineering
Graduate School of Engineering and Management
Air Force Institute of Technology
Air University
Air Education and Training Command
In Partial Fulfillment of the Requirements for the
Degree of Master of Science in Electrical Engineering
Nicholas P. Sullivan, BS
Second Lieutenant, USAF
March 2015
DISTRIBUTION STATEMENT A. APPROVED FOR PUBLIC RELEASE; DISTRIBUTION UNLIMITED.
AFIT-ENG-MS-15-M-068
ENERGY HARVESTING & RECAPTURE FROM HUMAN SUBJECTS: DUAL-STAGE MEMS CANTILEVER ENERGY HARVESTER
Nicholas P. Sullivan, BS
Second Lieutenant, USAF
Committee Membership:
Brett J. Borghetti, PhD Chair
Ronald A. Coutu Jr., PhD Member
Derrick Langley, Maj, USAF, PhD Member
iv
AFIT-ENG-MS-15-M-068
Abstract
Recent thermal energy harvesting research has advanced alternative non-Seebeck devices
and shifted attention towards applications with low temperature differentials near
ambient. This research effort takes a simulation-based approach to improve the
performance of a modified dual-stage MEMS cantilever energy harvester. The device
employs a bimetal and a piezoelectric transducer to harvest energy from a 10 °C
temperature differential. The proposed application for the device is as a wearable energy
harvester, capable of generating power from the human body using skin temperature
(average 33 °C) as the hot side and ambient air (23 °C) as the cold side. A bimetal
thickness scaling study is conducted, in which the 1.5 μm bimetal thickness yields the
maximum electrical power output of 36.82 nW per device. This translates to a power
density of 5.68 mW/cm2, which surpasses the performance of many Seebeck and
non-Seebeck designs from the literature.

v
Acknowledgments
I would like to express my sincere appreciation to my faculty advisor and committee
members for their guidance and support throughout the course of this thesis effort. I
would also like to thank the 15M AFIT MEMS Group members and the Cyber ANiMaL
Group members for the insight and feedback they provided. Finally, I thank the
LOREnet support staff for their dedication in meeting the needs of the researchers.
Nicholas P. Sullivan
vi
Table of Contents
Page
Abstract .......................................................................................................................... iv
Acknowledgments ........................................................................................................... v
Table of Contents ........................................................................................................... vi
List of Figures .............................................................................................................. viii
List of Tables .................................................................................................................. x
I. Introduction................................................................................................................. 1
General Issue............................................................................................................ 1
Problem Statement ................................................................................................... 4
Research Objectives ................................................................................................. 5
Investigative Questions ............................................................................................ 6
Methodology ............................................................................................................ 6
Assumptions/Limitations .......................................................................................... 7
Implications ............................................................................................................. 8
Preview .................................................................................................................... 8
II. Literature Review ..................................................................................................... 10
Chapter Overview .................................................................................................. 10
Relevant Research .................................................................................................. 10
Kinetic Energy Harvesting ..................................................................................... 14
Seebeck Thermal Energy Harvesting ...................................................................... 21
Non-Seebeck Energy Harvesting ............................................................................ 27
Derivation .............................................................................................................. 34
Summary ................................................................................................................ 40
III. Methodology .......................................................................................................... 43
vii
Chapter Overview .................................................................................................. 43
Experiment Design ................................................................................................. 43
Summary ................................................................................................................ 55
IV. Analysis and Results .............................................................................................. 56
Chapter Overview .................................................................................................. 56
Larger Bimetal Thicknesses ................................................................................... 57
Smaller Bimetal Thicknesses .................................................................................. 65
Aggregate Results .................................................................................................. 71
Summary ................................................................................................................ 75
V. Conclusions and Recommendations ......................................................................... 76
Chapter Overview .................................................................................................. 76
Design Configuration ............................................................................................. 76
Control Variables ................................................................................................... 77
Significance of Research ........................................................................................ 80
Recommendations for Future Research .................................................................. 80
Summary ................................................................................................................ 82
Appendix....................................................................................................................... 83
Bibliography ................................................................................................................. 85
viii
List of Figures
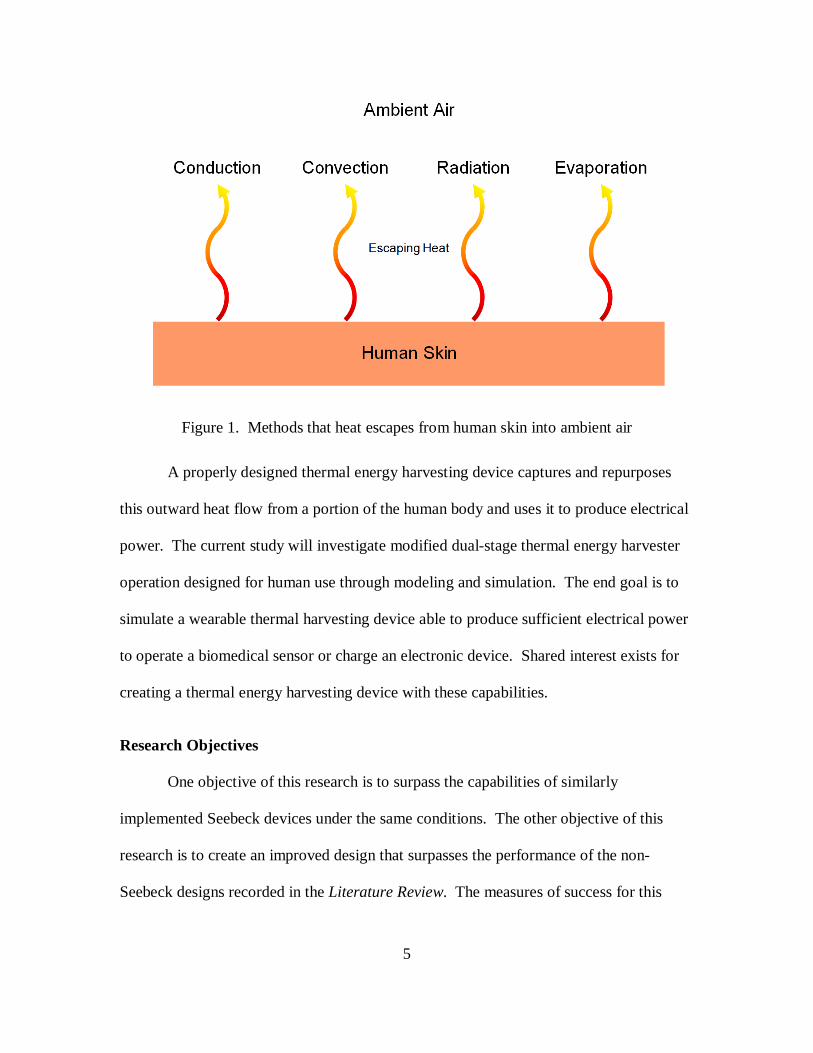
Figure 1. Methods that heat escapes from human skin into ambient air ........................... 5
Figure 2. System block diagram view of a passive autonomous sensor [6] .................... 11
Figure 3. System block diagram view of a self-powered autonomous sensor [6] ........... 12
Figure 4. Vibrational energy harvesting system diagram [1] ......................................... 15
Figure 5. (a) In-plane overlap-varying capacitive harvester, (b) In-plane gap-closing
capacitive harvester, (c) Out-of-plane gap-closing capacitive harvester [1] .............. 18
Figure 6. Through-plane thermoelectric array (top), In-plane thermoelectric array
(bottom) [1] ............................................................................................................ 23
Figure 7. Bimetal and electret based converter for thermal energy harvesting [22] ........ 29
Figure 8. Improved design of bimetal and electret based converter for thermal energy
harvesting [25] ........................................................................................................ 30
Figure 9. Stability of Ti-Au bimetal strips (L = 200 μm) [26] ....................................... 32
Figure 10. 2D layout of dual-stage MEMS cantilever energy harvester design .............. 45
Figure 11. Boundary definitions of the dual-stage MEMS cantilever energy harvester .. 46
Figure 12. Expanding active bimetal layer (deformation scale 500; PZT layer not shown)
............................................................................................................................... 57
Figure 13. 5 μm thick bimetal cantilever tip displacement............................................. 58
Figure 14. 5 μm thick bimetal cantilever voltage signal ................................................ 59
Figure 15. Stressed piezoelectric material (deformation scale 500; bimetal layer not
shown) .................................................................................................................... 61
Figure 16. 5 μm thick bimetal cantilever current density ............................................... 62
Figure 17. 5 μm thick bimetal cantilever instantaneous power ...................................... 63
ix
Figure 18. 1.5 μm thick bimetal cantilever tip displacement .......................................... 66
Figure 19. 1.5 μm thick bimetal cantilever voltage signal ............................................. 67
Figure 20. Stressed piezoelectric material (deformation scale 100; bimetal layer not
shown) .................................................................................................................... 68
Figure 21. 1.5 μm thick bimetal cantilever current density ............................................ 69
Figure 22. 1.5 μm thick bimetal cantilever instantaneous power ................................... 70
Figure 23. Peak voltage versus bimetal thickness across all simulations ........................ 72
Figure 24. Cantilever beam frequency versus bimetal thickness across all simulations .. 73
Figure 25. Average power versus bimetal thickness across all simulations .................... 74
Figure 26. 1 μm bimetal thickness simulation experiencing an inflection point (bimetal
not shown) .............................................................................................................. 78
x
List of Tables
Table 1. Parameter Evolution from Dimension Down-Scaling [4] ................................. 33
Table 2. Summarized list of performance metrics for the surveyed energy harvesters ... 42
Table 3. Variable Summary .......................................................................................... 53
Table 4. Test Matrix ..................................................................................................... 54

1
ENERGY HARVESTING & RECAPTURE FROM HUMAN SUBJECTS:
DUAL-STAGE MEMS CANTILEVER ENERGY HARVESTER
I. Introduction
General Issue
Energy harvesting is a process of capturing energy from a system’s surrounding
environment and converting it into usable electrical power. This field of research
continues to draw the attention of the academic community as its applications are
extensive and its topics are multi-disciplinary. The most common sources of energy that
are exploited for power generation in energy harvesting systems include temperature
differentials, kinetic energy, radio frequency energy, solar energy, and biochemically
produced energy. The current study focuses on only one unique application of thermal
energy harvesting from small temperature differentials. The details of this unique
application will be described explicitly in the Problem Statement subsection of this
chapter.
There are three critical phases in an energy harvesting system: energy collection,
energy conversion, and energy storage. The energy collection component of the system
transforms the energy present in the surrounding environment into some form of
electrical power. The output of the energy collection component feeds into the input of
an energy conversion component. The energy conversion component of the system
converts one kind of electrical power into a different—but more useful—kind of
electrical power. Often, the energy conversion component provides an appropriate
amplitude DC voltage at its output that is independent of the electrical power waveform
2
seen at its input. The output of the energy conversion component feeds into the input of
an energy storage component. The energy storage component of the system accumulates
the power collected by the energy harvesting system for use at a later time. It may be
common for energy harvesting systems to generate power intermittently over a period of
time; thus, the energy storage component can compensate for this aspect of device
behavior by delivering continuous power. These three components form an energy
harvesting system and enable a self-sufficient device. The current study focuses only on
thermal energy harvesting, which falls under the category of an energy collection
component. This information about the three critical phases provides a context for the
research conducted in this study and significance for the inputs and outputs of the device.
Thermal energy harvesting has existed for many years as a reliable power
generation method [1]. Most past research investigates applications of thermal energy
harvesting in systems that have large temperature differentials, such as industrial
processes, vehicle exhaust, and space travel. This research paradigm shifted its attention
to applications concerning room temperature ambient sources with much lower
temperature differentials in the past decade. Additionally, a high percentage of past
thermal energy harvesting research examines Seebeck devices. The Seebeck Effect
describes a material property that produces a voltage potential directly from an applied
temperature gradient. The generation of a voltage potential is possible in certain
materials because charge carriers in a conducting material tend to flow in the direction of
the temperature gradient. This property is quantified by the Seebeck coefficient, which
has units of volts per Kelvin [V/K]. Semiconductor materials have displayed the most
3
desirable qualities by exhibiting high Seebeck coefficients and have consequently been
the primary focus of research for thermal energy harvesting.
Electrical conductivity and thermal conductivity are two crucial material
properties that govern the device performance for thermoelectric systems [1]. Electrical
conductivity is defined as the degree to which a material can conduct an electrical
current. Thermal conductivity is defined as the rate at which heat passes through a
material. The electrical conductivity needs to be maximized and thermal conductivity
needs to be minimized for the best performance in Seebeck devices. Thermal
conductivity is divided into two components: the phonon transport component and the
electrical component of thermal conductivity. Due to the Wiedemann-Franz Law, the
electrical component of thermal conductivity is proportional to overall electrical
conductivity, which poses a problem for finding materials with a high thermoelectric
figure of merit (a characterization metric based on the Seebeck coefficient). Bismuth
Telluride (Bi2Te3) is the most commonly used thermoelectric semiconductor material and
adequately accommodates conventional microfabrication methods.
Non-Seebeck thermal energy harvesting is a different branch of research that does
not involve the use of semiconductor materials for direct voltage generation.
Non-Seebeck devices employ a myriad of other innovative methods to generate a voltage
from a thermal gradient. The current study examines one particular non-Seebeck
dual-stage thermal microelectromechanical system (MEMS) energy harvesting design
demonstrated by Puscasu et al. and presents a cantilever-based variation on the design
[2, 3, 4, 5]. This design, by Puscasu et al., employs a bimetal that works in conjunction
with a piezoelectric membrane. The bimetal operates by first converting thermal energy
4
to mechanical energy. The piezoelectric membrane captures the mechanical energy of
the bimetal and then converts it to electrical energy. By this method, the dual-stage
MEMS energy harvesting design implements a two-stage energy conversion process to
generate power. A detailed description of dual-stage thermal energy harvesting device
operation is included in the Literature Review chapter of this document.
Problem Statement
The problem that this thesis research addresses is whether Puscasu’s design for
thermal energy harvesting can be improved and successfully applied to human subjects.
The human body can be regarded as a source of heat and therefore a power source for
thermal energy harvesting devices. Human-powered energy harvesting devices grant the
convenience of a mobile platform that can supply electrical power. Being warm-blooded
mammals, human body heat is generated from within by normal cell function and escapes
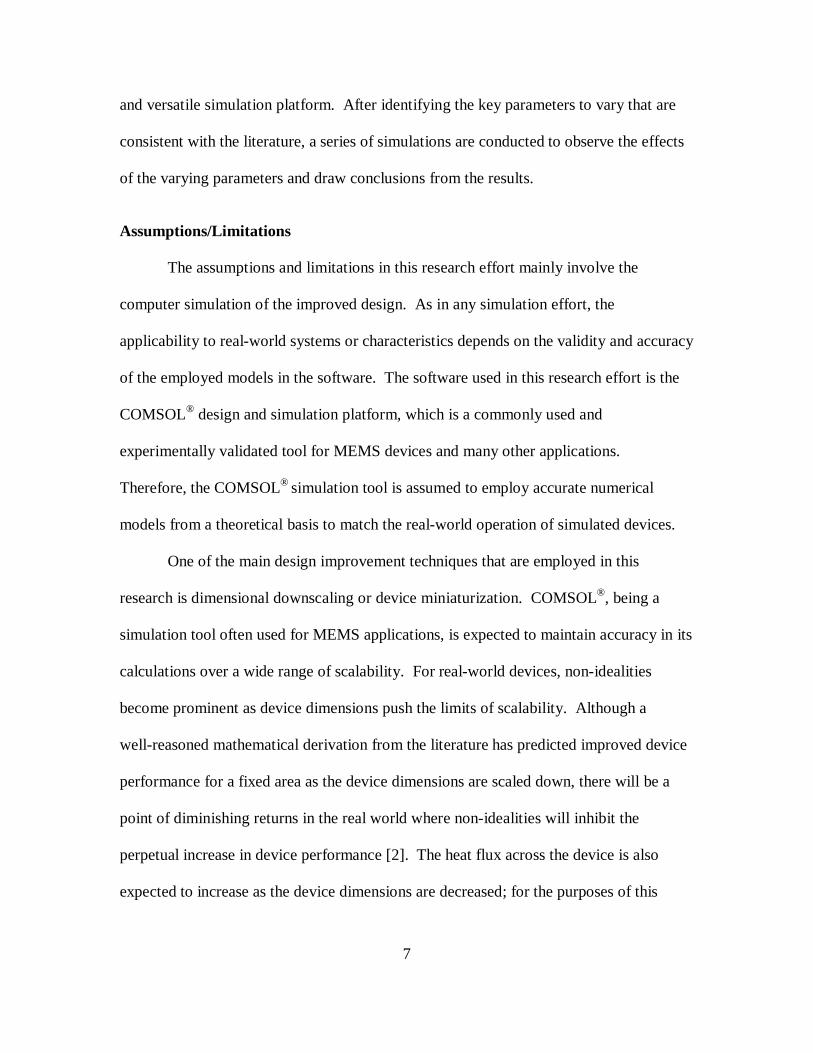
through the epidermis by way of conduction, convection, radiation, and evaporation.
Figure 1 shows the methods by which thermal energy escapes from human skin into
ambient air.
5
Figure 1. Methods that heat escapes from human skin into ambient air
A properly designed thermal energy harvesting device captures and repurposes
this outward heat flow from a portion of the human body and uses it to produce electrical
power. The current study will investigate modified dual-stage thermal energy harvester
operation designed for human use through modeling and simulation. The end goal is to
simulate a wearable thermal harvesting device able to produce sufficient electrical power
to operate a biomedical sensor or charge an electronic device. Shared interest exists for
creating a thermal energy harvesting device with these capabilities.
Research Objectives
One objective of this research is to surpass the capabilities of similarly
implemented Seebeck devices under the same conditions. The other objective of this
research is to create an improved design that surpasses the performance of the non-
Seebeck designs recorded in the Literature Review. The measures of success for this
6
research seek to show how Puscasu’s scaling assumptions hold for the modified thermal
energy harvesting design; the measures of success for this research also seek to
outperform Seebeck power generation under the conditions of the human environment.
The conditions of the human environment for this research are defined by a thermal
gradient that uses 33 °C as the hot side temperature and 23 °C as the cold side
temperature. The standard for power density among Seebeck devices varies drastically,
but for this research, the threshold for Seebeck power densities is to be considered
~1 mW/cm2. The main foci for this research include cantilever displacement, oscillation
frequency, peak voltage, power density, and overall device performance. Dimensional
downscaling/device miniaturization is the primary means that this research uses to
improve device performance. Appropriate thermal management, a useful temperature
operating range, and reliability are crucial aspects of favorable device performance.
Device size, weight, and flexibility are important factors governing the overall mobility
of the design.
Investigative Questions
Can a dual-stage thermal energy harvesting design be improved to surpass the
performance of current Seebeck and non-Seebeck thermal energy harvesting technology?
Can a dual-stage thermal energy harvesting design be adapted to operate in temperature
gradients that humans normally exhibit?
Methodology
This research effort uses a simulation-based approach to achieve design
improvement; the software employed is COMSOL® Multiphysics, an industry-recognized
7
and versatile simulation platform. After identifying the key parameters to vary that are
consistent with the literature, a series of simulations are conducted to observe the effects
of the varying parameters and draw conclusions from the results.
Assumptions/Limitations
The assumptions and limitations in this research effort mainly involve the
computer simulation of the improved design. As in any simulation effort, the
applicability to real-world systems or characteristics depends on the validity and accuracy
of the employed models in the software. The software used in this research effort is the
COMSOL® design and simulation platform, which is a commonly used and
experimentally validated tool for MEMS devices and many other applications.
Therefore, the COMSOL® simulation tool is assumed to employ accurate numerical
models from a theoretical basis to match the real-world operation of simulated devices.
One of the main design improvement techniques that are employed in this
research is dimensional downscaling or device miniaturization. COMSOL®, being a
simulation tool often used for MEMS applications, is expected to maintain accuracy in its
calculations over a wide range of scalability. For real-world devices, non-idealities
become prominent as device dimensions push the limits of scalability. Although a
well-reasoned mathematical derivation from the literature has predicted improved device
performance for a fixed area as the device dimensions are scaled down, there will be a
point of diminishing returns in the real world where non-idealities will inhibit the
perpetual increase in device performance [2]. The heat flux across the device is also
expected to increase as the device dimensions are decreased; for the purposes of this
8
experiment, it will be assumed that the original applied temperature gradient will be
maintained across the device regardless of scaling.
Implications
The motivation for human-based energy harvesting research is to provide mobile
stand-alone systems that will function as a source of power where a connection to the
power grid is infeasible. One main goal is to reduce dependence on batteries. The
downscaling of battery-dependent system components causes the size and weight of the
system to be chiefly determined by the battery itself [1]. Opportunity exists for military
application as this technology may replace the need for fielded military to carry unwieldy
batteries to power their equipment. This body of research also seeks to contribute
towards the movement for “greener” energy and reduced reliance on conventional power
production. The expenditure of heat energy already takes place in both natural human
function and in the surrounding environment; systems that exploit this un-used thermal
energy provide a unique mobile charging platform for self-sufficient physiological
monitoring or electronics charging through the means of a wearable energy harvesting
device. This field of research has caught the attention of many who seek to advance
environmentally-friendly energy production technology and battery-less systems.
Preview
The succeeding portions of this document adhere to the following structure order:
Chapter 2 will present the literature and theory review from past relevant contributions;
Chapter 3 will present the methodology of the simulation; Chapter 4 will present the data

9
and analyze the findings; Chapter 5 will present the results of this thesis research, draw
conclusions based upon the data, and suggest future work.
10
II. Literature Review
Chapter Overview
The rationale for a new investigation on dual-stage thermal MEMS energy
harvesters stems from the past work conducted by researchers within the thermal energy
harvesting field. The subfield of non-Seebeck thermal energy harvesting methods is
relatively new in concept and lacks a comprehensive collection of previously conducted
research. This chapter starts with a broad description of energy harvesting systems and
gradually narrows the scope of the literature discussed to non-Seebeck thermal energy
harvesting devices. There is one primary team of researchers that is studying dual-stage
thermal MEMS energy converters, and much of the mentioned relevant work toward the
end of this chapter is comprised of its findings. This chapter exhibits portions of previous
relevant research and explains the resultant implications that drive the direction of this
thesis effort. Finally, the chapter closes with a summary of the implications extracted
from the literature.
Relevant Research
The relevant research section begins by discussing a broad range of energy
collection and ends by focusing on the relevant research that is most comparable to the
current study. A topographical analysis of energy harvesting systems gains relevance if a
discussion of terminology is first articulated to justify the significance of topics discussed
later in this document.
A discussion of passive and self-powered autonomous sensor systems follows.
An autonomous sensor is defined as a device that autonomously performs measurement
11
functions within its environment [6]. Passive autonomous sensors imply passive circuit
elements and passive operation; self-powered autonomous sensors imply the use of an
energy harvesting module. Autonomous sensors, though not the main focus of this
document, serve as a context medium for energy harvesting because they are common
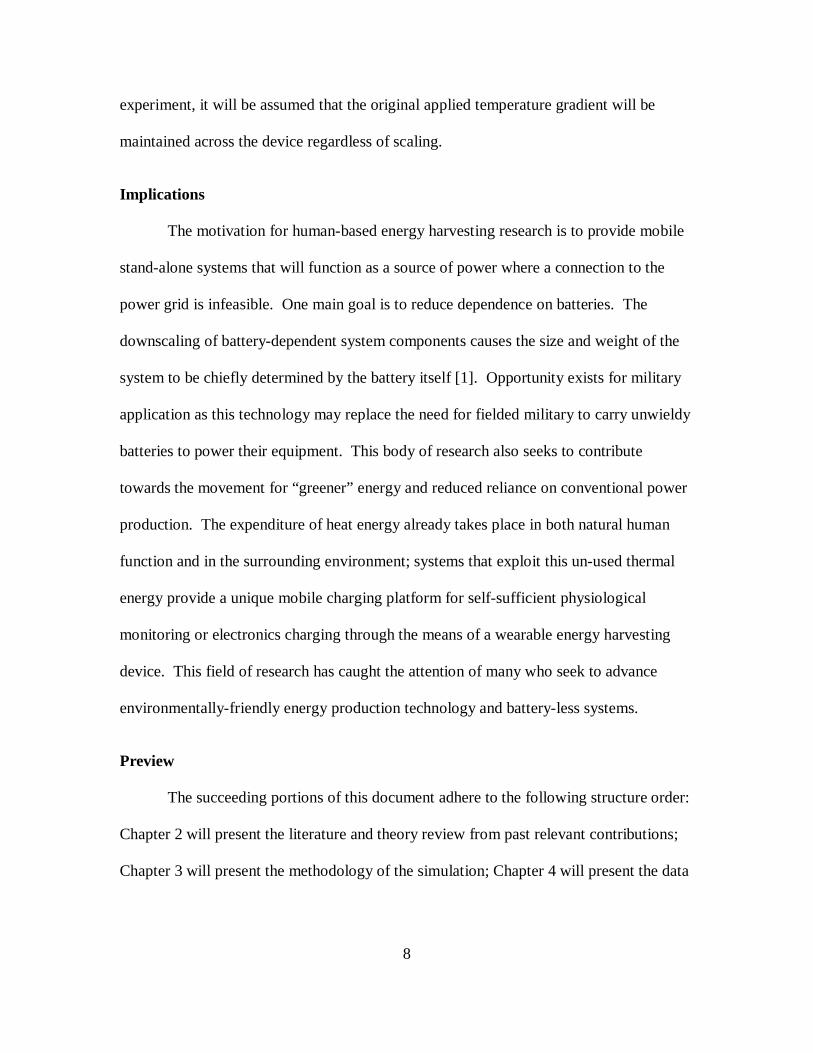
miniaturized systems that record data. Figure 2 shows a block diagram of a passive
sensor system.
Figure 2. System block diagram view of a passive autonomous sensor [6]
The passive sensor system consists of a sensing element and a readout unit that
are brought into proximity in order to form a communication channel. The
communication channel bridges the barrier between the remote and accessible regions
and the consequent data flow is mono-directional. The communication channel is formed
only when the readout unit interrogates the sensing element because the sensing element
does not provide power for itself nor does it have any type of power supply.
Self-powered autonomous systems observe a much different mode of operation
than passive autonomous sensors in the remote area. Figure 3 shows a block diagram of
a self-powered sensor system.
12
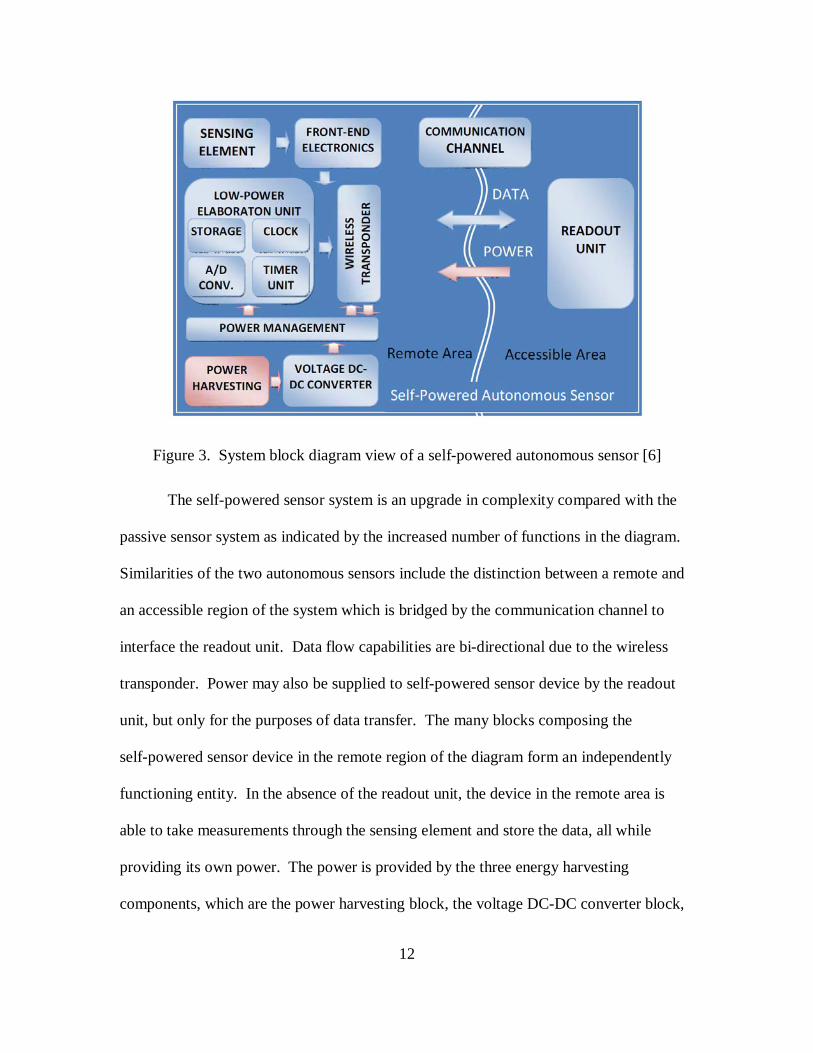
Figure 3. System block diagram view of a self-powered autonomous sensor [6]
The self-powered sensor system is an upgrade in complexity compared with the
passive sensor system as indicated by the increased number of functions in the diagram.
Similarities of the two autonomous sensors include the distinction between a remote and
an accessible region of the system which is bridged by the communication channel to
interface the readout unit. Data flow capabilities are bi-directional due to the wireless
transponder. Power may also be supplied to self-powered sensor device by the readout
unit, but only for the purposes of data transfer. The many blocks composing the
self-powered sensor device in the remote region of the diagram form an independently
functioning entity. In the absence of the readout unit, the device in the remote area is
able to take measurements through the sensing element and store the data, all while
providing its own power. The power is provided by the three energy harvesting
components, which are the power harvesting block, the voltage DC-DC converter block,
13
and the power management block. These three blocks correspond to more generalized
terms that describe the three phases of an energy harvesting system: energy collection,
energy conversion, and energy storage, respectively. Energy collection components
transform the energy present in the surrounding environment into electrical power. There
are different sources of power that energy collectors can draw from including: thermal,
vibrational, radiofrequency, solar, and chemical energy. These sources can either be
drawn directly from the human body or harvested from the surrounding ambient
environment through the means of a wearable device. The input of an energy conversion
component is equivalent to the output of the electrical power from the energy collection
component. Energy conversion components provide a usable DC output independent of
the form of the electrical power seen at its input. The input of an energy storage
component is equivalent to the output of the DC power from the energy conversion
component. Energy storage components hold the power generated by the energy
harvesting system for use at a later time. It may be common for energy harvesting
systems to only intermittently generate power over a period of time; thus the energy
storage component can compensate for this aspect of device behavior by delivering
continuous power. These three components form an energy harvesting system and enable
a self-powered autonomous sensor to be a self-sufficient entity. Discussions of common
autonomous sensors types and the three phases of energy harvesting have been provided
to lay a foundation for a more focused discussion of piezoelectric and thermal energy
harvesting systems, which function as energy collection components.
The energy collection aspect of energy harvesting has seen the most emphasis in
research efforts from the birth of this field of study. Many techniques have been
14
developed for exploiting different forms of energy in either ambient or controlled
environments. It should be noted that device miniaturization is an important recurring
theme for this particular application of energy harvesting. Although component
miniaturization is relevant for all three phases of energy harvesting, unique principles that
apply primarily to energy collection devices govern the scaling laws for centimeter-sized
devices down to micron-sized devices. The significance of natural forces changes at the
small-scale when compared to the macro-scale. Natural forces refer to surface tension,
electrostatic, electromagnetic, and gravitational forces. When devices are scaled down
and surface area to volume ratios increase, surface tension forces dominate inertial forces
[7]. These are important considerations for miniaturized energy collection devices that
make use of these forces to generate electrical power.
Kinetic Energy Harvesting
Vibrational or kinetic energy harvesting contains many subcategories composed
of different harvesting methods. It is less suited to harvesting applications relating to
humans due to its high resonant frequencies, but vibrational harvesting systems can be
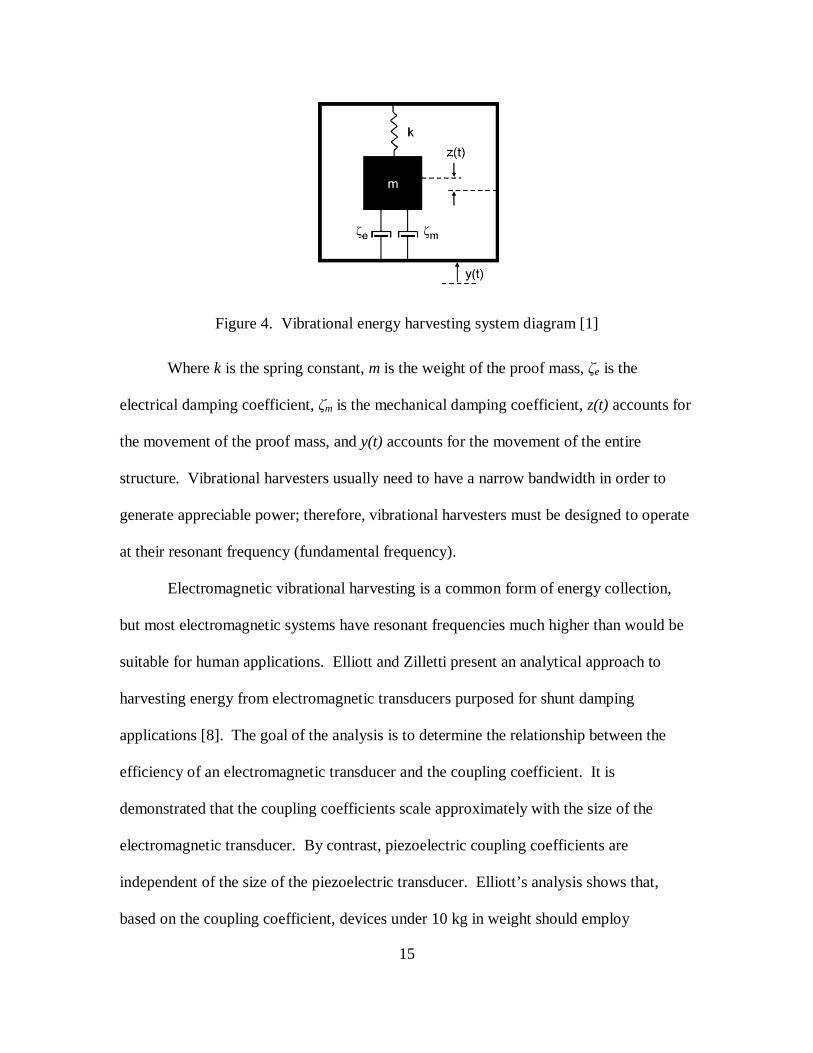
optimized for lower frequencies at the expense of other trade-offs. Figure 4 shows a
generic vibrational system that communicates the essential elements of vibrational energy
harvesting operation.
15
Figure 4. Vibrational energy harvesting system diagram [1]
Where k is the spring constant, m is the weight of the proof mass, ζe is the
electrical damping coefficient, ζm is the mechanical damping coefficient, z(t) accounts for
the movement of the proof mass, and y(t) accounts for the movement of the entire
structure. Vibrational harvesters usually need to have a narrow bandwidth in order to
generate appreciable power; therefore, vibrational harvesters must be designed to operate
at their resonant frequency (fundamental frequency).
Electromagnetic vibrational harvesting is a common form of energy collection,
but most electromagnetic systems have resonant frequencies much higher than would be
suitable for human applications. Elliott and Zilletti present an analytical approach to
harvesting energy from electromagnetic transducers purposed for shunt damping
applications [8]. The goal of the analysis is to determine the relationship between the
efficiency of an electromagnetic transducer and the coupling coefficient. It is
demonstrated that the coupling coefficients scale approximately with the size of the
electromagnetic transducer. By contrast, piezoelectric coupling coefficients are
independent of the size of the piezoelectric transducer. Elliott’s analysis shows that,
based on the coupling coefficient, devices under 10 kg in weight should employ
16
piezoelectric transducers. Devices over 10 kg in weight should employ electromagnetic
transducers. Therefore, the acute drawback in human applications is that miniaturized
electromagnetic devices suffer great efficiency losses in comparison to equivalent
piezoelectric systems. Efficiency losses in addition to increases in the resonant frequency
as the size of the device is scaled down make electromagnetic vibrational energy
harvesting a poor candidate for human applications.
Very low frequency energy harvesting operation is possible in a piezoelectric ring
system. Xie et al. designs and simulates a macro-scale ring piezoelectric harvester with a
diameter of about one meter [9]. Xie’s research develops the harvester along with a
mathematical model to predict the output of the device. The device is able to produce
12.7 W at a frequency of 1 Hz and is able to produce 381.7 W at a frequency of 30 Hz.
Though this system is very large compared to the other devices surveyed in this
document, it could be miniaturized without experiencing heavy efficiency losses because
it is piezoelectric-based. Operation frequencies would increase with decreasing size, but
it remains to be seen whether a small-scale piezoelectric ring harvester would be an
effective device.
Capacitive or electrostatic harvesting is the most favorable vibrational energy
harvesting method for human applications due to its ability to be fabricated with MEMS
technology; but there are still inherent disadvantages to capacitive systems such as the
need for a prior DC bias. Lin et al. creates and characterizes a dual cavity MEMS
capacitor vibrational system through simulation and fabrication [10]. Lin executes finite
element modeling (FEM) to characterize the motion and output of the MEMS capacitor.
Simulations determine an optimally resonant frequency of 487 Hz; experimental data
17
determines the device resonant frequency to be 500 Hz. The maximum power generation
of the fabricated capacitor array is able to reach 2.5 μW under conditions of high voltage
bias (15 V) and extreme excitation accelerations (>5 Gs). Lin’s design needs to operate
at a lower frequency, with lower voltage bias, and much lower excitation accelerations if
any application to human-based energy harvesting is to be realized. Lin also identifies
squeeze film air damping as a future research effort that needs extensive characterization
and numerical analysis. Squeeze film air damping is a surface tension effect that
becomes substantial as the size of micro-machined structures is decreased [11]. The
movement of mechanical parts encounters a counter-reactive force by compressing the
surrounding air between parallel surfaces and thus affecting the frequency response of the
system. These compression damping forces overshadow drag damping forces if the
created air film is less than a third of the transverse dimension of the surface.
Capacitive energy harvesting, similar to thermal energy harvesting, is realizable in
more than one orientation. The three orientations for capacitive harvesting have unique
working qualities. Figure 5 shows the different orientations for capacitive energy
harvesting that have been investigated previously.
18
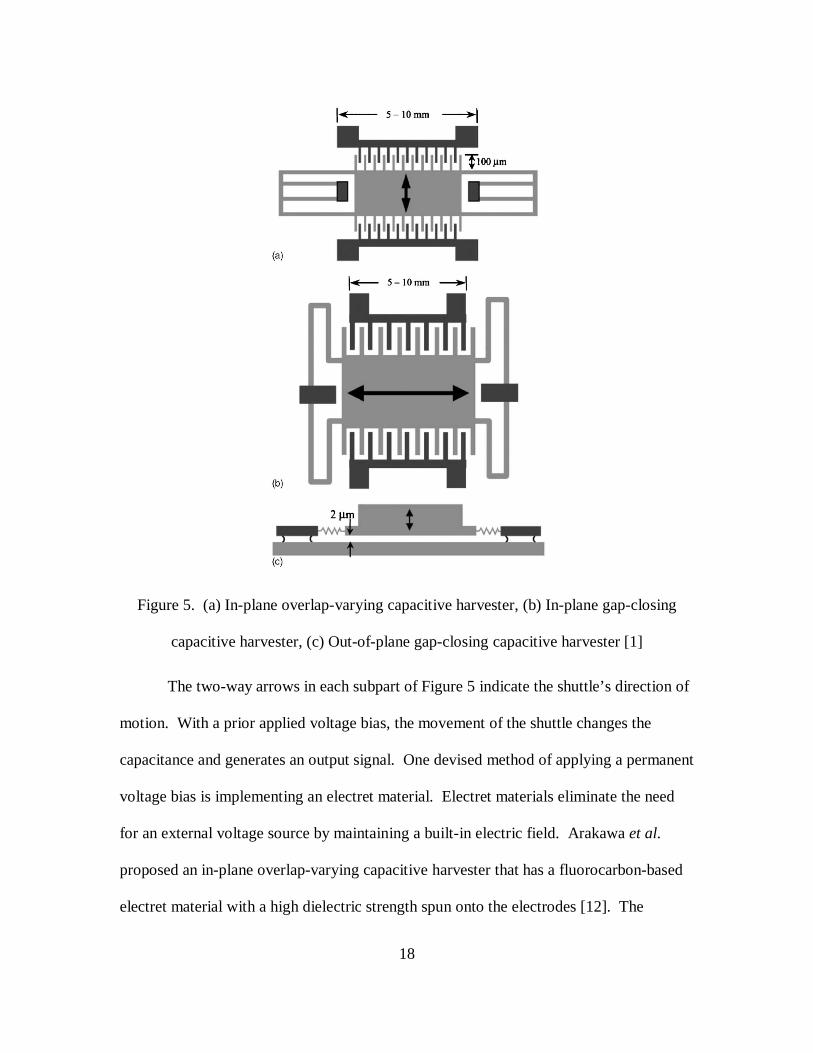
Figure 5. (a) In-plane overlap-varying capacitive harvester, (b) In-plane gap-closing
capacitive harvester, (c) Out-of-plane gap-closing capacitive harvester [1]
The two-way arrows in each subpart of Figure 5 indicate the shuttle’s direction of
motion. With a prior applied voltage bias, the movement of the shuttle changes the
capacitance and generates an output signal. One devised method of applying a permanent
voltage bias is implementing an electret material. Electret materials eliminate the need
for an external voltage source by maintaining a built-in electric field. Arakawa et al.
proposed an in-plane overlap-varying capacitive harvester that has a fluorocarbon-based
electret material with a high dielectric strength spun onto the electrodes [12]. The
19
fabrication of the capacitive device and the deposition of the electret material use
common fabrication techniques. The device size is 20 mm ⨯ 20 mm ⨯ 2 mm and has a
resonant frequency of 10 Hz. It produces 7.5 μW/cm3 at an acceleration of 3.9 m/s2. The
low resonant frequency and low excitation acceleration of Arakawa’s device make it a
viable candidate for application to humans. If this work could be reproduced in an
in-plane gap-closing orientation, then even lower excitation accelerations would produce
the same output power because similar capacitances are attainable with reduced
movement.
As previously mentioned, resonant frequency increases as the size of the device
decreases. Non-resonant vibrational energy harvesting systems are one way that the
negative effects of vibration energy harvesting device miniaturization can be avoided.
Shenck and Paradiso created an impact-coupled system by implanting pre-stressed metal
strips with PZT in the heels of shoes so that the act of walking would generate power
[13]. At a frequency of 0.9 Hz, an average power of 8.4 mW is produced. Within the
field of vibrational energy harvesting, impact-coupled, non-resonant devices may be the
best suited to human application. Typical human movements do not exceed more than a
few Hertz, yet the overall kinetic forces are much higher than other kinds of ambient
vibrations. Caliò et al. have studied motion-based piezoelectric energy harvesting
techniques and report the available power for a few human activities [14]. The available
power from walking is ~1 W; the available power from breathing is ~100 mW; the
available power from the upper limbs is ~10 mW; the available power from typing is
~1 mW.

20
A simulation effort in COMSOL® by Varadrajan and Bhanusri has attempted to
maximize the power output in a macro-scale unimorph piezoelectric cantilever beam
energy harvesting system [15]. The authors vary the design parameters of the unimorph
piezoelectric cantilever beam and test three different piezoelectric materials: PbZrTiO3
(PZT), PVDF, and PMN-PT. The beam length of Varadrajan and Bhanusri’s design is
6 cm; the beam width is 3 cm; the beam thickness is 0.1 cm. A large proof mass is
mounted on the tip of the cantilever beam to lower the fundamental resonant frequency,
to decrease damping, and to increase the output power. With the addition of the proof
mass, the fundamental resonant frequency is reduced to 153.22 Hz, which satisfies the
author’s target to fall within the frequency range of common environmental vibrations
between 60 Hz and 200 Hz according to their sources. Varadrajan and Bhanusri report
that varying the cantilever beam thickness has the greatest impact on the frequency of the
device in comparison to varying strictly the length or the width. They conclude that
frequency is directly proportional to the thickness of the beam from the results of their
simulations.
Boisseau et al. report their findings on an electret-based cantilever energy
harvester [16]. The authors conducted an optimization study on an electret-based
cantilever energy harvester and determined from both theory and simulation that the
maximum power they could achieve is 160 μW with a vibration amplitude of 10 μm at
50 Hz. The dimensions of the cantilever are 30 mm × 13 mm × 0.3 mm for the length,
width, and thickness, respectively. The experimental results for the power output are
much lower than anticipated due to parasitic capacitances. The load is reduced from
2.2 GΩ down to 300 MΩ to reduce the effect of parasitic capacitances. Boisseau obtains
21
an output power of 50 μW with a vibration amplitude of 10 μm at 50 Hz at low ambient
vibrations accelerations of 0.1 g. It is concluded that parasitic capacitances have a large
impact on the behavior of the electret-based cantilever energy harvester and greatly
depend on the load chosen.
A discussion of thermal energy harvesting devices follows. Both Seebeck and
non-Seebeck devices are discussed to convey the differences between these two
technologies. Human-powered devices are also included in this review to articulate the
challenges of operating thermal harvesting devices under constrained conditions.
Seebeck Thermal Energy Harvesting
It has been demonstrated that thermoelectric systems can be created using
common fabrication techniques that are compatible with other wafer-based technologies.
Bismuth Telluride (Bi2Te3), a common Seebeck thermoelectric material, is able to be
processed using conventional fabrication methods. Böttner et al. uses physical vapor
deposition and photolithography to pattern the p-type and n-type thermoelements on two
separate substrates [17, 18]. Through a sequence of sputtering and patterning steps,
Böttner builds 20 ⨯ 40 ⨯ 80 μm3 thermoelements and connects them in series with metal
interconnects. The separate substrates are merged using flip-chip bonding, which is a
popular procedure for thermoelectric devices due to the nature of alternating p-type and
n-type thermoelement matrices. The resulting device produces a power density of
60 μW/cm2 with a temperature differential of 5 K. The power density of this device is
limited by the poor length to cross-sectional area ratio of the thermoelements.
Thermoelement dimensions are factors that significantly impact the performance of
22
thermoelectric devices, which consequently produces a low power density in Böttner’s
research effort.
Device orientation is a novel geometrical effort that attempts to maximize the
length to cross-sectional area ratio. As mentioned in the description of Böttner’s work,
the thermoelement geometrical dimensions influence the power density output. Ideally,
the thermoelement dimensions can contribute positively to the power density if the length
is much greater than the cross-sectional area dimensions. Conventional fabrication
techniques are limited to depositing films not greater than a few hundred microns.
Therefore, one proposed bypass to this issue is changing the device orientation from a
through-plane orientation device to an in-plane orientation thermoelectric device. Many
researchers have explored the usage of the in-plane orientation as a means of obtaining
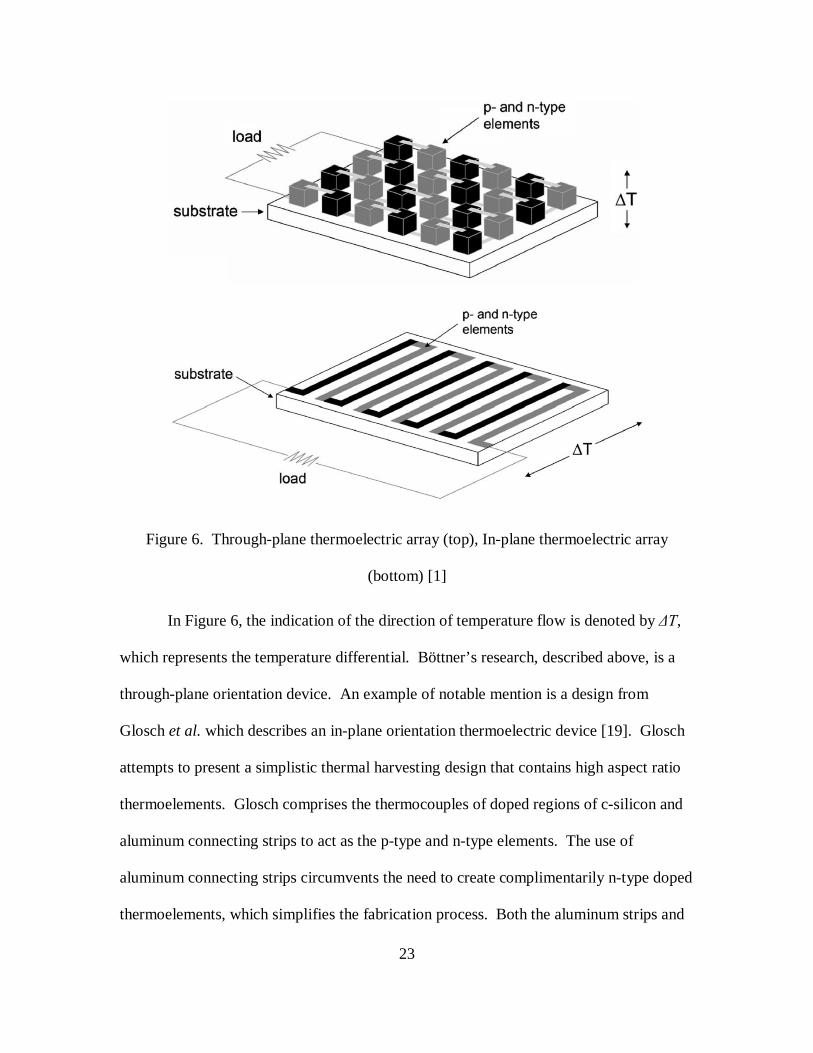
large aspect ratios in thermoelement geometry. Figure 6 shows two different orientations
of thermoelectric arrays.
23
Figure 6. Through-plane thermoelectric array (top), In-plane thermoelectric array
(bottom) [1]
In Figure 6, the indication of the direction of temperature flow is denoted by ΔT,
which represents the temperature differential. Böttner’s research, described above, is a
through-plane orientation device. An example of notable mention is a design from
Glosch et al. which describes an in-plane orientation thermoelectric device [19]. Glosch
attempts to present a simplistic thermal harvesting design that contains high aspect ratio
thermoelements. Glosch comprises the thermocouples of doped regions of c-silicon and
aluminum connecting strips to act as the p-type and n-type elements. The use of
aluminum connecting strips circumvents the need to create complimentarily n-type doped
thermoelements, which simplifies the fabrication process. Both the aluminum strips and
24
the substrate itself are intentionally thin by design to prevent thermal shorting. At a
temperature difference of 4 K, the device produces 0.2 μW with thermoelement
dimensions of 500 ⨯ 7 ⨯ 1.2 μm3. Requirements differ for through-plane orientation
versus in-plane orientation devices. The former must have a high thermal conductivity
substrate; the latter must have a low thermal conductivity substrate or a removable
substrate. Glosch’s design suffers from parasitic heat flow which greatly reduces the
efficiency and overall performance of the thermoelectric device. Fabrication simplicity
and a large thermoelement aspect ratio are the strongest points of Glosch’s design.
Future revisions to this work need to address parasitic heat flow issues so that the large
thermoelement aspect ratio can be fully capitalized upon.
Thermoelectric materials research has yielded significant breakthroughs in figure
of merit values for thermoelectric systems. Thermoelectric materials research focuses on
restricting the transport of phonons in the device. Device performance improves when
the thermal conductivity is minimized; therefore, research targets phonon management,
which is a component of thermal conductivity. One way to restrict phonon transport is
through low-dimensional materials, such as quantum wells, quantum wires, quantum
dots, and superlattices [1]. One notable example of quantum confinement arises from
Venkatasubramanian et al. by incorporating a superlattice structure into a room
temperature thermoelectric device [20]. The p-type superlattice comprised of
Bi2Te3/Sb2Te3 achieves a ZT value of 2.4 and the n-type superlattice comprised of
Bi2Te3/Bi2Te2.83Se0.17 achieves a ZT value of 1.2. These reported figures of merit are
high when compared with other non-low-dimensional thermoelectric devices. The
fabricated device boasts a power density of 6.1 mW/cm2 at a temperature differential of
25
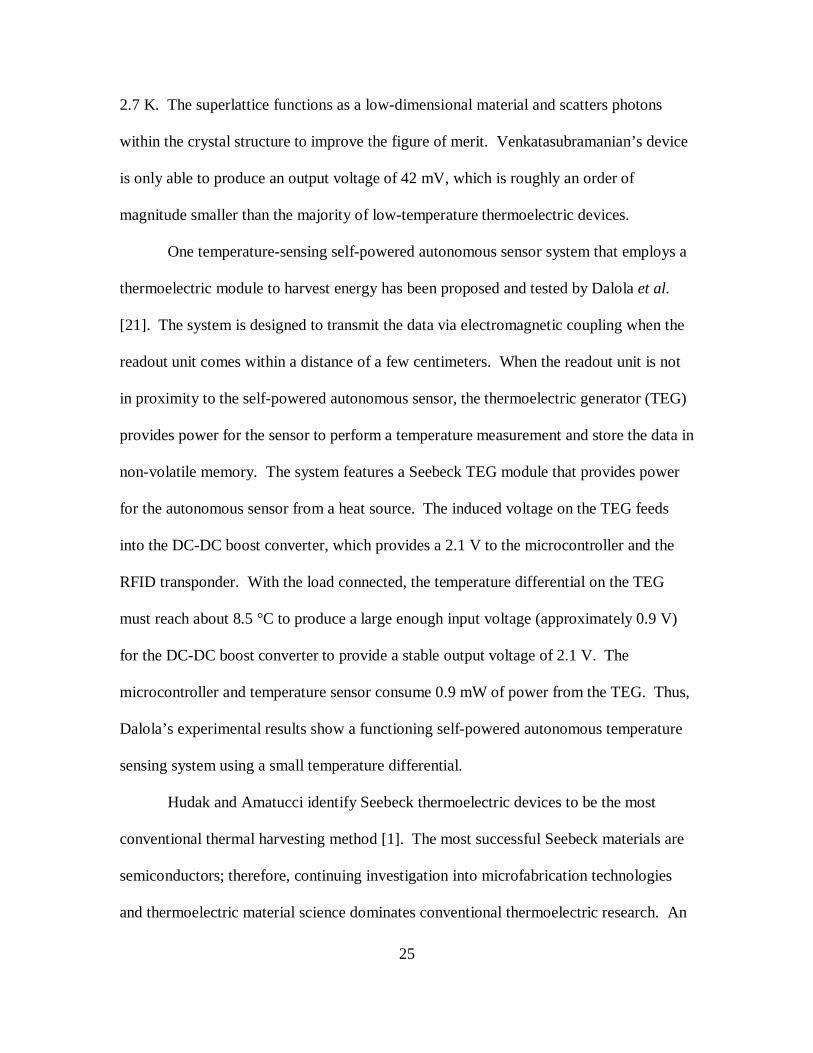
2.7 K. The superlattice functions as a low-dimensional material and scatters photons
within the crystal structure to improve the figure of merit. Venkatasubramanian’s device
is only able to produce an output voltage of 42 mV, which is roughly an order of
magnitude smaller than the majority of low-temperature thermoelectric devices.
One temperature-sensing self-powered autonomous sensor system that employs a
thermoelectric module to harvest energy has been proposed and tested by Dalola et al.
[21]. The system is designed to transmit the data via electromagnetic coupling when the
readout unit comes within a distance of a few centimeters. When the readout unit is not
in proximity to the self-powered autonomous sensor, the thermoelectric generator (TEG)
provides power for the sensor to perform a temperature measurement and store the data in
non-volatile memory. The system features a Seebeck TEG module that provides power
for the autonomous sensor from a heat source. The induced voltage on the TEG feeds
into the DC-DC boost converter, which provides a 2.1 V to the microcontroller and the
RFID transponder. With the load connected, the temperature differential on the TEG
must reach about 8.5 °C to produce a large enough input voltage (approximately 0.9 V)
for the DC-DC boost converter to provide a stable output voltage of 2.1 V. The
microcontroller and temperature sensor consume 0.9 mW of power from the TEG. Thus,
Dalola’s experimental results show a functioning self-powered autonomous temperature
sensing system using a small temperature differential.
Hudak and Amatucci identify Seebeck thermoelectric devices to be the most
conventional thermal harvesting method [1]. The most successful Seebeck materials are
semiconductors; therefore, continuing investigation into microfabrication technologies
and thermoelectric material science dominates conventional thermoelectric research. An

26
analysis of the governing power equations for Seebeck thermoelectric devices has
sparked acute observance to device aspect ratios and maximum achievable power density.
But despite the advances made in Seebeck Effect thermoelectric devices, there are
inherent problems and disadvantages associated with procuring effective Seebeck
materials, mainly related to the Wiedemann-Franz Law. Bismuth Telluride is an
expensive material [22]. At room temperature, no bulk material has outperformed Bi2Te3
alloys; researchers are forced to evoke quantum material properties to surpass the figure
of merit ZT ~ 1. Consequently, research concerning non-Seebeck thermal energy
harvesting is being conducted. Non-Seebeck devices can circumvent the intrinsic
problem of Seebeck devices, which is overcoming the strong link between semiconductor
electrical properties and semiconductor thermal properties (Wiedemann-Franz Law).
Alternatively, other research efforts for direct thermoelectric applications to the
human body are currently being investigated. Leonov experiments with the integration of
Seebeck thermoelectric devices into human clothing for ambient temperature thermal
energy harvesting applications [23]. Leonov’s device is implanted into shirts to exploit
the temperature differential between the human’s skin temperature (typical 33 °C) and the
ambient surrounding air (typical 23 °C). The implanted thermoelectric device has
dimensions of a 5 mm thickness and a 3 cm diameter. Depending on the activity of the
human subject (stationary or moving) and the ambient air temperature, the device
generates an output power between 1 mW and 4 mW. Power generation is accomplished
with a low heat flow rate, which does not cause discomfort to the human subject due to
excessive parasitic heat flow. Leonov admittedly states that a more ergonomic design
would improve the performance of his system. His system presents a competitive
27
alternative to battery use, but the cost of Seebeck thermoelectric systems is still an order
of magnitude higher than the equivalent capability in the form of batteries; future
research must close this gap in price and further miniaturize thermoelectric systems while
still increasing power density.
Non-Seebeck Energy Harvesting
Regarding non-Seebeck research, the most relevant research to the current study
is being conducted by a team of engineers from France. The authors mentioned in this
literature review who are associated with this team of engineers include Puscasu,
Monfray, Boisseau, and Arnaud.
Puscasu et al. initially propose an alternative MEMS-based heat energy
harvesting device [2]. Puscasu’s system employs a two-stage energy conversion: first
from thermal energy to mechanical energy, then from mechanical energy to electrical
energy. This two-stage conversion is realized using a preformed bimetal construct, which
snaps between two stable states depending on its temperature. The bimetal snaps into an
upward and downward position, periodically, to make mechanical contact with
piezoelectric material that generates a voltage signal. The system still operates under the
convention of having a hot side and a cold side (like all thermoelectric designs), but the
mechanical movement of the bimetal beam transfers the heat. Scaling laws factor into
the maximum power output of these devices because the researchers show that when the
bimetal is reduced in dimension by a factor of k, the oscillation frequency is increased by
a factor of k2. Therefore, the proposed system benefits from miniaturization by a net
factor of k.
28
In addition to bimetal-based thermal energy harvesters, Monfray et al. describe
and test a prototype of thermofluidic harvesting system [24]. The thermofluidic energy
harvester operates on a repeating cycle of evaporation and condensation of a working
fluid inside a sealed cavity. The temperature of the hot side is above the boiling point of
the working fluid, while the temperature of the cold side is below the boiling point of the
fluid. This design creates significant pressure within the cavity as the fluid changes
between liquid and gaseous states; the pressure change is captured by a piezoelectric
membrane and converted into a voltage. Monfray proposes two separate configurations
for the thermofluidic energy harvester: a vertical design and a lateral design. The scaling
laws described in [2] also govern the output power generated by the thermofluidic energy
harvester. In a 2 cm2 prototype of the vertical design, the authors are able to achieve
voltage peaks between 2 and 3 V in steady state. No power density is reported.
The next iteration of the MEMS-based heat energy harvesting concept from
Puscasu’s research team is a discussion of prototype designs based on the analytical
models of the system [3]. The first prototype designs are built, and Puscasu et al. discuss
the actual results compared with the theoretical potential. Most notably, they indicate the
potential for capturing the maximum mechanical energy in the bimetal during its
oscillation cycle. Theoretically, the mechanical power density of the snapping bimetal is
calculated to be 2.7 mW/cm2. According to the k scaling laws mentioned earlier, a
reduction in the device dimensions by a factor of ten would result in a bimetal
mechanical power density of 27 mW/cm2. A power density of 27 mW/cm2 is orders of
magnitude higher than the power density of cutting edge Seebeck thermoelectric
29
technologies. But real-world efficiency limitations would not allow all of the mechanical
energy to be converted to electrical energy.
Boisseau et al. discuss the concept of coupling bimetals and electret-based
converters to harvest energy from thermal gradients [22]. Bimetal strip technology and
electret technology have existed for a while, but combining them for use as a heat engine
for energy harvesting purposes is new. Electrets are electrically charged dielectrics able
to keep their charge for years, and they enable direct mechanical-to-electrical conversion
by acting as a permanent polarization source in electrostatic converters. The use of
electrets greatly simplifies the power management required in electrostatic energy
harvesting designs. Boisseau states that curved or stamped bimetallic strips are
complicated devices that display strong nonlinear behaviors and snap between two stable
positions through sudden buckling that is dependent on temperature with a hysteretic
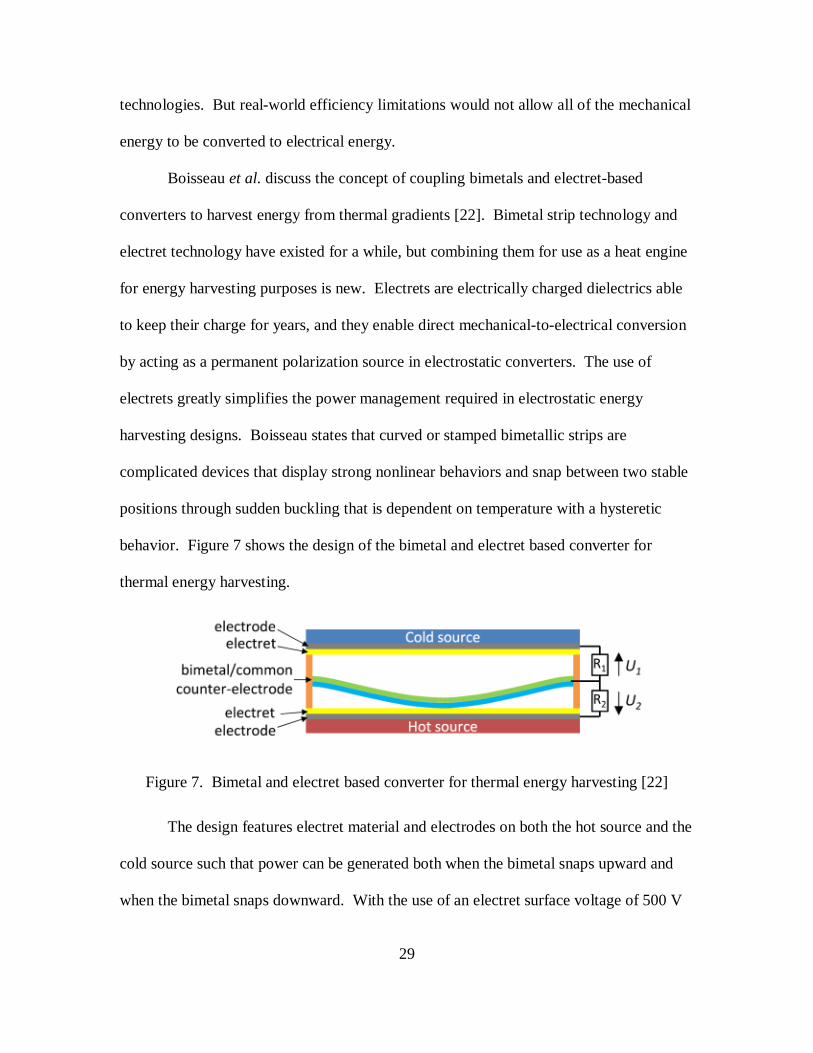
behavior. Figure 7 shows the design of the bimetal and electret based converter for
thermal energy harvesting.
Figure 7. Bimetal and electret based converter for thermal energy harvesting [22]
The design features electret material and electrodes on both the hot source and the
cold source such that power can be generated both when the bimetal snaps upward and
when the bimetal snaps downward. With the use of an electret surface voltage of 500 V
30
and a hot side of 60 °C, the mean power output per device is 13.46 μW. The bimetal
snapping frequency is 1-3 Hz. The cold side of the device is cooled to 36 °C by forced
convection through the use of a fan. The prototype tested in this experiment features a
bimetal that is designed to snap at 47 °C and to snap-back at 42.5 °C for a 4.5 °C
hysteresis cycle. The authors state that this prototype is non-optimized and suffers from
losses in the thermal-to-mechanical energy conversion step. The reported Carnot
efficiency is between 0.1% and 0.5%. The device reliability is high.
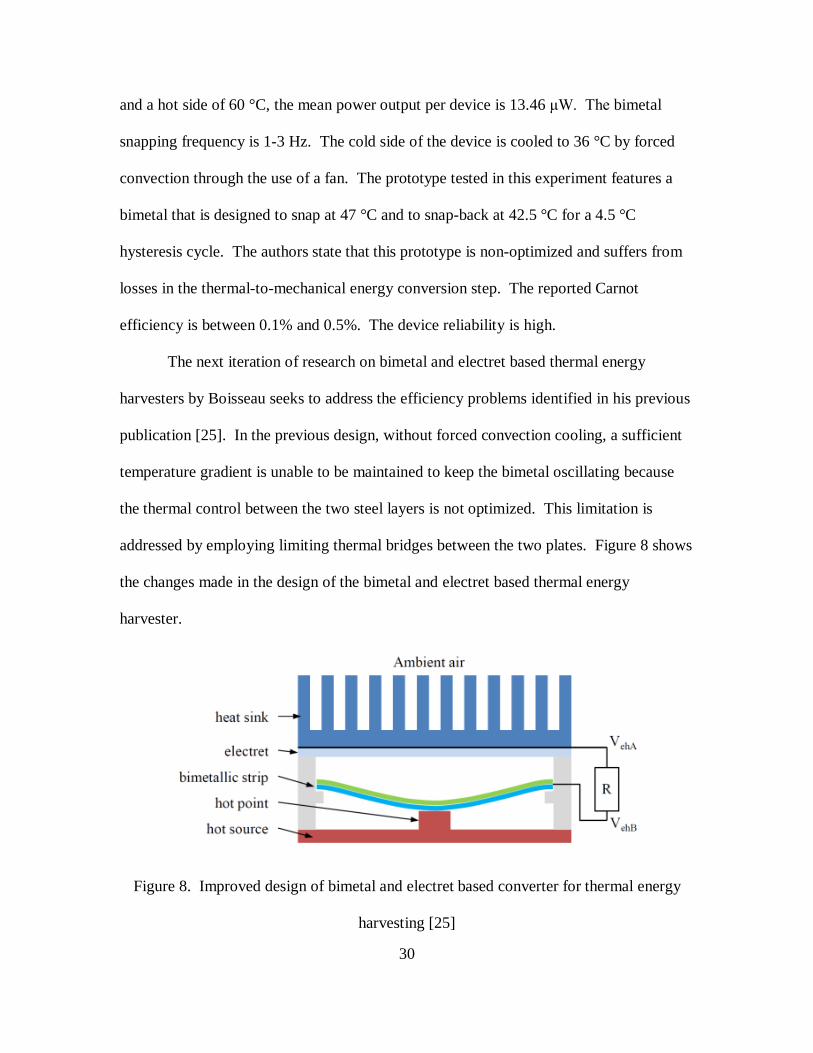
The next iteration of research on bimetal and electret based thermal energy
harvesters by Boisseau seeks to address the efficiency problems identified in his previous
publication [25]. In the previous design, without forced convection cooling, a sufficient
temperature gradient is unable to be maintained to keep the bimetal oscillating because
the thermal control between the two steel layers is not optimized. This limitation is
addressed by employing limiting thermal bridges between the two plates. Figure 8 shows
the changes made in the design of the bimetal and electret based thermal energy
harvester.
Figure 8. Improved design of bimetal and electret based converter for thermal energy
harvesting [25]
31
The hot point is a small cylinder of copper designed to act as a limiting thermal
bridge. Other differences include that a heat sink has been added to the design and a now
only one electret material remains on the cold side of the device. Boisseau reports high
electromechanical coupling in the improved design. As the surface voltage of the electret
increases, the output power of the device increases, but the snapping frequency of the
bimetal decreases. However, the generated power of the device ceases to increase for
electret surface voltages beyond 600 V. The maximum power attained with the improved
design is 5.4 μW per device on a hot source of 70 °C.
Arnaud et al. discusses the piezoelectric principles and optimization for the
conversion of kinetic energy into electrical energy [26]. The new design modification is
that a piezoelectric patch now functions as the electro-mechanical transducer and as the
thermal dissipater for the bimetal strip. The piezoelectric patch replaces the need for a
heat sink. This optimization raises the harvested energy to 24.6 μJ per snap compared
with previous designs that generated 1.8 μJ per snap. Arnaud identifies the benefits of
scaling the size of the device down to the micrometer scale. Parasitic capacitances in the
larger-sized devices are limiting factors for the efficient operation of a power
management circuit. Device down-scaling reduces the impact of these parasitic
capacitances. Additionally, the advantages of down-scaling bimetal strips include
achieving higher thermal energy transfer rates, higher switching speeds, higher snapping
frequencies, and capacitance variations. These advantages lead to overall increased
device efficiency and increased power density. Figure 9 shows a graphical display of the
stability of Ti-Au bimetal strips versus the bimetal strip thickness for a fixed length of
200 μm.

32
Figure 9. Stability of Ti-Au bimetal strips (L = 200 μm) [26]
δo represents the initial curvature of the bimetal. A critical ratio governs the
behavior of the bimetal strips: δo > t / √3, where t is the total bimetal thickness. If δo is
less than the ratio, then the snapping quality of the bimetal ceases and only gradual
buckling movement occurs. Arnaud also presents a process for producing micro-sized
bimetal strips using common fabrication procedures. A photoresist is patterned into
arrays of rectangles; the photoresist is then reflowed to produce rounded edges. The two
materials that compose the bimetal are deposited; the bimetal materials are patterned and
etched. Lastly, the photoresist is removed, and the devices are released.
The next iteration of the research conducted by Puscasu’s team concerns a further
analysis of the theory that governs the operation of a dual-stage MEMS thermal energy
converter [4]. In the article, the authors outline both the thermomechanical conversion
laws and the electromechanical conversion laws that apply to the device. The
relationships between variables in the equations yield a beneficial result when the
33
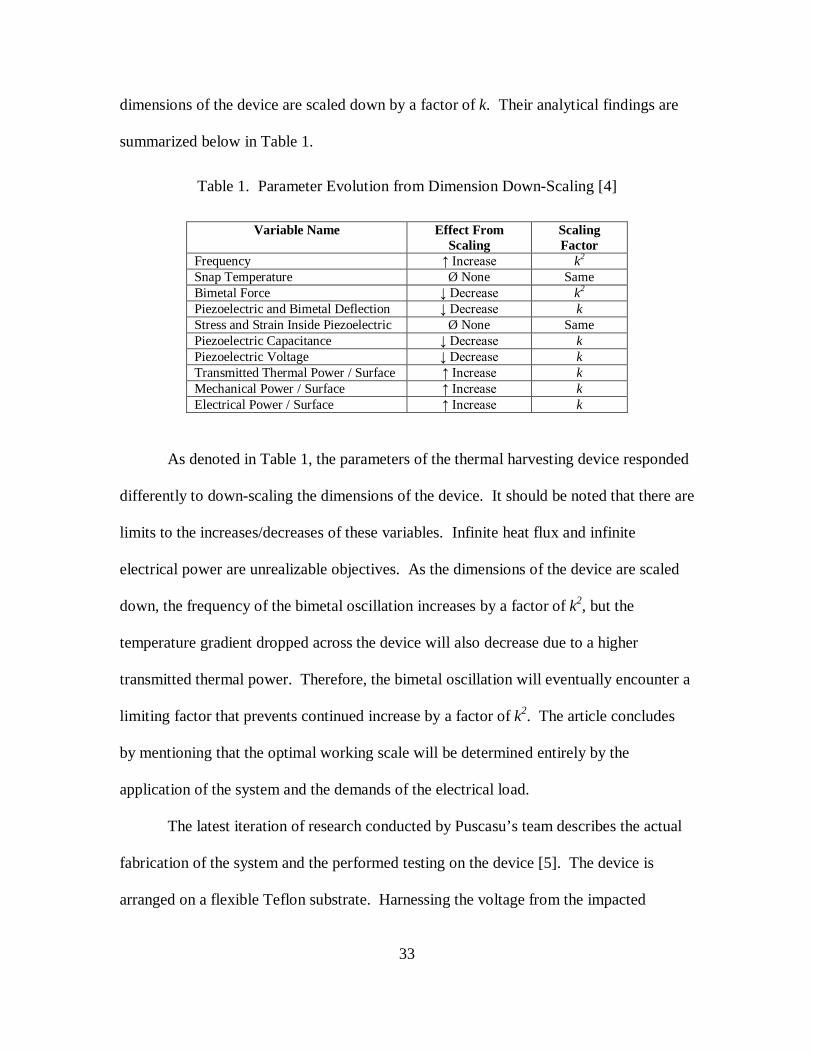
dimensions of the device are scaled down by a factor of k. Their analytical findings are
summarized below in Table 1.
Table 1. Parameter Evolution from Dimension Down-Scaling [4]
Variable Name Effect From Scaling
Scaling Factor
Frequency ↑ Increase k2 Snap Temperature Ø None Same Bimetal Force ↓ Decrease k2 Piezoelectric and Bimetal Deflection ↓ Decrease k Stress and Strain Inside Piezoelectric Ø None Same Piezoelectric Capacitance ↓ Decrease k Piezoelectric Voltage ↓ Decrease k Transmitted Thermal Power / Surface ↑ Increase k Mechanical Power / Surface ↑ Increase k Electrical Power / Surface ↑ Increase k
As denoted in Table 1, the parameters of the thermal harvesting device responded
differently to down-scaling the dimensions of the device. It should be noted that there are
limits to the increases/decreases of these variables. Infinite heat flux and infinite
electrical power are unrealizable objectives. As the dimensions of the device are scaled
down, the frequency of the bimetal oscillation increases by a factor of k2, but the
temperature gradient dropped across the device will also decrease due to a higher
transmitted thermal power. Therefore, the bimetal oscillation will eventually encounter a
limiting factor that prevents continued increase by a factor of k2. The article concludes
by mentioning that the optimal working scale will be determined entirely by the
application of the system and the demands of the electrical load.
The latest iteration of research conducted by Puscasu’s team describes the actual
fabrication of the system and the performed testing on the device [5]. The device is
arranged on a flexible Teflon substrate. Harnessing the voltage from the impacted
34
piezoelectric strip and rectifying the signal yields voltage peaks of up to 16.5 V. The
oscillation frequency of the device is 2.4 Hz. With only a 3 K temperature differential,
Puscasu reports a power density of 60 μW/cm3, which is comparable to most current
Seebeck devices. In two-dimensions, the power density for Puscasu’s fabricated devices
is 0.509 μW/cm2. There are still even further advantages of Puscasu’s design including
device operation in the absence of a heat sink and superior/economical thermal
management. Thus, a viable thermal energy harvesting alternative for Seebeck devices is
fabricated that displays desirable advantages. However, Puscasu indicates areas of
improvement for his work; the device efficiency and cell-to-cell variability needs
improvement.
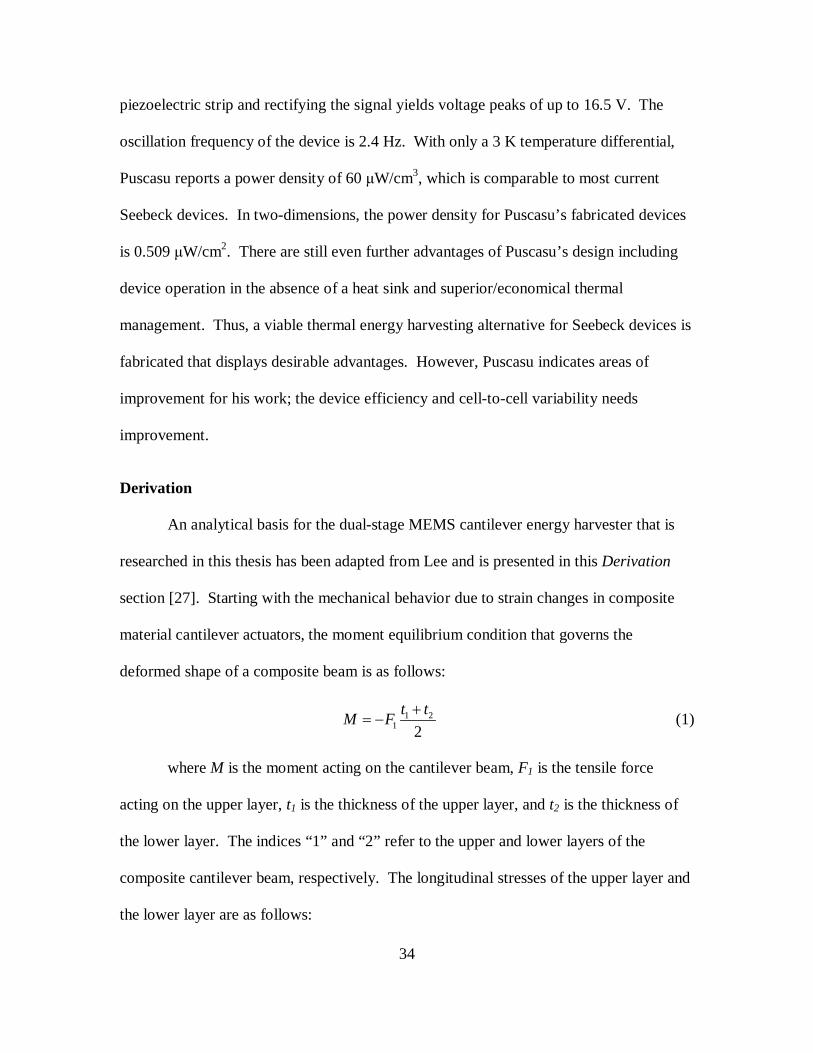
Derivation
An analytical basis for the dual-stage MEMS cantilever energy harvester that is
researched in this thesis has been adapted from Lee and is presented in this Derivation
section [27]. Starting with the mechanical behavior due to strain changes in composite
material cantilever actuators, the moment equilibrium condition that governs the
deformed shape of a composite beam is as follows:
1 21 2
t tM F += − (1)
where M is the moment acting on the cantilever beam, F1 is the tensile force
acting on the upper layer, t1 is the thickness of the upper layer, and t2 is the thickness of
the lower layer. The indices “1” and “2” refer to the upper and lower layers of the
composite cantilever beam, respectively. The longitudinal stresses of the upper layer and
the lower layer are as follows:
35
( )11 1 1 1 1 1
fx x fE E E
lδ δ
σ ε ε ε−
= = = − (2)
( )22 2 2 2 2 2
fx x fE E E
lδ δ
σ ε ε ε−
= = = − (3)
where σx is the longitudinal stress, Ẽ is the respective Young’s Modulus, εx is the
longitudinal strain, δf is the elongation displacement, and l is the beam length. Because
of the force equilibrium, it follows that:
1 1 2 2 0x xA Aσ σ+ = (4)
where A is the cross-sectional area of its respective layer. By substituting, the
strain of the straight beam is written as:
1 1 1 2 2 2
1 1 2 2f
E A E AE A E Aε εε +
=+
(5)
using equations (2) and (3). After substituting back into the longitudinal stress
equations, the stresses yield:
( )2 2 2 11 1
1 1 2 2x
E AE
E A E Aε ε
σ−
=+
(6)
( )1 1 2 12 2
1 1 2 2x
E AE
E A E Aε ε
σ−
= −+
(7)
using equation (5). The relative strain is defined as:
2 12 1l
δ δε ε ε−= = − (8)
and three ratios of the geometric/material properties between the two layers are
defined as:
36
1 1 1
2 2 2
, ,t w Ep q rt w E
= = =
(9)
to aid the management of terms in the derivation. Using the three newly defined
equations in (9), the stress equations can be written as:
1 2 1xrEpqrεσ =
+ (10)
2 2 1xpqrE
pqrεσ = −
+ (11)
by substitution. The moment condition is applied, and the moment equation is
solved as:
( )22 2 2
1 12 x effM w t p Mσ= + = − (12)
where Meff is the effective moment. The resulting radius of curvature from the
deflecting beam is as follows:
( ) ( ) ( )( )2 22
3 1 1 1/6 1
eff
eff
EI p pqr p pqrtM p
ρε
+ + + += =
+
(13)
where ρ is the radius of curvature, and (ẼI)eff is the effective flexural rigidity. The
radius of curvature is written as:
( )2
21 11
2 3 1t pqr p
pqrpρ
ε
+= + +
+ (14)
after simplifying. The relative strain can be written as:
312 1
1
d Vl t
δ δε −= = (15)
37
31
1
1 dp Vp t
ε += (16)
where d31 is the bending charge constant, and V is the voltage. By substituting
into equation (14), the new radius of curvature is:
( )
22
231
1 112 1 3 1
t p pqr pd V p pqrp
ρ +
= + + + + (17)
with a maximum deflection of:
( )
22
31
22
12 1 11
3 1
ll p ly d V
tpqrp ppqrp
ρ+ = = +
+ + +
(18)
where yl is the vertical deflection. Further substitution for the relative strain
yields:
( )( )2 12 1 H CT T
lδ δε α α−
= = − − (19)
where α is the respective coefficient of thermal expansion, and TH and TC are the
temperatures of the hot side and cold side, respectively. By substituting into equation
(14), the next radius of curvature is:
( )( ) ( )2
22 1
1 112 3 1H C
t pqr pT T pqrp
ρα α
+= + + − − +
(20)
with a maximum vertical deflection of:
( )( )
( )
222 1
22
2 1 113 1
H Cl
l T Tlypqrt p
pqrp
α αρ
− −= =
++ +
+
(21)
38
after substituting. By setting equations (18) and (21) equal to each other, the
relationship between voltage and thickness can be determined:
( )( )2 1
31
1 1~2
H CT T tV
d kα α− −
= (22)
to predict the effect of bimetal thickness scaling. This relationship agrees with
Puscasu’s research by predicting a decrease in output voltage by a factor of k when the
cantilever beam’s dimensions are scaled down by a factor of k. This claim agrees with
the derivations found in Puscasu’s research.
To determine the scaling relationship between the cantilever dimensions and the
operational frequency, the heat transfer characteristics are described by the
one-dimensional heat conduction equation:
2
2t
s
Qd Tdx k A
= −
(23)
where T is the temperature, x is the axis defined along the length of the cantilever,
tQ is the generated heat, ks is the thermal conductivity, and A is the cross-sectional area.
This equation can be solved using the boundary conditions TC at x = 0 and TH at x = l to
give the following temperature equation:
( )22
2t
H C Cs
Q l x x xT T T Tk A l l l
= − + − +
(24)
where TH and TC are the respective hot and cold temperatures, and l is the
cantilever beam length. Adapting the equation to model a cantilever beam with one fixed
end, the boundary conditions T = TC at x = 0 and dT/dx = 0 at x = l results in:
39
22
22
tC
s
Q l x xT Tk A l l
= − +
(25)
to find the temperature along the beam. One simplification to find the
temperature at x = l yields:
2
2t
H Cs
Q lT Tk A
= +
(26)
after substituting. With the equation in this form, the scaling relationship between
the cantilever dimensions and time becomes evident. tQ is defined as the heat generated
per unit beam length per unit time. Therefore, similar k-factor logic from the analytical
derivations featured in [2, 4] explains the effect of dimensional scaling as it relates to the
cantilever beam oscillation frequency and ultimately the electrical power output. Noting
the relationship between tQ and l2 in equation (26), time is directly proportional to the
square of the length:
2~t l (27)
which implies that the frequency is directly proportional to the inverse of the
square of the length:
22
1~ ~f kl
(28)
predicting that a reduction in device dimensions by a factor of k would increase
the cantilever beam oscillation frequency by a factor of k2. This claim agrees with the
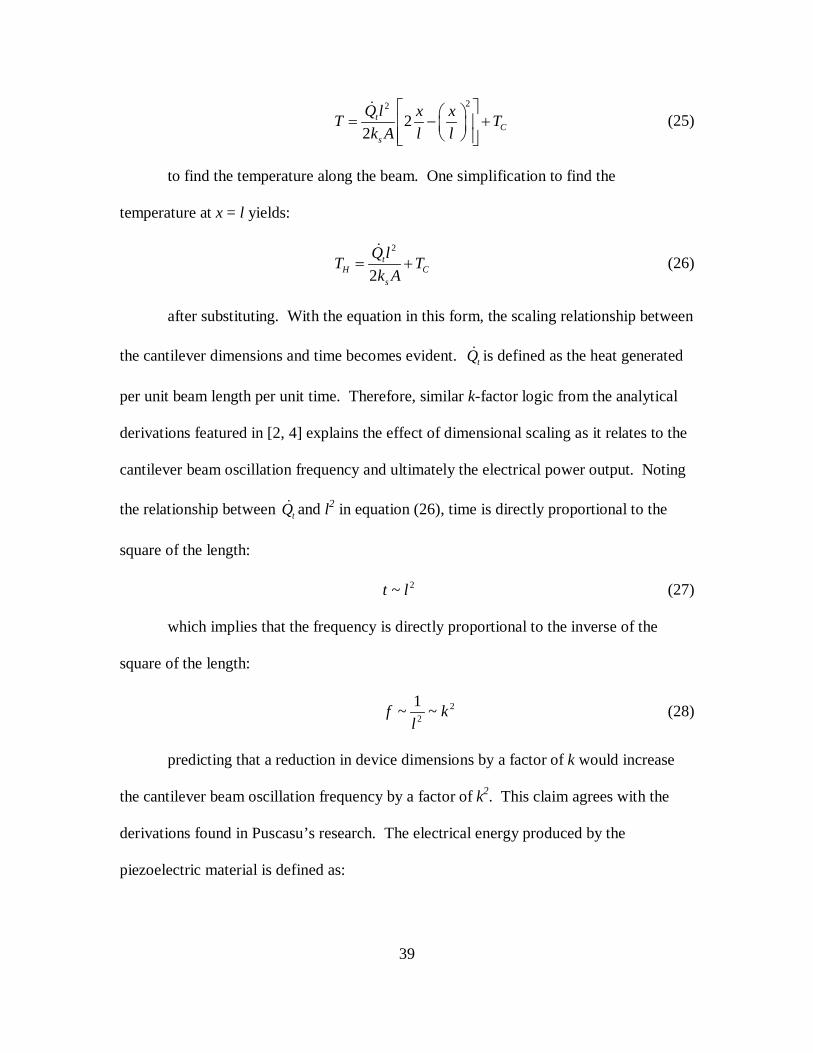
derivations found in Puscasu’s research. The electrical energy produced by the
piezoelectric material is defined as:
40
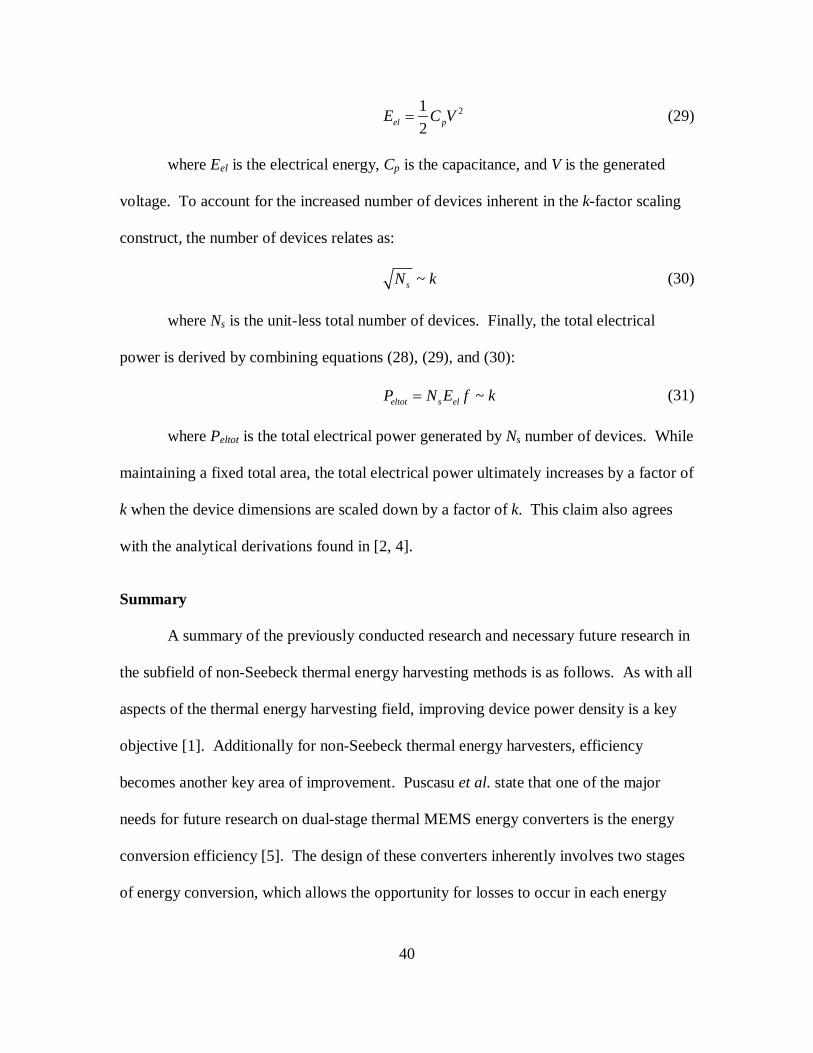
212el pE C V= (29)
where Eel is the electrical energy, Cp is the capacitance, and V is the generated
voltage. To account for the increased number of devices inherent in the k-factor scaling
construct, the number of devices relates as:
~sN k (30)
where Ns is the unit-less total number of devices. Finally, the total electrical
power is derived by combining equations (28), (29), and (30):
~eltot s elP N E f k= (31)
where Peltot is the total electrical power generated by Ns number of devices. While
maintaining a fixed total area, the total electrical power ultimately increases by a factor of
k when the device dimensions are scaled down by a factor of k. This claim also agrees
with the analytical derivations found in [2, 4].
Summary
A summary of the previously conducted research and necessary future research in
the subfield of non-Seebeck thermal energy harvesting methods is as follows. As with all
aspects of the thermal energy harvesting field, improving device power density is a key
objective [1]. Additionally for non-Seebeck thermal energy harvesters, efficiency
becomes another key area of improvement. Puscasu et al. state that one of the major
needs for future research on dual-stage thermal MEMS energy converters is the energy
conversion efficiency [5]. The design of these converters inherently involves two stages
of energy conversion, which allows the opportunity for losses to occur in each energy
41
transition process. The authors identify that a snapping bimetal that absorbs its own
kinetic energy will induce losses in the thermal to mechanical energy conversion. The
authors also identify that the mechanical to electrical energy conversion efficiency is on
the order of a few percent because only the forward snap energy is captured by the
piezoelectric transducer. Bimetals that do not absorb their own kinetic energy and
piezoelectric transducers that have low mechanical damping and high coupling factors
will address these efficiency obstacles. Especially in forms of low-power applications,
efficiency is paramount since voltage and current magnitudes are already small.
Energy harvesting applications that involve the human body are low power also
and generate milliwatt-size signals according to current technology [23]. Future research
for thermal energy harvesting applied to the human body requires device miniaturization
because wearable devices must be both ergonomic and unobtrusive in nature.
Non-Seebeck devices offer a viable solution to this requirement because they show
increasing promise for out-performing the semiconductor-based thermal energy
harvesters without the use of a heat sink.
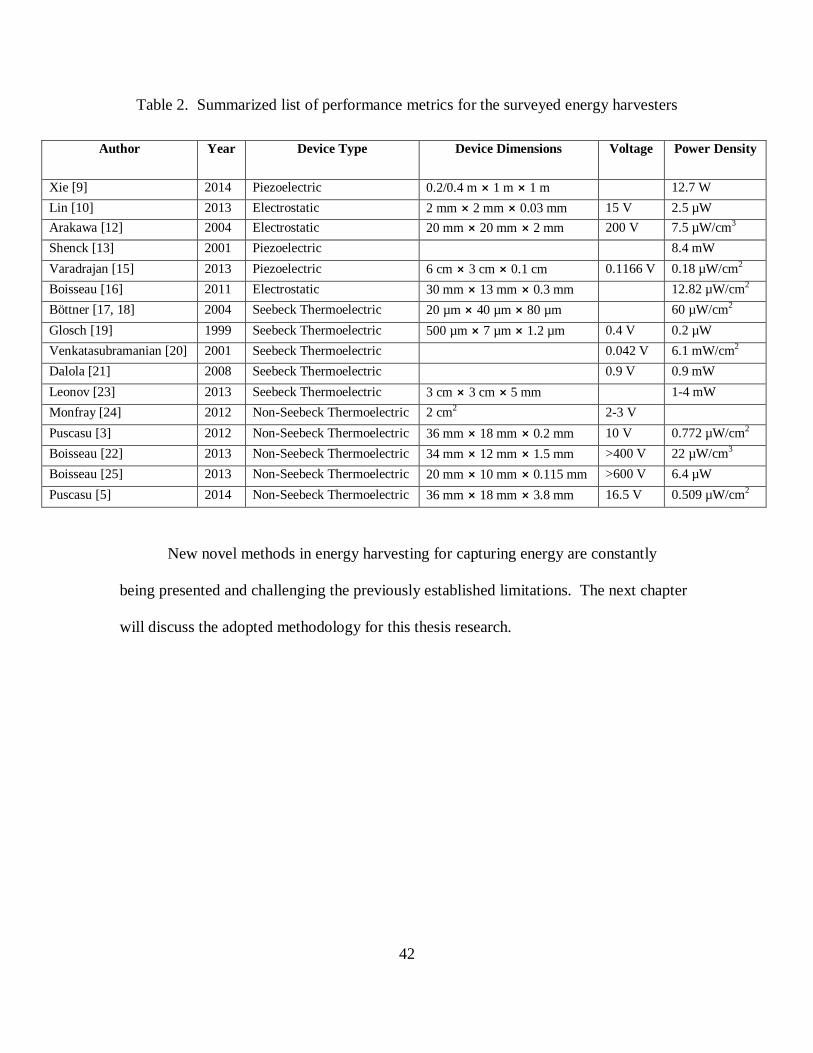
Table 2 shows a summary of the key parameters for the research presented in this
literature review.
42
Table 2. Summarized list of performance metrics for the surveyed energy harvesters
Author Year Device Type Device Dimensions Voltage Power Density
Xie [9] 2014 Piezoelectric 0.2/0.4 m ⨯ 1 m ⨯ 1 m 12.7 W Lin [10] 2013 Electrostatic 2 mm ⨯ 2 mm ⨯ 0.03 mm 15 V 2.5 µW Arakawa [12] 2004 Electrostatic 20 mm ⨯ 20 mm ⨯ 2 mm 200 V 7.5 µW/cm3 Shenck [13] 2001 Piezoelectric 8.4 mW Varadrajan [15] 2013 Piezoelectric 6 cm ⨯ 3 cm ⨯ 0.1 cm 0.1166 V 0.18 µW/cm2 Boisseau [16] 2011 Electrostatic 30 mm ⨯ 13 mm ⨯ 0.3 mm 12.82 µW/cm2 Böttner [17, 18] 2004 Seebeck Thermoelectric 20 µm ⨯ 40 µm ⨯ 80 µm 60 µW/cm2 Glosch [19] 1999 Seebeck Thermoelectric 500 µm ⨯ 7 µm ⨯ 1.2 µm 0.4 V 0.2 µW Venkatasubramanian [20] 2001 Seebeck Thermoelectric 0.042 V 6.1 mW/cm2 Dalola [21] 2008 Seebeck Thermoelectric 0.9 V 0.9 mW Leonov [23] 2013 Seebeck Thermoelectric 3 cm ⨯ 3 cm ⨯ 5 mm 1-4 mW Monfray [24] 2012 Non-Seebeck Thermoelectric 2 cm2 2-3 V Puscasu [3] 2012 Non-Seebeck Thermoelectric 36 mm ⨯ 18 mm ⨯ 0.2 mm 10 V 0.772 µW/cm2 Boisseau [22] 2013 Non-Seebeck Thermoelectric 34 mm ⨯ 12 mm ⨯ 1.5 mm >400 V 22 µW/cm3 Boisseau [25] 2013 Non-Seebeck Thermoelectric 20 mm ⨯ 10 mm ⨯ 0.115 mm >600 V 6.4 µW Puscasu [5] 2014 Non-Seebeck Thermoelectric 36 mm ⨯ 18 mm ⨯ 3.8 mm 16.5 V 0.509 µW/cm2
New novel methods in energy harvesting for capturing energy are constantly
being presented and challenging the previously established limitations. The next chapter
will discuss the adopted methodology for this thesis research.
43
III. Methodology
Chapter Overview
The methodology of this experimentation is designed to observe the effect of
bimetal thickness scaling and test the performance of the cantilever design of the
dual-stage MEMS cantilever energy harvester. The remaining sections of this chapter
describe the system boundaries within the simulation environment, the pertinent variables
that govern the operation and performance of the dual-stage MEMS cantilever energy
harvester, the campaign of experiments, and methods for analyzing the results of the
simulations.
Experiment Design
a. Design Overview
Using the bimetal and piezoelectric based harvester from the literature as a
starting point, a cantilever-based design is proposed in this research [5]. The dual-stage
MEMS cantilever energy harvester is a beam design composed of three layers. The
bottom active layer is aluminum; the middle passive layer is SiO2; the top piezoelectric
layer is PZT-5H. One major difference in the design configuration of dual-stage MEMS
cantilever energy harvester when compared with the bimetal and piezoelectric based
harvester from the literature is that the design is not impact-based. The aspect of
transferring mechanical energy to the piezoelectric material through impact is removed to
improve the energy conversion efficiency of the piezoelectric material. The output
energy of piezoelectric ceramics is orders of magnitude larger when achieved through
gradual stress as opposed to impact stress [28]. Therefore, one intended advantage to
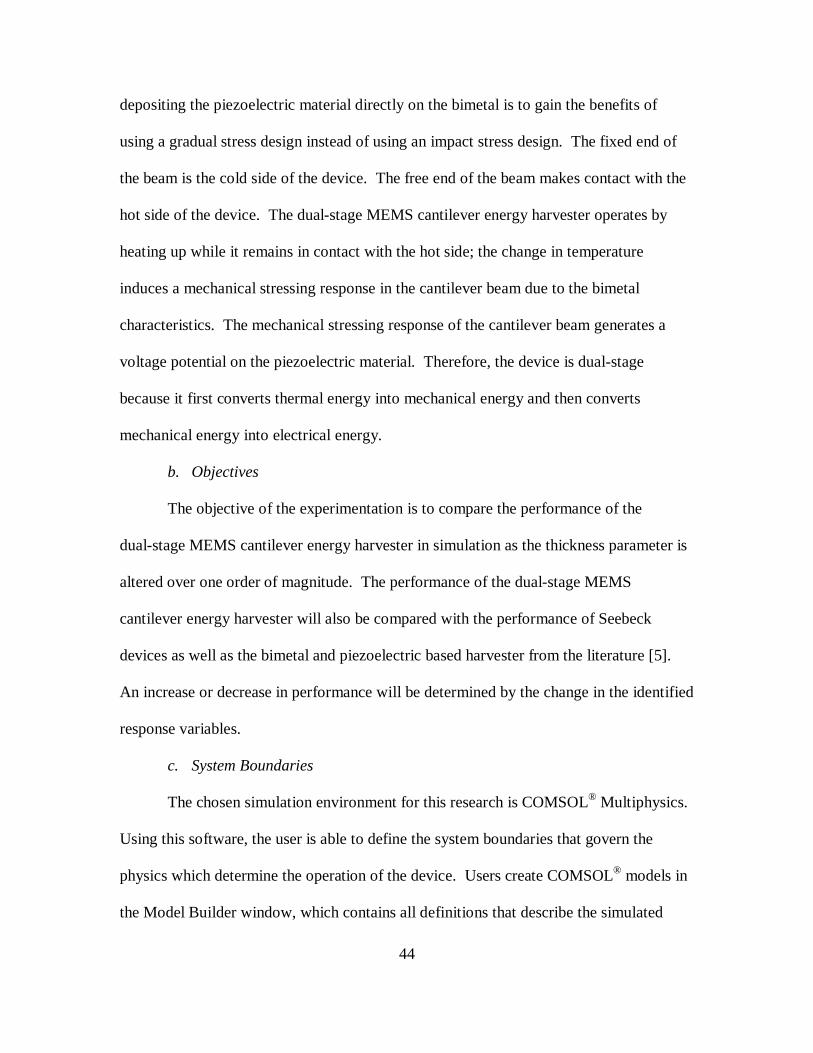
44
depositing the piezoelectric material directly on the bimetal is to gain the benefits of
using a gradual stress design instead of using an impact stress design. The fixed end of
the beam is the cold side of the device. The free end of the beam makes contact with the
hot side of the device. The dual-stage MEMS cantilever energy harvester operates by
heating up while it remains in contact with the hot side; the change in temperature
induces a mechanical stressing response in the cantilever beam due to the bimetal
characteristics. The mechanical stressing response of the cantilever beam generates a
voltage potential on the piezoelectric material. Therefore, the device is dual-stage
because it first converts thermal energy into mechanical energy and then converts
mechanical energy into electrical energy.
b. Objectives
The objective of the experimentation is to compare the performance of the
dual-stage MEMS cantilever energy harvester in simulation as the thickness parameter is
altered over one order of magnitude. The performance of the dual-stage MEMS
cantilever energy harvester will also be compared with the performance of Seebeck
devices as well as the bimetal and piezoelectric based harvester from the literature [5].
An increase or decrease in performance will be determined by the change in the identified
response variables.
c. System Boundaries
The chosen simulation environment for this research is COMSOL® Multiphysics.
Using this software, the user is able to define the system boundaries that govern the
physics which determine the operation of the device. Users create COMSOL® models in
the Model Builder window, which contains all definitions that describe the simulated
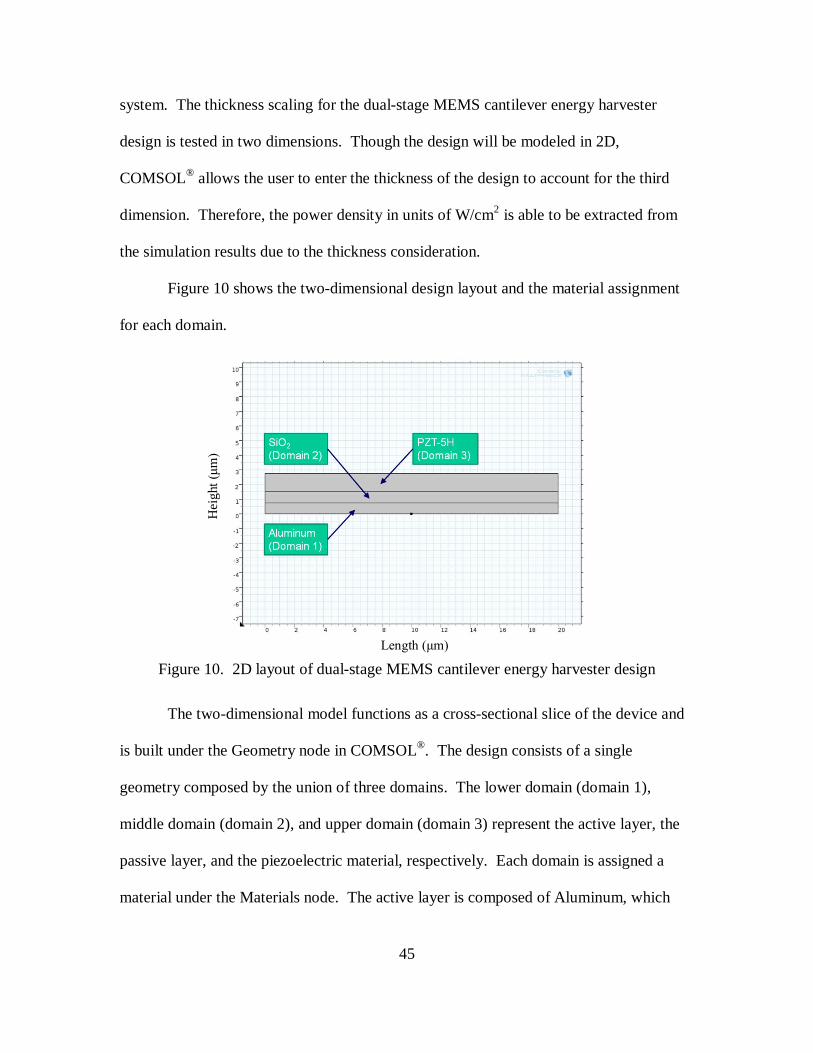
45
system. The thickness scaling for the dual-stage MEMS cantilever energy harvester
design is tested in two dimensions. Though the design will be modeled in 2D,
COMSOL® allows the user to enter the thickness of the design to account for the third
dimension. Therefore, the power density in units of W/cm2 is able to be extracted from
the simulation results due to the thickness consideration.
Figure 10 shows the two-dimensional design layout and the material assignment
for each domain.
Figure 10. 2D layout of dual-stage MEMS cantilever energy harvester design
The two-dimensional model functions as a cross-sectional slice of the device and
is built under the Geometry node in COMSOL®. The design consists of a single
geometry composed by the union of three domains. The lower domain (domain 1),
middle domain (domain 2), and upper domain (domain 3) represent the active layer, the
passive layer, and the piezoelectric material, respectively. Each domain is assigned a
material under the Materials node. The active layer is composed of Aluminum, which
Hei
ght (
μm)
Length (μm)
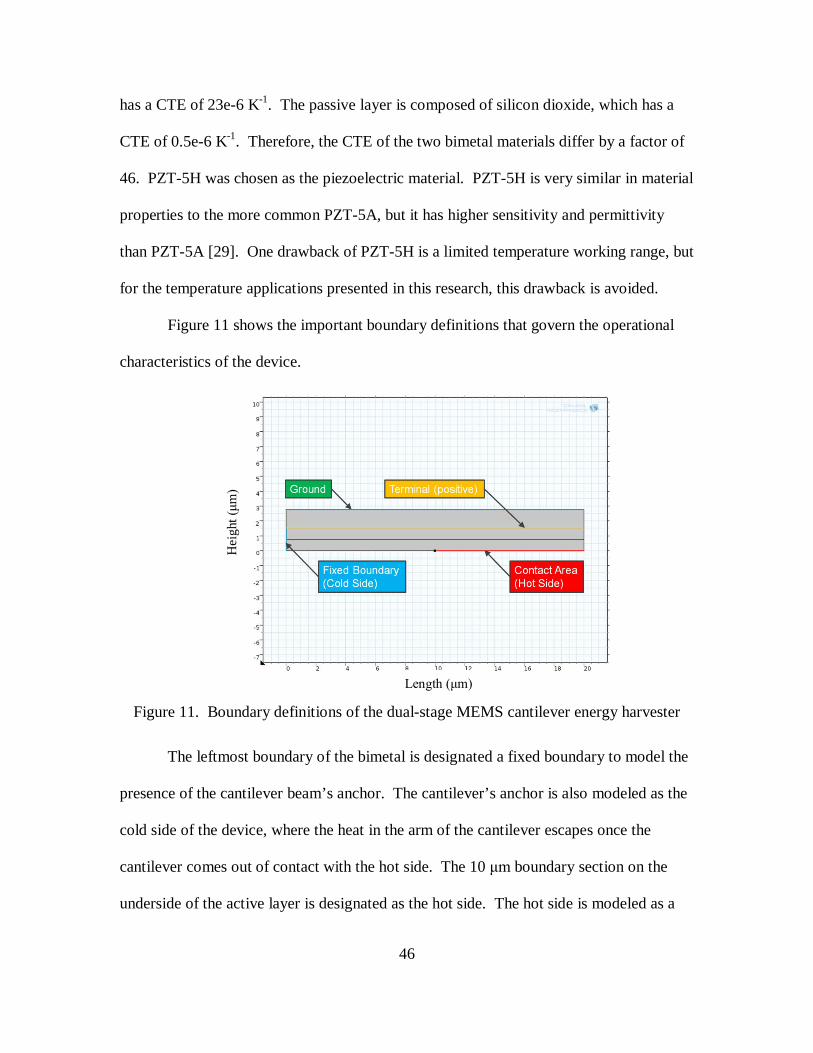
46
has a CTE of 23e-6 K-1. The passive layer is composed of silicon dioxide, which has a
CTE of 0.5e-6 K-1. Therefore, the CTE of the two bimetal materials differ by a factor of
46. PZT-5H was chosen as the piezoelectric material. PZT-5H is very similar in material
properties to the more common PZT-5A, but it has higher sensitivity and permittivity
than PZT-5A [29]. One drawback of PZT-5H is a limited temperature working range, but
for the temperature applications presented in this research, this drawback is avoided.
Figure 11 shows the important boundary definitions that govern the operational
characteristics of the device.
Figure 11. Boundary definitions of the dual-stage MEMS cantilever energy harvester
The leftmost boundary of the bimetal is designated a fixed boundary to model the
presence of the cantilever beam’s anchor. The cantilever’s anchor is also modeled as the
cold side of the device, where the heat in the arm of the cantilever escapes once the
cantilever comes out of contact with the hot side. The 10 μm boundary section on the
underside of the active layer is designated as the hot side. The hot side is modeled as a
Hei
ght (
μm)
Length (μm)
47
temperature boundary and is fed a heat input function that brings the boundary to the
temperature of the hot side briefly, which is representing the time that the cantilever
beam would be in contact with the hot side. The topmost boundary is designated as
ground and represents the grounded terminal of the piezoelectric material. The bottom
boundary of the piezoelectric material is designated terminal, which is where the
boundary probes read the voltage signal generated by the piezoelectric material.
The setup requires three physics packages solved simultaneously to compute the
solution. The first employed physics package is Piezoelectric Devices. Each fixed
constraint and terminal assignment is listed under the Piezoelectric Devices node.
Domain 3 is designated as the piezoelectric material, which is orientated in the Material
XZ-Plane coordinate system. Domains 1-3 are specified as Linear Elastic Material. As a
subset of the Linear Elastic Material subnode, the bimetal is given a Thermal Expansion.
Thermal Expansion allows the user to set the strain reference temperature and apply
model input temperatures to the bimetal domains. The strain reference temperature
describes the temperature where there are zero stresses or strains in a material; for this
research, the strain reference temperature is set to the temperature of the cold side at
296.15 K. The model input temperature is set as an iteratively tuned piecewise function
that represents the transfer of heat between domains once they make contact. The Fixed
Constraint is applied to the leftmost boundaries of the bimetal to model the presence of
the anchor. The upper boundary of the piezoelectric material is designated a Ground
node, while the lower boundary of the piezoelectric material is designated a Terminal
node to extract the electrical response of the PZT-5H.
48
The second employed physics package is Heat Transfer in Solids. This package
models the thermal characteristics of the bimetal. A Temperature node designates the
leftmost boundary of the bimetal as the temperature of the cold side at 296.15 K.
Another Temperature node designates the contact boundary on the bimetal as the heat
input function that models the latching operation of the dual-stage MEMS cantilever
energy harvester.
The third employed physics package is Electrical Circuit. This package uses the
Ground and Terminal nodes under the Piezoelectric Devices package to form a virtual
circuit. The output circuit is composed of a 1 kΩ resistor acting as the load. A 1 kΩ
resistor is chosen to avoid the difficulties described in the literature review where energy
harvesting devices suffer losses in output power from parasitic capacitances. Parasitic
capacitances have been linked with high-resistance loads and must be accounted for in
the design of the energy harvesting system [16]. It is understood that a real-world
implementation of the dual-stage MEMS cantilever energy harvester would need to be
impedance matched to the particular biomedical sensor or electronic device for which the
energy harvester provides power.
The Mesh node describes the how each domain is partitioned into finite elements.
The device components are meshed using a Mapped Distribution. A total of 100
boundary elements are mapped along the lower boundary of the bimetal. 2 boundary
elements are mapped along the rightmost edge of the bimetal; 2 boundary elements are
mapped along the rightmost edge of the piezoelectric material. Therefore, the complete
mesh consists of 400 domain elements.
49
The employed solver is a Time-Dependent study. A backward differential (BDF)
solver is chosen with an intermediate time-stepping method. The Direct solver is
enabled, and the Fully Coupled subnode is added to the study. The Fully Coupled
subnode forces the solver to simultaneously evaluate all three physics packages at the
same time rather than independently.
d. Assumptions and Limitations
Simulations often suffer from limitations in their ability to exactly predict
real-world operation of models. This subsection discusses the assumptions and
limitations present in this body of research and their effect on a real-world
implementation of the dual-stage MEMS cantilever energy harvester.
One key characteristic that makes the operation of the dual-stage MEMS
cantilever energy harvester effective is that the cantilever arm must remain in contact
with the hot side of the device to heat the active layer enough before the beam deflects.
This concept is referred to as latching. Latching involves holding the beam against the
hot side with an external force to allow significant transfer of heat. Within the
simulation, this effect is achieved by the heat input function that applies the temperature
of the hot side to the contact area for a brief amount of time, which is tuned to return the
highest peak voltage out of the device. In a real-world implementation, this effect could
be achieved in a number of ways. The first proposed method is to employ permanent
magnets to hold the tip of the cantilever beam down long enough to heat. This system
requires no external circuitry, but accommodations would have to be made for additional
weight and heat transfer effects. Employing permanent magnets takes advantage of the
characteristics of magnetic forces that drop off with 1/r2 (with distance r) in the near field
50
and with 1/r3 (with distance r) in the far field. Therefore, the attractive force between the
cantilever beam tip and the hot side would be greatest when the two objects were in
contact and weakest when the cantilever beam reached maximum deflection. One
challenge that employing permanent magnets encounters is that current wafer-scale
fabrication techniques are not suited for depositing and patterning magnetic materials [1].
The second proposed method is to electrostatically maintain contact between the
cantilever beam tip and the hot side. This system does require external circuitry, but no
accommodations for additional weight or heat transfer effects would be necessary. A
voltage pad with an accompanying dielectric layer would be deposited underneath the
cantilever beam, but not interfering with the hot side. The voltage would be set at a
constant negative voltage to take advantage of the characteristics of electrostatic forces
that drop off with 1/r2 (with distance r). Therefore, the attractive force between the
cantilever beam and the voltage pad would be greatest when the cantilever experienced
zero deflection and weakest when the cantilever beam reached maximum deflection. One
variation on this method is to use a square wave as the signal on the voltage pad that is
synced with the frequency of the cantilever beam’s displacement cycle. In both
variations, the only power consumption suffered is leakage losses in the external circuitry
because there is no closed circuit in these two proposed methods. The signals on the
voltage pad could be generated from the electrical output of the dual-stage MEMS
cantilever energy harvester. From the use of output-generated voltage signals, there
would be a transitory period of reduced efficiency until the device reached full efficiency
at steady state. The third proposed method is to use an electret material to latch the
cantilever beam. Electrets are stable electrically charged dielectrics that are capable of
51
holding their charge for many years (high reliability). This system requires no external
circuitry, and no accommodations have to be made for additional weight or heat transfer
effects; thus, it is the most desirable latching technique. The voltage would be set at a
constant negative voltage to take advantage of the characteristics of electrostatic forces
that drop off with 1/r2 (with distance r). Therefore, the attractive force between the
cantilever beam and the voltage pad would be greatest when the cantilever experienced
zero deflection and weakest when the cantilever beam reached maximum deflection.
The contact area, as defined in the simulation, is where the underside of the
cantilever beam and the hot side of the device overlap. The contact area used for this
research is a 10 μm × 10 μm square. In real-world MEMS devices, stiction can become
an issue for large contact areas. Stiction can be avoided through material choice and the
use of dimples in the design. A real-world implementation of the dual-stage MEMS
cantilever energy harvester might use gold on the top surface of the hot side and place
dimples on the underside of the cantilever beam’s contact area to ensure that stiction does
not prevent the device from operating. The use of gold improves the reliability of the
device over time, and the dimples minimize the surface area shared between the two
objects in contact to mitigate the possibility of the objects becoming stuck together by
surface adhesion forces.
Another assumption that is crucial to the design of the dual-stage MEMS
cantilever energy harvester is that the cantilever beam must be thermally isolated from
the hot side of the device with the exception of the contact area. If the substrate is to be
considered the hot side of the device, then the cantilever beam must be anchored to a
thermally insulating layer that separates the cantilever from the substrate. Thermal
52
isolation is paramount because the cantilever is modeled as the cold side of the device.
Therefore, heat transfer between the hot side and cold side of the device that does not
contribute to the mechanical deflection of the beam degrades the efficiency.
e. Identified Variables
Variables for three dimensions are identified and included in this section. The
primary response variable is the power density. The electrical power density is
commonly measured in Watts per square centimeter (W/cm2) for energy harvesting
devices and is the most important performance metric in this thermal energy harvesting
system. The ultimate goal of an effective modular energy harvesting system is the
maximization of the electrical power density because the devices must not deliver
maximum power only; they must deliver maximum power while also using space
efficiently. Variables of lesser importance that function as response variables are the
bimetal oscillation frequency, mechanical force developed, beam deflection, voltage,
transmitted thermal power density, and mechanical power density. These response
variables result from the control variable inputs and determine a system response for the
device.
The control variables of interest in this body of research are the thickness of the
bimetal and the heating interval of the contact area. The length and width of the beam are
fixed at 20 μm and 10 μm, respectively. The bimetal thickness is scaled over one order
of magnitude from 10 μm down to 1 μm to affect the response variables. The employed
materials in the device are chosen as aluminum, silicon dioxide, and PZT-5H. Excluding
the parts not built in the simulation, in its most basic form, the design of the dual-stage
MEMS cantilever energy harvester consists of three unique materials to achieve the
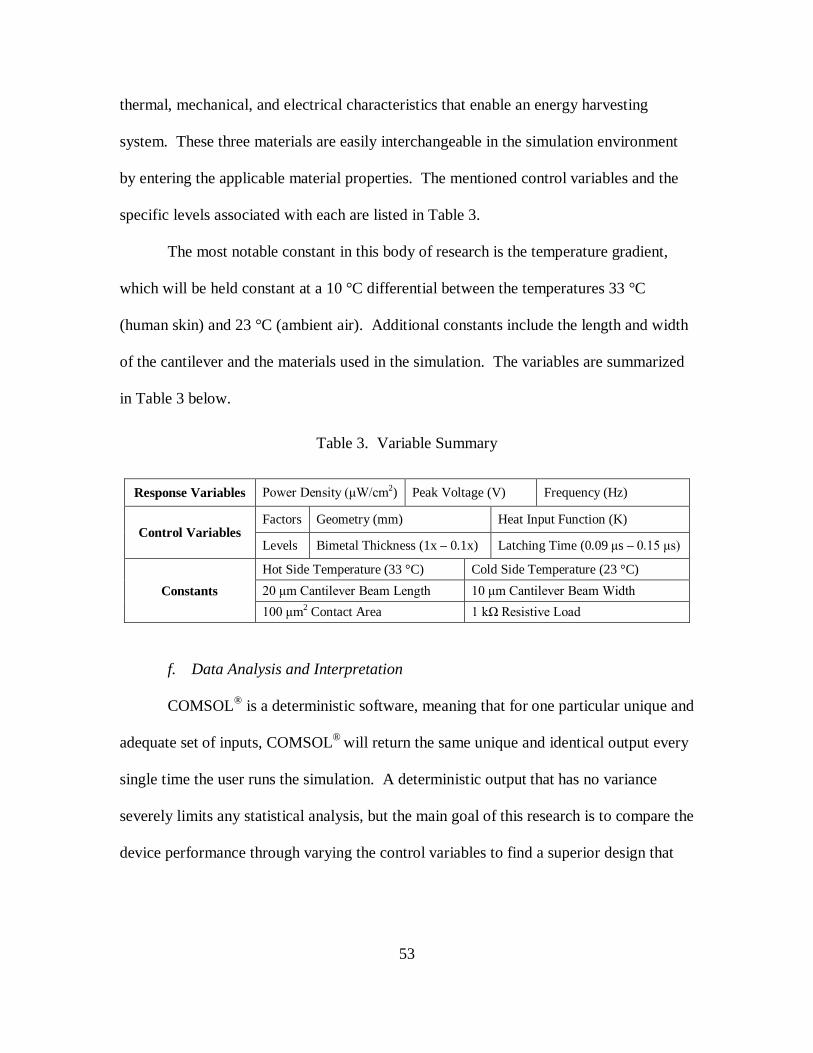
53
thermal, mechanical, and electrical characteristics that enable an energy harvesting
system. These three materials are easily interchangeable in the simulation environment
by entering the applicable material properties. The mentioned control variables and the
specific levels associated with each are listed in Table 3.
The most notable constant in this body of research is the temperature gradient,
which will be held constant at a 10 °C differential between the temperatures 33 °C
(human skin) and 23 °C (ambient air). Additional constants include the length and width
of the cantilever and the materials used in the simulation. The variables are summarized
in Table 3 below.
Table 3. Variable Summary
Response Variables Power Density (μW/cm2) Peak Voltage (V) Frequency (Hz)
Control Variables Factors Geometry (mm) Heat Input Function (K)
Levels Bimetal Thickness (1x – 0.1x) Latching Time (0.09 μs – 0.15 μs)
Constants Hot Side Temperature (33 °C) Cold Side Temperature (23 °C) 20 μm Cantilever Beam Length 10 μm Cantilever Beam Width 100 μm2 Contact Area 1 kΩ Resistive Load
f. Data Analysis and Interpretation
COMSOL® is a deterministic software, meaning that for one particular unique and
adequate set of inputs, COMSOL® will return the same unique and identical output every
single time the user runs the simulation. A deterministic output that has no variance
severely limits any statistical analysis, but the main goal of this research is to compare the
device performance through varying the control variables to find a superior design that

54
competes with Seebeck performance and with the performance of non-Seebeck devices
from the literature [5].
The compiled test matrix provided in Table 4 describes the campaign of
experiments that is expected to satisfy the research objectives.
Table 4. Test Matrix
Test Control Variables Response Variables Bimetal Thickness Heat Input Function Power Density Peak Voltage Bimetal Oscillation Frequency 1 1 ⨯ Thickness 0.09 μs – 0.15 μs Power Density Peak Voltage Bimetal Oscillation Frequency 2 0.75 ⨯ Thickness 0.09 μs – 0.15 μs Power Density Peak Voltage Bimetal Oscillation Frequency 3 0.5 ⨯ Thickness 0.09 μs – 0.15 μs Power Density Peak Voltage Bimetal Oscillation Frequency 4 0.45 ⨯ Thickness 0.09 μs – 0.15 μs Power Density Peak Voltage Bimetal Oscillation Frequency 5 0.4 ⨯ Thickness 0.09 μs – 0.15 μs Power Density Peak Voltage Bimetal Oscillation Frequency 6 0.35 ⨯ Thickness 0.09 μs – 0.15 μs Power Density Peak Voltage Bimetal Oscillation Frequency 7 0.3 ⨯ Thickness 0.09 μs – 0.15 μs Power Density Peak Voltage Bimetal Oscillation Frequency 8 0.25 ⨯ Thickness 0.09 μs – 0.15 μs Power Density Peak Voltage Bimetal Oscillation Frequency 9 0.2 ⨯ Thickness 0.09 μs – 0.15 μs Power Density Peak Voltage Bimetal Oscillation Frequency
10 0.15 ⨯ Thickness 0.09 μs – 0.15 μs Power Density Peak Voltage Bimetal Oscillation Frequency 11 0.125 ⨯ Thickness 0.09 μs – 0.15 μs Power Density Peak Voltage Bimetal Oscillation Frequency 12 0.1 ⨯ Thickness 0.09 μs – 0.15 μs Power Density Peak Voltage Bimetal Oscillation Frequency
As featured in the test matrix, the thickness scaling has been designed to cover
one order of magnitude as a means of determining the extent to which the analytical
model holds true over a wide range. For all cases, the power density, peak voltage, and
bimetal oscillation frequency are the most desired response variables. Therefore, each
response variable can be plotted against the bimetal thickness to determine the
relationship.
For all response variables, the simulation results are expected to follow the
analytical models that are outlined in the literature [2, 3, 4, 5]. Although analytical
derivation and simulation are both abstract approaches to modeling the dual-stage MEMS

55
cantilever energy harvester, they will undoubtedly produce different power density
results because the former is a theoretical method while the latter is a numerical method.
Summary
An approach for determining the effects of device miniaturization through bimetal
thickness scaling has been presented. The next section will discuss the results of the
research.
56
IV. Analysis and Results
Chapter Overview
This section presents the results of the 2D simulations of the dual-stage MEMS
thermal energy harvester. Experimentation in this research addresses aspects of varying
the control variable: bimetal thickness. The simulation process determines how the
control variable affects the response variables and is recorded in this chapter. The
campaign of experiments described in the test matrix from the Methodology chapter
yields the following results.
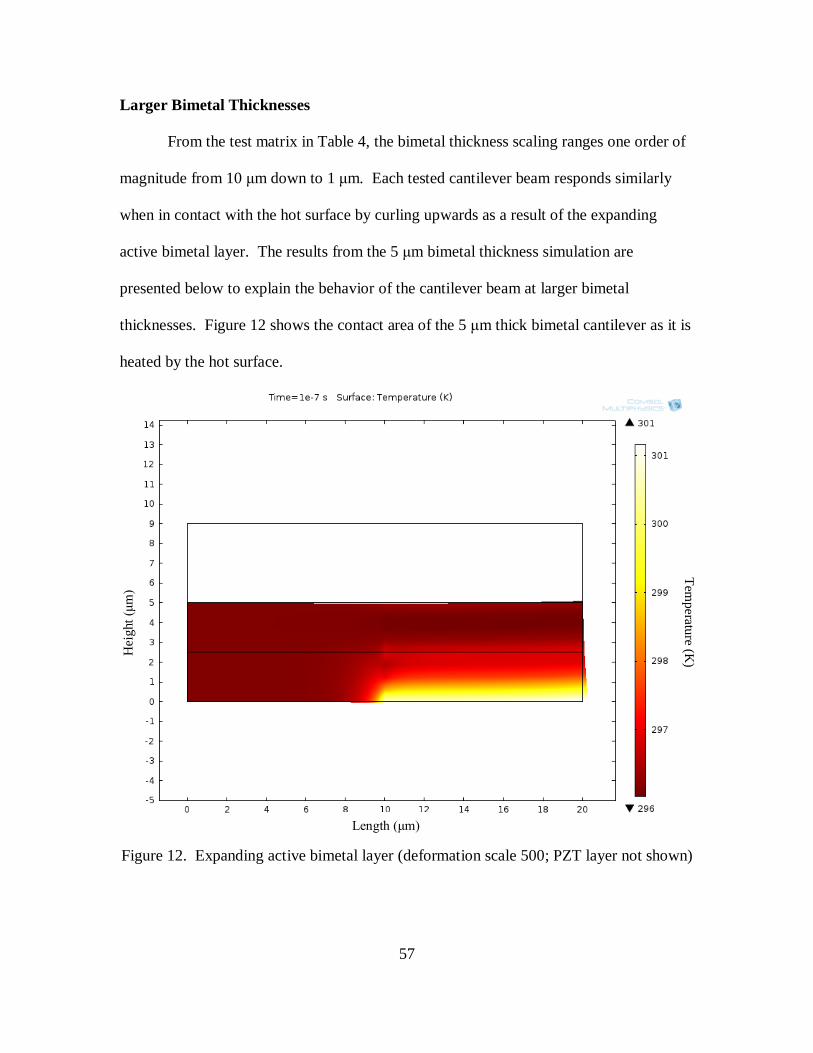
57
Larger Bimetal Thicknesses
From the test matrix in Table 4, the bimetal thickness scaling ranges one order of
magnitude from 10 μm down to 1 μm. Each tested cantilever beam responds similarly
when in contact with the hot surface by curling upwards as a result of the expanding
active bimetal layer. The results from the 5 μm bimetal thickness simulation are
presented below to explain the behavior of the cantilever beam at larger bimetal
thicknesses. Figure 12 shows the contact area of the 5 μm thick bimetal cantilever as it is
heated by the hot surface.
Figure 12. Expanding active bimetal layer (deformation scale 500; PZT layer not shown)
Hei
ght (
μm)
Length (μm)
Temperature (K
)
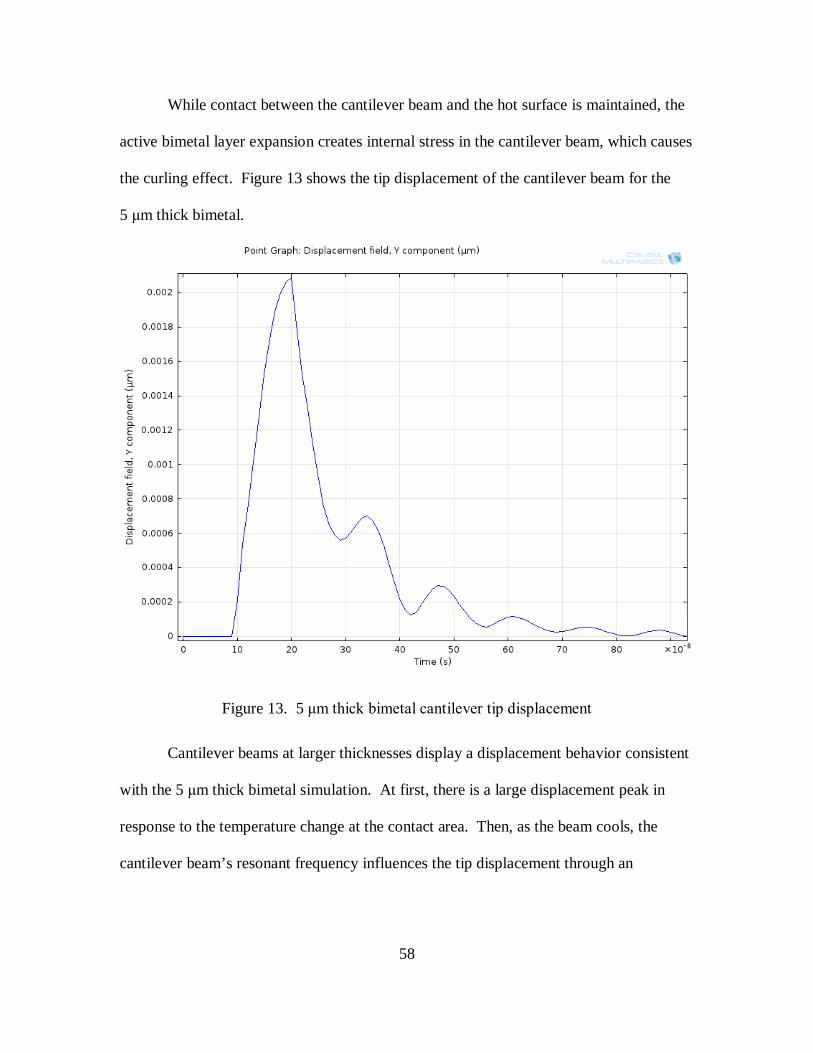
58
While contact between the cantilever beam and the hot surface is maintained, the
active bimetal layer expansion creates internal stress in the cantilever beam, which causes
the curling effect. Figure 13 shows the tip displacement of the cantilever beam for the
5 μm thick bimetal.
Figure 13. 5 μm thick bimetal cantilever tip displacement
Cantilever beams at larger thicknesses display a displacement behavior consistent
with the 5 μm thick bimetal simulation. At first, there is a large displacement peak in
response to the temperature change at the contact area. Then, as the beam cools, the
cantilever beam’s resonant frequency influences the tip displacement through an
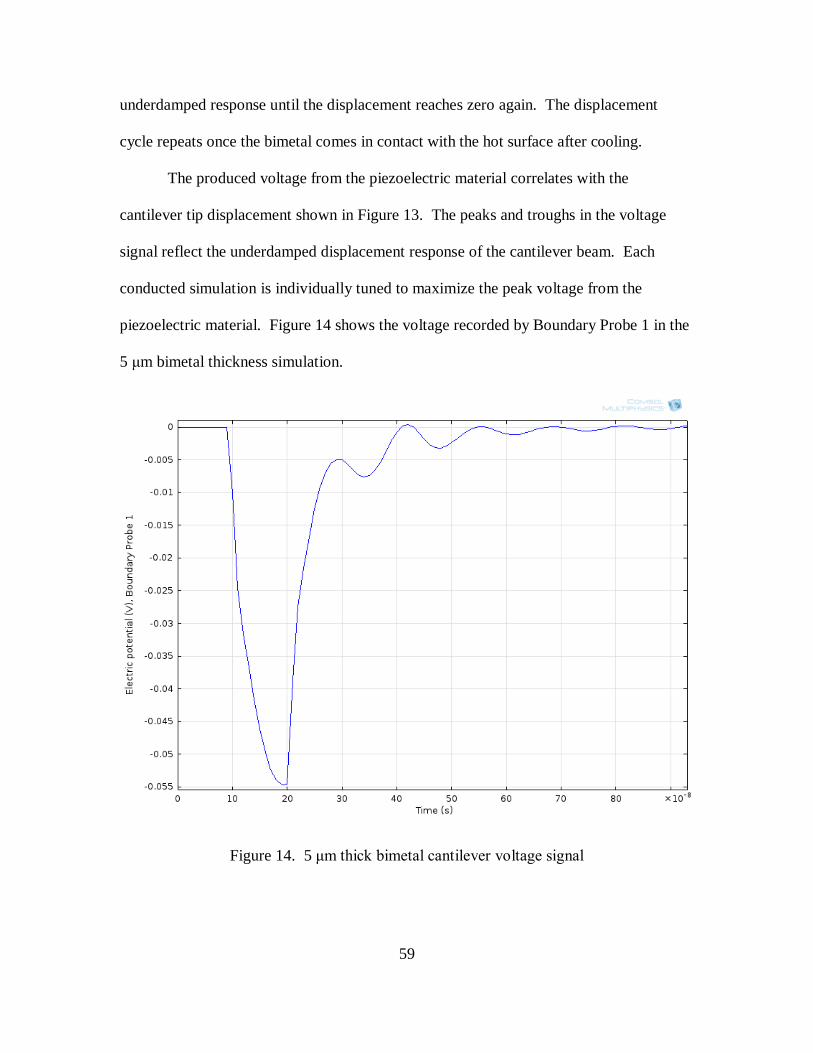
59
underdamped response until the displacement reaches zero again. The displacement
cycle repeats once the bimetal comes in contact with the hot surface after cooling.
The produced voltage from the piezoelectric material correlates with the
cantilever tip displacement shown in Figure 13. The peaks and troughs in the voltage
signal reflect the underdamped displacement response of the cantilever beam. Each
conducted simulation is individually tuned to maximize the peak voltage from the
piezoelectric material. Figure 14 shows the voltage recorded by Boundary Probe 1 in the
5 μm bimetal thickness simulation.
Figure 14. 5 μm thick bimetal cantilever voltage signal
60
The tuning process for each simulation involves finding the “roll-off” point of the
produced voltage. This process is governed by the length of the heating time, which
represents the length of time that the cantilever beam is forced to remain in contact with
the hot surface before release. As seen in Figure 14, the voltage signal reaches its
maximum just before the cantilever tip displacement reaches its maximum in Figure 13.
This is the desired effect that identifies the “roll-off” point. Boundary Probe 1 is set to
record the voltage on the underside of the piezoelectric material. The coordinate system
selection for the piezoelectric material orientation in the simulation is set to the XZ-plane,
which yields a negative voltage when the bottom face of the piezoelectric material is
subject to tensile stress. Figure 15 shows a surface plot of the electric potential through
one vertical slice of the 5 μm bimetal thickness cantilever beam as it is stressed.

61
Figure 15. Stressed piezoelectric material (deformation scale 500; bimetal layer not
shown)
The largest voltage magnitude resides at the location where the piezoelectric
material experiences the most bending. Figure 15 is showing the state of the
piezoelectric material at 0.2 μs, which is where the maximum voltage magnitude occurs
in Figure 14. As can be noted from the color legend, the largest voltage magnitude is in
the dark blue area at -0.12 V. However, in Figure 14, -0.12 V is not the maximum
voltage magnitude recorded in the voltage signal. This is because the simulation treats
the entire lower boundary of the piezoelectric material as a conductor and therefore
Hei
ght (
μm)
Length (μm)
Voltage (V
)

62
averages across the boundary to produce a net voltage. The net voltage value is then
dropped across the 1 kΩ resistor through the virtual circuit.
The current density also correlates with the features described in the cantilever tip
displacement plot in Figure 13. It is expected that the beam tip displacement would
strongly influence the voltage signal and the current density produced by the piezoelectric
material because the output of the piezoelectric material depends on its mechanical input.
Figure 16 shows the current density of the piezoelectric material in the 5 μm bimetal
thickness simulation.
Figure 16. 5 μm thick bimetal cantilever current density
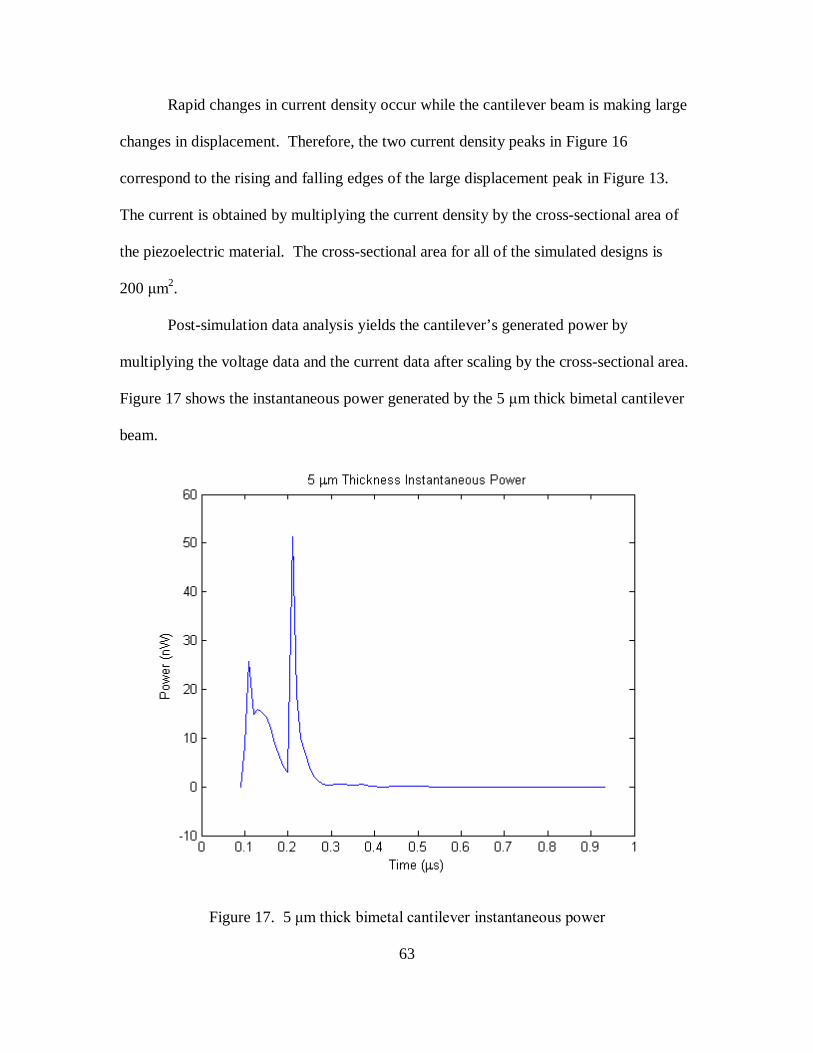
63
Rapid changes in current density occur while the cantilever beam is making large
changes in displacement. Therefore, the two current density peaks in Figure 16
correspond to the rising and falling edges of the large displacement peak in Figure 13.
The current is obtained by multiplying the current density by the cross-sectional area of
the piezoelectric material. The cross-sectional area for all of the simulated designs is
200 μm2.
Post-simulation data analysis yields the cantilever’s generated power by
multiplying the voltage data and the current data after scaling by the cross-sectional area.
Figure 17 shows the instantaneous power generated by the 5 μm thick bimetal cantilever
beam.
Figure 17. 5 μm thick bimetal cantilever instantaneous power

64
The range of time shown on the x-axis represents one cycle of operation. The first
local maximum corresponds with the rising edge of the displacement peak in Figure 13;
the absolute maximum corresponds with the falling edge of the displacement peak in
Figure 13. Over one full cycle, the average power for the 5 μm thick bimetal cantilever is
1.95 nW. Most of the appreciable power generated by the cantilever beam occurs during
the beginning of its cycle; this is the behavior of the cantilever beam at larger bimetal
thicknesses. Therefore, it would be desirable to shorten the time length of a cycle to
feature only the interval where appreciable power is generated by the cantilever beam.
This issue is addressed through the down-scaling of the bimetal thickness. The next
sub-section of this chapter shows the behavior of the cantilever beam at smaller bimetal
thicknesses to exhibit the differences and benefits of scaling the thickness.
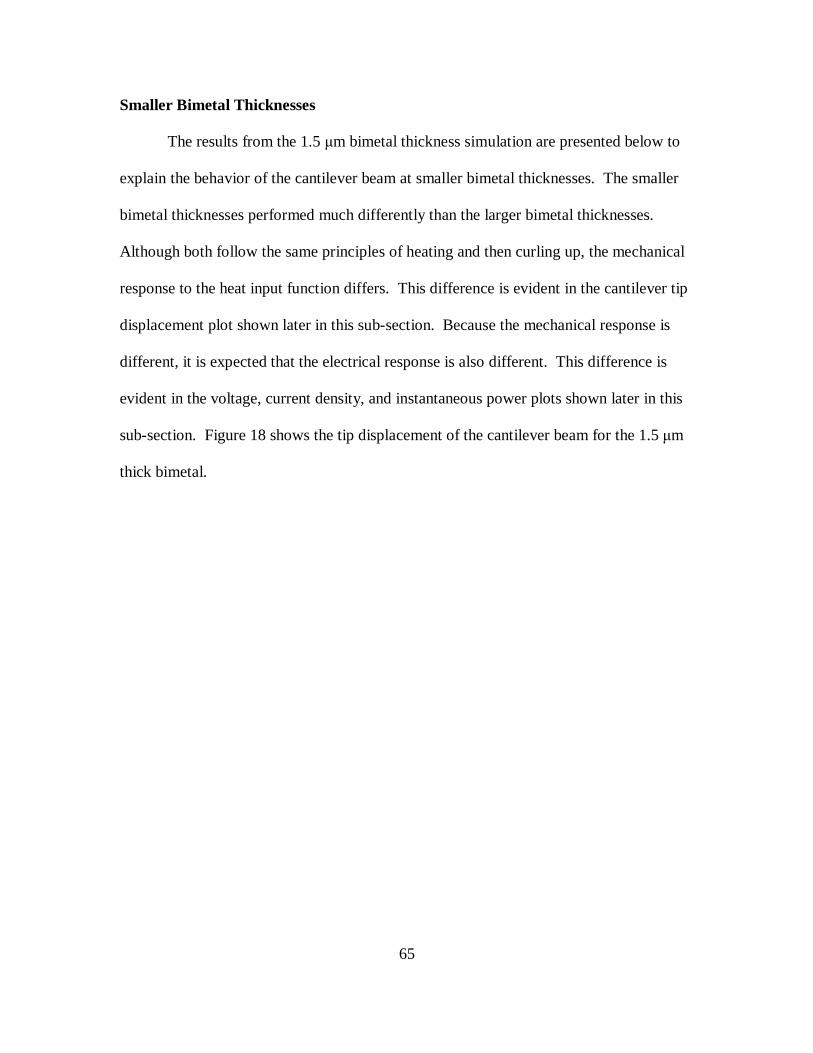
65
Smaller Bimetal Thicknesses
The results from the 1.5 μm bimetal thickness simulation are presented below to
explain the behavior of the cantilever beam at smaller bimetal thicknesses. The smaller
bimetal thicknesses performed much differently than the larger bimetal thicknesses.
Although both follow the same principles of heating and then curling up, the mechanical
response to the heat input function differs. This difference is evident in the cantilever tip
displacement plot shown later in this sub-section. Because the mechanical response is
different, it is expected that the electrical response is also different. This difference is
evident in the voltage, current density, and instantaneous power plots shown later in this
sub-section. Figure 18 shows the tip displacement of the cantilever beam for the 1.5 μm
thick bimetal.
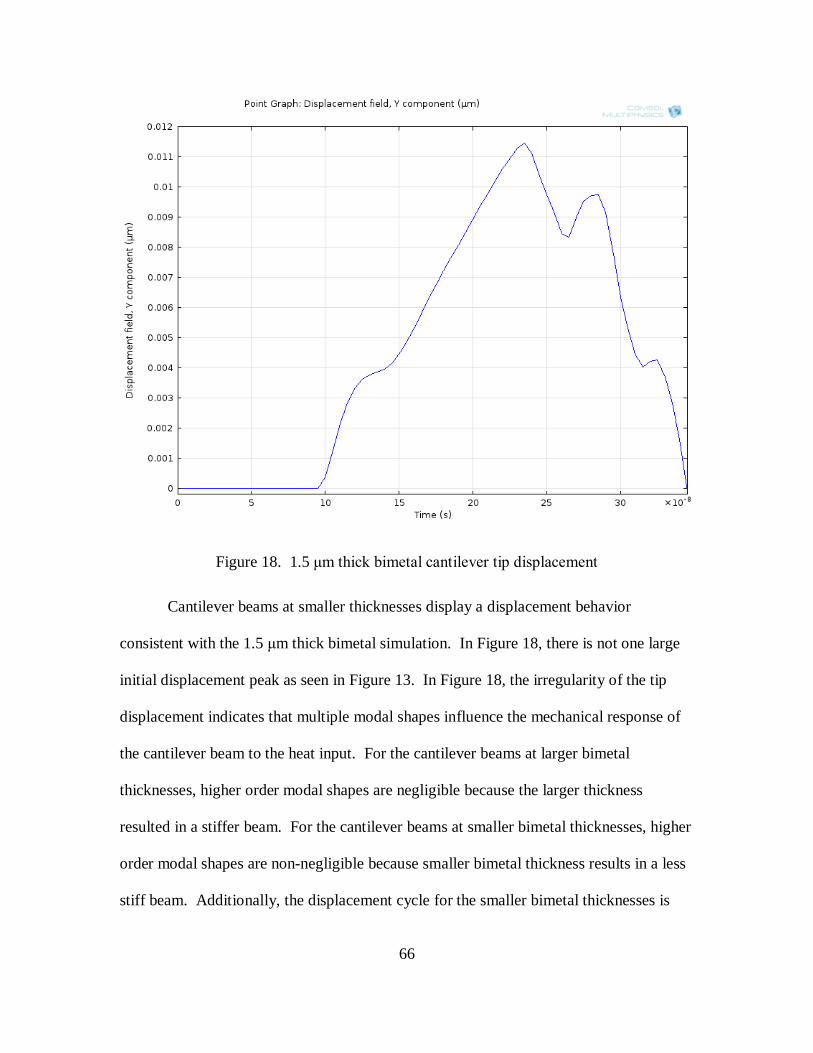
66
Figure 18. 1.5 μm thick bimetal cantilever tip displacement
Cantilever beams at smaller thicknesses display a displacement behavior
consistent with the 1.5 μm thick bimetal simulation. In Figure 18, there is not one large
initial displacement peak as seen in Figure 13. In Figure 18, the irregularity of the tip
displacement indicates that multiple modal shapes influence the mechanical response of
the cantilever beam to the heat input. For the cantilever beams at larger bimetal
thicknesses, higher order modal shapes are negligible because the larger thickness
resulted in a stiffer beam. For the cantilever beams at smaller bimetal thicknesses, higher
order modal shapes are non-negligible because smaller bimetal thickness results in a less
stiff beam. Additionally, the displacement cycle for the smaller bimetal thicknesses is
67
shorter than the displacement cycle of the larger bimetal thicknesses. A shorter
displacement cycle ultimately results in a larger power output, which is discussed later in
this sub-section.
The local maxima in the cantilever tip displacement plot, shown in Figure 18,
correspond with the generated voltage from the piezoelectric material. Figure 19 shows
the voltage recorded by Boundary Probe 1 in the 1.5 μm bimetal thickness simulation.
Figure 19. 1.5 μm thick bimetal cantilever voltage signal
The tuning process for the smaller bimetal thickness simulations is more difficult
because there are multiple voltage magnitude peaks rather than one large definitive
voltage magnitude peak. The tuning process is modified in the case of smaller bimetal
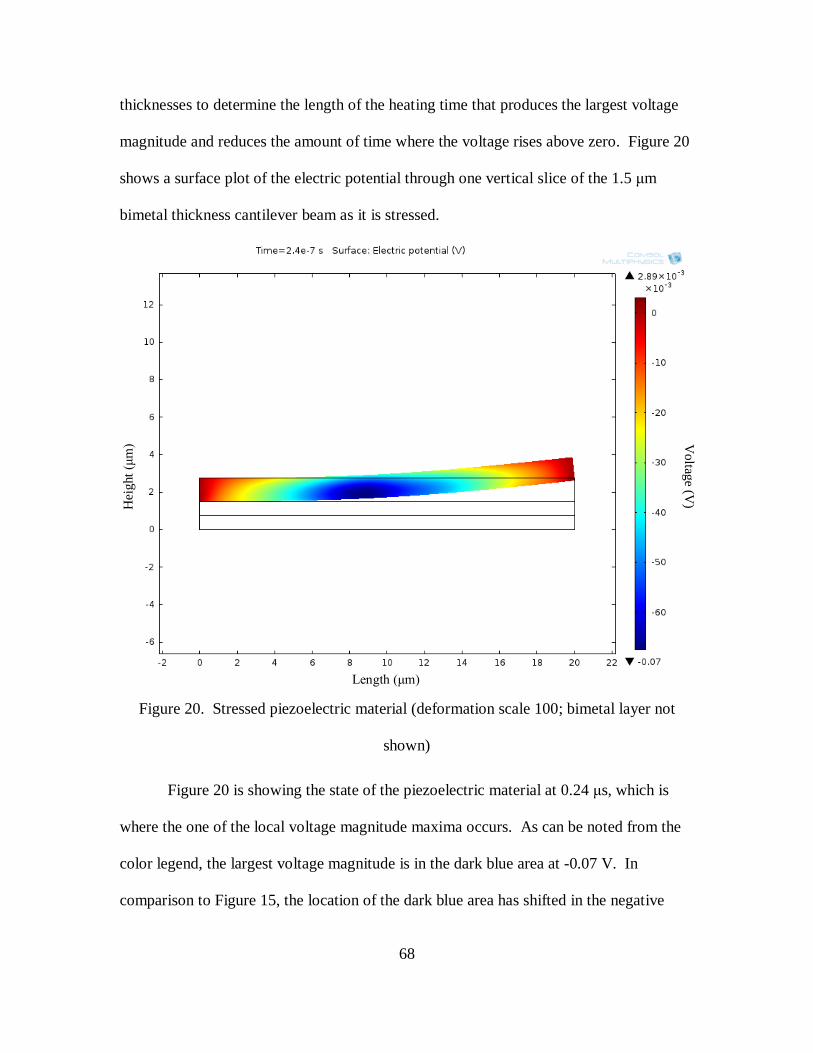
68
thicknesses to determine the length of the heating time that produces the largest voltage
magnitude and reduces the amount of time where the voltage rises above zero. Figure 20
shows a surface plot of the electric potential through one vertical slice of the 1.5 μm
bimetal thickness cantilever beam as it is stressed.
Figure 20. Stressed piezoelectric material (deformation scale 100; bimetal layer not
shown)
Figure 20 is showing the state of the piezoelectric material at 0.24 μs, which is
where the one of the local voltage magnitude maxima occurs. As can be noted from the
color legend, the largest voltage magnitude is in the dark blue area at -0.07 V. In
comparison to Figure 15, the location of the dark blue area has shifted in the negative
Hei
ght (
μm)
Length (μm)
Voltage (V
)
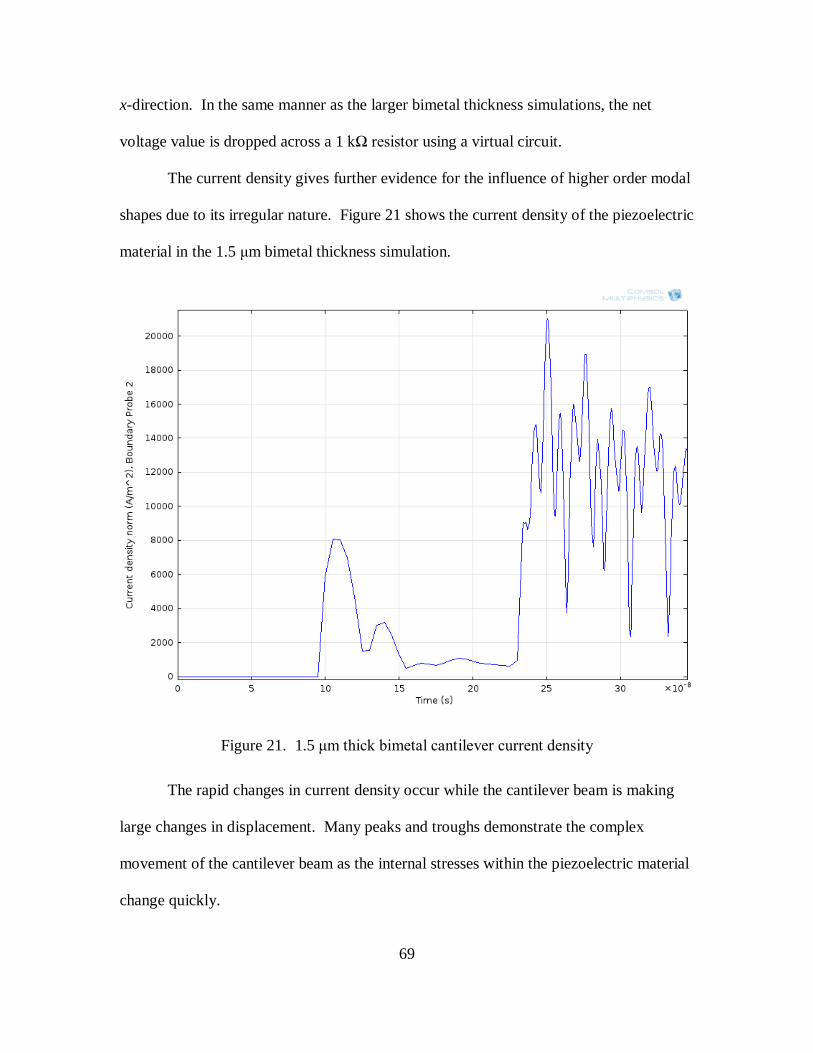
69
x-direction. In the same manner as the larger bimetal thickness simulations, the net
voltage value is dropped across a 1 kΩ resistor using a virtual circuit.
The current density gives further evidence for the influence of higher order modal
shapes due to its irregular nature. Figure 21 shows the current density of the piezoelectric
material in the 1.5 μm bimetal thickness simulation.
Figure 21. 1.5 μm thick bimetal cantilever current density
The rapid changes in current density occur while the cantilever beam is making
large changes in displacement. Many peaks and troughs demonstrate the complex
movement of the cantilever beam as the internal stresses within the piezoelectric material
change quickly.
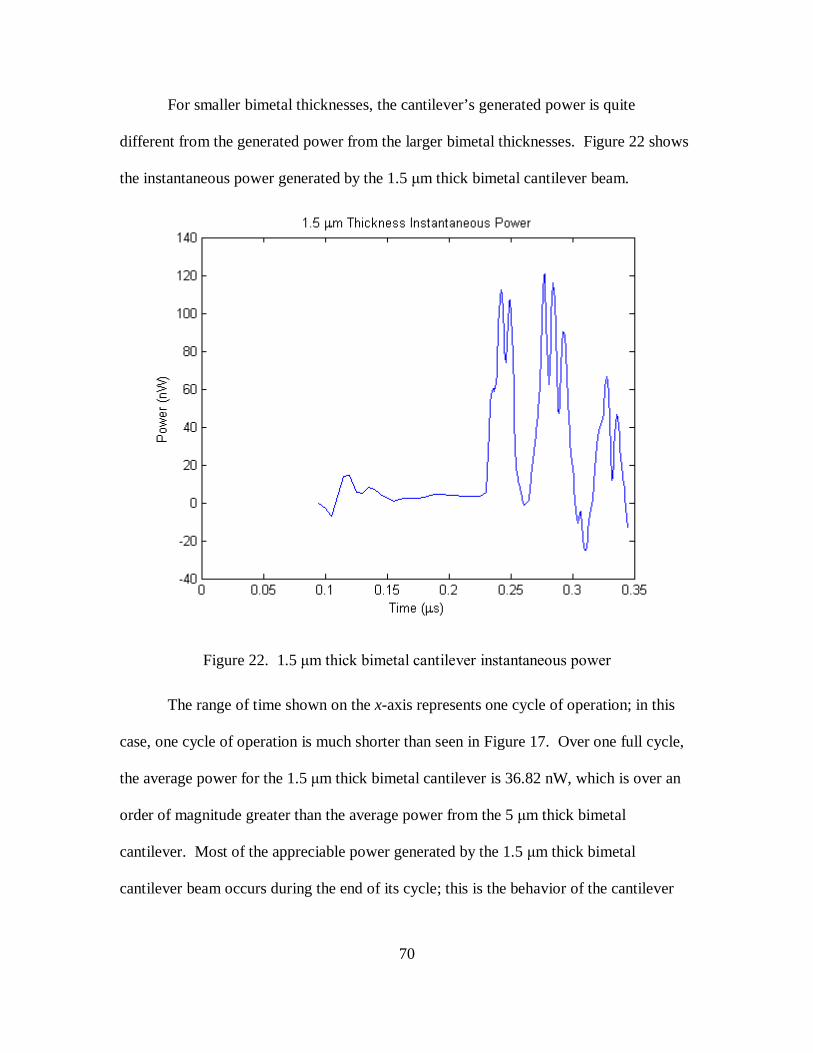
70
For smaller bimetal thicknesses, the cantilever’s generated power is quite
different from the generated power from the larger bimetal thicknesses. Figure 22 shows
the instantaneous power generated by the 1.5 μm thick bimetal cantilever beam.
Figure 22. 1.5 μm thick bimetal cantilever instantaneous power
The range of time shown on the x-axis represents one cycle of operation; in this
case, one cycle of operation is much shorter than seen in Figure 17. Over one full cycle,
the average power for the 1.5 μm thick bimetal cantilever is 36.82 nW, which is over an
order of magnitude greater than the average power from the 5 μm thick bimetal
cantilever. Most of the appreciable power generated by the 1.5 μm thick bimetal
cantilever beam occurs during the end of its cycle; this is the behavior of the cantilever

71
beam at smaller bimetal thicknesses. The length of one cycle has been shortened to an
interval where a greater percentage on the cycle is spent generating appreciable power by
the cantilever beam. This issue has been addressed through the down-scaling of the
bimetal thickness.
Aggregate Results
Overall, the increase in output power from down-scaling the bimetal thickness is
valid only until the point when the significance of higher order modal shapes interferes
with appreciable power generation. For the design studied in this research, this occurs at
around 1 μm thick for the bimetal. The three figures in this sub-section display the
results for all simulations conducted in this research.
Figure 23 shows the peak voltage magnitude versus the bimetal thickness.
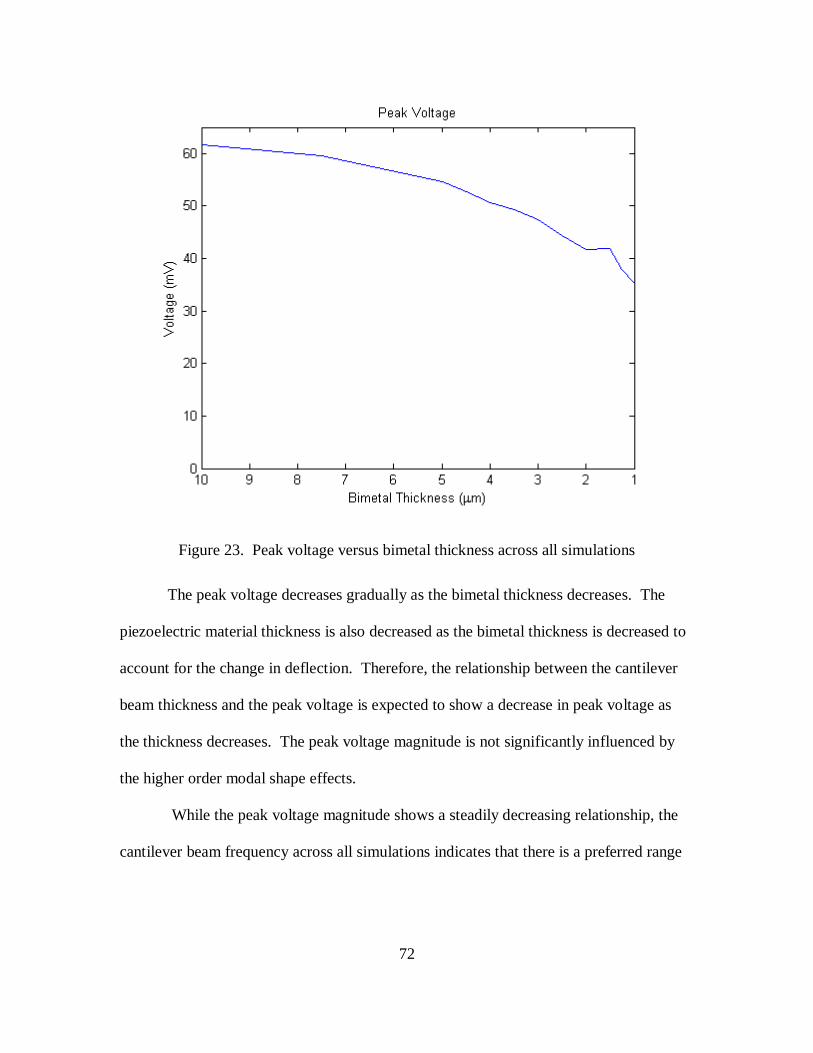
72
Figure 23. Peak voltage versus bimetal thickness across all simulations
The peak voltage decreases gradually as the bimetal thickness decreases. The
piezoelectric material thickness is also decreased as the bimetal thickness is decreased to
account for the change in deflection. Therefore, the relationship between the cantilever
beam thickness and the peak voltage is expected to show a decrease in peak voltage as
the thickness decreases. The peak voltage magnitude is not significantly influenced by
the higher order modal shape effects.
While the peak voltage magnitude shows a steadily decreasing relationship, the
cantilever beam frequency across all simulations indicates that there is a preferred range
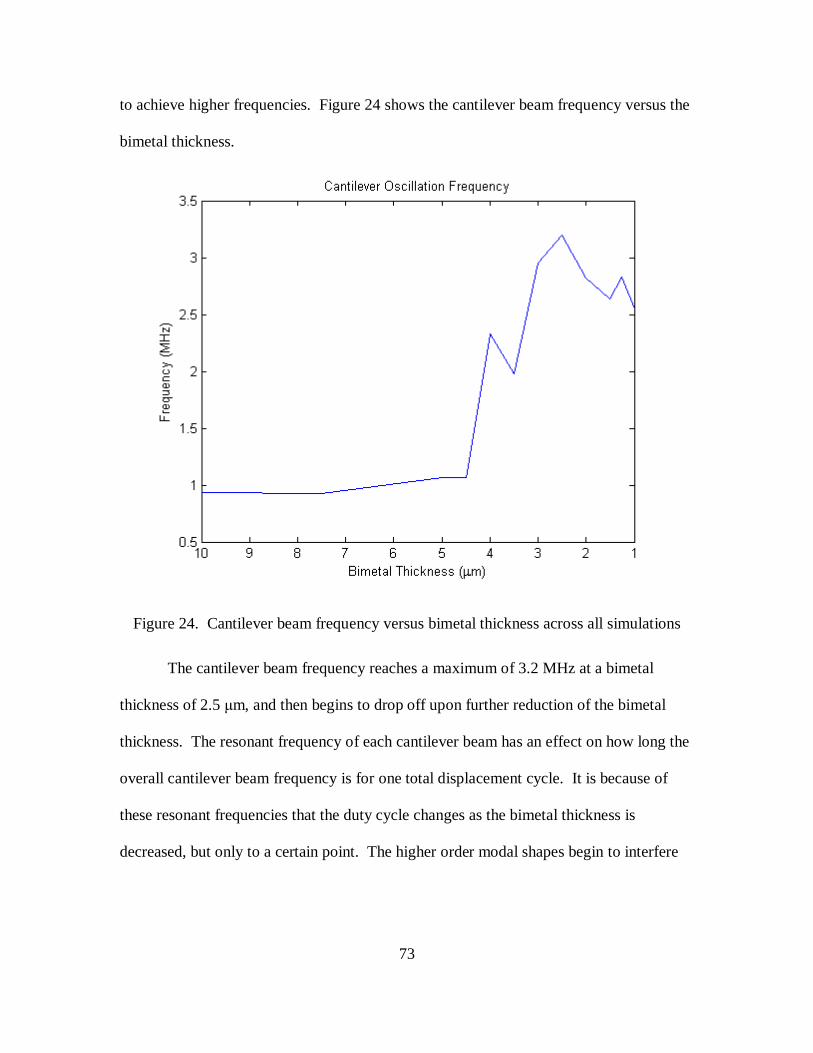
73
to achieve higher frequencies. Figure 24 shows the cantilever beam frequency versus the
bimetal thickness.
Figure 24. Cantilever beam frequency versus bimetal thickness across all simulations
The cantilever beam frequency reaches a maximum of 3.2 MHz at a bimetal
thickness of 2.5 μm, and then begins to drop off upon further reduction of the bimetal
thickness. The resonant frequency of each cantilever beam has an effect on how long the
overall cantilever beam frequency is for one total displacement cycle. It is because of
these resonant frequencies that the duty cycle changes as the bimetal thickness is
decreased, but only to a certain point. The higher order modal shapes begin to interfere
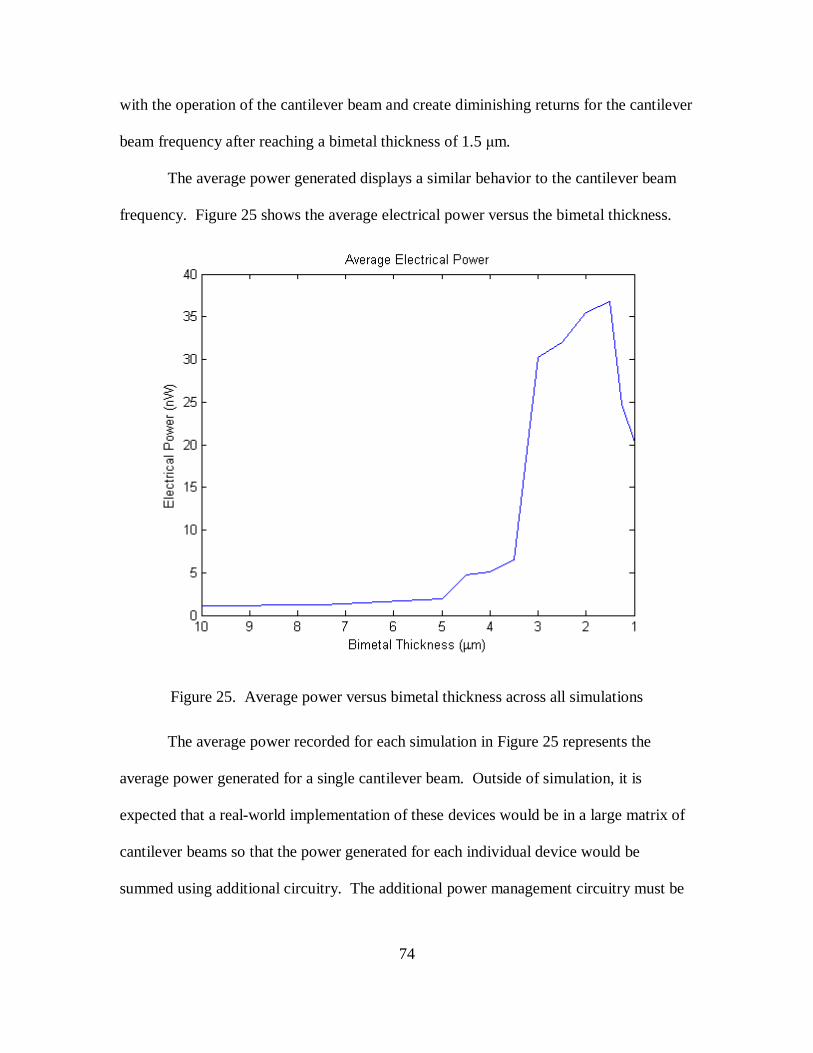
74
with the operation of the cantilever beam and create diminishing returns for the cantilever
beam frequency after reaching a bimetal thickness of 1.5 μm.
The average power generated displays a similar behavior to the cantilever beam
frequency. Figure 25 shows the average electrical power versus the bimetal thickness.
Figure 25. Average power versus bimetal thickness across all simulations
The average power recorded for each simulation in Figure 25 represents the
average power generated for a single cantilever beam. Outside of simulation, it is
expected that a real-world implementation of these devices would be in a large matrix of
cantilever beams so that the power generated for each individual device would be
summed using additional circuitry. The additional power management circuitry must be

75
designed to support non-synchronous devices in both series and parallel configurations.
The initial response of the average power to the decreasing of the bimetal thickness is a
significant increase in output power. But after reaching a bimetal thickness of 1.5 μm,
the average power decreases sharply. Again, the higher order modal shapes prevent the
continued increase of the average power as the bimetal thickness is decreased. At a
bimetal thickness of 1.5 μm, the cantilever beam generates a maximum average power of
36.82 nW. From the perspective of a top-view, the cantilever dimensions in this design
are 20 μm × 10 μm per device. A conservative estimate for device spacing in a matrix
that allows for external circuitry would be 36 μm × 18 μm per device. By taking the
maximum average power and dividing it by the conservative estimate for device spacing,
the result is the average power density. This calculation yields an average power density
of 5.68 mW/cm2. This power density is two orders of magnitude higher than Seebeck
devices recorded in the literature review, and it is comparable with the power densities
that Puscasu reports in his research.
Summary
The campaign of experiments described in the test matrix from the chapter on
methodology has been executed and yielded a sufficient data set from which to draw
conclusions and recommend a superior dual-stage MEMS cantilever energy harvester that
operates under the conditions of the human environment. The next chapter discusses the
findings that emerge from this body of research and suggests avenues for future work.
76
V. Conclusions and Recommendations
Chapter Overview
This chapter states the findings that emerge from analyzing the results of this
thesis research effort. Twelve different simulation experiments have been performed on a
dual-stage MEMS cantilever energy harvester with the objectives of increasing the power
density and improving the design. The following discussion relates the results of the
campaign of experiments back to the original problem statement formed in the
Introduction chapter of this document.
Design Configuration
The design configuration chosen in this research stems from the influence of
non-Seebeck thermal harvesting devices found in the literature and the influence of
piezoelectric vibration harvesting devices found in the literature [5]. The impact-based
design is changed for the purpose of achieving a non-impact-based design with a higher
power density than the impact-based design [28].
Thermal conduction occurs only when the bimetal is in contact with the hot side;
the cold side of the device is entirely dependent on convection cooling from the ambient
air. In the original design from the literature, the zero stress reference deposition
temperature must be at the median of the total temperature differential; in the design used
in this research, the zero stress reference deposition temperature must be at the
temperature of the cold side.
77
Control Variables
The bimetal thickness scaling serves as the primary control variable in this
research. The concept behind device scaling is drawn from the literature, which
analytically shows that bimetal performance in a non-Seebeck energy harvesting system
increases when the size of the device is decreased [2]. Although this research presents a
modified design of the non-Seebeck design found in the literature, a similar phenomenon
is found when scaling the bimetal thickness to a certain point. The conducted simulations
demonstrate an increase in output power for the dual-stage MEMS cantilever energy
harvester as the bimetal thickness is reduced until the thickness reaches about 1 μm. The
characteristics of the device operation are discussed in this section.
At the two extremes of the spectrum of bimetal thicknesses tested, the electrical
output decreases due to factors that negatively impact the device performance. At a
bimetal thickness of 10 μm, the dual-stage MEMS cantilever energy harvester
experiences decreased performance due to slow heating times. The bimetal layer
thickness is such that the permeating heat from the contact area while the cantilever beam
is latched takes extra time to affect the active layer of the bimetal. The latching time for
the 10 μm bimetal thickness is 0.15 μs, which is the longest required latching time for the
simulations conducted in this research. Slow heating time for the active layer decreases
the frequency and therefore negatively impacts the device performance. One problem
that occurs for smaller bimetal thicknesses is the influence of higher order modal shapes
on the displacement response. Thinner cantilever beams are more susceptible to the
effects of higher order modal shapes because the beam is more flexible. Higher order
modal shapes reduce the voltage generated by the piezoelectric material due to the
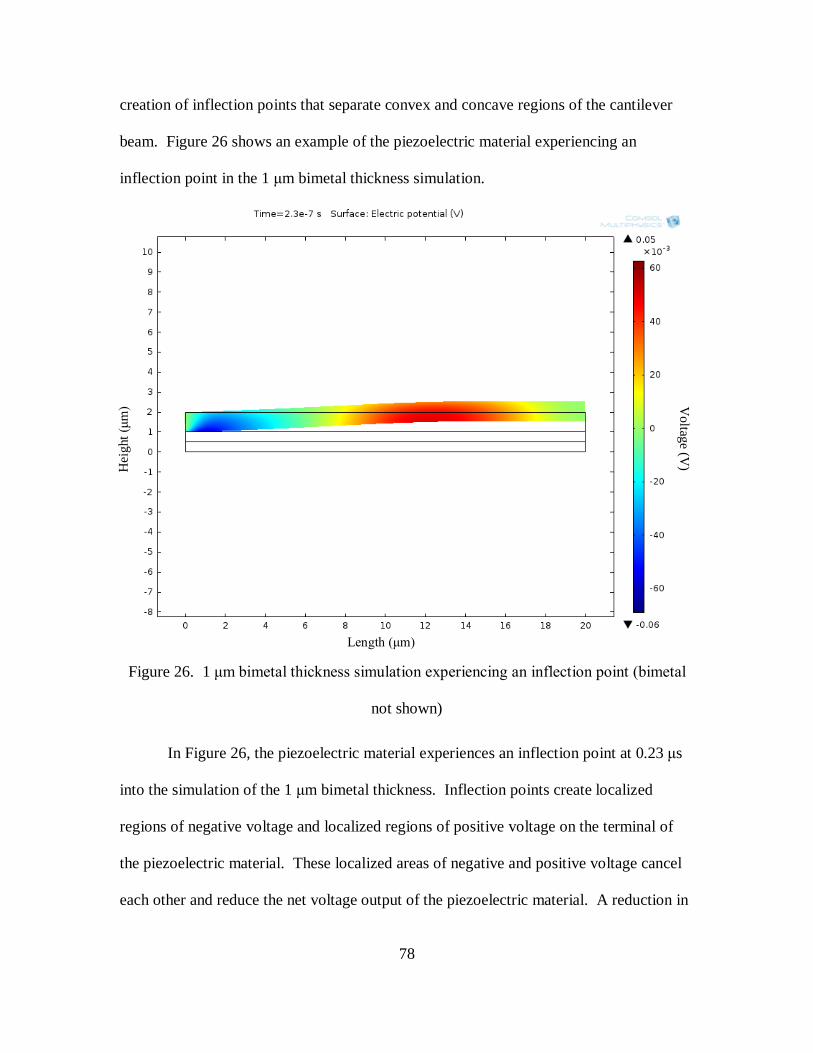
78
creation of inflection points that separate convex and concave regions of the cantilever
beam. Figure 26 shows an example of the piezoelectric material experiencing an
inflection point in the 1 μm bimetal thickness simulation.
Figure 26. 1 μm bimetal thickness simulation experiencing an inflection point (bimetal
not shown)
In Figure 26, the piezoelectric material experiences an inflection point at 0.23 μs
into the simulation of the 1 μm bimetal thickness. Inflection points create localized
regions of negative voltage and localized regions of positive voltage on the terminal of
the piezoelectric material. These localized areas of negative and positive voltage cancel
each other and reduce the net voltage output of the piezoelectric material. A reduction in
Hei
ght (
μm)
Length (μm)
Voltage (V
)
79
the voltage output of the piezoelectric material diminishes the overall electrical power
output of the dual-stage MEMS cantilever energy harvester. Therefore, bimetals
employed in the dual-stage MEMS cantilever energy harvester system suffer reductions
in performance at thicknesses approaching 10 μm due to slow heating times and at
thicknesses approaching 1 μm due to higher order modal shapes.
Latching time and PZT-5H thickness are controllable nuisance variables, in that
they both depend on the bimetal thickness. In order to achieve the highest electrical
output from the dual-stage MEMS cantilever energy harvester, the latching time must be
individually tuned for each thickness to elicit the greatest electrical output. The primary
goal of the latching time tuning process is to heat the cantilever beam long enough to
create the largest peak voltage after the beam is released from contact. The secondary
goal of the latching time tuning process is to create the shortest displacement cycle. For
each thickness, the resonant frequency of the cantilever beam changes; this means that
the overlaid underdamped response displays a different frequency and amplitude
dependent on the thickness. The choice of latching time has a small effect on the
displacement cycle of the dual-stage MEMS cantilever energy harvester. This
interdependence complicates the process of choosing a latching time because in certain
cases, a small sacrifice in voltage by lengthening or shortening the latching time results in
a large change in the displacement cycle. Because the displacement cycle is directly
linked to the operating frequency, the small change in latching time can ultimately result
in an improved electrical power output. This behavior is dependent on the overlaid
underdamped displacement response, which changes with each bimetal thickness and
becomes very irregular due to higher order modal shape influences as the bimetal
80
thickness approaches 1 μm. The recommendation for finding the optimal latching time is
to fabricate and test different latching voltages and characterize the electrical output
power of the real system versus latching voltage.
Significance of Research
The end-goal of this line of research is to enable a wearable thermal energy
harvesting device that functions as a mobile power supply able to power small
electronics. A device with this capability would benefit the warfighter who is deployed
into a remote area without access to the power grid. Instead of being forced to carry
heavy batteries, the warfighter could carry a thermal energy harvesting device to power
his or her electronics. This thesis research effort contributes toward this goal by adapting
designs found in the literature and exploring alternate configurations in the simulation
environment to recommend a design that functions under the constraints of human body
heat and ambient air. This research applies the analytical findings from the literature and
tests them in the simulation environment. All experiments in this research effort were
conducted in simulation with the underlying objective being that a superior design that
fits the presented conditions would be recommended.
Recommendations for Future Research
The concerns for future research from the perspective of this thesis are split into
two categories. There exists future simulation research for the alternate configurations
presented in this research. There are many different future research options involving the
fabrication and testing of prototype dual-stage MEMS cantilever energy harvester devices
that fit the constraints of the human body’s environment.
81
For future simulation research, the temperature differential has a unique effect on
the operation of the dual-stage MEMS cantilever energy harvester. In this research
effort, the temperature differential was held constant at 10 °C between 33 °C and 23 °C.
Future research could address the external conditions of extreme hot/cold weather and
suggest an optimal temperature range of operation for the device. Additionally, the use
of different materials and the alteration of other geometric parameters would prove
valuable for further design optimization.
For future fabrication and testing research, the recommendations presented in this
body of research need to be fabricated and tested for feasibility. A reliable fabrication
process for creating a large matrix of dual-stage MEMS cantilever energy harvesters in a
small area needs to be developed. Power management circuitry that supports large
matrices of non-synchronous device operation while accounting for possible parasitic
capacitances is an important direction for future research. Likewise, human subject
testing for device performance must also take place to determine the power
characteristics of the dual-stage MEMS cantilever energy harvester under the real-world
conditions of the human body. Using the conclusions gathered from simulation, the
conclusions gathered from fabrication, the conclusions gathered from power management
circuitry development, and the conclusions gathered from human subject testing, a final
design can be reached and ultimately implemented.
Additional challenges exist for using the power generated by the dual-stage
MEMS cantilever energy harvester because voltage peaks less than 100 mV in magnitude
are too low for traditional voltage rectification methods [1]. Fortunately, most of the time
the voltage signals recorded in the simulations for this research stayed negative and did
82
not go above zero. Boost converters or bootstrapping methods may be options for
achieving higher voltages. One of the power conditioning circuits suggested by Chao
might be a good choice to efficiently convert the energy from the dual-stage MEMS
cantilever energy harvester [30]. Additionally, a mechanical diode-less voltage multiplier
is a viable option [31]. Power conditioning is an important part of the future research
required in this area because the full realization of the total power available in a large
matrix of dual-stage MEMS cantilever energy harvesters cannot be reaped if an efficient
method for aggregating the individual power from each device is not implemented.
Summary
Small-scale thermal energy harvesting has been a steadily growing field of
research for decades, and there are a nearly endless number of ways that these systems
can be integrated into modern life. Using a dual-stage MEMS cantilever energy harvester
for the harvesting of human body heat is a unique niche that requires continued research
for the purpose of creating a complete functional system in the future.
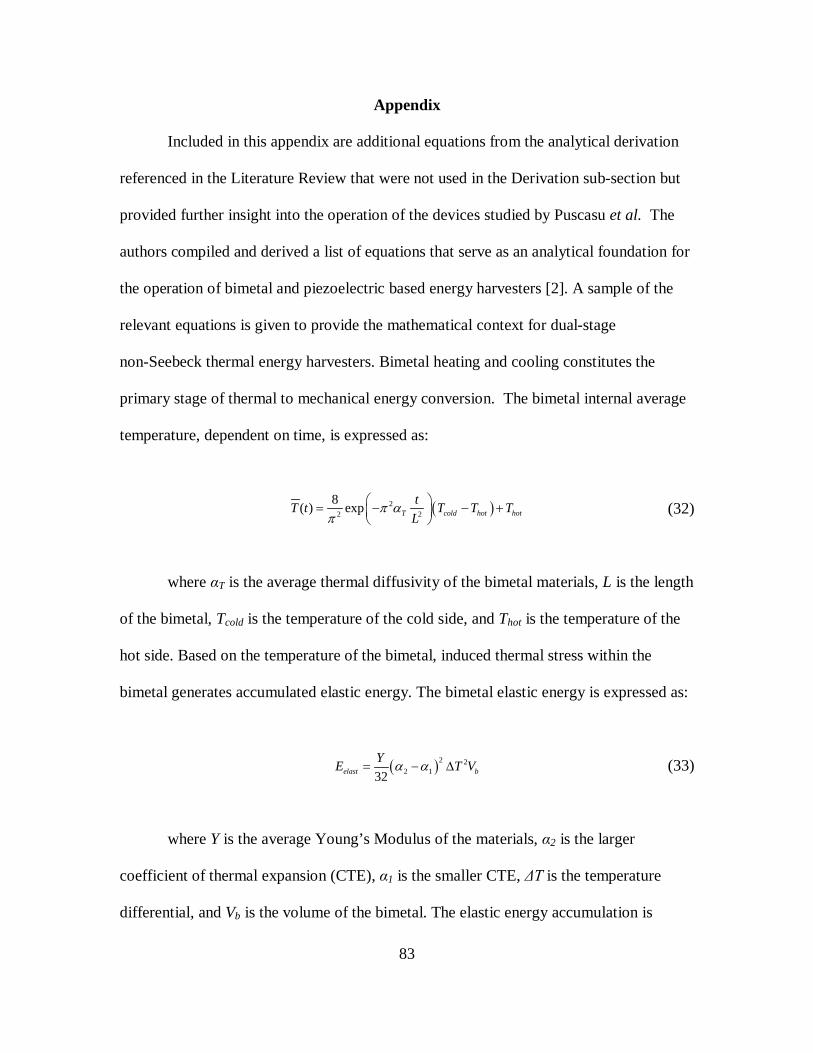
83
Appendix
Included in this appendix are additional equations from the analytical derivation
referenced in the Literature Review that were not used in the Derivation sub-section but
provided further insight into the operation of the devices studied by Puscasu et al. The
authors compiled and derived a list of equations that serve as an analytical foundation for
the operation of bimetal and piezoelectric based energy harvesters [2]. A sample of the
relevant equations is given to provide the mathematical context for dual-stage
non-Seebeck thermal energy harvesters. Bimetal heating and cooling constitutes the
primary stage of thermal to mechanical energy conversion. The bimetal internal average
temperature, dependent on time, is expressed as:
(32)
where αT is the average thermal diffusivity of the bimetal materials, L is the length
of the bimetal, Tcold is the temperature of the cold side, and Thot is the temperature of the
hot side. Based on the temperature of the bimetal, induced thermal stress within the
bimetal generates accumulated elastic energy. The bimetal elastic energy is expressed as:
(33)
where Y is the average Young’s Modulus of the materials, α2 is the larger
coefficient of thermal expansion (CTE), α1 is the smaller CTE, ΔT is the temperature
differential, and Vb is the volume of the bimetal. The elastic energy accumulation is
( )22 2
8( ) exp T cold hot hottT t T T TL
π απ
= − − +
( )2 22 132elast b
YE T Vα α= − ∆
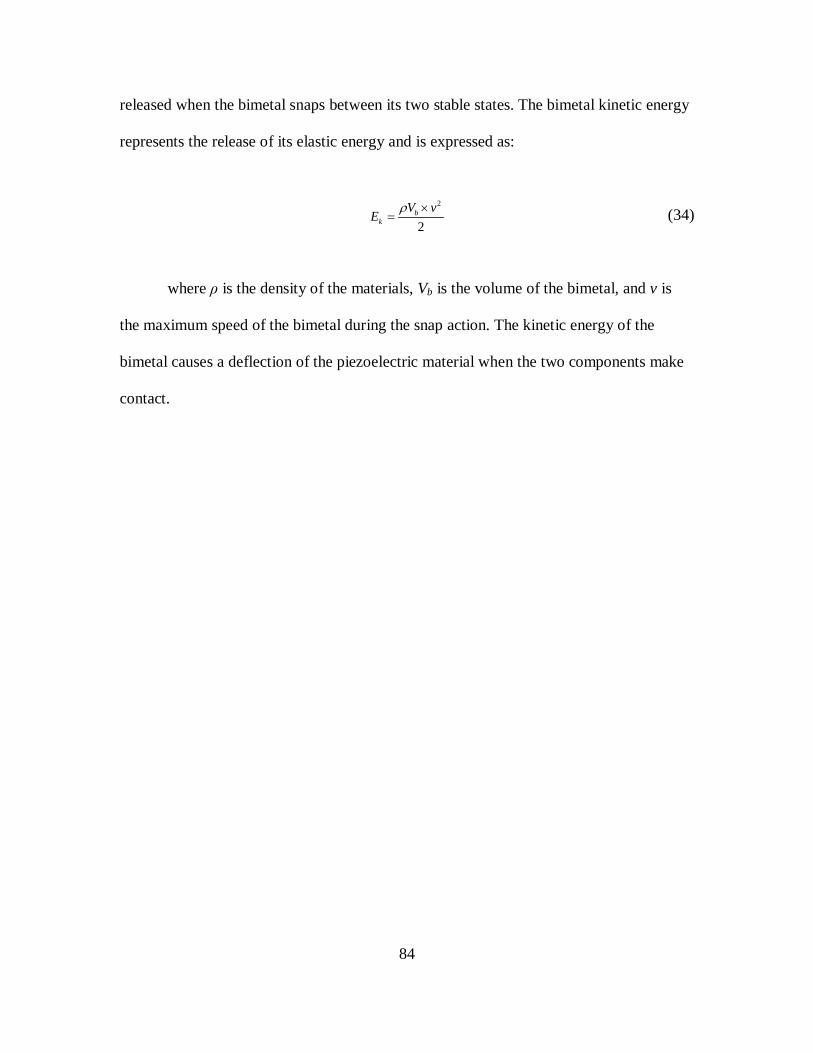
84
released when the bimetal snaps between its two stable states. The bimetal kinetic energy
represents the release of its elastic energy and is expressed as:
(34)
where ρ is the density of the materials, Vb is the volume of the bimetal, and v is
the maximum speed of the bimetal during the snap action. The kinetic energy of the
bimetal causes a deflection of the piezoelectric material when the two components make
contact.
2
2b
kV v
Eρ ×
=

85
Bibliography
[1] N. S. Hudak, "Small-scale energy harvesting through thermoelectric, vibration, and radiofrequency power conversion," J. Appl. Physics, vol. 103, no. 10, p. 101301, 2008.
[2] O. Puscasu, "Scale laws for enhanced power for MEMS based heat energy harvesting," IEEE Silicon Nanoelectronics Workshhop (SNW), pp. 1-2, 2012.
[3] O. Puscasu, "An innovative heat harvesting technology (HEATec) for above-Seebeck performance," IEEE Electron Devices Meeting (IEDM), pp. 12.5.1-12.5.4, 2012.
[4] O. Puscasu, "A disruptive technology for thermal to electrical energy conversion," Microelectronics J., vol. 45, pp. 554-558, 2014.
[5] O. Puscasu, "Flexible bimetal and piezoelectric based thermal to electrical energy converters," Sensors and Actuators A: Physical, vol. 214, pp. 7-14, 2014.
[6] E. Sardini, "Passive and Self-Powered Autonomous Sensors for Remote Measurements," IEEE Sensors J., vol. 9, pp. 943-960, 2009.
[7] V. G. Krishnan, "Design and scaling of microscale Tesla turbines," J. Micromech. and Microeng., vol. 23, p. 125001, 2013.
[8] S. J. Elliott, "Scaling of electromagnetic transducers for shunt damping and energy harvesting," J. Sound and Vibration (JSV), vol. 333, pp. 2185-2195, 2014.
[9] X. Xie, "A ring piezoelectric energy harvester excited by magnetic forces," Int. J. Eng. Sci., vol. 77, pp. 71-78, 2014.
[10] J. Lin, "Surface Micromachined MEMS Capacitors With Dual Cavity for Energy Harvesting," J. Microelectromech. Syst., vol. 22, pp. 1458-1469, 2013.
[11] M. Bao, "Squeeze film air damping in MEMS," Sensors and Actuators A: Physical, vol. 136, pp. 3-27, 2007.
86
[12] Y. Arakawa, "Micro Seismic Power Generator Using Electret Polymer Film," Fourth International Workshop on Micro and Nanotechnology for Power Generation and Energy Conversion Applications, pp. 187-190, 2004.
[13] N. S. Shenck, "Energy Scavenging with Shoe-Mounted Piezoelectrics," IEEE Micro, vol. 21, no. 3, pp. 30-42, 2001.
[14] R. Caliò, "Piezoelectric Energy Harvesting Solutions," Sensors J., vol. 14, no. 3, pp. 4755-4790, 2014.
[15] E. Varadrajan, "Design and Simulation of Unimorph Piezoelectric Energy Harvesting System," 2013 COMSOL Conference Proceedings, pp. 1-6, 2013.
[16] S. Boisseau, "Cantilever-based electret energy harvesters," Smart Materials and Structures, vol. 20, no. 10, pp. 1-11, 2011.
[17] H. Böttner, "Thermoelectric Micro Devices: Current State, Recent Developments and Future Aspects for Technological Progress and Applications," Twenty-First International Conference on Thermoelectrics, pp. 511-518, 2002.
[18] H. Böttner, "New Thermoelectric Components Using Microsystem Technologies," J. Microelectromech. Syst., vol. 13, no. 3, pp. 414-420, 2004.
[19] H. Glosch, "A thermoelectric converter for energy supply," Sensors and Actuators A: Physical, vol. 74, no. 1-3, pp. 246-250, 1999.
[20] R. Venkatasubramanian, "Thin-film thermoelectric devices with high room-temperature figures of merit," Nature, vol. 413, no. 6856, pp. 597-602, 2001.
[21] S. Dalola, "Autonomous Sensor System with RF Link and Thermoelectric Generator for Power Harvesting," IEEE International Instrumentation and Measurement Technology Conference, pp. 1376-1380, 2008.
[22] S. Boisseau, "Semi-flexible bimetal-based thermal energy harvesters," Smart Materials and Structures, vol. 22, no. 2, pp. 1-8, 2013.
[23] V. Leonov, "Thermoelectric Energy Harvesting of Human Body Heat for Wearable Sensors," IEEE Sensors J., vol. 13, pp. 2284-2291, 2013.
87
[24] S. Monfray, "Innovative thermal energy harvesting for zero power electronics," IEEE Silicon Nanoelectronics Workshop (SNW), pp. 1-4, 2012.
[25] S. Boisseau, "Bimetal-and-electret-based thermal energy harvesters - Application to a battery-free Wireless Sensor Node," Instrumentation and Detectors, pp. 1-12, 2013.
[26] A. Arrnaud, "Piezoelectric and electrostatic bimetal-based thermal energy harvesters," J. Phys. Conf. Ser., vol. 476, no. 1, pp. 1-5, 2013.
[27] K. B. Lee, Principles of Microelectromechanical Systems, Hoboken, NJ: John Wiley & Sons, Inc., 2011.
[28] C.-N. Xu, "Electrical Power Generation Characteristics of PZT Piezoelectric Ceramics," IEEE Transactions on Ultrasonics, Ferroelectrics, and Frequency Control, vol. 45, no. 4, pp. 1065-1070, 1998.
[29] D. Berlincourt, "Properties of Morgan Electro Ceramic Ceramics," Technical Publication TP-226, pp. 1-12, 2002.
[30] P. C.-P. Chao, "Energy Harvesting Electronics for Vibratory Devices in Self-Powered Sensors," IEEE Sensors J., vol. 11, pp. 3106-3121, 2011.
[31] F. Giusa, "A diode-less mechanical voltage multiplier: A novel transducer for vibration energy harvesting," Sensors and Actuators A: Physical, vol. 212, pp. 34-41, 2014.
88
Vita
Education
B.S., Electrical & Computer Engineering, 2013, Norwich University, Northfield, VT
M.S., Electrical Engineering, Expected, Air Force Institute of Technology, WPAFB, OH
Association Memberships
IEEE, Tau Beta Pi, Eta Kappa Nu
Publications & Papers
“Energy Harvesting & Recapture from Human Subjects: Dual-Stage Thermal MEMS
Energy Converter,” RSAMD 2014 Conference Proceedings, (Pending)
“Microelectronics Thermal Management using Microelectromechanical Systems
(MEMS) Bimorph Cantilever Beams (MBCB),” Sensors & Actuators: A Physical,
(Pending)
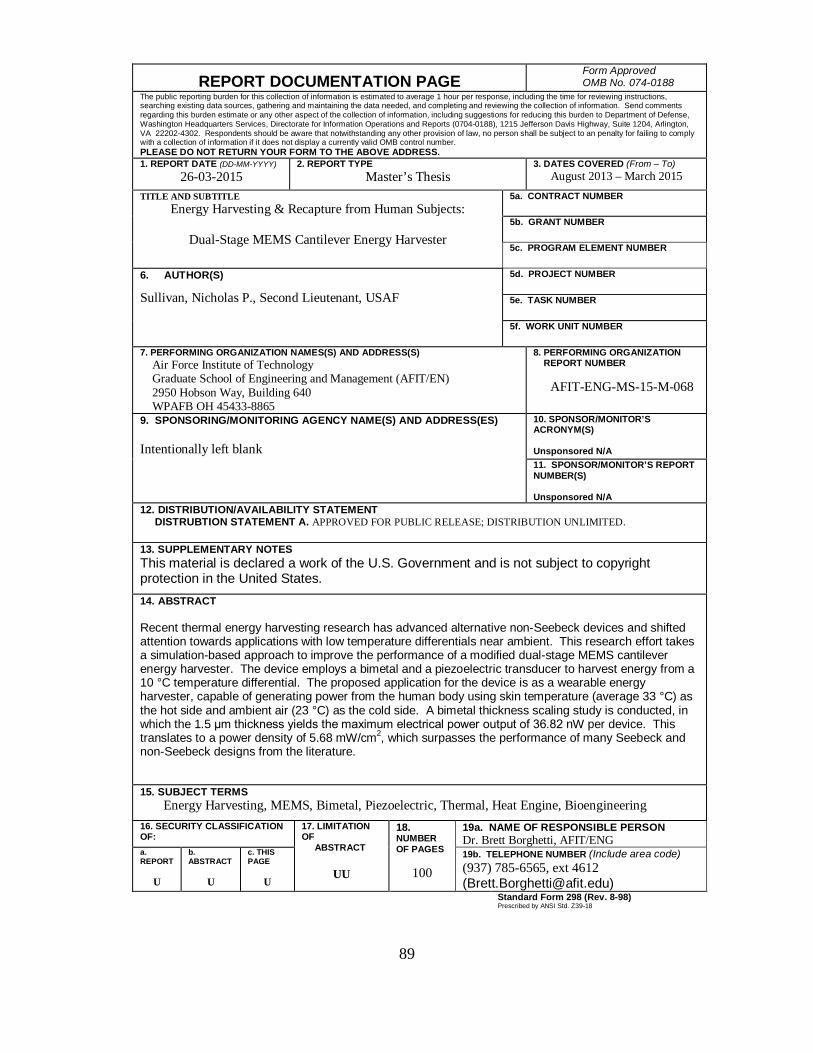
89
REPORT DOCUMENTATION PAGE Form Approved OMB No. 074-0188
The public reporting burden for this collection of information is estimated to average 1 hour per response, including the time for reviewing instructions, searching existing data sources, gathering and maintaining the data needed, and completing and reviewing the collection of information. Send comments regarding this burden estimate or any other aspect of the collection of information, including suggestions for reducing this burden to Department of Defense, Washington Headquarters Services, Directorate for Information Operations and Reports (0704-0188), 1215 Jefferson Davis Highway, Suite 1204, Arlington, VA 22202-4302. Respondents should be aware that notwithstanding any other provision of law, no person shall be subject to an penalty for failing to comply with a collection of information if it does not display a currently valid OMB control number. PLEASE DO NOT RETURN YOUR FORM TO THE ABOVE ADDRESS. 1. REPORT DATE (DD-MM-YYYY)
26-03-2015 2. REPORT TYPE
Master’s Thesis 3. DATES COVERED (From – To)
August 2013 – March 2015
TITLE AND SUBTITLE Energy Harvesting & Recapture from Human Subjects:
Dual-Stage MEMS Cantilever Energy Harvester
5a. CONTRACT NUMBER
5b. GRANT NUMBER 5c. PROGRAM ELEMENT NUMBER
6. AUTHOR(S)
Sullivan, Nicholas P., Second Lieutenant, USAF
5d. PROJECT NUMBER
5e. TASK NUMBER
5f. WORK UNIT NUMBER
7. PERFORMING ORGANIZATION NAMES(S) AND ADDRESS(S) Air Force Institute of Technology Graduate School of Engineering and Management (AFIT/EN) 2950 Hobson Way, Building 640 WPAFB OH 45433-8865
8. PERFORMING ORGANIZATION REPORT NUMBER AFIT-ENG-MS-15-M-068
9. SPONSORING/MONITORING AGENCY NAME(S) AND ADDRESS(ES) Intentionally left blank
10. SPONSOR/MONITOR’S ACRONYM(S) Unsponsored N/A 11. SPONSOR/MONITOR’S REPORT NUMBER(S) Unsponsored N/A
12. DISTRIBUTION/AVAILABILITY STATEMENT DISTRUBTION STATEMENT A. APPROVED FOR PUBLIC RELEASE; DISTRIBUTION UNLIMITED.
13. SUPPLEMENTARY NOTES This material is declared a work of the U.S. Government and is not subject to copyright protection in the United States. 14. ABSTRACT Recent thermal energy harvesting research has advanced alternative non-Seebeck devices and shifted attention towards applications with low temperature differentials near ambient. This research effort takes a simulation-based approach to improve the performance of a modified dual-stage MEMS cantilever energy harvester. The device employs a bimetal and a piezoelectric transducer to harvest energy from a 10 °C temperature differential. The proposed application for the device is as a wearable energy harvester, capable of generating power from the human body using skin temperature (average 33 °C) as the hot side and ambient air (23 °C) as the cold side. A bimetal thickness scaling study is conducted, in which the 1.5 μm thickness yields the maximum electrical power output of 36.82 nW per device. This translates to a power density of 5.68 mW/cm2, which surpasses the performance of many Seebeck and non-Seebeck designs from the literature. 15. SUBJECT TERMS Energy Harvesting, MEMS, Bimetal, Piezoelectric, Thermal, Heat Engine, Bioengineering 16. SECURITY CLASSIFICATION OF:
17. LIMITATION OF ABSTRACT
UU
18. NUMBER OF PAGES
100
19a. NAME OF RESPONSIBLE PERSON Dr. Brett Borghetti, AFIT/ENG
a. REPORT
U
b. ABSTRACT
U
c. THIS PAGE
U
19b. TELEPHONE NUMBER (Include area code) (937) 785-6565, ext 4612 ([email protected])
Standard Form 298 (Rev. 8-98) Prescribed by ANSI Std. Z39-18