Embed Size (px)
Citation preview

Energy Efficiency Management –
TATA POWER Trombay Unit-7 18th National Energy Efficient Management Award 2017
30th Aug – 1st Sept 2017, CII- Hyderabad
1

"Cheap and abundant electric power is
one of the basic ingredients for the
economic progress of a city, a state or a
country"
Mr. Jamsetji Nusserwanji Tata ( 3rd March 1839 - 19th May 1904 )
Vision of our founder – Mr. Jamsetji Tata
2
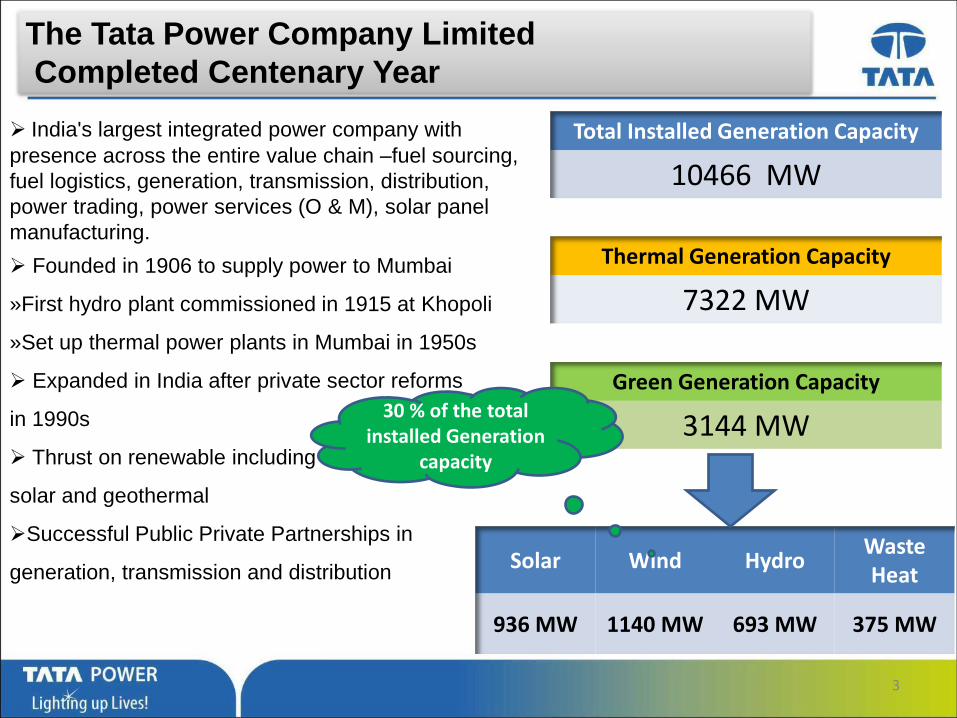
India's largest integrated power company with
presence across the entire value chain –fuel sourcing,
fuel logistics, generation, transmission, distribution,
power trading, power services (O & M), solar panel
manufacturing.
Founded in 1906 to supply power to Mumbai
»First hydro plant commissioned in 1915 at Khopoli
»Set up thermal power plants in Mumbai in 1950s
Expanded in India after private sector reforms
in 1990s
Thrust on renewable including hydro, wind,
solar and geothermal
Successful Public Private Partnerships in
generation, transmission and distribution
The Tata Power Company Limited
Completed Centenary Year
Solar Wind Hydro Waste Heat
936 MW 1140 MW 693 MW 375 MW
3
Total Installed Generation Capacity
10466 MW a
Thermal Generation Capacity
7322 MW
Green Generation Capacity
3144 MW 30 % of the total
installed Generation capacity
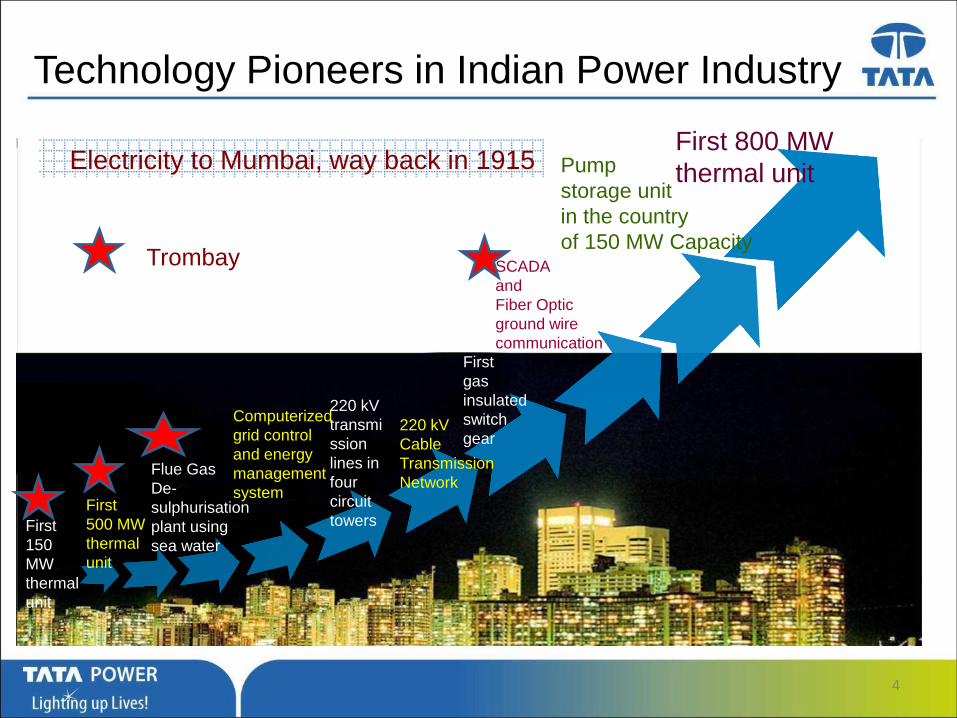
Technology Pioneers in Indian Power Industry
First
150
MW
thermal
unit
First
500 MW
thermal
unit
First
gas
insulated
switch
gear
Computerized
grid control
and energy
management
system
220 kV
transmi
ssion
lines in
four
circuit
towers
220 kV
Cable
Transmission
Network Flue Gas
De-
sulphurisation
plant using
sea water
SCADA
and
Fiber Optic
ground wire
communication
Pump
storage unit
in the country
of 150 MW Capacity
First 800 MW
thermal unit Electricity to Mumbai, way back in 1915
Trombay
4

Trombay Thermal Power Station
Trombay Operations
&
Specific Energy Consumption
5

Trombay: Present Generation Capacity
Established in 1956
Total Generation Capacity : 1430 MW
Unit Year Capacity
(MW) Fuel Used
Unit 5 1984 500 Coal, Oil & Gas
Unit 6 1990 500 Oil & Gas
Unit 7
(CCPP) 1993-94
120+60 =
180 Gas
Unit 8 2009 250 Coal, Oil
6

Technology Adopters in Energy Management
Key Energy
Management Initiatives
At Trombay
7

Specific Energy Consumption for last Four Years
8
1998
1968
2136
1996
2052
2019
2194
2056
94% 94% 80% 91%
40%
50%
60%
70%
80%
90%
100%
1800
1900
2000
2100
2200
2300
2400
2013-2014 2014-2015 2015-2016 2016-2017
GH
R &
NH
R K
cal/
kwh
Unit Gross Heat Rate Unit Net Heat Rate Loading Factor
Load
ing
Fact
or
% Open Cycle
operation 1023 Hrs.

Benchmarking
9

Benchmarking Parameters ( 180 MW UNIT 7)
On Monthly Basis best achieved Heat Rate- 1922.3 Kcal/KWH- Jan 12
10
HEAT RATE UoM
Best Performance
NTPC (Faridabad) Tata Power Trombay
Unit 7
Actual Heat Rate Kcal/kwh 1915 1960
Deviation in Heat rate Kcal/kwh 45
Auxiliary Power
Consumption UoM
Best Performance
NTPC (Faridabad) Tata Power Trombay
Unit 7
Actual Auxiliary Consumption
% 2.3 2.3
Deviation in Auxiliary
Consumption % -

Energy Saving Projects
11

Energy Saving Projects : FY14 and FY 15
12
Energy Saving Projects Implemented
Annual Savings Rs Million
Investment. Rs Million
1.4 0.5
0.3 1.3
38.4 2.5
5.1 20
Total 45.2 24.3
Replacement of Fencing Lights with LED lights
Attending Flue gas leakages in HRSG
Replacement of OTC thermocouple
Coro coating of CW Pumps

Energy Saving Projects : FY16 and FY 17
13
Energy Saving Projects Implemented
Savings Rs Million
Investment. Rs Million
7.60 Nil
2.84 Nil
0.008 3.12
- Nil
Total 10.448 3.12
Achieving higher generation on Diffusion
mode at low gas supply pressure (Instead of
lower generation on Premix mode)
Modification in Gas Turbine SADC &
subsequently increasing the GT exhaust
temperature (OTC) set point
Installation of VFD for LP BFP (13 Days Saving)
Energy monitoring system of lighting and ACs

Energy Saving Projects Planned In Next Three Years
14
Energy Saving Projects Planned
Savings
Rs Million Investment. Rs Million
4.75 1.5
1.41 5.86
0.07 0.1
3.34 9.0
Total 9.57 16.46
Reduction of HRSG Exhaust Loss by
• Diverter Seal replacement
• HRSG Insulation repair
Installation of VFD for CEP
Installation of VFD for HMP
Overhauling of HPBFP ARC valve

Idea description : Heat rate Saving during low fuel gas supply pressure, by higher
Operating at higher Load on diffusion mode instead of reduced generation on Premix mode.
Before: Unit was operated on lower load during low gas supply Pressure.
After : Unit was operated on higher load during low gas supply Pressure on diffusion load.
Energy Saving Project :Achieving higher generation on Diffusion mode
at low gas supply pressure
KPI impact Low Operating Load & High Heat Rate
KPI impacted Savings (Rs. Million) Investment (Rs. Million) Payback
Gross Heat Rate 14.29* NIL NA
*- Saving Calculated for FY16 & FY17
15

Energy Saving Project :Achieving higher generation on
Diffusion mode at low gas supply pressure High Gen due to
Premix to
Diffusion
Changeover with
low gas Press
Premix mode of Operation
with low gas Press
Low Generation on
Premix Mode
16

Energy Saving Project :Achieving higher generation on
Diffusion mode at low gas supply pressure
UOM FY 16 FY 17
• Total Running Hrs on Diffusion Mode 70 116
• No of Days on Diffusion Mode 1681 2785
• Total Mkcal Saved 5575 9236
• Calorific Value of Gas for FY 16 13 13.17
• Total MT saved 425 702
• Rs/Mkcal for FY16 1201 822
• Total Saving in Rs Million 6.69 7.60
• FY16 Gross Gen 1180 1413
• Annual GHR Reduction 4.73 6.54
UoM MU MU MU % MT Mkcal/MT Mkcal Kcal/Kwh Kg/MWH MU DATE GTG Gen STG Gen TOTAL PLF GAS Cons CV Heat HR SGC APC
24-09-14 2.237 1.443 3.68 85.2% 561.9 13.098 7359.5 1999.9 152.68 0.09
26-09-14 2.480 1.517 3.997 92.5% 603.5 13.102 7907.9 1978.5 151.00 0.086
27-09-14 2.411 1.503 3.914 90.6% 591.8 13.101 7753.9 1981.1 151.21 0.085 1
Excess Gen Excess Heat ∆ HR Saved Mkcal SGC reduction
0.317 548.39 21.41 85.562 1.69
0.234 394.47 18.78 73.501 1.47
For 1 Day 20.29 79.594 1.60
17

KPI impacted Savings (Rs. Million) Investment (Rs. Million) Payback Period Months
Auxiliary Consumption 0.229 0.312 16
Idea description : Auxiliary Consumption Saving by Installing VFD for LP BFP.
Before: LPBFP was running with constant speed motor with Current 83.2 Amp (415 Volt)
After : LPBFP was running with VFD which drawing current 65 Amp (415 Volt)
Energy Saving Project : Installation of VFD for LP BFP
KPI impact Auxiliary Consumption
18
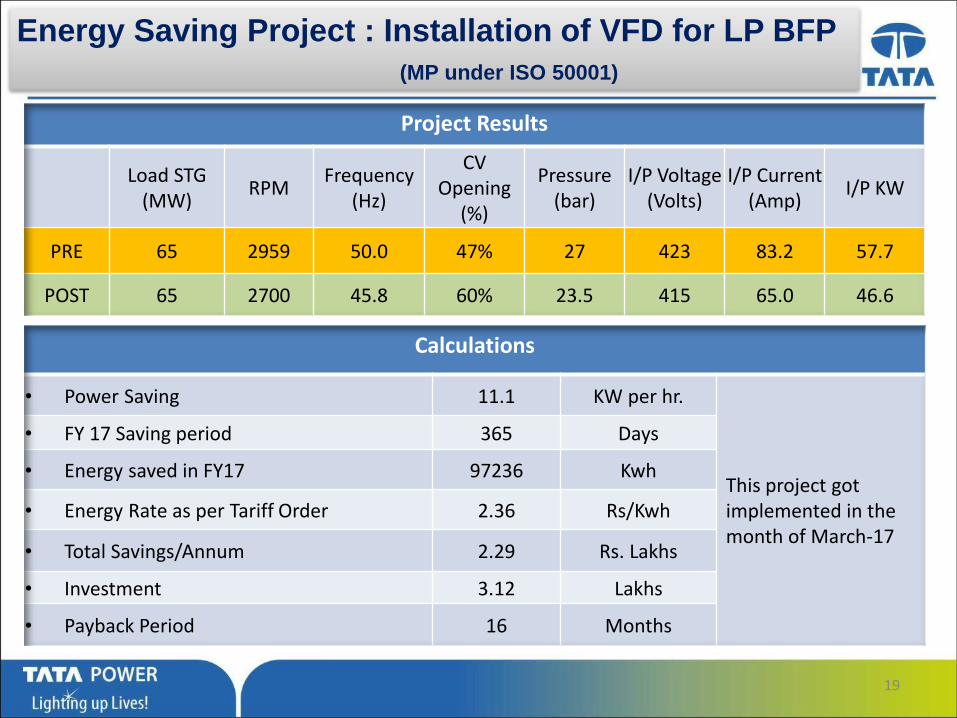
Energy Saving Project : Installation of VFD for LP BFP
(MP under ISO 50001)
19
Project Results
Load STG (MW)
RPM Frequency
(Hz)
CV Opening
(%)
Pressure (bar)
I/P Voltage (Volts)
I/P Current (Amp)
I/P KW
PRE 65 2959 50.0 47% 27 423 83.2 57.7
POST 65 2700 45.8 60% 23.5 415 65.0 46.6
Calculations
• Power Saving 11.1 KW per hr.
This project got implemented in the month of March-17
• FY 17 Saving period 365 Days
• Energy saved in FY17 97236 Kwh
• Energy Rate as per Tariff Order 2.36 Rs/Kwh
• Total Savings/Annum 2.29 Rs. Lakhs
• Investment 3.12 Lakhs
• Payback Period 16 Months

Trombay Unit 7
Innovative Project
Modification in Gas Turbine SADC
& subsequent increase of GT
exhaust temp (OTC) set point
20

Low Operating Load & High Heat Rate
Idea description : 1) Reducing NOx emission and 2) Subsequently Increasing GT
exhaust temperature (OTC) set point resulting in increased STG generation.
Before: 1) Oil firing circuits were de-commissioned in 2013 but SADC was still in operation
which contributing to bypass air flow. 2) Outlet temperature calculation for OTC was
derived from MBA thermocouples.
After : 1) Bypass air openings were closed and locked. 2) Outlet temperature calculation for
OTC is derived from mainly MBR thermocouples with minor correction from MBA T/C’s.
Energy Saving Project :Modification in Gas Turbine SADC &
subsequent increase of GT exhaust temp (OTC) set point
Heat Rate & APC KPI impact
KPI impacted Savings (Rs. Million) Investment (Rs. Million) Payback
Gross Heat Rate 3.04* NIL NA
*Saving Calculated for FY16 & FY17
21
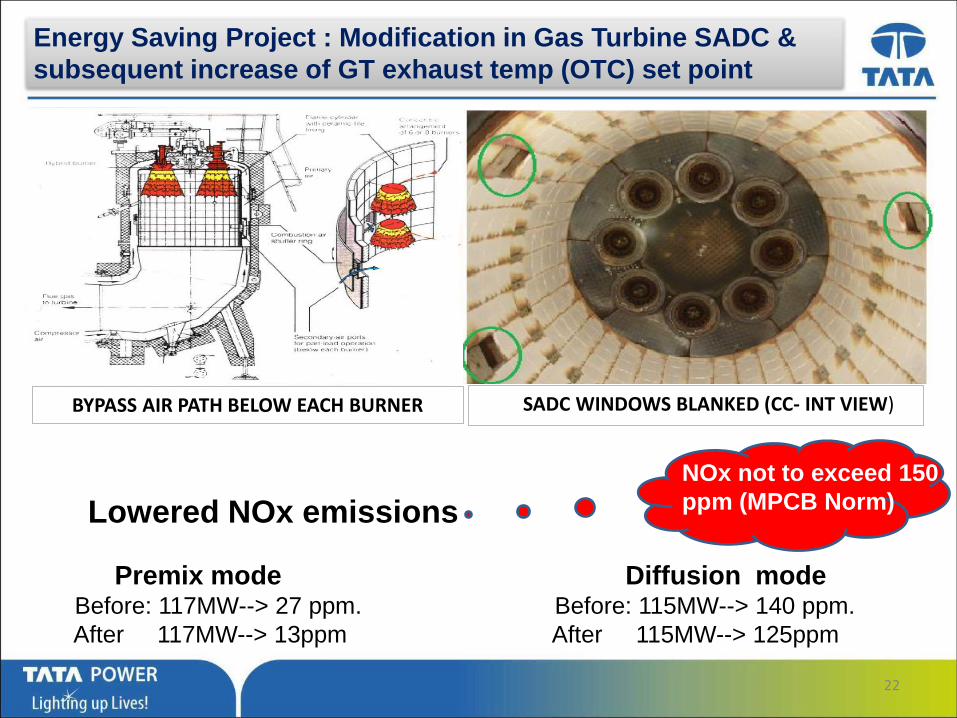
Energy Saving Project : Modification in Gas Turbine SADC &
subsequent increase of GT exhaust temp (OTC) set point
Lowered NOx emissions
Premix mode Diffusion mode Before: 117MW--> 27 ppm. Before: 115MW--> 140 ppm.
After 117MW--> 13ppm After 115MW--> 125ppm
NOx not to exceed 150
ppm (MPCB Norm)
22
BYPASS AIR PATH BELOW EACH BURNER SADC WINDOWS BLANKED (CC- INT VIEW)

Energy Saving Project : Modification in Gas Turbine SADC &
subsequent increase of GT exhaust temp (OTC) set point
SLOW RESPONSE MBA THERMOCOUPLE FAST RESPONSE MBR THERMOCOUPLE
Benefits:
• Increase in STG Generation with same GTG Generation because of release of higher
temperature at GT exhaust in view of fast response T/C’s available at MBR plane
• More stable temperature profile as reading at MBR location as compared to MBA
location.
• Stable operation and Reduction in maintenance
23

Energy Saving Project : Modification in Gas Turbine SADC &
subsequent increase of GT exhaust temp (OTC) set point
MBR Correction
BEFORE
AFTER
24

Energy Saving Project : Modification in Gas Turbine SADC &
subsequent increase of GT exhaust temp (OTC) set point
UOM MUS MT Mkcal/MT MKCAL Kcal/KWh
PARAMETER GTG GEN STG GEN TOTAL Gas
cons/day CV Heat Heat Rate
POST 20-10-16 2.837 1.610 4.447 656 13.175 8638 1943 PRE 29-05-13 2.838 1.596 4.434 658 13.157 8659 1953
Excess Gen -0.001 0.014 Heat Rate Improvement 10 Mkcal Saved for the day 46.16
POST 15-10-16 2.800 1.610 4.409 651 13.18 8575 1945 PRE 18-05-13 2.800 1.565 4.365 649 13.16 8532 1955
Excess Gen 0.000 0.045 Heat Rate Improvement 10 Mkcal Saved for the day 43.55
POST 19-10-16 2.856 1.622 4.478 658 13.18 8673 1937 PRE 13-05-13 2.856 1.585 4.441 660 13.13 8662 1950
Excess Gen 0.000 0.037 Heat Rate Improvement 13 Mkcal Saved for the day 60.34
FY 17
Wt. Avg MkCal Saved per day 50.06 Mkcal Saved per day 50.06
No of days having PLF greater than 102% 69
Total Mkcal Saved 3454 Calorific Value of Gas for FY 17 13.17
Total MT saved 262 Rs/Mkcal for FY17 822
Total Saving in Rs Million 2.84
FY17 Gross Gen 1413
Annual GHR Reduction 2.44
Zero Investment Innovative
Project

ENCON Methodology &
Involvement of All
26
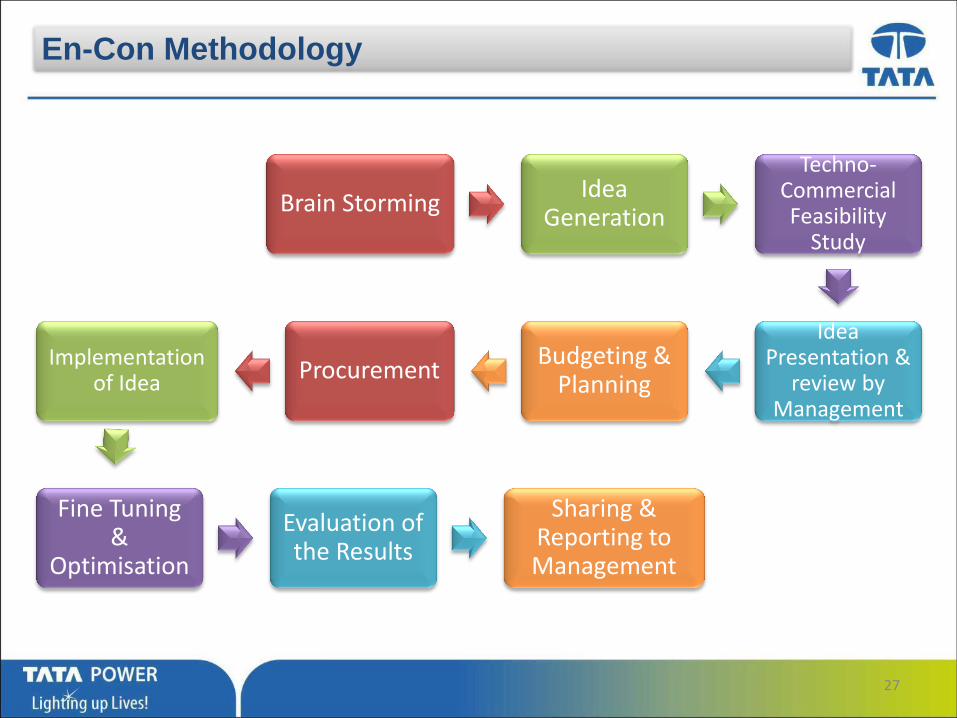
Brain Storming Idea
Generation
Techno-Commercial Feasibility
Study
Idea Presentation &
review by Management
Budgeting & Planning
Procurement Implementation
of Idea
Fine Tuning &
Optimisation
Evaluation of the Results
Sharing & Reporting to Management
En-Con Methodology
27

How it all fits together……….
Vision Emotions Logic Result
28

Sr. No. Source of En-con Idea* Source Idea Originated in
FY**
Extent of
Manpower
Involved*
Progress of
Implementation
1 Replacement of OTC thermocouple
Discussions
with
OEM
2013-14
02 Engineers,
01 Supervisor
02 Workmen
Successfully
Implemented
2 Coro-coating of Unit-7, 6.6 KV
Cooling Water pumps at jetty
Horizontal
Deployment of
idea
2013-14
02 Engineers
01 Supervisor
08 Workmen
Successfully
Implemented
3 Achieving higher generation on Diffusion
mode at low gas supply pressure
Discussions
with
OEM
2015-16 04 Engineers Successfully
Implemented
4
Modification in Gas Turbine SADC &
subsequently increasing the GT exhaust
temperature (OTC) set point
Discussions
with
OEM
2015-16
02 Engineers
01 Supervisor
02 Workmen
Successfully
Implemented
5 Installation of VFD for LP BFP
MP ISO 50001
under Project
Sankalp
2016-17
02 Engineers,
01 Supervisor
02 Workmen
Successfully
Implemented
in FY17
6 Energy monitoring system of lighting and ACs MP ISO 50001 2016-17
02 Engineers,
01 Supervisor
Contractors
Successfully
Implemented
in FY17
Source of Idea Generation & Involvement of All
29
# Sources of Idea Generation: Audits, Brain Storming, Suggestion schemes/competitions, CFTs, Core Groups, Discussions with OEMs &
Periodic Reviews.

ISO 50001:2011 Certification
30

Certificate
Completed first
Surveillance Audit in
month of July-17
31

UNIT-7 Monitoring & Analysis
32

Online Monitoring : Auxiliary Power Consumption-(Replication
from other Units)
Mus % of APC
Date : 20-Jul-17 Mus % of APC CWP 0.0282 25.06%
CEP 0.0083 7.38%
0.070 62.09% HP BFP 0.0334 29.65%
FAA 0.00 0.00%
Mus 0.000 0.00%
% UST 7A 0.0069 6.13%
UST 7B 0.0047 4.21%
PLF % 0.015 13.26% SST 7A 0.0016 1.45%
TOTAL 4.383 101% SST 7B 0.0016 1.46%
GTG 2.830 98%
STG 1.553 108% 0.088 78.31% Miscellaneous 0.024 21.69%
% of Total Aux Consumption Excitation system 0.0033 2.96%Mus
"Energy Management System - Unit 7"
Major Auxiliaries
UNIT 7Auxiliary Consumption Environment
0.113
2.57%
415 V Auxiliaries
Generation (Mus)
TOTAL
IN House Prepared
33

Online Monitoring : AC & Lighting System of Plant
Trombay AC & Lighting Monitoring System
Date : 6-Aug-17
CHP 208
Station A Lighting 1296
Total Lighting load
Unit#5 AC Plant 0
10523
Unit#5 Plant Lighting 4346
Total AC & Lighting Load
Unit#6 Plant AC 9
14124
-
Unit#6 Plant Lighting 2123
Unit#7 Plant AC 1528
Total AC Load Unit#7 Plant Lighting 455
3601
Unit#8 Plant AC 2064
Unit#8 Plant Lighting 2095
For Unit-7
34

Online Monitoring : Unit-7 Instant Parameters- IN HOUSE
PREPARED
GTG MW STG MW TOTAL MW PREMIX DIFFUSION VACCUM barBack
Pressure Bar Make Up Kg/S
Gas Flow
M3/Hr
Gas Flow
TPH
SGC
MT/KWH
121 66 186 ON OFF -0.893 0.121 0.29 40582 29.7 153CWP-7A
Disc Press
CWP-7B Disc
Press
CONDENSER &
CW PUMPS
CW Inlet
Temp
CW Outlet
Temp
CW Temp
Diff
Condenser
DP Bar
Inlet Valve
Position %
Outlet Valve
Position %
Debris Filter
DP mbar
VP-1 Temp &
Status
VP-2 Temp &
StatusVaccum Bar
Compressor
Efficiency %1.89 0.01
TOP 27.9 37.8 9.9 0.93 98.7 73.4 103.5 43.2 36.1 -0.888CW Pump-
7A Current59.4
BOTTOM 28.3 38.2 9.9 0.89 99.3 68.3 97.0 ON ON -0.893CW Pump-
7B Current0.0
GAS Press CV
Position %
FG Supply
Pressure Bar
FG Pressure
After CV Bar
Bypass Stack
Temp
Damper
Position %
FG HRSG Inlet
Temp
FG HP Evap
I/L Temp
FG HP Evap
O/L Temp
FG LP Evap
I/L Temp
FG LP Evap
O/L Temp
FG HRSG
O/L Temp
CW Pump-
4A Current0
61 18.5 15.0 185 101 544 453 283 242 192 112CW Pump-
4B Current71
Compr Inlet
Pressure mbar
Compr Inlet
Temp
IGV Position
%
Compr Outlet
Pressure Bar
Compr Outlet
Temp
DP Comb
Chamber-L
mBar
DP Comb
Chamber-R
mBAr
Pressure RatioAir Flow
TPH
Intake DP
mBar
Colascre
Filter DP-1
mBar
Pre Filter
DP-2 mBar
Fine Filter
DP-3 mBar
920.7 28.8 92.0 9.34 340.9 175.8 179.1 10.14 1755 7.94 3.12 2.24 2.91
Hotwell Level
mm
CEP 7A
Current Amp
CEP 7B
Current Amp
CEP 7A
Strainer DP
Bar
CEP 7B
Strainer DP
Bar
CEP Discharge
Pressure Bar
CEP Discharge
Temp
CEP Discharge
Flow Kg/S
Discharge
Pressure After
CV %
CCWP-1
Status
CCWP-2
Status
CCWP-3
Status
CCWP-4
Status
1055 28 0 0.126 0.044 22.5 49.8 67.5 9.2 OFF ON OFF ON
Temp at CPH
I/L
Temp at CPH
O/L
FWT Level
mm
FWT
Pressure BarFWT Temp
LP Drum
Pressure Bar
LP Drum Sat
Temp
HP Drum
Pressure Bar
HP Drum Sat
Temp
Booster
Pump-1
Status
Booster
Pump-2
Status
Booster
Pump-3
Status
Booster
Pump-4
Status
50.7 164.2 1701 6.4 164.2 5.9 164.2 67.0 283.9 OFF ON OFF ON
LP-7A SpeedLP-7A
Current Amp
LP-7A
Discharge Pr
Bar
LP-7B SpeedLP-7B Current
Amp
LP-7B Discharge
Pr Bar
LP Header
Pressure Bar
LP Header
Temp
LP Header
Flow Kg/S
LP Steam
Press Ahead
ESV Bar
LP Steam
Flow Kg/S
LP Steam
Turbine
inlet temp
2618 68 23.6 32.8 1.7 21.0 21.2 162.4 12.0 5.8 11.7 214.7
HP-7A Current
Amp
HP-7A Disch
Pr Bar
HP-7A Leak
off Pr Bar
HP-7B
Current Amp
HP-7B Disch
Pr Bar
HP-7B Leak off
Pr Bar
HP Header
Pressure Bar
HP Header
Flow Kg/S
HP Eco-1 O/L
Temp
HP ECO-2 O/L
Pr Bar
HP ECO-2
O/L TempHP FCV 30% HP FCV 100%
0 5.0 0.4 130.8 115.7 9.4 115.7 53.3 168.4 110.1 271.3 1 8
HP Steam
Press before
DSH Bar
HP Steam
Temp before
DSH
HP Steam
Temp after
DSH
DESH Line
Flow Kg/Sec
Final SH
Temp
HP Steam
Pressure Ahead
ESV Bar
HP Steam
Flow Kg/S
HP steam
Temp before
Valve-1
HP steam
Temp before
Valve-2
HP Control
Valve-1
Position %
HP Control
Valve-2
Position %
IP Exhaust
Temp
HP FCV 100%
BYPASS
63.9 437.7 416.4 1.4 523.5 62.7 54.2 519.1 519.4 99.5 99.8 55.9 48
CW Pumps
HP Steam
GAS & FLUE
GAS
Compressor
CEP
FWT, LP Drum
& HP Drum
LPBFP & LP
Steam
HPBFP
21-07-17 12:39
90.8%
35

Online Monitoring : Unit-7 Performance Parameters
Comparison-IN HOUSE PREPARED
1-7-2017 29-7-2017
1h 22-7-2017 1-8-2017
PARAMETER UOM PRE POST DEVIATION
GTG LOAD MW 119.5 119.5 0.0
STG LOAD MW 64.9 67.7 2.8
TOTAL LOAD MW 184 187 2.9
Vaccum BAR -0.890 -0.924 -0.034
Back Pressure BAR 0.123 0.080 0.043
Compressor Inlet Pressure mBar 921 996 75
Compressor Inlet Temperature Deg C 27 28 1.0
Compressor Outlet Pressure Bar 9.16 9.19 0.02
Compressor Outlet Temperature Deg C 338 337 -1.07
Pressure Ratio 9.95 9.23 -0.72
Compressor Efficiency % 89.7% 86.6% -3.13%
Total Air Flow TPH 1740 1702 -38
Inlet Guide Vane Position % 86.2 81.6 -4.6
Combustion Chamber DP-L mBar 179 179 -0.5
Combustion Chamber DP-R mBar 179 183 4.0
Overall Intake DP across Filters mBar 9.43 3.76 -5.67
Coalescer Filter DP mBar 3.37 1.62 -1.76
Pre Filter DP mBar 2.61 1.05 -1.56
Fine Filter DP mBar 3.45 1.63 -1.82
'\\trombaypi\TR U7 GTG MW FINAL'>115
COMPRESSOR PARAMETER
1-7-2017 29-7-2017
1h 21-7-2017 1-8-2017
PARAMETER UOM PRE POST DEVIATION
CW Inlet Temp Deg C 28.4 28.8 0.3
CW Outlet Temp Deg C 39.2 38.9 -0.3
CW Temp Difference Deg C 10.8 10.1 -0.6
Condenser DP MBAR 0.798 0.234 -0.6
CW Inlet Valve Position % 98.7 64.8 -33.8
CW Outlet Valve Position % 67.8 25.2 -42.7
Debris filter DP MBAR 100.6 85.3 -15.4
CW Inlet Temp Deg C 28.9 29.1 0.2
CW Outlet Temp Deg C 38.5 38.6 0.1
CW Temp Difference Deg C 9.67 9.51 -0.2
Condenser DP MBAR 0.758 0.550 -0.21
CW Inlet Valve Position % 99.3 65.1 -34.2
CW Outlet Valve Position % 64.6 31.0 -33.6
Debris filter DP MBAR 73.3 77.0 3.7
CWP-7A Discharge Pressure Bar 1.72 1.80 0.1
CWP-7ABDischarge Pressure Bar 1.72 1.78 0.1
CWP-7A Motor Current Amp 60.5 60.9 0.4
CWP-7B Motor Current Amp 59.7 60.7 1.0
'\\trombaypi\TR U7 GTG MW FINAL'>115
CONDENSER TOP SIDE
CONDENSER BOTTOM SIDE
CW PARAMETER
Gas Flow M3/HR 40295 39370 -925
Gas Flow TPH 29.4 28.7 -0.7
Specific Gas Consumption Kg/MWH 153 149 -3
Fuel Gas Supply Pressure BAR 22.6 18.0 -4.7
GAS PARAMETER
36
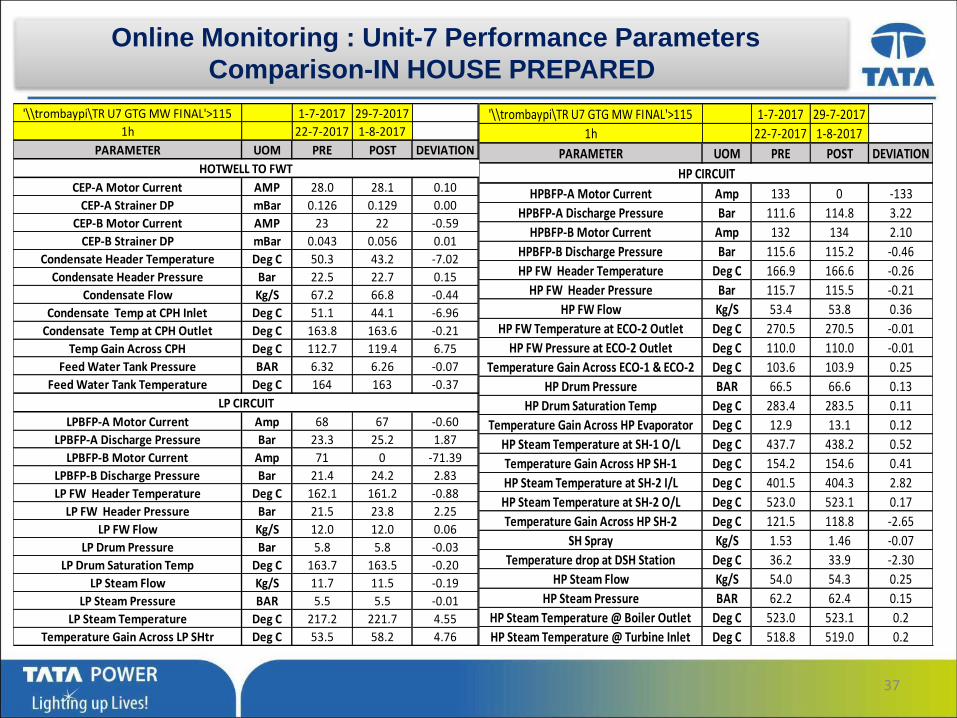
Online Monitoring : Unit-7 Performance Parameters
Comparison-IN HOUSE PREPARED
'\\trombaypi\TR U7 GTG MW FINAL'>115 1-7-2017 29-7-2017
1h 22-7-2017 1-8-2017
PARAMETER UOM PRE POST DEVIATION
CEP-A Motor Current AMP 28.0 28.1 0.10
CEP-A Strainer DP mBar 0.126 0.129 0.00
CEP-B Motor Current AMP 23 22 -0.59
CEP-B Strainer DP mBar 0.043 0.056 0.01
Condensate Header Temperature Deg C 50.3 43.2 -7.02
Condensate Header Pressure Bar 22.5 22.7 0.15
Condensate Flow Kg/S 67.2 66.8 -0.44
Condensate Temp at CPH Inlet Deg C 51.1 44.1 -6.96
Condensate Temp at CPH Outlet Deg C 163.8 163.6 -0.21
Temp Gain Across CPH Deg C 112.7 119.4 6.75
Feed Water Tank Pressure BAR 6.32 6.26 -0.07
Feed Water Tank Temperature Deg C 164 163 -0.37
LPBFP-A Motor Current Amp 68 67 -0.60
LPBFP-A Discharge Pressure Bar 23.3 25.2 1.87
LPBFP-B Motor Current Amp 71 0 -71.39
LPBFP-B Discharge Pressure Bar 21.4 24.2 2.83
LP FW Header Temperature Deg C 162.1 161.2 -0.88
LP FW Header Pressure Bar 21.5 23.8 2.25
LP FW Flow Kg/S 12.0 12.0 0.06
LP Drum Pressure Bar 5.8 5.8 -0.03
LP Drum Saturation Temp Deg C 163.7 163.5 -0.20
LP Steam Flow Kg/S 11.7 11.5 -0.19
LP Steam Pressure BAR 5.5 5.5 -0.01
LP Steam Temperature Deg C 217.2 221.7 4.55
Temperature Gain Across LP SHtr Deg C 53.5 58.2 4.76
HOTWELL TO FWT
LP CIRCUIT
'\\trombaypi\TR U7 GTG MW FINAL'>115 1-7-2017 29-7-2017
1h 22-7-2017 1-8-2017
PARAMETER UOM PRE POST DEVIATION
HPBFP-A Motor Current Amp 133 0 -133
HPBFP-A Discharge Pressure Bar 111.6 114.8 3.22
HPBFP-B Motor Current Amp 132 134 2.10
HPBFP-B Discharge Pressure Bar 115.6 115.2 -0.46
HP FW Header Temperature Deg C 166.9 166.6 -0.26
HP FW Header Pressure Bar 115.7 115.5 -0.21
HP FW Flow Kg/S 53.4 53.8 0.36
HP FW Temperature at ECO-2 Outlet Deg C 270.5 270.5 -0.01
HP FW Pressure at ECO-2 Outlet Deg C 110.0 110.0 -0.01
Temperature Gain Across ECO-1 & ECO-2 Deg C 103.6 103.9 0.25
HP Drum Pressure BAR 66.5 66.6 0.13
HP Drum Saturation Temp Deg C 283.4 283.5 0.11
Temperature Gain Across HP Evaporator Deg C 12.9 13.1 0.12
HP Steam Temperature at SH-1 O/L Deg C 437.7 438.2 0.52
Temperature Gain Across HP SH-1 Deg C 154.2 154.6 0.41
HP Steam Temperature at SH-2 I/L Deg C 401.5 404.3 2.82
HP Steam Temperature at SH-2 O/L Deg C 523.0 523.1 0.17
Temperature Gain Across HP SH-2 Deg C 121.5 118.8 -2.65
SH Spray Kg/S 1.53 1.46 -0.07
Temperature drop at DSH Station Deg C 36.2 33.9 -2.30
HP Steam Flow Kg/S 54.0 54.3 0.25
HP Steam Pressure BAR 62.2 62.4 0.15
HP Steam Temperature @ Boiler Outlet Deg C 523.0 523.1 0.2
HP Steam Temperature @ Turbine Inlet Deg C 518.8 519.0 0.2
HP CIRCUIT
37

Monthly Review
YTDFY18
ABPFY18
YearFY17
April May June July Aug Sept Oct Nov Dec Jan Feb Mar
YTD FY18 2351
FY 18 (Plan) 2370
FY 17 (Actual) 2337
FY 18 (Actual) 2314 2336 2348 2415
ABP FY 18 2365 2361 2359 2402 2379 2368 2367 2375 2378 2335 2380 2368
FY 17 2334 2348 2367 2370 2341 2352 2316 2323 2383 2241 2330 2301
2351 2370
2337
2000
2050
2100
2150
2200
2250
2300
2350
2400
2450
2500
2550
2600
KC
AL
/ K
WH
STATION HEAT RATE (KCAL /KWH)
38

Monthly Review
YTDFY18
ABPFY18
YearFY17
April May June July Aug Sept Oct Nov Dec Jan Feb Mar
YTD FY18 5.38%
FY 18 (Plan) 5.89%
FY 17 (Actual) 5.64%
FY 18 (Actual) 5.01% 5.33% 5.60% 5.67%
ABP FY 18 5.75% 5.51% 5.59% 6.33% 6.14% 5.95% 5.77% 5.91% 5.84% 5.99% 6.09% 5.95%
FY 17 5.7% 5.5% 5.5% 5.8% 5.7% 5.8% 5.5% 5.5% 5.6% 6.4% 5.9% 5.2%
5.38%
5.89%
5.64%
4.0%
4.3%
4.5%
4.8%
5.0%
5.3%
5.5%
5.8%
6.0%
6.3%
6.5%
6.8%
%
STATION AUXILIARY CONSUMPTION (%)
39

Eco Affection & Carbon Emission
Reduction projects
40

Reduction in Unit 7 Specific Make Up Water Consumption
Care For Environment- Resource Conservation (Water)
“Specific Water Consumption for Trombay Site for FY17: 0.216 M3/MWH
5.000
10.000
15.000
20.000
25.000
30.000
35.000
FY09 FY10 FY11 FY12 FY13 FY14 FY15 FY16 FY17
31.387
21.7
17.4
14.9
19.1
15.4
20.4 20.7
12.0
Specific Water Consumption M3/MU
41

Care for Environment : Water Management
Series of surface aerators are
placed in the discharge channel to
reduce the temperature of cooling
water.
Treated sewage is collected in storage
tanks from where it is pumped up to
coal berth and used for coal dust
suppression by using sprinkler system.
This has reduced consumption of
equivalent amount of fresh water.
42

Care For Environment- Renewable & Energy
Conservation Project
Usage of Light Pipes in Training Centre
Usage of LED Lights in Compound Wall
43

Use of Bottom Ash in
Landscape Garden and
Brick Making
Recycling of waste papers Oil Filters to Reduce
Generation of Waste Oil
Care For Environment- Waste Management
44

Use of Scrap Steel within the
plant
Care For Environment- Waste Management
45
Before
After

Care For Environment- Waste Management
• Construction of 4 Nos. of Beautiful Garden in place of un-used, scraped stored, jungle like area.
• Material Used-Bottom ash, Ash Clinkers, Old RCC precast slabs / tiles , Old structural steel is used to fix the gate for garden.
• Saving – 17.15 Lakhs.
46

Care For Environment- Waste Management (Place to
Store Oil Drums)
47

Before
After
Care For Environment- Renewable & Energy
Conservation Project
Replacement of OLD AC sheet with new transparent sheet along with turbo ventilators in Materials Department
48
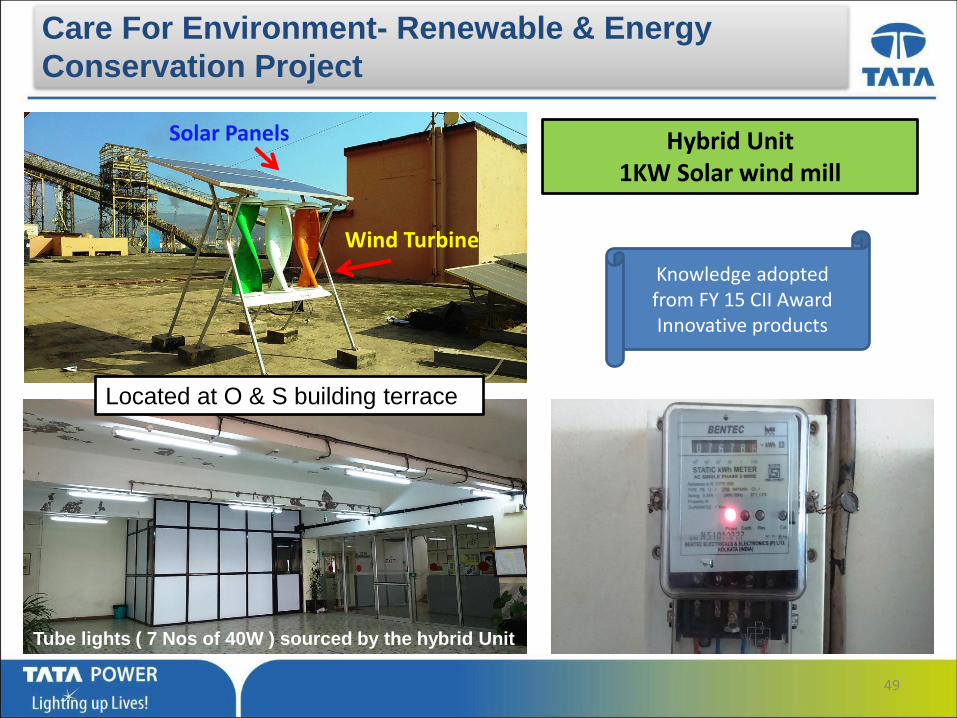
Hybrid Unit 1KW Solar wind mill
Solar Panels
Wind Turbine
Care For Environment- Renewable & Energy
Conservation Project
Located at O & S building terrace
Tube lights ( 7 Nos of 40W ) sourced by the hybrid Unit
Knowledge adopted from FY 15 CII Award Innovative products
49

Care For Community : Renewable & Energy
Conservation Project in the Community
70 Solar lights ( MV-3 model- 11 W) have been installed in dark areas of communities of Trombay to
address safety of women
Installation of Solar Lights in the
Neighbouring Community
50

Waste Management
Bio-degradable waste for organic gardening in colony
• Awareness and training sessions for organic waste utilization
were arranged in colony
• Organic waste generated at colony was used for growing nutrient rich vegetables
• Chemical pesticide free vegetables
Awareness
Execution
Outcome
Re-Use of Bio-degradable Waste
51

Care For Community & Customers Energy conservation Awareness Program
Energy conservation campaign are done by Trombay Employees voluntarily at many Schools, Colleges, Housing Societies & Offices in Mumbai.
Science
Laboratory
at Chembur
Welfare
Marathi
School
Mobile Medical
Van
Tree
plantation
drive
Employee
Voluntary
Program
Energy
Conservation
and Electrical
Safety
52


![Tata Power Delhi Distribution Limited - IREDA 1.pdf · Tata Power Delhi Distribution Limited Tata Power Delhi Distribution Limited [TPDDL], formerly known as “North Delhi Power](https://img.dokumen.tips/doc/110x75/5e6f104bdea9b33a617ce6e6/tata-power-delhi-distribution-limited-1pdf-tata-power-delhi-distribution-limited.jpg)