Embed Size (px)
Citation preview

ENCAPSULATION OF SHOCK-SENSITIVE MATERIALS AND THEIR IMPLEMENTATION INTO MATRICES
BY
JONATHAN RYAN STREUFERT
THESIS
Submitted in partial fulfillment of the requirements for the degree of Master of Science in Materials Science and Engineering
in the Graduate College of the University of Illinois at Urbana-Champaign, 2015
Urbana, Illinois
Adviser: Professor Paul Braun
ii
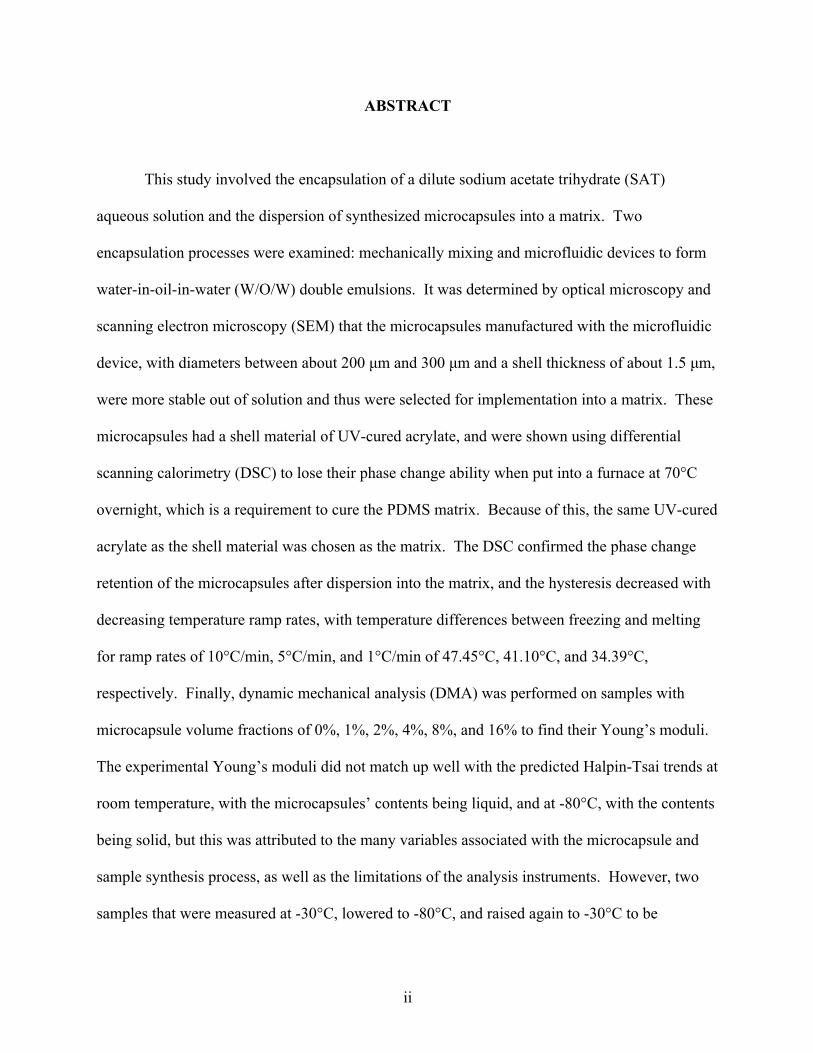
ABSTRACT
This study involved the encapsulation of a dilute sodium acetate trihydrate (SAT)
aqueous solution and the dispersion of synthesized microcapsules into a matrix. Two
encapsulation processes were examined: mechanically mixing and microfluidic devices to form
water-in-oil-in-water (W/O/W) double emulsions. It was determined by optical microscopy and
scanning electron microscopy (SEM) that the microcapsules manufactured with the microfluidic
device, with diameters between about 200 µm and 300 µm and a shell thickness of about 1.5 µm,
were more stable out of solution and thus were selected for implementation into a matrix. These
microcapsules had a shell material of UV-cured acrylate, and were shown using differential
scanning calorimetry (DSC) to lose their phase change ability when put into a furnace at 70°C
overnight, which is a requirement to cure the PDMS matrix. Because of this, the same UV-cured
acrylate as the shell material was chosen as the matrix. The DSC confirmed the phase change
retention of the microcapsules after dispersion into the matrix, and the hysteresis decreased with
decreasing temperature ramp rates, with temperature differences between freezing and melting
for ramp rates of 10°C/min, 5°C/min, and 1°C/min of 47.45°C, 41.10°C, and 34.39°C,
respectively. Finally, dynamic mechanical analysis (DMA) was performed on samples with
microcapsule volume fractions of 0%, 1%, 2%, 4%, 8%, and 16% to find their Young’s moduli.
The experimental Young’s moduli did not match up well with the predicted Halpin-Tsai trends at
room temperature, with the microcapsules’ contents being liquid, and at -80°C, with the contents
being solid, but this was attributed to the many variables associated with the microcapsule and
sample synthesis process, as well as the limitations of the analysis instruments. However, two
samples that were measured at -30°C, lowered to -80°C, and raised again to -30°C to be

iii
measured again, observed Young’s modulus increases of 8.2% and 24.4%, as the first
measurement was high enough for the capsules to have remained liquid but the second
measurement low enough for the capsules to melt from the solid. The matrix properties
remained static for both measurements, so the only difference was the capsules’ contents’ phase.
If the synthesis processes and instruments’ accuracies were improved, as well as the number of
samples to average over increased, it was suggested that the measurements could show the
expected increase in Young’s modulus of the composites with the core solutions converting from
a liquid to solid phase.
iv
ACKNOWLEDGEMENTS
This study would not have been possible without the support and contributions from
many people, groups, and organizations. I would like to thank Jinyun Liu, Professor
Valiyaveettil Suresh, Xi Chen, and Chia-Chen Li for their support and guidance throughout the
process of experiments, analysis, and writing. I would also like to thank Josh Grolman, who was
vital for the synthesis of microcapsules using microfluidic devices assembled in-house. Many
thanks to Professor Paul V. Braun, my adviser, who gave countless suggestions for new areas to
explore in my research and guidance for how to carry out those ideas. I could not have
accomplished all that I did without all these people’s assistance.
Thanks to Professors Jeffrey S. Moore and Nancy R. Sottos for the opportunity to use
equipment and instruments in their labs to complete certain aspects of my research. I thank the
entirety of the Braun, Moore, and Sottos groups for any advice and provided assistance that may
have been offered throughout the study. I would like to acknowledge U.S. Office of Naval
Research Award N0004-13-1-0170 for financial support of this research, as well as the Materials
Science and Engineering Department at the University of Illinois at Urbana-Champaign for the
opportunity to perform research and earn valuable experience in the field of materials science
and engineering. Finally, I would like to thank my family and friends for enduring the long
process of research and writing this thesis with me, as well as for offering love and support
whenever I needed it in order to continue forward and complete my goals.

v
TABLE OF CONTENTS
NOMENCLATURE ......................................................................................................................vi CHAPTER 1: INTRODUCTION ...................................................................................................1
1.1 Sodium Acetate Trihydrate Solutions ...........................................................................3 1.2 Nucleation Theory ........................................................................................................4 1.3 Encapsulation ................................................................................................................9
CHAPTER 2: LITERATURE REVIEW ......................................................................................14 2.1 Sodium Acetate Trihydrate Thermal Cycling .............................................................14 2.2 Ultrasonic Irradiation Effects ......................................................................................17 2.3 Double Emulsion Encapsulation .................................................................................19 2.4 Matrices Containing Precipitates ................................................................................25 CHAPTER 3: METHODOLOGY ................................................................................................29 3.1 Materials and Equipment ............................................................................................29 3.2 Experimental Procedure ..............................................................................................30 CHAPTER 4: RESULTS AND DISCUSSION ............................................................................34 4.1 Imaging .......................................................................................................................34 4.2 DSC .............................................................................................................................36 4.3 DMA ...........................................................................................................................42 CHAPTER 5: CONCLUSIONS ...................................................................................................46 TABLES AND FIGURES ............................................................................................................49 REFERENCES .............................................................................................................................70

vi
NOMENCLATURE
C Term representing mismatch in Poisson ratios
dm Diameter of microcapsule
Ec Young’s modulus of composite
Ef Young’s modulus of filler
Er Young’s modulus of resin
f(θ) Geometrical factor
g Acceleration of gravity (9.8 m/s2)
Δg Gibbs free energy difference per unit volume (Δµ/𝜈)
h Planck’s constant
ΔH Change in enthalpy upon melting
kB Boltzmann’s constant
n Cluster size of nucleated phase
n* Critical cluster size of nucleated phase
ΔP Change in pressure
rc Radius of microcapsule’s core material
rm Radius of microcapsule
r* Critical nucleus radius
T Current absolute temperature
ΔT Supercooling temperature (Tm – T)
Tm Equilibrium crystallization temperature
ΔTm Change in melting temperature
ΔV Change in volume upon melting

vii
Vcreaming Creaming velocity
wc Weight of microcapsule’s core material
ws Weight of microcapsule’s shell material
W(n) Work required to form spherical cluster of n atoms
W* Work required to form critical cluster size for homogeneous nucleation
W*hetero Critical work of formation for heterogeneous nucleation
x Composite filler volume fraction
β Mismatch parameter
ηc Viscosity of continuous phase
θ Contact angle
Δµ Chemical potential difference between solid and liquid
𝜈 Molecular volume of solid phase
ρc Density of continuous phase
ρm Average density of microcapsule
σ Interfacial free energy

1
CHAPTER 1
INTRODUCTION
The utilization of microcapsules is a very broad field of study with a variety of
applications. By surrounding a small droplet of material ranging from a few microns to a few
millimeters in diameter with a coating or shell, this material can be used for different functions
that would not be possible in bulk form. Because the material is isolated from its surrounding
environment, it typically has increased stability and manipulability. This has been used with
preventing chemical reactions between the core material and the matrix from occurring, as well
as controlling the release of the core material from the microcapsule. Over the last few decades
and in the foreseeable future, the range of applications for different combinations of
microcapsule core and shell materials has been and will be expanding.
One of the many possible applications of microcapsules is the utilization of the thermal
energy storage capacity of phase change materials (PCMs). A PCM is a material that has a very
high latent heat of fusion when transitioning from a solid to a liquid or vice versa. It can stay at a
relatively stable temperature as it absorbs heat until it entirely melts into a liquid, at which point
if cooled enough to make it solidify, a large amount of stored energy is released during the
liquid-solid transition. If these PCMs are encapsulated, this thermal energy storage can be
extended to uses in other materials, as the microcapsules can then be distributed into a matrix
used for a wider degree of applications.
Although PCMs are generally used for their thermal energy storage properties, the
transition from liquid to solid induces other property changes as well. As the material freezes
from a liquid into a solid, it becomes more rigid, as the mechanical properties of a solid are

2
generally stronger than those of a liquid. Not only will the material become more rigid, but so
will the microcapsule. The optical properties may also change with the transition; if the
microcapsule shell is transparent, upon freezing, the core material can transform from a
transparent liquid into a translucent or opaque solid. These microcapsule property changes will
also affect the surrounding matrix, improving the range of possibilities even further.
These characteristic changes come about due to the liquid-solid transition, but inducing
this transformation at will is an art that has not yet been perfected. Nucleation of solid phase in
the liquid phase can go about in two ways: heterogeneous nucleation and homogeneous
nucleation. Heterogeneous nucleation is the formation of solid on impurities or the container
surface, and is more common as the nucleation barrier is easier to overcome. Alternatively,
homogeneous nucleation is the formation of solid within the bulk material in the absence of a
nucleation site. Homogeneous nucleation is more difficult to achieve, as the liquid solution must
be very pure so as to avoid premature heterogeneous nucleation on available impurities or
surfaces.
One way to induce the liquid-to-solid transformation is to allow impurities or other
nucleation sites to exist in solution in favor of heterogeneous nucleation. In this case, nucleation
will occur spontaneously once the temperature has dipped below the freezing point. However,
this is not plausible if the application involves isothermally storing the material, where an
induced temperature depression below the heterogeneous freezing point is not possible. An
alternative method to induce the transformation is by removing any impurities to make the
solution as pure as possible to force homogeneous nucleation, reducing the temperature to below
the heterogeneous freezing temperature (known as supercooling), and introducing some sort of
shock or disturbance. If the amount of supercooling is large enough, and the shock or

3
disturbance strong enough, the liquid solution will transform into a solid, and any concurrent
change in properties of the microcapsules (and, by extension, the matrix) will occur. This second
scenario is more favorable since it can be implemented without requiring a temperature drop,
allowing a situation that can be more easily controlled.
This study investigates the encapsulation of supersaturated solutions of sodium acetate
trihydrate (SAT) in water, the distribution of these microcapsules into a matrix, and the
mechanical property change of the matrix before and after crystallization. Supersaturated SAT
solutions in water can be cooled much lower than the saturation temperature, allowing a large
supercooling capacity, and can transform into a solid with the introduction of a shock or
disturbance, much like a supercooled liquid. The property changes of the microcapsules and
matrix associated with this crystallization will be observed and measured.
1.1 SODIUM ACETATE TRIHYDRATE SOLUTIONS
Sodium acetate trihydrate is the PCM that is examined in this study. SAT has a very
large supercooling capability, a high latent heat of fusion, and is highly soluble in water. Its
common commercial use is in hand warmers, where the pad is filled with supersaturated SAT
solution along with a metal disk. When the metal disk is pressed at room temperature, the SAT
instantly crystallizes and rises to a temperature of about 58°C.
SAT has the structure CH3COONa3H2O, in which it is made up of 60.28% sodium
acetate and 39.72% water by weight. The properties of the solution depend on the ratio of SAT
to water, and a few properties for some different ratios are shown in Table 1. The two most
important columns to examine are the melting temperature and latent heat. As would be
expected, the less SAT there is present in the solution, the lower the latent heat of the material.

4
The melting point, or essentially the saturation temperature for aqueous solutions, decreases as
more water is added, which may be utilized for its supercooling (or supersaturation) properties
(Keinänen, 2007).
This is shown on a graphical scale in Figure 1. The blue line at approximately 60%
sodium acetate represents the SAT composition, and any aqueous SAT solutions will be to the
left of this line. The regions most important for this thesis are those labeled C and F. Region C
is a liquid solution of water and SAT. Below this region sits F, which is made up of different
phases depending on whether the solution is supercooled. If the temperature drops into F, and
stability maintained so as not to nucleate a solid phase, the solution will remain completely
liquid. However, if a shock or disturbance is introduced that is strong enough to induce
nucleation (discussed in the next section), the sodium acetate precipitates out and becomes solid,
thereby changing the properties of the solution (Keinänen, 2007).
The magnitude of property change depends heavily on the composition of the solution. If
very little water is added to the SAT, when it solidifies it will be essentially an elastic solid. On
the other hand, as water is continuously added to the solution to dilute the SAT, upon
solidification, the resulting material behaves less and less like an elastic solid. The SAT phase
that forms is dispersed in liquid water, and a lesser property change is observed. Therefore, in
order to discern a sizeable change, a more concentrated solution would be desired.
1.2 NUCLEATION THEORY
As stated previously, solid nucleation in a liquid can occur through two pathways:
heterogeneous nucleation and homogeneous nucleation. Impurities or imperfectly wetted
surfaces provide sites on which heterogeneous nucleation can take place. Heterogeneous

5
nucleation occurs much more often, as it is difficult to remove all impurities and other surfaces
from becoming nucleation sites. However, both mechanisms are important in analyzing PCMs
so they will each be looked at in detail.
Homogeneous nucleation requires the formation of a small, localized embryo of the new
phase within the bulk phase. Because the two phases involved have different densities and
degrees of order, an interface exists between them, associated with an interfacial energy. This
interfacial energy must be overcome for the embryo to grow. Even in metastable equilibrium,
small fluctuations in density or composition allow small embryos to form, but they cannot
continue to grow until they pass a critical nucleus size, so they often disappear soon after they
form. Nucleation theory quantifies the rate at which embryos grow to this critical size, after
which the new phase can form spontaneously (Debenedetti, 1996).
In nucleation theory, a term, W(n), quantifies the amount of work required to form a
cluster of n atoms of the new phase in the bulk phase. This work can be calculated using
Equation (1):
𝑊 𝑛 = 𝑛Δ𝜇 + 36𝜋 !/!𝜈!/!𝑛!/!𝜎!" (1)
where Δµ is the chemical potential of the solid phase minus that of the liquid phase, 𝜈 is the
molecular volume, and σls is the liquid-solid interfacial free energy. The first term, which is
negative as the chemical potential of the solid phase is lower than that of the liquid phase below
the equilibrium crystallization temperature, represents the favorable thermodynamic free energy
decrease for freezing the liquid. The second term, which is positive, represents the free energy
penalty for forming an interface between the newly formed phase and the bulk phase. W(n)
initially increases with an increasing cluster size due to the large surface/volume ratio, but once
the clusters become sufficiently large, the favorable thermodynamic free energy term dominates,

6
and W(n) decreases. A graphical representation of this is shown in Figure 2 (Herlach et al.,
2012).
The maximum value of work required to form the cluster is observed at a critical cluster
size, n*, and is designated W(n*) or W*. Additionally, the critical region is defined to be the
region in which W(n) is within kBT of the critical cluster size, where kB is Boltzmann’s constant
and T is the current absolute temperature. W* can be found by differentiating Equation (1) with
respect to n and setting it equal to zero, leading to Equation (2):
𝑊∗ = !"!!
!!"!
(!!)! (2)
where Δg is the free energy difference per unit volume (Δµ/𝜈). Manipulating these equations
further, one can determine the critical cluster size as shown in Equation (3), as well as the critical
radius of the cluster in Equation (4):
𝑛∗ = !"!!!
!!"!
!! ! (3)
𝑟∗ = !!!"!!
(4)
The critical radius of the cluster depends on three variables: the liquid-solid interfacial
free energy, the free energy difference between the liquid and the solid, and the molecular
volume. If examining a particular system, the interfacial free energy and molecular volume
terms will be constant, while the only variable is the free energy difference. This free energy
difference between a liquid and a solid is directly related to the temperature. The lower the
temperature is below the equilibrium crystallization temperature, Tm, or the more supercooling is
applied, the larger this difference in free energy will be. This difference leads to a decrease in
the critical radius, meaning the cluster is not required to reach as large of a size before it is able

7
to continue growing continuously. This should be an expected relationship between the amount
of supercooling of the liquid and the ability of the solid phase to form.
Heterogeneous nucleation, on the other hand, involves the nucleation of the new phase
via contact of the liquid with a solid surface. For simplicity, it is reasonable to assume this
surface, denoted as N, is planar compared to the size of the solid phase being formed. If the
surface energies of the liquid-solid, liquid-surface, and solid-surface are labeled σls, σln, and σsn,
respectively, the solid phase can form on the surface at a contact angle θ and Equation (5), or the
Young equation, will be satisfied:
𝜎!"𝑐𝑜𝑠𝜃 = 𝜎!" − 𝜎!" (5)
The shape of the new phase on the surface is a spherical cap, as shown in Figure 3.
The critical work of formation for heterogeneous formation, W*hetero, is closely related to
that of homogeneous nucleation. All the same parameters are involved, and with manipulation,
W*hetero is found in Equation (6), relating to a geometrical factor, f(θ), which can be calculated
using Equation (7):
𝑊!!"!#$∗ =𝑊∗𝑓 𝜃 (6)
𝑓 𝜃 = (!!!!"#$!!"#!!)!
(7)
f(θ) is the ratio of the volume of the spherical cap to that of a sphere that would form in
homogeneous nucleation. The critical radius r* to form the new phase is the same for both
heterogeneous and homogeneous nucleation, but the amount of work required to form this radius
is typically much smaller for heterogeneous nucleation. Examining the inset in Figure 3, the
geometrical factor f(θ) varies between 0 and 1, with the smallest values at small contact angles.
The additional work required to homogeneously nucleate the solid phase can cause a large
amount of supercooling before nucleation. As an example, highly pure liquid water has been

8
known to supercool down to -41°C in the laboratory at atmospheric pressure (Debenedetti,
1996). Of course, the amount of potential supercooling depends on the purity of the material, as
well as other properties (such as the free energy difference). However, this potential for
supercooling can allow a large region to utilize for the purpose of this paper.
Two extreme cases must be considered for heterogeneous nucleation. The first is when
σsn > σls + σln, in which case the solid-surface interface is so unfavorable that a thin layer of liquid
will wet the surface, removing any solid-surface interface. The effective contact angle is 180°,
so the work required is the same as for homogeneous nucleation. The other extreme occurs
when σln > σls + σsn, in which the liquid-surface interface is unfavorable. In this case, a thin layer
of solid will “wet” the surface to remove this liquid-surface interface, and the effective contact
angle is 0, equating to a complete removal of the nucleation barrier. This is related to the case
when the surface is the same phase as the solid, regarded as “seeding” the supercooled liquid and
immediately forming the new solid phase.
As previously mentioned, nucleation can occur by applying a shock or disturbance to a
supercooled liquid or supersaturated solution. Though nucleation as a whole is not a topic that is
completely understood, the reason why a shockwave induces nucleation has been looked into. A
shockwave propagating through a liquid introduces a negative pressure region, which causes
cavitation, or a “cavity” that forms in the liquid. When these cavities are produced mechanically
or through ultrasonic radiation, they typically grow to a small size (a few microns in diameter), at
which point they collapse. The collapse of these cavities is often the cause for nucleation. Upon
collapsing, a cavity produces a very high positive pressure, followed by a high negative transient
pressure. The negative pressure directly influences a material’s freezing temperature, and so this
negative pressure can undercool the liquid even further and trigger nucleation. The change in the

9
melting temperature, ΔTm, brought on by a change in pressure, ΔP, can be described using the
Clapeyron equation, or Equation (8):
∆!!∆!
= !∆!∆!
(8)
where ΔV and ΔH are the change of volume on melting and change of enthalpy on melting,
respectively (Hunt et al., 1966).
1.3 ENCAPSULATION
Encapsulation of materials has been attempted in the lab, but before that it has long been
used by nature to protect some sort of contents from environmental influences. Birds lay eggs
with a protective shell to shelter from the outside world, while on a microscopic scale, cells have
a wall surrounding it to protect its contents. Microencapsulation is described as the process of
encircling micron-sized particles with an inert shell that will not react with the core material.
This is used for a multitude of applications, such as protection, compatibility of core materials,
and controlled release (Ghosh, 2006).
Microcapsules, which are named such as their size is on the order of microns (diameter
>1µm), can be divided into two parts: the core (inner material) and the shell (protective layer).
The core material can be in the form of a solid, liquid, or gas. Though the core can be a very
wide variety of materials, such as pigments, dyes, plasticizers, monomers, and catalysts, one of
the most important criterions for improving the microcapsules’ efficiency is its compatibility
with the shell material. Reactions that occur between the shell and core materials risk damaging
the purpose of the capsule. Depending on the application, the shell material can be made to be
permeable, semi-permeable, or impermeable. In general, permeable shell materials are used

10
when one requires a release mechanism, and semi-permeable shells are utilized for preventing
the release of the core material while allowing low molecular-weight liquids to pass through.
For the purposes of this paper, however, an impermeable shell will be implemented.
Once the sodium acetate solution has been encapsulated, any diffusion of material in or out of
the shell could compromise its ability to crystallize on command. If water diffuses into the
capsules (such as if the capsules are dispersed in water), it could become so dilute that nucleating
with an applied shock is impossible. On the other hand, if water diffuses out of the capsules
(upon drying, for example), the concentration of sodium acetate may rise too high to prevent
crystallization at room temperature. Therefore, once the shell has surrounded the core material,
it must prevent any permeability of materials in or out of the capsules.
Nevertheless, there is a compromise that must be met regarding the shell thickness. In
order to be as impermeable as possible, a thicker shell is advantageous, but the thicker the shell
is, the less the core material makes up the microcapsule. If a microcapsule is assumed to be
spherical and the densities of the core and shell materials are similar, the dependence of the
weight ratio of the shell material (ws) to the core material (wc) is shown in Equation (9):
!!!!= (!!! !!!!)
!!! (9)
where rm is the full radius of the microcapsule and rc is the radius of the microcapsule’s core
material. The ideal case is when the weight ratio shown in Equation (9) is as small as possible.
The more core material is present in the microcapsule, the more it affects the properties of the
microcapsule. Therefore, in order to maximize the effectiveness of the capsule, the shell
thickness must be a compromise between permeability and microcapsule weight fraction.
The encapsulation process itself of course depends on the core and shell materials. In
general, there are two main categories of the encapsulation process: chemical and physical.

11
Chemical processes are techniques that involve emulsions, suspensions, precipitation, or
polycondensation, while physical processes examples are spray-drying, vacuum encapsulation,
or fluid-bed coating. The experimental procedures used in this paper involve chemical
processes, namely emulsions, to form microcapsules.
Emulsions are small droplets that are highly stable while dispersed in a continuous phase,
and are traditionally formed by using high shear. Using a surfactant or emulsifier can increase
the stability of the emulsions, while their size can be controlled by the amount of shear. In
general, when mechanically stirring or homogenizing, the solution to create the emulsions, a
faster speed will cause greater shear, which in turn will produce smaller emulsions. At the start
of homogenization, there is a fairly high polydispersity in the size of the capsules, but over time
with constant fusion and fission processes induced, the polydispersity decreases until the
emulsions reach a steady state (Ghosh, 2006).
Once these stable emulsions have formed, polymer shells can form around them. The
simplest case is considered in which a nonsolvent hydrocarbon is dispersed in a continuous
aqueous phase and encapsulated by a polymer shell. Mixed in with the hydrocarbon is the
monomer, as well as an initiator for the polymerization. As this mixture is dispersed into a
continuous water phase (perhaps containing a surfactant to stabilize the droplets) and stirred or
homogenized, the hydrophobic phase forms droplets in the water. If the temperature is increased
in order to induce polymerization, as the polymerization occurs, the polymer shell phase
separates from the hydrocarbon and forms around it. The morphology of this shell is determined
by the surfactant, monomer polarity, and choice of hydrophobic material. Once these
microcapsules are formed, they can be filtered out of the aqueous phase and collected.

12
This procedure only works for hydrophobic core materials, however, so a different
approach needs to be undertaken if the goal is to encapsulate a water-soluble core solution. This
alternate approach utilizes a special type of emulsion, called a double emulsion. Double
emulsions may be of two types: water-in-oil-in-water (W/O/W), in which oil droplets contain
smaller aqueous droplets, and oil-in-water-in-oil (O/W/O), in which aqueous droplets contain
smaller oily droplets. In order to encapsulate an aqueous core solution, the W/O/W double
emulsion will be utilized. The first step is to prepare what is called an inverse system, or
aqueous droplets dispersed in an oily continuous phase (W/O emulsion) that contains an oil-
soluble polymer and a surfactant. Once the aqueous droplets have stabilized in the oily
continuous phase, this solution is added to a larger aqueous continuous phase that contains a
hydrophilic surfactant. This forms the W/O/W double emulsion system. In order for the
polymer shell to fully precipitate out of solution, the oily phase needs to be evaporated out, so
the ideal oily phase is that which has a high vapor pressure at room temperature. Once the oily
phase evaporates out of the system, the polymer shell forms around the aqueous core solution,
and the microcapsules can be collected. This procedure is otherwise called a “solvent
evaporation” method (Leal-Calderon, 2007).
This is just one example of a way to create W/O/W double emulsions. There are other
methods, but the main idea is that the aqueous core solution must be surrounded by some
physical shell to protect from the environment. Once these capsules have been made, as
previously discussed the goal is to disperse them into a matrix. A phenomenon that is observed
before solidifying the matrix, however, is creaming. This is the rising or sinking of the capsules
in a liquid deriving from a difference in density between the capsules and the continuous phase.
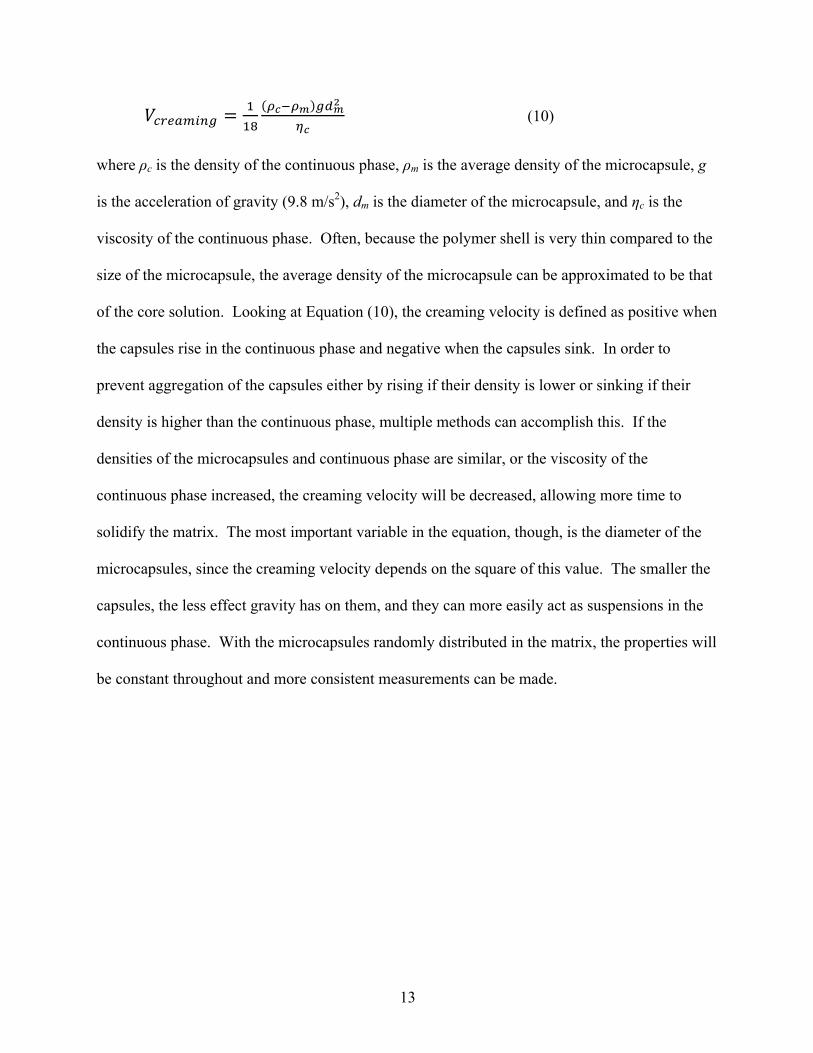
The creaming velocity, Vcreaming, of the capsules in a liquid can be calculated from Equation (10):
13
𝑉!"#$%&'( =!!"
!!!!! !!!!
!! (10)
where ρc is the density of the continuous phase, ρm is the average density of the microcapsule, g
is the acceleration of gravity (9.8 m/s2), dm is the diameter of the microcapsule, and ηc is the
viscosity of the continuous phase. Often, because the polymer shell is very thin compared to the
size of the microcapsule, the average density of the microcapsule can be approximated to be that
of the core solution. Looking at Equation (10), the creaming velocity is defined as positive when
the capsules rise in the continuous phase and negative when the capsules sink. In order to
prevent aggregation of the capsules either by rising if their density is lower or sinking if their
density is higher than the continuous phase, multiple methods can accomplish this. If the
densities of the microcapsules and continuous phase are similar, or the viscosity of the
continuous phase increased, the creaming velocity will be decreased, allowing more time to
solidify the matrix. The most important variable in the equation, though, is the diameter of the
microcapsules, since the creaming velocity depends on the square of this value. The smaller the
capsules, the less effect gravity has on them, and they can more easily act as suspensions in the
continuous phase. With the microcapsules randomly distributed in the matrix, the properties will
be constant throughout and more consistent measurements can be made.

14
CHAPTER 2
LITERATURE REVIEW
The following is a discussion of literature relevant to sodium acetate trihydrate solutions,
encapsulation of materials, and dispersion of particles into a matrix.
2.1 SODIUM ACETATE TRIHYDRATE THERMAL CYCLING
Much work has been done in the past regarding the thermal cycling of sodium acetate
trihydrate solutions. Wada et al. (1984) examined the ability of SAT to store heat through
multiple thermal cycles. Three kinds of samples were used: guaranteed grade SAT, technical
grade SAT, and technical grade SAT thickened with poly(vinyl alcohol); all of the samples also
contained Na4P2O710H2O (sodium pyrophosphate decahydrate) as a nucleation catalyst. The
guaranteed grade SAT sample saw the latent heat of fusion drop from 254 J/g to 160 J/g over 400
cycles, the technical grade SAT sample’s latent heat decreased from 259 J/g to 200 J/g over 400
cycles, and the technical grade SAT containing poly(vinyl alcohol) saw no noticeable drop in
latent heat over 400 cycles. The reasoning behind the drop in latent heat for the first two
samples was said to be that over many cycles, anhydrous sodium acetate settles on the bottom of
the container and is thus taken away from the thermal cycling capacity of the samples. The third
sample did not see any noticeable drop in latent heat because the poly(vinyl alcohol) acted as a
thickening agent, preventing the anhydrous sodium acetate particles from settling at the bottom
of the container.
Kimura and Kai (1985) also observed the thermal cycling of SAT when mixed with
nucleating agents. First, they heat cycled SAT mixed with water, and found that after 100

15
cycles, the separation of anhydrous sodium acetate became quite apparent, reducing the latent
heat capacity. They also created mixtures containing SAT with 10 wt% NaBr2H2O (sodium
bromide dihydrate) or 15 wt% NaHCOO3H2O (sodium formate trihydrate) as nucleating agents
and cycled between 60°C and 30°C. The NaBr2H2O melted at 50.1°C and contained a heat of
fusion of 134 J/g, and the mixture with SAT resulted in a melting point of 51°C and a heat of
fusion of 175 J/g, with no noticeable changes in properties over 1000 cycles. The
NaHCOO3H2O melted at 17°C, and mixtures with SAT also improved the cycling capability,
but increasing NaHCOO3H2O was coupled with considerably decreased heat of fusion.
Guion and Teisseire (1991) looked at nucleating agents for SAT for the purpose of
reducing the amount of supercooling. The nucleating agents they used were NaNH4PO44H2O
(ammonium sodium phosphate tetrahydrate) and Na2HPO412H2O (disodium hydrogen
phosphate dodecahydrate). The phosphate salts being slightly soluble in SAT, the typical
compositions for the solutions were 5% phosphate salt by weight. The bulk solution was cycled
between 40°C and 70°C in temperature controlled water-baths, and DSC was performed for
hundreds of heating-cooling cycles. The NaNH4PO44H2O was limited to only a few cycles, as
the crystallization enthalpy recovered during cooling was very low and the supercooling amount
rapidly increased after only a few cycles. Na2HPO412H2O faired much better, as the
supercooling was reduced to 6-7°C, and the enthalpy recovered was much higher. Additionally,
its effectiveness was proven to carry over for hundreds of cycles, and even when left at ambient
temperature for six months, the salt was still able to nucleate effectively. The compatibility
between the SAT and nucleating agents was also looked into with detail. Because the crystal
structure of SAT is monoclinic, they eliminated the examination of nucleating agents without

16
monoclinic crystal structures, but did not find any meaningful correlation between similar cell
parameters and nucleating ability.
Cao and Yang (2014) examined the possibility to suppress supercooling of
microencapsulated phase change materials without the inclusion of a nucleating agent, which
would decrease the latent heat capacity of the material. They encapsulated octadecane in a
melamine-formaldehyde resin shell under slightly different conditions and recorded the DSC
curves of the resulting microcapsules. They found that a formaldehyde:melamine ratio of 1.25 in
the pre-polymer solution, pH of 8.50 for the pre-polymer solution, and acetic acid concentration
of 1.38 ml/L in the emulsion resulted in the best suppression of supercooling. The reasoning
behind this was that the shell surface contained less complete crosslinking due to the formation
of fewer hydroxylmethyl groups under these conditions. These free-standing functional groups
helped induce heterogeneous nucleation and reduced the amount of supercooling.
Jin et al. (2014) studied the phase-change characteristics of partially melted SAT by
using DSC. They first performed DSC on SAT with a maximum temperature of 70°C and a
minimum temperature of -40°C. They found the heat of fusion on melting between 58.9°C and
67.3°C to be 257.2 J/g, but it did not release the latent heat even upon cooling to -40°C,
indicating tremendous supercooling when fully melted. Repeated cycling did not result in any
further melting or freezing peaks. After this, they conducted numerous other tests in which the
heating cycle’s highest temperature was less than the maximum heat flow point in the previous
experiment, while the cooling cycle’s lowest temperature was 41.8°C. Their results indicated
that if the highest temperature was lower than the onset melting temperature, no heat was
absorbed or released on heating and cooling, respectively. However, if the highest temperature
was between the lower limit and the upper limit of the melting peak, the SAT was only partially

17
melted and so would quickly solidify upon cooling. They saw a large absorbed heat peak when
the maximum temperature was 65.5°C of 275.5 J/g, but no further peaks in later cycles. They
observed the best cycling ability of SAT to be when the highest temperature was 63.5°C, where
the first three cycles resulted in absorbed heat values of 233 J/g, 147.7 J/g, and 142.1 J/g,
respectively.
Jin et al. (2014) repeated the experiment, except instead of DSC, the heating and cooling
was done on a larger scale. A temperature controlled water bath executed the heating, after
which taking the samples out of the water bath allowed them to cool under ambient conditions. 8
g of SAT in a test tube was used for each experiment, and thermocouples were utilized to
accurately measure the temperature over time. They performed heating and cooling processes
for the three states of not-melted (maximum temperature of 55.0°C), partially-melted (maximum
temperature between 58.0°C and 62.0°C), and fully-melted (maximum temperature of greater
than 63.0°C). As previously observed, the non-melted state saw no phase change or latent heat
absorbed or released, while the fully-melted state presented severe supercooling problems and
could not release any latent heat upon cooling. The partially-melted state reflected lower melting
ratios, with little (4.5°C to 8.6°C) to no supercooling.
2.2 ULTRASONIC IRRADIATION EFFECTS
Lyczko et al. (2002) looked at the effects of ultrasound on metastable zone widths and
induction times, or time after supersaturation for crystals to form, for the crystallization of K2SO4
(potassium sulphate). The induction time and metastable zone widths were measured both with
and without applied ultrasound. The solution’s conductivity was measured, and the appearance
of crystals was determined to be when the conductivity suddenly decreased. They found that

18
without ultrasound, the induction time for primary nucleation at about 5-10 K supercooling was
about 9000 s, while with ultrasound the induction time was about 1000 s. The conductivity also
decreased more rapidly with ultrasound, indicating more formed crystalline surface. The
metastable zone width decreased significantly with ultrasound compared to the case without
ultrasound. They identified ultrasound as a sufficient substitution for seeding, limiting the
number of foreign particles in the material in an industrial setting.
Miyasaka et al. (2006) examined the effects of ultrasonic irradiation on the nucleation of
heat storage materials. They used Na2HPO412H2O as the heat storage material; the reasoning
was that this material has a large latent heat of fusion, but also observes a large amount of
supercooling. In order to reduce the amount of supercooling and nucleate at a more predictable
temperature, they performed experiments to find out how ultrasonic irradiation affects the
material’s supercooling characteristics. They performed tests that involved cooling the material
at a rate of 0.6 K/min, one set with ultrasonic irradiation and another set without. They found
that without ultrasonic irradiation, the supercooling amount was between 14-19 K, which is a
temperature range of about 5 K. When ultrasonic irradiation was applied while cooling, the
supercooling amount dropped to 0 K, with a temperature range of about 1 K. They identified
this as an important result, showing that even at a very low degree of supercooling, ultrasonic
irradiation can induce primary nucleation when it will not spontaneously occur. They also
claimed these results implied a sample that is below the melting point can be triggered to
nucleate at any point in time simply by introducing the ultrasonic irradiation.
Kurotani et al. (2009) observed supersaturated solution amino acid nucleation behavior
when different levels of ultrasonic irradiation were applied. The amino acids studied were L-
Arginine (L-Arg) and L-Serine (L-Ser). They cooled the solutions down to 30°C (below the

19
saturation temperature) and immediately irradiated them with ultrasound as soon as that
temperature was reached. For both amino acids, the induction time for primary nucleation
increased with increasing ultrasonic irradiation up to a certain level, after which the induction
time decreased sharply. The reasoning behind this was that at a low level of ultrasonic
irradiation, the energy disrupts sub-nuclei or molecular clusters that would induce primary
nucleation, which would explain the increase in induction time. However, a higher level of
ultrasonic irradiation promotes clustering of the solute and will more easily cause the formation
of a nucleus large enough to form the solid. They also examined the crystal size of the resulting
solids, which correlated directly with the induction time; as the induction time decreased, the
crystal size decreased while the number of crystals increased, and vice versa for an increase in
induction time.
2.3 DOUBLE EMULSION ENCAPSULATION
Cohen et al. (1991) were looking to improve the therapeutic efficiency of proteins by
encapsulating them in a poly(lactic/glycolic acid) (PLGA) shell, which would then release the
proteins at a controlled rate over a period of weeks or months by allowing the proteins to diffuse
through pores in the polymer matrix. They used a double emulsion encapsulation process,
specified as a modified solvent evaporation method. They first dissolved 10 mg protein in 50 µl
double-distilled water, added this to a solution of 1 g PLGA dissolved in 1 ml dichloromethane
(DCM), and stirred the solution with a vortex mixer for 1 minute. This emulsion was then
poured into 2 ml of aqueous 1% poly(vinyl alcohol) (PVA) solution saturated with DCM and
mixed vigorously with a magnetic bar. Finally, they transferred this double emulsion to 200 ml
0.1% PVA aqueous solution and stirred for 3 hours at room temperature until the DCM was

20
mostly evaporated. Centrifugation was used to collect the microcapsules, and the capsules were
freeze-dried into a powder. They found that the capsules they synthesized encapsulated 60% of
the protein, and released 70-80% over the first day of release experiments. By varying different
factors of the process or materials, such as PLGA molecular weight, organic phase volume, and
percentage of protein loading, they found they could also alter the rate at which protein was
released.
Hildebrand and Tack (2000) implemented a double emulsion technique to encapsulate
peptides or proteins in poly(lactic acid) (PLA). They mixed the organic phase (composed of an
organic solvent and polymer) with a small amount of aqueous phase (composed of peptides or
proteins dissolved in water), slowly added this to an aqueous surfactant solution, and stirred
under partial vacuum conditions to form microcapsules containing the aqueous drug solution.
The formed microcapsules had particle diameters of approximately 1-10 µm.
Sahoo et al. (2002) examined the effects of residual PVA on synthesized PLGA
nanoparticles containing bovine serum albumin (BSA). In order to create the capsules, they
emulsified 300 µl of an aqueous 10% w/v BSA solution in an organic phase containing 90 mg
PLGA and 50 µg of 6-coumarin (to act as a fluorescent dye) dissolved in 3 ml chloroform. This
water-in-oil emulsion was then further emulsified in a 12 ml aqueous PVA solution, and stirred
with a magnetic bar overnight to evaporate the chloroform. The amount of PVA in the outer
phase was varied from 0.5 to 5% w/v to determine its effects. They then recovered the
nanoparticles by ultracentrifugation, washed them twice with water, and lyophilized for 2 days.
They discovered that by increasing the PVA concentration in the external aqueous phase from
0.5 to 5% w/v, the amount of residual PVA associated with the nanoparticles increased from
about 2 to 5% w/w. The particles’ mean diameter decreased from 520 to 380 nm with this

21
increase in PVA concentration, along with other changes, including a decrease of zeta potential
values, an increase in surface hydrophilicity, an increase of protein loading from 19 to 24% w/w,
and an increased rate of BSA released from the nanoparticles. They concluded by claiming
residual PVA is an important formulation parameter that can modify or alter nanoparticles’
properties.
Panyam et al. (2003) observed the relationship between particle size of nano- and
microparticles and polymer degradation and protein release. The nano- and microparticles
consisted of BSA aqueous solution encapsulated with PLGA. They varied the formulation
parameters and preparation conditions to obtain particle sizes of 0.1, 1, and 10 µm. They used a
similar double emulsion process as previously described to synthesize the particles. In order to
mix the double emulsions, they used a sonicator to fabricate the smallest particles, a tissue
homogenizer for the medium-sized particles, and a vortex for the largest particles. The actual
particle diameters from smallest to largest were 0.11±5.0 µm, 1.1±0.1 µm, and 9.4±0.2 µm,
respectively. They discovered that the smallest particles degraded more quickly than the
medium and largest particles. They attributed this to the fact that the smaller particles have a
larger surface area to volume ratio, and thus with a higher surface area, there is higher buffer
contact/penetration into the particles and faster diffusion of monomers and oligomers formed,
catalyzing degradation. The medium and largest particles, however, degraded at about the same
rate. After 90 days, the amount of protein released for the smallest, medium, and largest
particles were 20%, 32%, and 7%, respectively, all of which saw an initial rapid degradation
over the first 20-30 days, after which a much slower degradation rate occurred.
Nkansah et al. (2008) looked at encapsulating ciliary neurotrophic factor (CNTF) in
PLGA microspheres and nanospheres for controlled delivery applications to injured adult central

22
nervous systems. They also used a double emulsion process, mixing 250 µl aqueous solution of
protein (containing CNTF) with 200 mg PLGA dissolved in 7 ml DCM. They sonicated this
mixture on ice for 10 seconds, after which they poured it into 100 ml of a 1% PVA aqueous
solution and homogenized for 1 minute at 3,000 rpm. It was stirred for 3 hours, then centrifuged,
rinsed three times with deionized water, and freeze-dried. The process was slightly altered to
create different capsules, which varied from 4-23 µm for microspheres and 290-340 nm for
nanospheres. The nanospheres, having a larger surface area to volume ratio, tended to cause a
fast initial release, but were preferred in some applications due to their small size allowing them
to reach specific targets.
Boontung et al. (2012) prepared poly(l-lactic acid) (PLLA) capsules encompassing an
aqueous solution containing urea using a double emulsion process. They synthesized the PLLA
in the lab to have a number-average molecular weight of about 3,000 g/mol, low enough to be
able to observe short-term degradation. They dissolved urea in water in a 1:1 ratio for the core
aqueous solution, and then added this to a variable amount of PLLA and 30 mg PVA dissolved
in 10 g chloroform for the organic phase. This was stirred at 800 rpm for 5 minutes, after which
it was added to 90 g of a 1% PVA aqueous solution and stirred again at 800 rpm for 5 minutes.
The chloroform was evaporated overnight to form the PLLA microcapsules. They prepared two
experiments, the first with 1 g core aqueous solution and 9 g PLLA for the organic phase, and the
second with 4 g core aqueous solution and 6 g PLLA. They observed that for both experiments,
the water droplet sizes for the first emulsion spanned a broad range of 1-50 µm, due to the fact
that low speed agitation typically causes polydisperse emulsion sizes. The double emulsion
sizes, however, were much smaller for the first experiment compared to the second. Also, they
found that after the chloroform evaporation step, the first experiment’s small capsules were not

23
able to maintain a spherical shape and major shrinkage occurred due to the large free volume
change. Because the second experiment’s microcapsules were much larger, the free volume
change after chloroform evaporation was small enough for the capsules to maintain their
spherical shape.
Utada et al. (2005) developed a new method to synthesize microcapsules. They utilized
double emulsions to make microcapsules containing an aqueous solution as many have done
previously, but instead of mechanically stirring solutions to obtain the double emulsions, they
created a microfluidic device to form emulsions. A diagram of the device they built is shown in
Figure 4. The device consists of two main components: a collection tube and an injection tube.
The collection tube consists of a cylindrical glass capillary tube surrounded by a square glass
tube. The injection tube involves a tapered cylindrical capillary tube, with the tapered end facing
the collection tube. The innermost fluid, or the core aqueous solution, is pumped through the
injection tube, while the middle fluid, or the organic polymer solution, is pumped through the
outer coaxial region so as to form a flow at the exit of the injection tube. The outermost fluid, or
the outer aqueous solution containing surfactant, is sent through the outer coaxial region from the
opposite direction, and all three fluids are forced into the collection tube. As these fluids flow
into the collection tube, double emulsions are formed and can be collected at drop formation
frequencies of between approximately 100 and 5000 Hz. They discovered that they could
change the drop size by using smaller or larger exit orifices, and that the double emulsions they
made were very uniform in size, forming droplets with a polydispersity of less than 1%. They
also found that by controlling the flow rates of the three fluids, they could control many aspects
of the resulting microcapsules, including capsule diameter, shell thickness, and number of
smaller aqueous emulsions inside the larger organic emulsions.

24
Shum et al. (2008) prepared double emulsions containing water with a middle organic
phase consisting of phospholipids dissolved in toluene and chloroform using the microfluidic
device as described earlier. Their goal was to create phospholipid vesicles around the inner
phase. Their outer fluid was either a 10 wt% PVA solution or 40 vol% glycerol and 2 wt% PVA
solution. They used flow rates for the inner, middle, and outer phases in the vicinity of 220, 800,
and 3500 µl/hr, respectively, to create double emulsions with outer radii between 60 and 100 µm
and inner radii between 40 and 60 µm. Once the double emulsions were collected and the
organic solvent began to evaporate, the phospholipids became concentrated and were forced to
form around the inner phase inside the oil droplet. If the solvent was evaporated slowly enough,
the phospholipid vesicle was able to escape the oil droplet without rupturing.
Kong et al. (2013) manufactured alginate/PLGA and PLGA/alginate core-shell
microspheres using a microfluidic device for use in biomedical applications. They formed
W/O/W double emulsions (for alginate-PLGA core-shell microspheres) by using 0.5% sodium
alginate and 10% w/v PVA in deionized water for the inner phase, 20% w/v PLGA in DCM for
the middle phase, and 4% calcium chloride with 10% w/v PVA in deionized water for the outer
phase, with typical flow rates for the phases of 200, 800, and 2000 µl/hr, respectively. They also
formed O/W/O double emulsions (for PLGA-alginate core-shell microspheres) with 8% w/v
PLGA dissolved in DCM for the inner phase, deionized water containing 0.5% w/v sodium
alginate and 1% w/v PVA for the middle phase, and 10% w/v span 80 in toluene for the outer
phase, with typical flow rates of 400, 500, and 500 µl/hr, respectively. Because the middle phase
of the O/W/O double emulsion had a viscosity that was 27.5 times higher than the outer phase,
the geometry of the device was slightly modified so that the velocity of the middle phase was
increased substantially due to a decrease in the jet radius from the tapered end of the injection

25
tube. They discovered that by slightly altering the device geometry or varying the flow rates of
the three phases, they could maintain a high degree of control over the size of emulsion droplets
and thickness of the resulting microspheres’ shells. Regarding the properties of the different
microspheres, they found advantages for each. For the alginate-PLGA microspheres, they
observed higher loading efficiency for hydrophilic materials, and also more controlled
prevention of undesired core material leakage. For the PLGA-alginate microspheres, they
discovered that because the alginate shells force drugs to diffuse through their matrices before
release, the initial release rate was decreased and the microspheres could release the core
material for a longer period of time.
2.4 MATRICES CONTAINING PRECIPITATES
Braem et al. (1987) examined a model for the calculation of Young’s modulus of dental
composites that consisted of a relatively soft resin containing relatively stiff particles, or fillers.
They looked at two types of composites: self-cured composites (SCC) which cure by mixing the
base monomer and catalyst paste, and light-cured composites (LCC) which cure after being
irradiated with 400-500 nm visible light. The 55 samples were acquired experimentally or
commercially. They measured the modulus by striking the hanging samples transversely with a
small metal hammer and measuring the oscillations and converting this to find Young’s modulus.
By measuring the moduli of the various samples, they discovered that there was an exponential
dependence of the modulus against the filler volume fraction. This model fits between the
parallel and series models for composite properties.
Chantler et al. (1999) built upon the previous model on the premise that it failed when
there is a mismatch between the resin’s and filler’s Young’s modulus of greater than 20 times. If

26
the filler’s modulus was much higher than the resin’s (i.e., goes to infinity), the previous model
predicted a composite with a modulus of infinity even at low filler volume fractions. In order to
correct this, they proposed an additional term in the exponential that represents the mismatch
between the resin and filler moduli, shown below in Equation (11):
𝛽 = !!
!" (!!!!) (11)
where β is the mismatch parameter, C is a term that considers the mismatch in Poisson ratios, Ef
is the filler’s modulus, and Er is the resin’s modulus. They used this further to calculate the
modulus of the composite, Ec, in Equation (12):
𝐸! = 𝐸!(!!!!)!!(!!!)! (12)
where x is the filler volume fraction. They found that β ≈ 1 if the moduli are within an order of
magnitude of each other, making Equation (12) a simple exponential dependence as found
previously. However, they also discovered that with a larger mismatch, β becomes small and the
prediction changes significantly. They observed that this change satisfies experimentally
determined values for the boundary conditions for bulk resin and filler materials.
Guild and Young (1989) looked at the situation when an epoxy matrix is filled with
rubber particles as the filler material. By introducing rubber particles into the resin, the
toughness of the material improves, as well as its adhesive properties. The Young’s moduli of
the resin and rubber particles they used were 3.21 GPa and 0.0004 GPa, respectively. They
predicted the Young’s modulus to decrease nearly linearly with increasing filler volume fraction.
Their model also predicted that the composite’s modulus would be fairly insensitive to the
rubber’s modulus. Because the rubber’s modulus was much lower than the epoxy resin’s
modulus, and the predicted composite’s modulus assumed approximately linear behavior

27
between them as a function of filler volume fraction, any changes in rubber modulus would be
miniscule compared to the overall behavior of the composite.
Giannakopoulos et al. (2011) experimented on epoxy composites containing core-shell
particles as the filler material. They pointed out that although inserting soft rubber particles into
a stiff matrix increased their toughness, it could also reduce the Young’s modulus of the
material. Their sizes were also difficult to control without changing the matrix properties. Their
solution to this was to use core-shell rubber (CSR) particles, which consisted of a soft rubbery
core, typically butadiene, acrylate polyurethane, or siloxane, surrounded by a hard shell, for
which they chose to use poly(methyl methacrylate) (PMMA). Though their shell material was
consistently PMMA, they employed the use of three materials for the core material: MX 125
(styrene-butadiene with a diameter of 100 nm), MX 156 (poly-butadiene with a diameter of 100
nm), and MX 960 (siloxane with a diameter of 300 nm). When mixing the CSR into the matrix
at a ratio of 9 wt.%, they found the particles were well dispersed. The glass transition
temperature was not affected much by the particles, leading them to the conclusion that the
particles and epoxy remained well separated. The unmodified epoxy polymer resin had a
measured Young’s modulus of 2.76 GPa, reducing to 2.0 GPa with 15 wt.% CSR added into the
epoxy. When 9 wt.% CSR was added to the epoxy, they observed moduli of 2.32 GPa for MX
125, 2.33 GPa for MX 156, and 2.21 GPa for MX 960. The model they used to predict the
Young’s modulus of the composite as a function of filler volume fraction is the Halpin-Tsai
model, shown in Equation (13):
𝐸! =!!!!
(!!!!
!!)
(!!!!
!!)
!!!(!!!!
!!)
(!!!!
!!)
𝐸! (13)

28
This model assumes the filler particles are spherical, and a good agreement was found between
the calculated and measured values for the Young’s modulus. They also found a large increase
of fracture energy from 77 J/m2 for the unmodified epoxy resin to 840 J/m2 for the inclusion of
15 wt.% MX 125 CSR particles, indicating a large rise in toughness. They implemented atomic
force microscopy to look at the fracture surfaces of the materials, which led them to discover that
the main toughening mechanisms for the CSR-modified epoxy materials were shear yielding and
plastic void growth of the epoxy.

29
CHAPTER 3
METHODOLOGY
3.1 MATERIALS AND EQUIPMENT
Sodium acetate trihydrate (≥99.0% assay), 87-89% hydrolyzed poly(vinyl alcohol), with
an average molecular weight between 13,000 and 23,000, and polystyrene with an average
molecular weight of 35,000 were purchased from Sigma-Aldrich (St. Louis, MO, USA). Other
analytical-grade chemicals, such as dichloromethane and chloroform, were also supplied by
Sigma-Aldrich. The first source of poly(lactic acid) was Ingeo Biopolymer 3251D, with an
average molecular weight of 55,000, purchased from Natureworks LLC (Minnetonka, MN,
USA). The second source was from cut up PLA plastic egg cartons. The exact specifications for
the egg carton PLA material are unknown. Polydimethylsiloxane (PDMS) was bought as a
Sylgard 184 silicone elastomer kit from the storeroom in the Materials Research Laboratory at
the University of Illinois at Urbana-Champaign, originally from Dow Corning (Midland, MI,
USA). The UV-cured acrylate was purchased as Fotoplast-S/IO from Lightning Enterprises
(Limington, ME, USA).
The mixing plate used to mechanically stir the first type of microcapsules was a 40 to
6,000 rpm mixer purchased from Cole-Parmer (Vernon Hills, IL, USA), while the microfluidic
devices used to create double emulsions for the second type of microcapsules were built by a
personal collaborator. The devices had a collection tube diameter of 900 µm. The flow pumps
connecting the three fluids from syringes to the device were PHD Ultra 2000 Syringe Pumps
from Harvard Apparatus (Holliston, MA, USA). The filters used to remove foreign particles
before use in the microfluidic devices were polyvinylidene fluoride 0.45 µm filters from EMD

30
Millipore (Billerica, MA, USA) for filtering aqueous solutions and Teflon 0.45 µm filters from
Thermo Scientific (Waltham, MA, USA) for filtering organic solutions. The optical microscope
used to capture images of the microcapsules and matrices was a DMR Trinocular Industrial
Research Microscope from Leica Microsystems (Buffalo Grove, IL, USA). The scanning
electron microscope utilized in this study was an S-4700 Cold Field Emission Scanning Electron
Microscope from Hitachi High Technologies America (Dallas, TX, USA). The differential
scanning calorimeter and dynamic mechanical analyzer instruments used to measure the
heating/cooling profiles and stress/strain curves of the samples were the Q20 and Q800,
respectively, from TA Instruments (New Castle, DE, USA). The software used to analyze the
data from these three instruments was Universal Analysis 2000, also from TA instruments. The
small UV lamps used to partially cure the acrylate microcapsules before collection were 365 nm
4 W Compact UV Lamp from UVP (Upland, CA, USA). Finally, the UV lamp used to cure the
acrylate matrices was an Intelli-Ray 400 Shuttered UV Floodlight from Uvitron International
(West Springfield, MA, USA).
3.2 EXPERIMENTAL PROCEDURE
The microcapsules used in this report were synthesized by two different methods:
mechanically stirring solutions to form emulsions and using microfluidic devices to create
double emulsions. Though the methods for both are completely separate, both were studied to a
certain degree to determine the practicality of each for use in this study.
The first type of microcapsules was prepared by mechanically stirring immiscible
solutions. 1 g of either 3251D PLA or the material from the egg cartons was dissolved into 45
ml DCM to form the organic phase, while a 2 ml aqueous solution of 167% w/v SAT in

31
deionized (DI) water was prepared for the inner aqueous phase. The organic phase was stirred at
800 rpm using a mixing plate for 30 seconds, after which the 2 ml aqueous solution was poured
in. The stirring was continued at the same speed for 10 minutes in order to form the W/O
emulsions. When the mixing was completed, the solution was immediately poured into another
beaker containing 70 ml 2% w/v PVA in DI water, which was then stirred at 800 rpm for 1 hour
for the formation of W/O/W emulsions. After the hour passed, the beaker was left overnight to
allow the DCM to evaporate. The capsules were then collected by three rounds of washing with
DI water, centrifugation, and pouring off the excess water.
The second type of microcapsules was made by forming double emulsions in
microfluidic devices. Three syringe flow pumps were used for the three phases for the double
emulsions: 67% w/v SAT in DI water for the inner phase, either 10% w/v polystyrene in
chloroform or UV-cured acrylate for the middle phase, and 10% w/v PVA in DI water for the
outer phase. All of the phases were filtered with Teflon filters for the aqueous phases and
polyvinylidene fluoride filters for the organic phases before microcapsule synthesis to minimize
foreign particles that might disrupt double emulsion formation. When the middle phase was
polystyrene in chloroform, the inner, middle, and outer flow rates were 250, 1000, and 4600
µl/hr, respectively. When the middle phase was acrylate, the flow rates were 2500, 500, and
17000 µl/hr, respectively, and three small UV lamps were placed along the collection tube to
crosslink the acrylate shells to avoid aggregation in the collection vial. After collection, the
capsules were gravity filtered while being washed with DI water, and collected as moist
microcapsules.
The first type of matrix in which microcapsules were dispersed was made of PDMS. In
order to make a sample, PDMS monomer and curing agent were combined in a 10:1 weight ratio,

32
along with any desired capsules or solutions, and mixed with a spatula. The first samples were
PDMS mechanically mixed with 2% w/v SAT in DI water solution, while later samples were
mixed with encapsulated SAT in DI water solutions. The mixing was done carefully so as to
avoid rupturing the microcapsules. After mixing, this was poured into dogbone tensile test
sample molds, which were 4 mm wide along the middle of the sample and 2 mm thick. A
microscope slide was scraped across the tops of the samples to make them as flat as possible.
The filled molds were then placed in a vacuum chamber for 45 minutes to remove air bubbles
that may have been trapped during mixing and pouring, and inserted into an oven to cure
overnight at 70°C.
The second kind of matrix for this project was the UV-cured acrylate. The acrylate was
mixed with the microcapsules very slowly with a spatula. Because the viscosity of the acrylate
was lower than that of the PDMS, it was easier to avoid trapping air bubbles and thus skip the
vacuum step in the process. This solution was then poured into the dogbone tensile test sample
molds, which was put into the UV floodlight chamber at 100% intensity for 10 minutes and
collected.
Various tests were performed on the microcapsules and resulting matrices to examine the
properties. Optical microscopy was performed on the microcapsules to examine their size and
polydispersity, while scanning electron microscopy (SEM) was done on the capsules to look
closely at the surface morphology and shell thickness. Differential scanning calorimetry (DSC)
was executed on the SAT aqueous solutions, microcapsules at various points in the experiments,
and the matrices containing capsules in order to to examine the phase change ability of the core
material. The ramp rate for all measurements was fixed at 10°C/min. Lastly, dynamic
mechanical analysis (DMA) was employed on the acquired dogbone tensile test samples.

33
Because the only property of interest was the Young’s modulus, a relatively small amount of
stress needed to be applied for the samples. The acrylate samples were tested with a preload
force of 0.02N. Measurements were done on the same samples at room temperature and at -80°C
by first doing a quick measurement at room temperature at 5 N/min to a maximum force of 0.75
N, then lowering the temperature to -80°C and repeating the measurement while increasing the
maximum force to 18 N. The reason for the small maximum force at room temperature is to
remain in the elastic region and avoid any plastic deformation while still being able to find a
Young’s modulus. The samples measured contained amounts by volume of 0%, 1%, 2%, 4%,
8%, and 16% acrylate microcapsules, with 4 samples at each concentration. An additional
experiment was performed for two 16% capsule samples where the temperature of the sample
was dropped to -30°C, a short measurement taken, then the temperature equilibrated at -80°C.
Once this temperature was stabilized, it was again raised to -30°C and another measurement
made.

34
CHAPTER 4
RESULTS AND DISCUSSION
4.1 IMAGING
Images were captured of the microcapsules as well as PDMS and acrylate matrices
containing the shock sensitive materials, whether the materials were encapsulated or simply
inserted into the matrix. The first experiment involved the addition of a 2% w/v SAT in DI
water solution to a PDMS matrix, whose optical microscopy results are displayed in Figure 5.
The total amounts of PDMS (including curing agent) and the aqueous SAT solution were 11 g
and 1 ml, respectively. As can be seen, there is a dispersion of particles throughout the matrix.
These particles are very inhomogeneous in size as well as distribution in the matrix, and there is
also an inconsistent appearance of these particles. Some of the particles appear to be mostly
spherical, while others are more oddly shaped; some of them are transparent and others are
darker. No visible change was observed when heating the matrix on a hot plate. When the SAT-
water solution is not encapsulated, the two components can easily separate into sodium acetate
and water while mixing, which leads to the uneven distribution of particles in the matrix. In
order to create a more homogeneous distribution of particles in the matrix, as well as one that is
sensitive to an applied shock, the material needs to first be encapsulated. Otherwise, the
separation of sodium acetate and water prevents the practicality of this idea.
PLA microcapsules were the capsules created using the mechanical stirring to create the
double emulsions, and they are shown using optical microscopy in Figure 6. Because of the
relatively slow stirring speed required to make larger capsules, not enough shear is created to
obtain a monodisperse size distribution. Therefore, the acquired capsules have diameters

35
approximately ranging from 10 to 40 µm. However, note that Figure 6 is taken with the capsules
still in solution. If the capsules are removed from the aqueous solution, they fail as seen in
Figure 7. Figure 7a shows how the capsules shrink in a vacuum as the water easily escapes,
forming wrinkles and the shell material folding over on itself, while Figure 7b reveals cracking
in the shell. The instability of the microcapsules’ shell material prevents their use. Because the
goal is to distribute capsules throughout a matrix, if the capsules release their contents
immediately once out of solution, the point of encapsulation is lost. Consequently, more stable
microcapsules had to be manufactured.
The solution came up with was the usage of microfluidic devices. Figure 8 shows what
this looked like under an optical microscope, with Figure 8a presenting capsules with
polystyrene dissolved in chloroform as the middle phase and Figure 8b acrylate as the middle
phase. Both materials seemed adequate for the shell material of the microcapsules, but acrylate
was chosen as the material to be further studied due to the use of the same acrylate material for
the matrix. Because the material is the same, a better interphase between the microcapsules and
matrix should form, leading to a better transfer of properties from the microcapsules to the
matrix and, by extension, a more efficient composite. It was also believed that acrylate would be
able to retain the water more easily than polystyrene as a shell material, which would be
favorable as they are dispersed in the matrix, but no tests have yet been done to verify this
hypothesis.
An optical microscopy image of the acrylate capsules can be seen in Figure 9, and they
turn out to be much larger than the previous PLA capsules with diameters of approximately 200
to 300 µm. They also appear to be more uniform in size, as the vast majority of them look to be
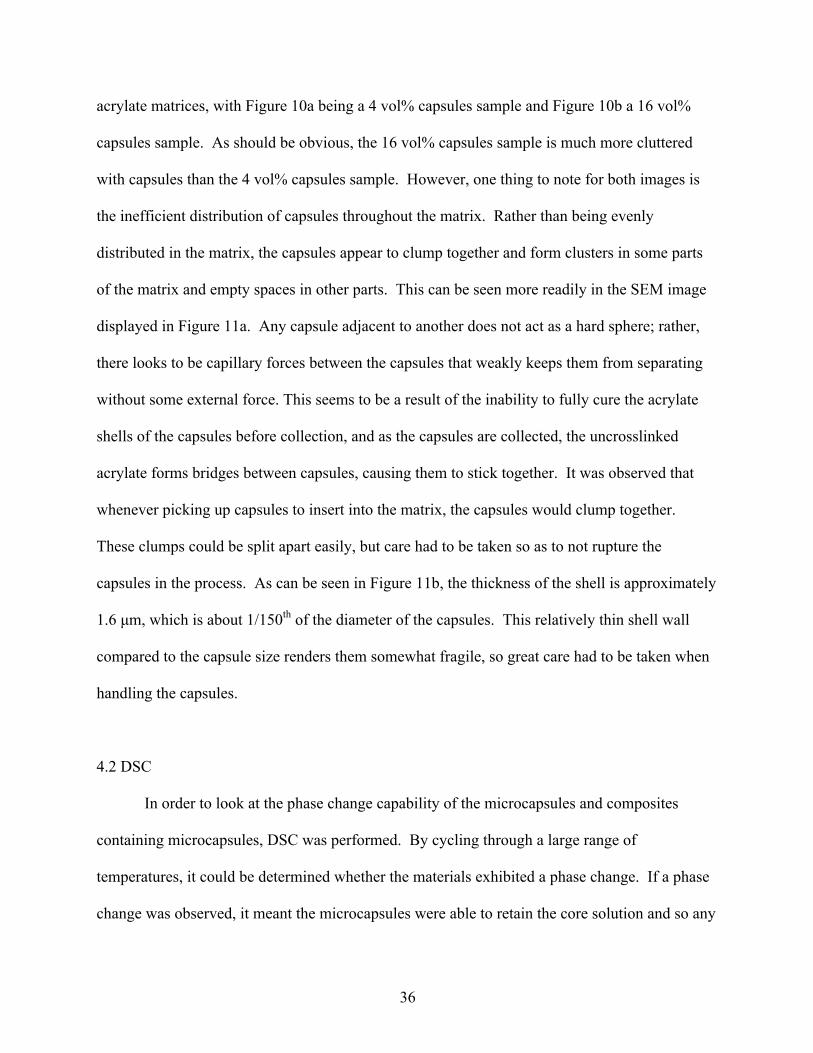
very similar in diameter. Figure 10 displays optical microscopy images of these capsules in
36
acrylate matrices, with Figure 10a being a 4 vol% capsules sample and Figure 10b a 16 vol%
capsules sample. As should be obvious, the 16 vol% capsules sample is much more cluttered
with capsules than the 4 vol% capsules sample. However, one thing to note for both images is
the inefficient distribution of capsules throughout the matrix. Rather than being evenly
distributed in the matrix, the capsules appear to clump together and form clusters in some parts
of the matrix and empty spaces in other parts. This can be seen more readily in the SEM image
displayed in Figure 11a. Any capsule adjacent to another does not act as a hard sphere; rather,
there looks to be capillary forces between the capsules that weakly keeps them from separating
without some external force. This seems to be a result of the inability to fully cure the acrylate
shells of the capsules before collection, and as the capsules are collected, the uncrosslinked
acrylate forms bridges between capsules, causing them to stick together. It was observed that
whenever picking up capsules to insert into the matrix, the capsules would clump together.
These clumps could be split apart easily, but care had to be taken so as to not rupture the
capsules in the process. As can be seen in Figure 11b, the thickness of the shell is approximately
1.6 µm, which is about 1/150th of the diameter of the capsules. This relatively thin shell wall
compared to the capsule size renders them somewhat fragile, so great care had to be taken when
handling the capsules.
4.2 DSC
In order to look at the phase change capability of the microcapsules and composites
containing microcapsules, DSC was performed. By cycling through a large range of
temperatures, it could be determined whether the materials exhibited a phase change. If a phase
change was observed, it meant the microcapsules were able to retain the core solution and so any

37
property changes that form as a result of these phase changes will transfer to the matrix in which
the microcapsules are distributed. An example of this observed phase change can be seen in
Figure 12, which is a DSC run of the acrylate microcapsules between -90-50°C. Unless
otherwise specified, the cooling and heating curves shown are for the first cycle, and the ramp
rate is 10°C/min. As can be seen, when cooling there is an initial large peak, followed by a
smaller range of peaks at a lower temperature, while when heating there is simply one broad
peak. It is hypothesized that the large peak that first appears when cooling is due to
heterogeneous nucleation of the solutions in the capsules, while the range of smaller peaks is due
to homogeneous nucleation. Heterogeneous nucleation more easily occurs, which would explain
the large initial peak as well as the fact that it occurs at a higher temperature, while the range of
homogeneous nucleation peaks may be a result of varying levels of impurities in the capsules.
As more impurities are introduced, nucleation occurs at higher temperatures, and the purest
capsules with very few impurities are able to nucleate at the lowest temperatures. The melting of
the solution on the heating curve, on the other hand, is expected to occur at a higher temperature
and be a single peak rather than many as on the cooling curve because of the lack of the
nucleation barrier as seen when freezing a liquid.
One note that should be pointed out is the fact that the solution inside the acrylate
microcapsules is extremely dilute. The concentration of the solution is 67% w/v SAT in DI
water, which corresponds to 24% sodium acetate in Figure 1. The saturation point is well below
room temperature, meaning it is impossible to nucleate a solid at room temperature. This is
reflected in Figure 12, where the first phase transition when cooling occurs at -25°C. The reason
for having such dilute solutions in the microcapsules is that it is currently very difficult to
encapsulate unstable materials using the microfluidic device.

38
Encapsulation of a more reasonably concentrated solution was attempted; however, as the
core solution was being carried from the syringe to the device, small bits of the SAT-water
solution began to nucleate. As these small crystals formed, they flowed through the tube until
they reached the device, where it met the tapered end of the injection tube and clogged the flow,
causing problems in the formation of the double emulsions and essentially breaking the device
due to misalignment. Therefore, the temporary remedy to this was to make the core solution so
dilute that it would not nucleate and cause problems in the encapsulation process. Although this
prevents the premature nucleation, it again requires a much lower temperature to nucleate.
Alternatives to this remedy have been considered. One suggestion is to sufficiently heat the
syringe, tubing, and device enough to remain above the saturation point even with the more
concentrated solution, preventing this nucleation. This would enable the use of a more desirable
concentration, but the compatibility of the device (and possibly the microcapsules as they are
being created) with the increased heat would need to be closely looked into. Another proposal to
avoid the nucleation is to continue with the less concentrated core solution, but somehow remove
a highly controlled amount of water from the capsule so as to increase the concentration of SAT.
This could be done either by closely studying the rate of water loss over time at certain
temperatures and utilizing this to allow a certain amount of water to be released before insertion
into the matrix, or if the shell material was designed so as to absorb a precise amount of water
from the core solution, that could also increase the SAT concentration. Nonetheless, this area of
research was not able to be explored for this report, but can be investigated for future
improvements.
Once the acrylate capsules were made with the diluted core solution, they were dispersed
into a PDMS matrix, which was then cured in the procedure described above. DSC was run on

39
cured PDMS without capsules, as well as PDMS containing 20% capsules by volume, shown in
Figure 13a and 13b, respectively. As can be seen, the two curves look practically identical for
both cooling and heating. This means that between -90°C and 50°C, there is no new phase
transition brought on by the acrylate microcapsules as there should be as evident in Figure 12. In
order to look at this, two individual steps along the curing process were looked at to figure out
which causes the problem in microcapsule core retention. As part of the PDMS curing process, a
vacuum is applied for 45 minutes to remove air bubbles, after which it is placed in a furnace at
70°C overnight to cure. Some capsules by themselves were placed in a vacuum for 45 minutes
and in a furnace at 70°C overnight and DSC performed on each of them to see how the phase
transition is affected. The results are shown in Figure 14, with Figure 14a being the curve for
microcapsules after the 45-minute vacuum and Figure 14b for after the overnight oven curing.
Looking at Figure 14a, it is interesting to note that there is still a phase change observed
by the microcapsules, but it looks slightly different than what is seen from Figure 12. There is
no large peak possibly representing the heterogeneous nucleation; rather, there is a range of
peaks similar to that of the microcapsules without anything done to them, of a very similar area
but occurs about 11°C lower. It is possible that the vacuum applied to the microcapsules allows
any residual water on the outside of the capsules to evaporate, which could be the cause of the
large heterogeneous nucleation peak in Figure 12 that is absent in Figure 14a, and the range of
peaks seen in both is the phase change of the solution inside the capsules. If this is the case, the
amount of residual water outside the capsules initially is actually more than what is inside, with
the larger heterogeneous nucleation peak in Figure 12 having an enthalpy of 79.93 J/g and the
smaller homogeneous nucleation peak an enthalpy of 51.16 J/g. When storing the capsules

40
inside a closed vial, the environment does become humid, so this discovery would be consistent
with this observation.
This is very different from what is observed in Figure 14b, where there is no noticeable
phase change at similar temperatures to what is seen before. Rather, it remains very flat through
both cooling and heating except for an extremely small peak slightly below room temperature
likely due to the acrylate shell, sodium acetate, or residual PVA left over from the microcapsule
synthesis. This indicates that the capsules are unstable at higher temperatures, and that even at
70°C, the water from inside the capsules is able to evaporate. This looks to have been the cause
of the disappearance of the phase change for capsules in PDMS, and because the higher
temperature is vital for the PDMS curing process, the necessity for a different matrix in order to
preserve the capsules’ contents during the curing.
The same DSC experiments were performed on the acrylate matrix with and without
capsules, and this is shown in Figure 15, with Figure 15a being of the acrylate matrix without
capsules and Figure 15b being the matrix with 16% capsules by volume. The case in Figure 15a
with the acrylate matrix on its own is as was expected: a generally flat curve for both cooling and
heating that indicates no phase changes exist in the temperature range between -90°C and 50°C.
This time, the case in which capsules were introduced led to a measurement of the desired phase
change, as seen in Figure 15b. With 16% acrylate capsules by volume, the homogeneous peaks
again appear as in Figure 12 and Figure 14a, but this time the capsules are dispersed into the
cured acrylate matrix. The enthalpy associated with the nucleation is much lower at 8.625 J/g
compared to the original 51.16 J/g, but that decrease is expected since this the sample only
contains 16% microcapsules, leading to a predicted enthalpy of 8.186 J/g. This is a percent error
of 5.1%, well within the margin of error associated with inconsistent distribution of capsules

41
within the matrix. With the microcapsules having retained their aqueous core solutions,
lowering the temperature sufficiently should cause the solutions to nucleate into a solid,
dramatically increasing the Young’s modulus of the capsules and, by extension, the composite.
A confirmation of this result is given in Figure 16, which displays the DSC cooling and
heating curves of the microcapsules after having been exposed by themselves to 10 minutes of
the floodlight chamber at 100% intensity, as the acrylate matrix is in order to cure. The
microcapsules retain the ability to observe phase changes even after this exposure, which allows
the use of this type of cured matrix. However, one thing to note is the fact that the enthalpy
associated with the cooling phase change is only 13.61 J/g. These are capsules by themselves
without being dispersed in a matrix, indicating that there is somehow a loss of 73.4% of the
enthalpy accompanying the phase change. It is also noted that upon taking out samples from the
UV floodlight chamber, they were somewhat warm from materials in the chamber absorbing part
of the UV radiation. This could lead to partial instability of the capsules, as previously looked
into in Figure 14b. However, because a small amount of the phase change ability remains, it is
speculated that only some of the core solution leaves due to the increase in temperature.
Looking back at Figure 15b, when the capsules are dispersed into the acrylate matrix before
shining UV light on the sample to cure, virtually all of the core solution remained even after the
UV exposure. Therefore, it is believed that the acrylate matrix reinforces the shell material on
the microcapsules, and in doing so protects the capsules from releasing their contents. If this is
the case, it may be questioned why the PDMS matrix did not accomplish the same microcapsule
protection as seen in Figure 13b. Because the PDMS takes at least a few hours to cure into a
solid at 70°C, while it is still a viscous liquid, water from the dispersed capsules may be able to
diffuse through it and escape before it hardens. The acrylate matrix, on the other hand, cures

42
much more quickly into a solid, while the increase in temperature happens gradually. It is
postulated that it hardens quickly enough and the temperature increases slowly enough that the
matrix is able to protect the capsules plenty soon to prevent the release of any water.
Other DSC measurements were made by changing the temperature ramp rate on
measurements of the 16% acrylate capsules by volume in the acrylate matrix to 5°C/min and
1°C/min, as shown in Figure 17a and Figure 17b, respectively. The first thing to note is that the
hysteresis involved decreases with decreased ramp rate. The temperature differences between
the freezing point in the cooling curve and melting point in the heating curve for ramp rates of
10°C/min, 5°C/min, and 1°C/min are 47.45°C, 41.10°C, and 34.39°C, respectively. Another
observation to mention is the shape of the three cooling curves in Figure 15b, Figure 17a, and
Figure 17b. As the cooling rate decreases, the nucleation appears less as a broad peak and more
as a range of sharp peaks. This is because when the temperature is cooling at a very slow speed,
only a small number of capsules is able to nucleate at various times, which increases the height
of the curve for a very brief moment. With many microcapsules containing various degrees of
purity, these homogeneous peaks are spread out over a fairly large range, and at the slow
temperature it can be concluded that the majority of the capsules nucleate between about 45°C
and 52°C.
4.3 DMA
In order to measure the Young’s modulus of samples containing various amounts of
capsules, DMA was performed on them, whose results are summarized in Figure 18. Figure 18a
displays the measurements made at room temperature, whereas Figure 18b shows the
measurements made at -80°C. The summary of the values of the Young’s modulus for each of

43
the samples both at room temperature and -80°C, as well as the resulting average and standard
deviations, is shown in Table 2, with the moduli being in units of MPa. Because the
concentration of the core solution in the microcapsules is low enough for the saturation point to
be much lower than room temperature, all the measurements in Figure 18a are with the capsules’
contents being a liquid. In contrast to this, the measurements in Figure 18b are with the contents
being solidified, where judging by the DSC results in Figure 15b, the phase change has definitely
occurred by -80°C. Coupled with both graphs in Figure 18 are the Halpin-Tsai predictions from
Equation (13), with the filler Young’s moduli being equal to the results at 0% capsules and the
filler modulus being 0 MPa at room temperature (for capsules containing a liquid) and 9000
MPa, which is the modulus of ice, at -80°C (for capsules containing a solid).
The Halpin-Tsai predictions do not line up well with the measured values at all. Because
the filler is assumed to have a modulus of 0 MPa at room temperature due to the liquid contents,
the composite’s modulus should decrease with increasing volumetric concentration of
microcapsules as displayed by the Halpin-Tsai prediction. On the other hand, the filler with a
modulus of 9000 MPa compared to the resin modulus at -80°C of 5413 MPa should cause the
composite modulus to increase with increasing volumetric concentration of capsules. However,
both of these results, shown in Figure 18a and Figure 18b, show behavior that is completely
opposite to the expected trends. The modulus at room temperature increases and at -80°C
decreases with increasing volume fractions. This unexpected trend is magnified in Figure 19,
which shows the percent change of the modulus of each sample individually between room
temperature and -80°C. The Halpin-Tsai prediction exhibited is a combination of the predictions
from both cases in Figure 18. Again, the measured values do not match the predicted trend. In
fact, the percent change in modulus appears to decrease with increasing volume fraction.

44
There are many things that could have gone wrong with this experiment that led to these
unexpected results. The first regards the consistency in the samples. As can be seen in Figure
18a and Figure 18b, there is a large standard deviation for each of the groups of samples because
of the great variability as they are made. Since the samples are not made the exact same way as
a machine would be able to, some samples may have defects or cracks in the matrix that would
greatly affect their properties, or an inhomogeneous distribution of microcapsules in the matrix
considering their tendency to aggregate. Because of this, Figure 19 was made to compare one
sample at room temperature to itself at -80°C so as to take the variability in samples out of the
equation. However, there is still a very large variability in the results. Another possible problem
relates to the DMA instrument. The maximum force it can apply to a sample is 18 N, and is
better suited for the measurement of less rigid materials than the acrylate. Especially at -80°C
and with the higher capsule volume fractions, many of the samples’ stress-strain curves were
jagged and it was difficult to find the precise Young’s modulus. This could be due to a poor
interphase between the matrix and filler materials, causing sudden jumps in the stress. There
could have also been condensation on the material at the colder temperature, again causing
discrepancies from one measurement to another.
Another experiment was performed that utilized the knowledge gained from Figure 17b.
Once the sample was loaded, the temperature was dropped to -30°C, which is above the point of
the phase change on the cooling curve at the slow ramp rate, meaning the microcapsules’
contents should still be liquid. Once a measurement of the modulus was performed, the
temperature was dropped down to -80°C where the capsules’ contents should observe a phase
change into a solid, after which it was again raised to -30°C and another measurement taken.
Since the onset of the melting is well above -30°C, the contents should remain solid. Because

45
both measurements were at the same temperature, any effect the temperature has on the matrix’s
modulus is negated, and the only change should be in the core solution’s phase. This was
accomplished for two samples, both with 16% capsules by volume. The first sample saw its
modulus increase from 2280 to 2467 MPa, while the second observed an increase from 1465 to
1823 MPa, which are associated with increases in moduli of 8.2% and 24.4%, respectively.
Although with only two samples having been measured thus far, no conclusion can yet be drawn,
the results are promising and may be able to lead to later proofs of the practicality of this
concept.

46
CHAPTER 5
CONCLUSIONS
The encapsulation of shock sensitive materials and their dispersion into a matrix was
performed in this study. Two encapsulation processes were attempted: mechanically creating
double emulsions using PLA as the shell material, and utilizing a microfluidic device to form
double emulsions with PS or acrylate as the shell material. The size and morphology of
microcapsules synthesized using each method were examined using optical microscopy and
SEM, and it was determined that the PLA microcapsules were much smaller and more
polydisperse, with diameters ranging from about 10 to 40 µm, while the PS and acrylate
microcapsules were larger and less polydisperse, with diameters between 200 and 300 µm. In a
vacuum, the acrylate capsules were smoother and more stable as compared to the PLA capsules,
whose shell would often crack or form wrinkles. Because of the improved stability of the
acrylate microcapsules from the microfluidic device compared to those made with PLA shells
and mechanically stirred, those were chosen for implementation into a matrix to examine
property changes.
Phase changes of the acrylate microcapsules and matrices containing microcapsules were
looked at using DSC. A wide temperature range of -90°C to 50°C was used so as to encompass
any phase change without going too low for the instrument to measure or high enough for the
water in the capsules to boil. Within this range, the acrylate capsules observed phase changes
upon cooling at -25.35°C as well as at -48.58°C, and one phase change at 1.74°C upon heating.
The reason given for two exothermic peaks upon cooling was that the first, higher temperature
peak was due to heterogeneous nucleation of residual water on the capsules, while the second,

47
lower temperature peak was a result of more homogeneous nucleating water inside the capsules.
This phase change disappeared if the capsules were subjected to a vacuum or 70°C temperatures
as was required to cure the PDMS matrix, and so it was determined that a matrix cured using a
different curing method than thermal energy was needed. The chosen matrix was acrylate, the
same material as was used for the microcapsule shell. After exposure to the same UV conditions
as the acrylate matrix needed in order to cure, the microcapsules maintained the phase change.
The exact point of the cooling and heating phase changes for acrylate matrices containing
microcapsules were observed to shift depending on the DSC ramp rate, with the difference
between them being smaller for slower ramp rates due to decreased hysteresis.
Finally, DMA was carried out to look at the composite properties of the matrices
containing capsules. The Halpin-Tsai predictions showed that the Young’s modulus should
increase when the temperature is -80°C with increasing capsule volume fraction in the composite
because of the phase change into a stiff solid, while it should decrease with increasing capsule
volume fraction at room temperature because the capsules’ contents remain liquid. However,
this was not seen in the measured properties, as the moduli of the samples appeared to increase at
room temperature and decrease at -80°C with increasing volume fraction. Many reasons for
these unexpected results were suggested. The samples made were inconsistent in moduli
because of the inconsistencies in the sample making process, which could form cracks or
imperfections in some but not in others. The distribution of capsules in the matrices was also
inconsistent, with the capsules often clumping together. The DMA instrument is more designed
for less rigid samples, as the high stiffness of the acrylate made it difficult to obtain good
readings.

48
The results of these experiments show that although a dilute aqueous SAT solution could
be encapsulated in acrylate capsules, the expected effect of observed phase changes on the
composite properties has not yet been seen. The difference in temperatures caused a change in
the matrix properties as well, which throws another experimental variable into the mix. With so
many variables in the equation, processes or experiments need to be more consistent so as to
remove these variables and make for a more controlled study. The samples need to be more
uniform from one to another; more samples need to be made so as to have a better represented
group of samples for various volume fractions; the instruments may need to be better suited to
accurately measure the properties of the prepared samples. If these sorts of modifications are
made, the resulting experiments may show the desired results to prove the hypothesis that these
encapsulated shock-sensitive materials are be able to change the properties of the matrix based
on reversible phase changes and provide a platform from which other applications can be
discovered.

49
TABLES AND FIGURES
Table 1. Table showing how certain properties of SAT-water solutions change as a function of SAT:water ratio.

50
Table 2. Table summary of the Young’s modulus for each of the 4 samples at room temperature and at -80°C, which each group of samples also having their average and standard deviation calculated. Units for the moduli are MPa. Room Temp 0 vol% 1 vol% 2 vol% 4 vol% 8 vol% 16 vol% Sample 1 412.2 721.4 351.5 531.9 841.2 976.6 Sample 2 745.8 764.9 277.5 663.7 553.3 860.2 Sample 3 569.5 660.0 831.3 621.6 655.7 578.1 Sample 4 429.8 393.1 667.3 608.2 581.3 551.0 Average 539.3 634.9 531.9 606.3 657.9 741.5 St. Dev. 154.6 166.8 261.5 55.0 129.6 210.1
Temp = -‐80C 0 vol% 1 vol% 2 vol% 4 vol% 8 vol% 16 vol% Sample 1 6308.0 1934.6 4280.1 6070.4 4936.2 3458.4 Sample 2 2259.4 2308.8 6291.8 4288.2 2692.3 2407.9 Sample 3 3194.6 3955.0 5995.0 4129.0 2195.8 1433.5 Sample 4 9889.8 5810.2 5218.5 4178.9 3263.5 3841.7 Average 5413.0 3502.2 5446.4 4666.6 3272.0 2785.4 St. Dev. 3450.1 1771.4 899.6 938.2 1192.2 1086.1

51
Figure 1. Phase diagram of sodium acetate and water. Phases present for each region are as follows. A: Vapor, B: Anhydrous sodium acetate and water vapor, C: Liquid sodium acetate solution, D: Sodium acetate in liquid state and water in solid state, E: Water in solid state and sodium acetate trihydrate, F: Solid sodium acetate trihydrate with excess liquid water (not supercooled), F: Liquid sodium acetate trihydrate and water (when supercooled), G: Anhydrous sodium acetate in liquid, brine type of phase, H: Solid sodium acetate trihydrate and solid anhydrous sodium acetate (not supercooled), H: Liquid sodium acetate trihydrate with precipitate of anhydrous sodium acetate (when supercooled).
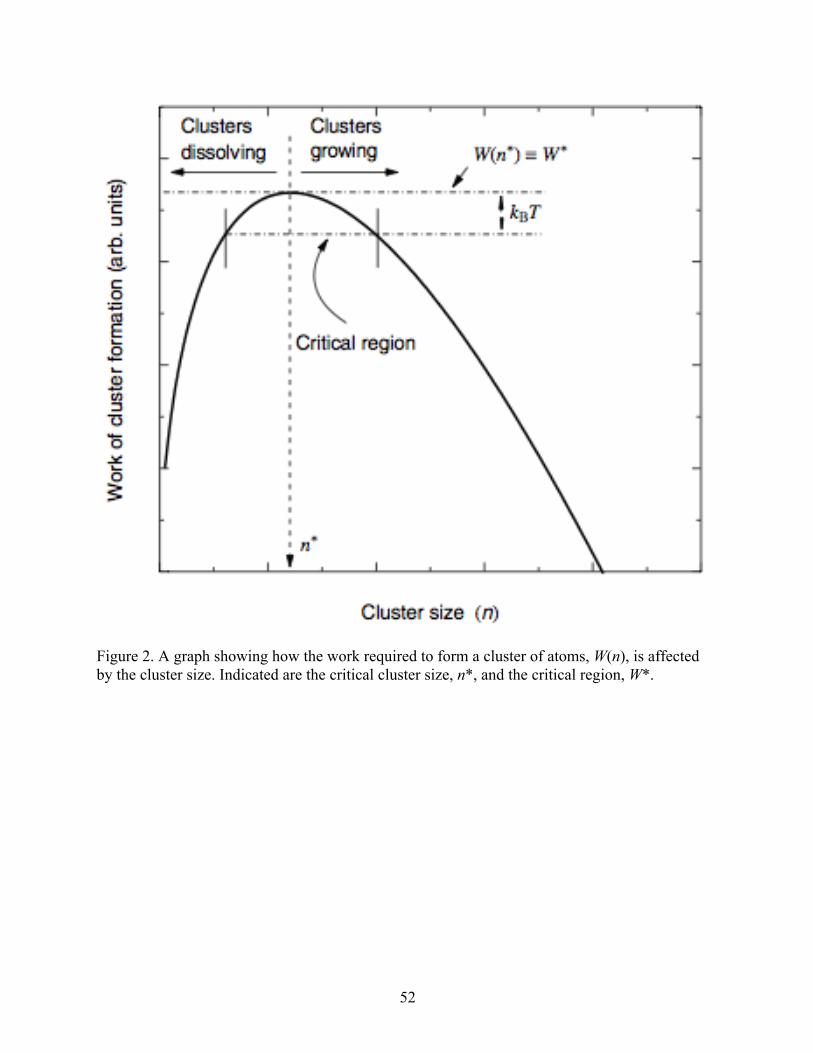
52
Figure 2. A graph showing how the work required to form a cluster of atoms, W(n), is affected by the cluster size. Indicated are the critical cluster size, n*, and the critical region, W*.

53
Figure 3. A diagram showing the relationship between the solid-surface, liquid-surface, and liquid-solid interfacial free energies for heterogeneous nucleation. The inset displays how the geometrical factor, f(θ), varies with contact angle θ.

54
Figure 4. A diagram of the microfluidic device used to produce microcapsules. The “Inner Fluid” refers to the inner aqueous phase, the “Middle Fluid” to the middle organic phase, and the “Outer Fluid” to the outer aqueous phase containing surfactant.

55
Figure 5. Optical microscope image of a PDMS matrix mechanically mixed with 2% w/v SAT in DI water solution.

56
Figure 6. Optical microscope image of PLA microcapsules while still in solution. The capsules are very polydisperse in size, generally ranging from about 10 to 40 µm in diameter.

57
(a)
(b)
Figure 7. SEM images of the PLA microcapsules in vacuum. These show how unstable the capsules are by revealing shell material’s (a) wrinkling and (b) cracking.

58
(a)
(b)
Figure 8. Optical microscopy image of a microfluidic device as microcapsules are being synthesized. The shell materials as shown are (a) polystyrene and (b) acrylate.

59
Figure 9. Optical microscope picture of acrylate microcapsules synthesized in a microfluidic device. The capsules are much larger than capsules synthesized with mechanical mixing, with diameters around 200 to 300 µm.

60
(a)
(b)
Figure 10. Optical microscope image of acrylate matrices containing acrylate microcapsules. The concentration of microcapsules in the matrices in each picture is (a) 4 vol% and (b) 16 vol%.

61
(a)
(b)
Figure 11. SEM images of the acrylate microcapsules synthesized with a microfluidic device. These figures show (a) capillary effects between capsules and (b) thickness of the shell wall, which is about 1.6 µm.

62
Figure 12. DSC of acrylate microcapsules containing a solution of 67% w/v SAT in DI water. Both cooling and heating curves are shown, with a temperature range between -90-50°C and a ramp rate of 10°C/min.

63
(a)
(b)
Figure 13. DSC of (a) cured PDMS without capsules and (b) cured PDMS containing 20% acrylate capsules by volume.

64
(a)
(b)
Figure 14. DSC of acrylate microcapsules (a) after being in a vacuum for 45 minutes and (b) after being in a furnace at 70°C overnight.

65
(a)
(b)
Figure 15. DSC of (a) cured acrylate matrix without capsules and (b) cured acrylate containing 16% acrylate capsules by volume. The ramp rate for both was 10°C/min.

66
Figure 16. DSC cooling and heating curves of acrylate microcapsules after being in the UV floodlight chamber at 100% intensity for 10 minutes.

67
(a)
(b)
Figure 17. DSC curves of a cured acrylate matrix containing 16% acrylate microcapsules by volume with a ramp rate of (a) 5°C/min and (b) 1°C/min.

68
(a)
(b)
Figure 18. DMA results for the Young’s modulus as a function of acrylate microcapsule volume fraction at (a) room temperature and (b) -80°C. Also included are the Halpin-Tsai predictions for the composite’s modulus behavior.

69
Figure 19. DMA results for each sample’s change in Young’s modulus as a function of acrylate microcapsule volume fraction between room temperature and -80°C along with the predicted behavior taken as a combination of the Halpin-Tsai predicted behavior from both temperature experiments.

70
REFERENCES
Boontung, W., Moonmangmee, S., Chaiyasat, A., Chaiyasat, P. 2012. Preparation of Poly(l- lactic acid) Capsule Encapsulating Fertilizer. Advanced Materials Research. Vol. 506. P. 303-306.
Braem, M., Van Doren, V.E., Lambrechts, P., Vanherle, G. 1987. Determination of Young’s modulus of dental composites: a phenomenological model. Journal of Materials Science. Vol. 22. P. 2037-2042. Cao, F., Yang, B. 2014. Supercooling suppression of microencapsulated phase change materials by optimizing shell composition and structure. Applied Energy. Vol. 113. P. 1512-1518. Chantler, P.M., Hu, X., Boyd, N.M. 1999. An extension of a phenomenological model for dental composites. Dental Materials. Vol. 15. P. 144-149. Cohen, S., Yoshioka, T., Lucarelli, M., Hwang, L.H., Langer, R. 1991. Controlled Delivery
Systems for Proteins Based on Poly(Lactic/Glycolic Acid) Microspheres. Pharmaceutical Research. Vol. 8. No. 6. P. 713-720.
Debenedetti, P.G. 1996. Metastable Liquids: Concepts and Principles. Chichester: United Kingdom: Princeton University Press. ISBN 0-691-08595-1. Ghosh, S.K. 2006. Functional Coatings. Weinheim; Germany: Wiley-VCH. P. 12-15, 30, 31, 38.
ISBN 978-3-527-31296-2. Giannakopoulos, G., Masania, K., Taylor, A.C. 2011. Toughening of epoxy using core-shell particles. Journal of Materials Science. Vol. 46. P. 327-338. Guion, J., Teisseire, M. 1991. Nucleation of Sodium Acetate Trihydrate in Thermal Heat Storage Cycles. Solar Energy. Vol. 46. No. 2. P. 97-100. Guild, F.J., Young, R.J. 1989. A predictive model for particulate filled composite materials. Journal of Materials Science. Vol. 24. P. 2454-2460. Herlach, D.M., Matson, D.M. 2012. Solidification of Containerless Undercooled Melts. Weinheim; Germany: Wiley-VCH. ISBN 978-3-527-64793-4. Hildebrand, G.E., Tack, J.W. 2000. Microencapsulation of peptides and proteins. International Journal of Pharmaceutics. Vol. 196. P. 173-176. Hunt, J.D., Jackson, K.A. 1966. Nucleation of Solid in an Undercooled Liquid by Cavitation. Journal of Applied Physics. Vol. 37. No. 1. P. 254-257.

71
Jin, X., Medina, M.A., Zhang, X., Zhang, S. 2014. Phase-Change Characteristic Analysis of
Partially Melted Sodium Acetate Trihydrate Using DSC. International Journal of Thermophysics. Vol. 35. P. 45-52.
Jin, X., Zhang, S., Medina, M.A., Zhang, X. 2014. Experimental study of the cooling process of particially-melted sodium acetate trihydrate. Energy and Buildings. Vol. 76. P. 654-660. Keinänen, M. 2007. Latent Heat Recovery from Supercooled Sodium Acetate Trihydrate Using a
Brush Heat Exchanger. Master’s Thesis. Helsinki University of Technology, Department of Mechanical Engineering. Espoo, Finland. 104 p.
Kimura, H., Kai, J. 1985. Phase Change Stability of Sodium Acetate Trihydrate and its Mixtures. Solar Energy. Vol. 35. P. 527-534. Kong, T., Wu, J., Yeung, K.W.K., To, M.K.T., Shum, H.C., et al. 2013. Microfluidic fabrication
of polymeric core-shell microspheres for controlled release applications. Biomicrofluidics. Vol. 7. No. 044128.
Kurotani, M., Miyasaka, E., Ebihara, S., Hirasawa, I. 2009. Effect of ultrasonic irradiation on the
behavior of primary nucleation of amino acids in supersaturated solutions. Journal of Crystal Growth. Vol. 311. P. 2714-2721.
Leal-Calderon, F., Schmitt, V., Bibette, J. 2007. Emulsion Science: Basic Principles. New York;
New York; USA: Springer Science+Business Media. P. 173-176. ISBN 978-0-387-39683-5.
Lyczko, N., Espitalier, F., Louisnard, O., Schwartzentruber, J. 2002. Effect of ultrasound on the
induction time and the metastable zone widths of potassium sulphate. Chemical Engineering Journal. Vol. 86. P. 233-241.
Miyasaka, E., Takai, M., Hidaka, H., Kakimoto, Y., Hirasawa, I. 2006. Effect of ultrasonic
irradiation on nucleation phenomena in a Na2HPO412H2O melt being used as a heat storage material. Ultrasonics Sonochemistry. Vol. 13. P. 308-312.
Nkansah, M.K., Tzeng, S.Y., Holdt, A.M., Lavik, E.B. 2008. Poly(Lactic-co-Glycolic Acid)
Nanospheres and Microspheres for Short- and Long-Term Delivery of Bioactive Ciliary Neurotrophic Factor. Biotechnology and Bioengineering. Vol. 100. No. 5. P. 1010-1019.
Panyam, J., Dali, M.M., Sahoo, S.K., Ma, W., Chakravarthi, S.S., et al. 2003. Polymer
degradation and in vitro release of a model protein from poly(D,L-lactide-co-glycolide) nano- and microparticles. Journal of Controlled Release. Vol. 92. P. 173-187.

72
Sahoo, S.K., Panyam, J., Prabha, S., Labhasetwar, V. 2002. Residual polyvinyl alcohol associated with poly (D,L-lactide-co-glycolide) nanoparticles affects their physical properties and cellular uptake. Journal of Controlled Release. Vol. 82. P. 105-114.
Shum, H.C., Lee, D., Yoon, I., Kodger, T., Weitz, D.A. 2008. Double Emulsion Templated
Monodisperse Phospholipid Vesicles. American Chemical Society. Vol. 24. P. 7651-7653.
Utada, A.S., Lorenceau, E., Link, D.R., Kaplan, P.D., Stone, H.A., et al. 2005. Monodisperse
Double Emulsions Generated from a Microcapillary Device. Science. Vol. 308. P. 537-541.
Wada, T., Yamamoto, R., Matsuo, Y. 1984. Heat storage capacity of sodium acetate trihydrate during thermal cycling. Solar Energy. Vol. 33. No. 3/4. P. 373-375.