Embed Size (px)
Citation preview

Employee Attitude and Engagement in the S Business Unit of Iamrod Eireann
By
Louise Morgan
M.A. in Human Resources
2007

Contents Page No
Title Page ... ... ... ... ... ... ... ... iContents ... ... ... ... ... ... ... ... iiList of Charts, figures etc.......... ... ... ... ... ... ivAbstract ... ... ... ... ... ... ... ... xIntroduction ... ... ... ... ... ... ... ... xiProposal ................................ ... ... ... ... .. xii
Chapter 1: Aims and Objectives................................................... 011 Research Aims ... ... ... ... ... ... 011.1 Areas of interest ... ... ... ... ... ... 011.2 Research Obj ecti ves ... ... ... ... ... 021.3 Hypothesis ... ............... ............... ... ... 03
Chapter 2: Review of Relevant Literature andAvailable Data ....................................... ... 04
2.1 The context for looking at employee engagement... ... 042.2 Why it is of importance and interest? ... .............. ... 052.3 Human Capital Management... ... ... ... 062.4 Human Capital Management - Metrics............ ... ... 072.5 The Five Human Capital Driver Categories... ... 082.6 What is employee engagement?.......... ... ... 092.7 Performance ... ... ... ... ... ... ... 10
2.8 The Importance of High PerformingIndividuals in Organisations ... ... ... ... ... 11
2.9 Driving Performance and RetentionThrough Employee Engagement ... ... ... ... 13
2.10 Customer Service connections ... ... ... 152.11 Discretionary behaviour ... ... ... ... ... 162.12 The bespoke combination of aspects of engagement... ... 172.13 Conceptualisation of engagement constructs ... ... ... 18
2.14 Psychological engagement ... ... ... ... ... 20
2.15 Psychological safety and engagement... ... ... ... 212.16 Psychological availability and engagement ... ... ... 222.17 Psychological security and engagement ... ... ... 24
2.18 Job Involvement ... ... ... ... ... 25
2.19 Communication ... ... ... ... ... ... 252.20 Work-life balance ‘ ............... ... ... ... ... 262.21 Components of Employee Engagement ... ... 272.22 Drivers of Employee Engagement ... ... ... 29

Chapter 3: Methodology, Questionnaire Designand Sampling ....................................... 35
3.0 Participants 353.1 Questionnaire Design ... 363.2 Measures ..: 373.3 Details on various sections of questionnaires... 383.4 Scales.................................................. 423.5 Other measures 443.6 Administration of Questionnaire 463.7 Data Analysis .......................... 47
Chapter 4: General overview of respondents ............... 51
Chapter 5: Engagement................................................... 535 Introduction ...................................... 535.1 Overall Engagement................................................... 545.2 Cognitive Engagement ..............5.3 Emotional Engagement .............. 565.4 Physical Engagement 595.5 Engagement by Age 605.7 Advocacy 645.8 Context 665.9 Management in the Southern & Western Business Unit ... 675.10 Drivers of engagement ....................................... ... 71
Chapter 6: Working L i f e ........................... 756 Introduction...................................... 756.1 Grade.................................................. 766.2 Flexible Working .............. 776.3 Working hours .......................... ... . . . . 776.4 Work life balance ....................................... 816.5 Bullying and Harassment ....................................... 82
Chapter 7: Management, Leadership and Communication 857 Introduction .......................... 857.1 What employees think about their managers? 857.2 What employees think about their senior managers? ... 907.3 Communication ... ............ 95
Chapter 8: Attitudes to Work .......................... . 101
8 Introduction .......................... 1018.1 Meaningfulness .............. 1028.2 Job satisfaction ................................................... 1048.3 Experiences of Stress and Pressure ... 1108.4 Emotional Responses to Work 1158.5 Organisational Commitment and Loyalty 119
iii

Chapter 9: Outcomes*. 124
9 Introduction ...................... ... ... 1249.1 Individual performance ... ... ... 1249.2 Intentions to quit .... ... ... 1259.3 Sickness Absence .............. ... 128
Chapter 10: Findings and ManagementImplications »»* ••• ••• 133
10.1 ' Introduction ...................... ... ... . 13310.2 Model of Engagement... ... ... ... 13310.3 Factors for consideration ... ... ... 13310.4 Gender...................................... ... ... 13610.5 Managers and non-managers ... ... ... 13710.6 Grade Categories ..... ... ... 13810.8 Train Hosts drivers of engagement
in order of strength ... ... ... ... 14010.9 Train Dri vers , drivers of engagement
in order of strength ... ... ... ... 14010.10 Managerial Issues ... ... ... ... 14110.11 Findings - Working Life ... ... ... 14210.12 Findings - Management, Leadership
and Communication ... ... ... ... 14410.13 Findings - Attitudes to Work ... ... ... 14510.14 Findings - Engagement ... ... ... 14710.15 Findings and Outcomes ... ... 149
Chapter 11: Conclusions......................................... 150
Chapter 12: Recommendations for further research 154
Bibliography
Appendix 1: Cover letter issued with questionnaire
Appendix 11: Questionnaire
Appendix 111: Engagement Levels
Appendix IV: Staff Numbers and Locations
Appendix V Questionnaire Data Sheet
Appendix VI Previous Culture Survey
iv

List of Figures, ’ Charts j-Lists & Illustrations. ' 'f .Page No. .....
Fig 1 Locke & Latham’s (2000) High Performance Cycle
Fig. 2 Performance vitality curve (Buchanan, L., 2004) 16
Fig 3 The Ivey Business Journal Jan/Feb 2001 Essentials for loyalty ... 19
Fig 4 The Ivey Business Journal Jan/Feb 2001 Reasons for desertion 20
Fig 5
Chart 1
Thackray, J. (2001,March 15). Feedback for real. Gallup
Management Journal, Questions to Determine Employee
E ngagem ent.........................................
Age profile of employees in S&W
25
51
Chart 2 Engagement across all measures all employees 54
Chart 3 Cognitive Engagement
Chart 4 Levels of engagement for all three dimensions
Chart 5 Emotional Engagement Males v Females
Chart 6 Emotional Engagement
Chart 7 Physical Engagement
Chart 8 Physical Engagement Males v Females
Chart 9 Engagement by Age Comparison..............
Chart 10 Disengagement by Age comparison
Chart 11 Cognitive Engagement Females v Males
Chart 12 Emotional Engagement Females v Males
56
57
57
58
59
60
60
62
62
63
Chart 13 Physical Engagement Females v Males 63
Chart 14
Chart 15
Chart 16
Chart 17
Chart 19
Chart 20
Chart 21
Chart 22
Chart 23
Chart 24
Chart 25
Chart 26
Fig 6
Employer Advocacy All Respondents
Recommend Company to someone seeking seeks
advice about a job opportunity
Proud to tell people who you work for
Performance Vitality Curve ... ................
Cognitive Engagement Senior Managers to
Station Controller level
Emotional Engagement Senior Managers to
Station Controller level
Physical Engagement Senior Managers to
Station Controller level
Advocacy Senior Managers to
Station Controller level
Cognitive engagement drivers ... ...
Emotional engagement drivers
Physical engagement drivers ...
Employee numbers v actual ...
Availing of flexible working ...

Chart 27 Contracted hours v Actual hours
Chart 28 Comparing their emotional and cognitive
engagement levels (Station Managers)
Chart 29 Station Manager v All respondents
future intentions
Chart 30 Work life balance ..........................................
Chart 31 Bullying Harassment by experience ...
Chart 32 Bullying Harassment by type ...
Chart 33 Line Manager Strengths and Weaknesses
Fig 7 Responses to questions on Strengths and
Weaknesses of managers
Fig 8 Makes it clear what is expected of me
Fig 9 Listens if I have a suggestion to make
Fig 10 Treats me fairly ............................ ...
Fig 11 Is committed to Southern & Western Business Unit
Chart 34 Leadership 1 ......................................................
Chart 35 Leadership 2 Senior management vision v
individuals support to achieve objectives

support to achieve organisational objectives
Chart 36 Senior Management vision v individual
Fig 12
Fig. 13
Chart 37
Chart 38
Chart 39
Chart 40
Chart 41 t
Chart 42
Chart 43
Chart 44
Chart 45
Chart 46
Chart 46.1
to 46.4
Chart 47
All respondents to Question 7 Committed to helping Iamrod Eireann achieve its objectives and aims? ...
Engagement of those with support of organisational objectives excluding senior managers
Internal Communications
Credibility of information received
Level v credibility of information
Satisfaction with opportunities for upward feedback
Downward v Upward Communication
Work is meaningful ...
Comparison Manager v non manager meaningfulnessi
Comparison on meaningfulness managers v
non-managers ...
Overall job satisfaction
Senior management vision v individual support
to achieve organisational objectives ...
Job Satisfaction
Comparison Managers v non managers job satisfaction
Chart 48 Stressfulness of job all respondents

Chart 49 Stressfiilness managers v non-managers
Chart 50 . Time under excessive pressure
Chart 51 Control over the way the job is d o n e ..........................
Fig 14 Control over job ....................................................
Chart 52 Looking forward to work all respondents
Chart 53 Looking forward to work Managers v non-managers.
Chart 54 Emotions towards work .................
Chart 55
Chart 56
Chart 57
Chart 58
Chart 59
Chart 60
Chart 61
Chart 62
Chart 63
Chart 64
Chart 65
Fig, 15
Chart 66
Chart 67
Chart 68
Views on working for Iamrod Eireann
In v o lv em en t.........................................
Loyalty .........................................
How much loyalty comparisons
Loyalty to customers and clients
Commitment to helping achieve objectives
Individual Performance ................
Performance comparison ................
Intentions to stay ............................
Consideration of e x i t ............................
Future intentions
Reasons for leaving ............................
Sick leave taken in last year all respondents
Sick leave over 55’s ............................
Sick Absence by gender ................
112
112
113
114
115
116
117
118
118
119
120
121
122
125
126
126
127
127
128
129
130
131
viii

Chart 69 Sick Absence Station Managers v Drivers' .............................. 131
Chart 70 Managerial action, engagement, performance ................ 134
Chart 71 Gender Differences engaged responses to all
engagement questions by self reporting
high performers ... ... ... ... ............ 137
Fig 15 Engagement Drivers Females... ... ... ... ... 137
Fig 16 Engagement Drivers for managers ...... ... ... 138
Fig 17 Engagement Drivers for non-managers ............................. 138
Chart 72 Average Engagement across grade categories ... ... 139
Chart 73 All respondents to work life balance questions ... ... 14
ix

w'?:, ■':". > v ) . ; ^ > - $ -■:^v ^ : - - - ^ ->v> r .
This study is an exploration of the attitudes and levels of employee engagement
in the Southern & Western Business Unit of Iamrod Eireann. It looks at why
employee engagement is of importance under the Human Capital management
concept. Concepts and constructs are explored to contextualise their potential
influence on employee engagement. It is based on a survey was completed in
line with the CIPD (2006) on attitudes and engagement in UK on the general
workforce. It is an exploration of the experience of working life in the Southern
& Western Business Unit in Iamrod Eireann. It tries to capture how meaningful
work is to people, what their general feelings are about work, how well they
think they perform, how much effort they give, how satisfied they are with their
work and interactions with their managers. The study aims to identify the key
drivers of engagement and the managerial actions required to increase those
levels of engagement.

.Introduction i •'• ■'.
Attitude & Engaged Employees Equal Engaged Customers________
Iamrod Eireann want customers to feel as if they belong, since loyal customers
are more resistant to competitors' offers and bring more business to the railway.
Developing the level of customer service required to engender that sense of
loyalty from the public requires committed, enthusiastic employees. The creation
of an environment of employee engagement requires that managers understand
that employees, like all human beings, respond to emotional as much as logical
decision drivers -- what has been termed the "emotional economy," according to
researchers at the Gallup Organization. Such an understanding is the key to
developing strategies to create and nurture an engaged workforce.

Proposal
Attitude & Engaged Employees Equal Engaged Customers
The railway in Ireland has suffered decades of underinvestment to the extent that by the
1980’s government was considering whether or not we really needed one. However a
major incident in Knockrockery in 1995 was the wake up call required. Under the heading
of a “safety’5 investment new life was given to the Irish railway. With the advent of the
Celtic tiger and the consequential identification of the shortfall in infrastructural investment
and the plague of traffic jams the new era of the railway has arrived. The railway as it has
its dedicated tracks was the only public transport lhat could deliver a guaranteejimejravel
time for the public.
While the ongoing investment outlined in Transport 21 see Appendix 1 and the multi
annual budgeting that allows for a rolling capital and infrastructural investment has given
new zest to the railway, j The counter requirement for the railway company has not just been
the delivery of reliability, frequency and expansion of capacity and new routes but the
requirement for a world class customer service ethos. The external threat to the railway is
not just a downturn in investment (economy dependant) but the travelling public’s love of
the car and low cost flights.
The Southern Sc Western Business Unit (S&W) has responsibility for all of the trains from
Westport to Cork (including Limerick;and Galway]to Heuston Station and the intermediate
station on those lines. Commercially it is predominately an intercity traveller but also has a
commuter component on the Portlaoise line which encompasses the Kildare and Laois
xii

commuter belts. The Unit has a turnover of per annum and is growing its revenue by
approximately % per annum.
Structure
The colleague structure is divided into four distinct districts each with a District Manager at
the apex who in turn reports to the General Manager S&W,
• Mainline - Heuston Station and Portlaoise Station plus a number of smaller
locations knownashalts e.g. Hazel Hatch, Clondalkin, Portarlington.
• Limerick - Limerick City Station, Limerick Junction Station, Ennis Station &
Thurles Station plus a number of smaller locations known as halts
• Galway - Galway City Station, Westport Station, Ballina Station, Claremorris
Station, Tullamore Station and Athlone Station plus a number of smaller locations
known as halts
• Cork - Cork Station, Mallow Station, Tralee Station, Killamey Station plus a
number of smaller locations known as halts.
Each station is managed by a Station Manager (16 in all) who has responsibility for the
Station and any of the halts, gates ( where track crosses the road) and signalling operations
in his/her area. Each Station Manager reports directly into the appropriate District
Manager. The Driver Grade reports directly' to the District Manager not the Station
Manager. The Grade of District Traction Executives and District Traffic Executives report
directly to the various District Managers and are responsibility primarily for ensuring that
staff are in competence (fully trained up and up to date with all certification requirements).
Traction deals with Drivers and Traffic deals with Station Operatives, signalling.

Within each Station the station Manager has Station Controllers that manager the staff in
the various locations and ensures the dispatch of the trains incoming and outgoing.
Previous Surveys in Southern & Western Business Unit
A culture survey is carried out in Iamrod Eireann and following a restructuring of the
Operations side of the business the Southern & Western Business Unit was created in late
2003. Only one culture survey since then has results that are specific to that business unit.
The 2005 culture survey carried out across the S&W Business Unit shows the following
analysis of the most successful and least successful items:
ITEM LEVEL
ANALYSIS
MOST SUCCESSFUL ITEMS % positive
The following list presents the top 12 items ranked according to the % who viewed the issue positively
(i.e. strongly agreed or
agreed).
1 Appropriate safety equipment (e.g. PPE) is provided by the company. ... 89
2 Iamrod Eireann is safety conscious organisation. ... 87
3 I receive Rail Brief and Stop Press regularly 87
4 Safety is the prime concern of the company. ... 83
5 Management make people aware of the larnrod Eireann responsibilities regarding safety... ... 81
6 I understand how my role contributes to the business. ... 81
7 The people I work with co-operate to get the job done ... 80
8 I am familiar with the equality policy & procedures in relation to Bullying, Sexual Harassment & Harassment... 79
xiv

Stop Press is a worthwhile staff
9 magazine 77
10 I am happy with the content of both Rail Brief and Stop Press 76
11 There is scope within Iarnrod Eireann to develop knowledge, new skills, and experience. • • 74
12 Appropriate training is provided to support our safety standards. 74
LEAST SUCCESSFUL ITEMS negative
The following list presents the bottom 12 items ranked according to the % who viewed the issue negatively
(i.e. disagreed or strongly disagreed)
l get regular feedback on my
1 performance.
2 People are paid for the level of their performance, not merely for being at work.
3 My manager regularly reviews how I am doing.
4 Management seek views of staff on relevant issues.
5 People are rewarded appropriately for their contribution to the business.
6 Candidates are promoted on the basis of merit.
7 Poor performance is dealt with positively by managers (not ignored).
3 Reward systems are being upgraded positively S
9 Customers describe us as an organisation who pride ourselves on our level of service....
10 Senior management provide clear direction and leadership to take the business forward....
1 1 We fill vacancies with the right people.
12 As a result of the survey, I believe management will carefully consider problems brought to its attention.
74
64
63
61
58
57
56
52
52
51
51
50
Please see Appendix 1 for the Results of the whole culture survey as it relates to the Southern &
Western Business Unit in Iarnrod Eireann.
/XV

The survey was completed in a manner that could not identify grade or District so that it
could guarantee greater levels of anonymity. This is the aspect I wish to examine albeit it
with an attitude and engagement focus only. The culture survey was completed by the HR
\Department in Iamrod Eireann in relation to distribution of questionnaires but completed
questionnaires were returned to Saville and Holsworth for process and issuing of results.
Most Successful Items
On examination of the most successful items which might impinge on attitude/engagement
and ultimately onto customer satisfaction
MOST SUCCESSFUL ITEMS positive
6 I understand how my role contributes to the business.
7 The people I work with co-operate to get the job done
Stop Press is a worthwhile staff
9 magazine
10 I am happy with the content of both Rail Brief and Stop Press
11 There is scope within Iarnrod Eireann to develop knowledge, new skills, and experience.
12 Appropriate training is provided to support our safety standards.
81
80
77
76
74
74
Role clarity, peer co-operation, communication, developmental scope and safety training
score very well.
Least Successful items
On the more negative side the least successful items that impinge on engagement and
ultimately onto customer satisfaction are;
xvi

LEAST SUCCESSFUL ITEMS % negative
Job
Job
Job
Leadership &
Management
Job
Job
Job
Job
Customer
service
Leadership &
Management
Leadership &
Management
I get regular feedback on my
performance.
People are paid for the level of their performance, not merely for being at work.
My manager regularly reviews how I am doing.
Management seek views of staff on relevant issues.
People are rewarded appropriately for their contribution to the business.
Candidates are promoted on the basis of merit.
Poor performance is dealt with positively by managers (not ignored).
Reward systems are being upgraded positively
Customers describe us as an organisation who pride ourselves on our level of service....
Senior management provide clear direction and leadership to take the business forward....
As a result of the survey, I believe management will carefully consider problems brought to its attention.
74
64
63
61
58
57
56
52
52
51
50
Performance monitoring and review is a weakness and I have categorised it under
Leadership & Management, there appears to be much negativity on issues surrounding the
job itself, encompassing such items as promotion, reward and contribution. Of most
concern for the purpose of this project is the high level of awareness that we are not
reaching the mark in relation to customer service levels.
xvii

■ 1 f • ,r ■ * " *1 * v’■ * ' ’:<’ :• ' ' Chapter!. ’ / - • ■ \ • J"- • / . . . ■■ „ *
*' r . . \ .
Research Aims & Objectives : ' , / '1 *
1 Research Aims
The overall aim of this study was to try and find out what encourages employees have
a passion for work that encourages them to the extra mile and do their job to the best
of their ability. High levels of engagement have been associated with a whole range
of beneficial outcomes including high levels of performance. Firstly, I want to find
out if the management of the business unit are themselves engaged. Secondly, and
more particularly, what should managers be doing to proactively encourage employee
engagement. There is a strong culture of us and them in the organisation, so are
different categories of employees engaging at different levels? How do you measure
engagement in the first instance? Are theirdifferent types of engagement and what do
they measure or mean? Most importantly, as engagement is something the
employees’ offer voluntarily and is not part of the employment contract, what can the
organisation do that allows employees become engaged with their work.
1.1 Areas of interest
• What is the level of employee engagement in Iamrod Eireann?
• Are line managers themselves engaged in their work?
• What can line managers do to encourage staff to be engaged?
• What groups/categories of staff are most engaged?
• Does difficulty in gaining entrance to a grade make those employees more
engaged in comparison to others?

• Does employee engagement impact on customer service?
1.2 Research Objectives
• Measure the level of engagement in the Southern & Western Business Unit in
Iarnrod Eireann.
• Is the measurement of employee engagement another Human Resource fad or just
good management?
• What are the conditions required for engagement to take root and prosper?
• How do you get employees engaged in their work?
• Benchmark Iamrod Eireann against the latest CIPD Survey (2006).
1.3 Hypothesis
Hypothesis 1 Colleagues in Iamrod Eireann in particular the Southern &
Western Business Unit (S&W) (the major intercity business
unit) are more engaged than the average worker as per the
CIPD report completed on workers in the UK in 2006.
Hypothesis 2 The drivers of engagement in S&W lie in the hands of
management.
Hypothesis 3 Train Drivers although having gone through a rigorous
selection process are not as engaged as Train Hosts.
Hypothesis 4 Train Hosts (a new customer service grade for on board
customer service) are the most engaged of all staff.
Hypothesis 5 Pay and engagement are not linked
Hypothesis 6 Engaged employees are happier than disengaged employees
2

Hypothesis 7
Hypothesis 8
Hypothesis 9
Hypothesis 10
Significant numbers of employees want to be more involved
and therefore more engaged
Training and development needs are not discussed with
employees and this leads to reduced engagement
Is engagement new or Elton Mayo revisited?
Managerial factors are the major barrier to engagement
3

Chapter 2_______________________ Literature Review________________________
2 ! The context for looking at employee engagement
Elton Mayo’s motivation experiments in Cicero, Chicago, 1927-1932 led
to the proposition that workers are more motivated by emotional rather
than economic factors (by being involved and feeling important), rather
than by an improvement in workplace conditions. He laid the foundations
for later theorists, Hertzberg (Motivation and Hygiene Factors see
Illustration 1 page 32), Maslow (Hierarchy of needs Illustration 2 page 33)
and McGregor’s (XY Theory see Illustration 3 page 34).
Mayo’s theories are just as relevant today, for example, Cary Cooper of
Lancaster University Management School last year published a paper
indicating that the single biggest determinant of organisations productivity
was the degree of engagement that the employees have with the task
(Whiteley, 2006). Over the period, 1927 to 2007, theories have moved
through many iterations from industrial psychology, to total quality
management, to organisational development, to J. Pfeffer (1998) making
connections between effective management of people and business
success, to Human Capital Management theories which are devising
metrics to include employee engagement, to the development of bespoke
interventions to encourage engagement to drive performance levels and
their measurable contribution to the bottom line.
4

2.2 Why it is of importance and interest?
The connection between the attitudes and behaviour of employees and an
organisation’s bottom line was first trumpeted 15 years ago by US retail
company Sears. It dubbed it the 'employee-customer-profit chain' and the
results of putting the idea into practice were spectacular. In a year, Sears'
biggest loss-making division — merchandising — went from a $3 billion
deficit to a net income of $752 million (Management Today; Apr 2007,
p38-43). Since then, various metrics have been devised by HR
consultancies to help organisations quantify employee attitude and
behaviour and the impact it has on customer satisfaction and ultimately the
bottom line. 'The reason why engagement matters now,' says Jim Crawley,
a principal at Towers Perrin, 'is that while previously anyone would
intuitively have said there is a link between people being well disposed
towards an organisation and the likelihood of that organisation being
successful, now there is evidence to prove it (Management Today; Apr
2007, p38-43).
Company leaders won't be surprised that employee engagement—the
extent to which workers commit to something or someone in their
organizations-influences performance and retention. The Corporate
Leadership Council in their survey of 50,000 employees in more than 59
organizations worldwide estimated that increased commitment can lead to
a 57% improvement in discretionary effort—that is, employees' willingness
5

to exceed duty's call. That greater effort produces, on average, a 20%
individual performance improvement and an 87% reduction in the desire
to pull up stakes (Buchanan, Leigh, 2004).
2.3 Human Capital Management
The recognition that much of the added value created by firms is
becoming more dependent on assets other than physical capital has
stimulated a vast literature in the area of intellectual capital and intangible
assets (Berkowitz, 2001; Drake, 1998; Leadbeater, 2000; Mayo, 2001,
Miller and Wurzburg, 1995; Roos et al, 1997; Sveiby, 1997). In particular,
emphasis has been placed on the importance of a company's human capital
— the value-creating skills, competencies, talents and abilities of its
workforce — as an essential component in gaining competitive advantage
(Bontis and Dragonetti, 1999; Leadbeater, 2000). As a result, in the UK
specifically, -notably from the professional body for personnel/HR
managers, the Chartered Institute of Personnel and Development (CIPD)
— have begun to exert an influence on government policy to have metrics
for Human Capital incorporated into both internal and external company
accounts.
6

2.4 Human Capital Management - Metrics
Bassi and McMurrer (2007) contended that by using rigorously designed
surveys to score the organisation on the range of human capital
management (HCM) practices across the five major categories, it's
possible to benchmark organisational HCM capabilities, identify HCM
strengths and weakness, and link improvements or backsliding in specific
HCM practices with improvements or shortcomings in organizational
performance. The process requires determining a 1 to 5 "maturity" score
for each practice. A score of 1 on executive skills, for example, indicates
poor performance (low maturity); a score of 5 indicates strong
performance (high maturity). Thus, with multiple surveys over time,
evolving maturity scores can reveal progress or regression in each of the
HCM practices and help a company decide where to focus improvement
efforts that will have a direct impact on performance. The empirical study
of Bassi and McMurrer (2007) of such systems across a range of
companies sheds of some light on the relationships between human capital
evaluation and management practices within particular contexts. This
study not only highlights innovations in the methods employed by firms to
evaluate human capital but also links these developments to management
practices and the influence of particular sectoral contexts. What emerged
in their study was high tech businesses focused their metrics on talent
7

identification and retention while customer service businesses
concentrated on commitment/engagement and loyalty metrics.
2.5 The Five Human Capital Driver Categories
What tools can show a company which investments in employees are
driving company performance currently and which one should emphasise
to advance ones strategic goals in the future. Bassi and McMurrer (2007)
outlined the main drivers in HCM that predict performance across a broad
array of organizations and operations. These drivers fall into five major
categories: leadership practices, employee engagement, knowledge
accessibility, workforce optimization, and organizational learning
capacity. In each of those categories, HCM drivers/practices are
subdivided into at least four groups.
• Leadership practices, for example, include those related to
managerial communication, inclusiveness, supervisory skills,
executive skills, leadership development, and succession planning
systems.
• Employee engagement for example, include, job design,
commitment, time (allowing employees to do jobs well and
enables good work/life balance) and systems
• Knowledge accessibility for example, include, readily available job
related information and training.
8

• Workforce optimisation for example, include work processes,
working conditions that support high performance, accountability
in that high performance is expected and rewarded, hiring and
effective performance management systems.
• Organizational learning capacity, for example, include welcoming
innovation, training that is practical and support organisational
goals, development of employees with formal career development
plans, value and support in that leaders demonstrate that learning is
valued and finally a learning management system that automates
aspects of training.
2.6 W hat is employee engagement?
Employee engagement, or passion for work, involves feeling positive
about your job, as well as being prepared to go the extra mile to make sure
you do your job to the best of your ability. Not surprisingly high levels of
engagement have been found to be associated with a whole range of
beneficial outcomes. One of these beneficial outcomes is high levels of
performance and engagement has become one of the most important ways
of measuring how employees feel about their work today (CIPD 2006).
Kahn (1990) conceptualised engagement at work as the “harnessing of
organisational members’ selves to their work roles; in engagement, people
employ and express themselves physically, cognitively, and emotionally

during role performances” (p694). Disengagement can be viewed as the
decoupling of the self from the work role and involves people
withdrawing and defending themselves during role performances.
Hochschild (1983). Those employees that are not engaged are essentially
"checked out." They're sleepwalking through their work day, putting
time—not energy or passion—into their work. Actively disengaged
employees aren't just unhappy at work: they're busy acting out their
unhappiness. Every day, these workers undermine what their engaged co
workers accomplish (2006, October 12 Gallup Management Journal).
2.7 Performance
Although there is diversity in approaches used, a reoccurring strand is the
concern with abstract and prescriptive models of human capital which are
based on unitary and economistic views of business organisation. The
ruling assumption in such studies is that improved information on
managing human capital leads directly to improved performance (Becker
etal, 2001: 13).
10

2.8 The Importance of High Performing Individuals in<
Organisations
‘Organizations need highly performing individuals in order to meet their
goals, to deliver the products and services they specialize in, and finally to
competitive advantage. Performance is also important fo r the individual
Accomplishing tasks and performing at a high level can be a source o f
satisfaction, with feelings o f mastery and pride. Low performance and not
achieving the goals might be experienced as dissatisfying or even as a
personal failure. Moreover, performance - i f it is recognized by others
within the organization - is often rewarded by financial and other
benefits. Performance is a major — although not the only - prerequisite fo r
future career development and success in the labour market ’ _(Sonnentag,
2000, p4 )
While earlier studies assumed that highly satisfied employees would be
highly productive employees, in 1955 it was found that in fact job
satisfaction could be derived from high performance (Brayfield &
Crockett, 1955). People enjoy activities at which they perform well and its
associated rewards. (Sonnentag,2000)
Locke & Latham’s (2000) high performance cycle (Chart 1) Latham, G.
P., Locke, E.A., Fassina, N.E. (2002) :’The High Performance Cycle:
11

Standing the Test of Time’ in S. Sonnentag (ed.) suggests that specific
difficult goals lead to high performance.
Fig 1 High performance cycle
ModeratorsAbility
Commitnent Feecback
Task Obmplexit} i uafional Cbnstrai
A Demands2a I eng e, hicji goals or anhgfijl grovrth-faciSta irg Fasfe orseies of task Plus high self-effcacy
h*Perform ance
piLQj ftjaiflaauLrs r. r-J \Rewards
4
MpHiatnrcDirectionEffort
PesistenceTask-Specfic
Strategies
Satisfer.tinr
CflnsfiqifLncslCommitnent t >ganistbnarp
/Vlingness to Future challenges
acx ep t
Latham, G. P., Locke, E.A., Fassina, N.E. (2002) :’The High Performance Cycle: Standing the Test of Time’ in S. Sonnentag (ed.)
High performance on such tasks are usually rewarding for individual. And
in turn, rewards generate satisfaction which subsequently encourages
commitment to the organisation.
12

2.9 Driving Performance and Retention through Employee
Engagement
The top ten findings of the Corporate Leadership Council research (2004)
are the following;
1 Successful engagement strategies begin with an outcome-focused
definition of engagement.
2 Employee engagement has a significant impact on both employee
performance and retention.
3 The majority of employees are “up for grabs”—they are neither
fully committed nor uncommitted.
4 Organisations exhibit dramatic differences in the engagement
levels of their employees.
5 There is no high-engagement or low-engagement “group”—
demographic characteristics do not predict engagement.
6 Emotional (rather than rational) engagement is most important to
performance.
13

7 Compensation and benefits are much more important to retention
than effort.
8 The manager is the enabler of other (more important) forms of
employee commitment.
9 Building a culture of communication, integrity, and innovation is
most critical to engagement.
10 To create and sustain a high-engagement workforce, organizations
must focus on four critical leverage points:
• Leverage Point #1: Focus on the Business
• Leverage Point #2; Focus on Key Contributors
• Leverage Point #3: Focus on Engagement Barriers
• Leverage Point #4: Focus on Culture
The Council has defined engagement as the extent to which employees
commit to something or someone in their organization and how hard they
work and how long they stay as a result of that commitment. By using this
outcomes-focused definition, we can measure the tangible benefits of
engagement, as opposed to focusing on “engagement for management’s
sake.”
14

While there are many contributing factors to an employee’s performance in an
organisation, if high performance leads to internal (intrinsic) and/or external
(extrinsic) rewards which in turn leads to satisfaction and commitment to the
organisation, then any threat to performance would clearly impact on rewards
and hence levels of satisfaction and commitment to the organisation
2.10 Customer Service connection
Issues of the problematic relationship between information and decision
making (March and Simon, 1958), and the mediating role of management
practice and systems (Guillen, 2003), are somewhat neglected. Hall
(2004) in his article further developed this divide, when he addressed the
issue of whether the decision making should be centralised or
decentralised. In effect he argues that it is contingent on the
sector/industry. The nearer your business is to customer service the lower
the decision making needs to be in the organisation. Measures of
performance are problematic in that they inherently have aspects of both
objectivity and subjectivity. The objectivity aspects suffer from the
controllability, alignment and interdependency problems. This means that
there are some tradeoffs that contain subjectivity aspects. Hall asks us to
consider that it is the totality of the contribution of employees that makes
or destroys value for the organisation. Without the subjectivity aspect the
picture is not complete. He hops that the subjective performance
15

evaluations can be weighed in measuring performance either to substitute
the objectives or in addition to them.
2 !1 Discretionary behaviour
Employers want employees who will do their best work, or £go the extra
mile’. Employees want good work: jobs that are worthwhile and turn
them on. More and more organisations are looking for a win-win solution
that meets their needs and those of their employees. What they
increasingly say they are looking for is an engaged workforce.
So what is employee engagement? It can be seen as a combination of
commitment to the organisation and its values plus a willingness to help
out colleagues (organisational citizenship). It goes beyond job satisfaction
and is not simply motivation. Engagement is something the employee has
to offer: it cannot be 'required’ as part of the employment contract (CIPD
2007). HR consultancy Towers Perrin defines it as 'the extent to which
employees put discretionary effort into their work, beyond the required
minimum to get the job done, in the form of extra time, brainpower or
energy1 (Management Today; Apr 2007, p38-43). Engagement can be
defined as "the extent to which employees commit to something or
someone in their organization, how hard they work and how long they stay
as a result of that commitment (Corporate Leadership Council 2004).
Research shows that the connection between an employee's job and
16

organizational strategy, including understanding how important the job is
to the firm’s success, is the most important driver of employee
engagement. In fact, employees with the highest levels of commitment
perform 20% better and are 87% less likely to leave the organization,
which indicates that engagement is linked to organizational performance
(Corporate Leadership Council 2004). In contrast, job satisfaction-a term
sometimes used interchangeably with employee engagement—is defined as
how an employee feels about his or her job, work environment, pay,
benefits, etc.
2.12 The bespoke combination of aspects of engagement
The greater the breadth and depth of Employee Involvement and
Participation (EIP) is, the greater the association with higher levels of
organisational commitment and job satisfaction (Cox A.,et al 2006 p.250).
EIP is often found to be of particular significance if employees are given
opportunities to exercise influence over a wide range of issues. Delbridge
and Whitefield (2001) conclude from their analysis of (The UK
Workplace Employee Relations Survey 1998) WERS98 that workers who
experience higher levels representative participation over issues beyond
their daily tasks perceive themselves to have greater influence over their
work. Cox A., Zagelmeyer S., Marchington (2006) research matches the
current thinking relating the bundling of HR practices and their
17

congruence to corporate strategies that positively impact on performance.
They have found the same positive and significant association between the
additive combination of the presence of various employee involvement
practices (EIP) measures and organisational commitment and job
satisfaction. They highlight the need to distinguish between direct and
indirect EIP. When EIP’s were divided between indirect and direct, the
direct EIP practices show a positive and statistically significant association
with both organisational commitment and job satisfaction when embedded
direct EIP was used. This shows that the more embedded direct EIP’s -
measured through frequency of meetings, proportion of staff covered by
an EIP practice, or potential influence - the more positive were the levels
of organisational commitment and job satisfaction. They comment that
further research is required on to give an understanding of the conditions
under which the various regimes take root and prosper. (Cox A., et al
2006 p.261). Cox is referring to commitment and job satisfaction not
engagement but his comments are valid in relation to the climate required
for fostering engagement.
2.13 Conceptualisation of engagement constructs
The Corporate Leadership Council (CLC) divides engagement into two
flavours. Rational commitment results when a job serves employees'
financial, developmental, or professional self-interest. Emotional
commitment, which has four times the power to affect performance as its
18

more pragmatic counterpart, arises when workers value, enjoy, and believe
in what they do. About 11% of the workforce, called “true believers” by
the CLC, demonstrates very high degrees of both commitment types;
another 13% demonstrate depressingly little. Workers on the low
engagement side of a normal distribution curve are four times more likely
to leave the organization than average employees, says the report, which
dubs this group "the disaffected." The remaining 76% are moderates, who
generally exhibit a strong commitment to one person or element of their
jobs but can take or leave the rest. This group neither shirks nor strives; its
intent to leave is variable (Buchanan, L., 2004)
The Performance Vitality Curve (In Any Team)
Performance is never equal
Fig 2 (Buchanan, L., 2004)
19

Rosabeth Moss Canter in her book “Confidence: How wining streaks and
losing streaks Begin and End” explains that confidence is based on three
cornerstones, accountability collaboration and initiative.
2.14 Psychological engagement
The high performance or ‘black box’ model produced by Bath University
builds on the psychological contract but emphasises the role of line
managers in creating conditions under which employees will offer
‘discretionary behavior5. The model recognises that employees have
choices and can decide what level of engagement to offer the employera
(Purcell, J , 2003). There is a parallel between the concept of engagement
and that of ‘flow5. This is the term used by the American Psychological
Association to describe the state of mind in which people become
completely involved in an activity and become so immersed that they lose
track of time. Flow - and engagement - can result when an employee has
job autonomy, support and coaching, feedback, opportunities to learn and
develop, task variety and responsibility. Positive emotions seem to have
more than twice the impact on performance as negative ones, which
suggests that managers can achieve more by promoting engagement than
by simply ‘trouble-shooting’ or dealing with problems (Marks, N. 2006).
The psychological conditions of the employee need to be
addressed/measured to get a true picture of engagement as it the
20

employees choice (not in the employment contract) to engage or not
engage and to what level. (May, Gilsen, Harter, 2004) comment on three
psychological conditions, meaningfulness, safety and availability. The
psychological conditions of meaningfulness (the value of a work goal or
purpose, judged in relation to an individual’s own ideals or standards
(Hackman & Oldham, 1980); this covers such aspects as job enrichment,
work role fit and co-worker relations (May 2003).
2 ! 5 Psychological safety and engagement
The psychological conditions o f safety (feeling able to show and employ
one’s self without fear of negative consequences to self image, status or
career (Kahn, 1990 p 708). The determinants of psychological safety
include supervisory relations, co-worker relations and behavioural norms.
The relation with one ’s immediate manager can have a dramatic impact
on an individual's perceptions o f the safety o f a work environment. A
supportive, and not controlling, relation should foster perceptions o f
safety (Edmondson, 1999) and enhance employee creativity (Deci,
Connell, & Ryant 1989; Oldham & Cummings, 1996). Supervisors who
foster a supportive work environment typically display concern for
employees' needs andfeelings, provide positive feedback and encourage
them to voice their concerns, develop new skills and solve work-related
problems (May, Gilsen, Harter, 2004). Interpersonal relations among
employees that are supportive and trusting and norms within groups and
21

organisations tend to govern behaviour, attitudes and the emotional
dimensions of work (Hochschild, 1983). Kahn (1990) suggests that
individuals who stay within the boundaries of appropriate behaviours will
feel safer at work. This means not questioning the habitual routines of
behaviour, thought or emotions expressed by one’s co-workers should also
foster psychological safety (Kahn, 1990).
2 ! 6 Psychological availability and engagement
The psychological conditions of availability cover such aspects as
resources, work role security and outside activities (May, Gilsen, Harter,
2004). This resources aspect includes both the physical and the emotional
demands of a job. Those in a customer service role in particular requiret
much emotional labour (Hochschild, 1983; Sutton, 1991).
Customer loyalty appears to be closely related to employee engagement.
(Salanova, Agut & Peiro 2005) in their empirical study of the relationship
between availability of organisational resources and employee
engagement in work units was found to have a positive effect on employee
performance and customer loyalty. The logic is that when employees feel
more engaged in their work, the climate is better for service and therefore
the customer receives better-quality service leading to a promotion of
22

customer loyalty. The Ivey Business Journal Jan/Feb 2001 produced the
following charts in relation to drivers of customer loyalty and desertion.
Fig 3 Driver of customer loyalty -Essential for loyalty
F I G U R E 2 : E S S E N T I A L F O R L O Y A L T Y
STAFF ATFTTUDE
DELIVER ON PROMISES
RETURN POLICY
ACCURATE PRODUCT INFORMATION
VALUE ME
SELECTION/CHOICE
STAFF AVAILABIUTY
ABILITY TO HANDLE PROBLEMS
CONSISTENCY
LOWEST PRICE
TRANSACTION TIME
UNDERSTAND NEEDS
PERSONAL SERVICE
KNOW WHAT TO EXPECT
BUSINESS HOURS
LOCATION
MEET EXPECTATIONS
KNOW THE COMPANY
AM RECOGNIZED
PROMOTIONS
KNOW THE PEOPLE
REWARD PROGRAMS
] RELATIONSHIP DRIVERS ■
CORE SERVICES [ D
WEASKEDCONSUMERS TORATETHE I MPORTANCEOf VARIOUS
HISNESS WTO BUIES IN U&l KTAH WGTW OH.OYALTY. THE
FIGURES RE FKESENnWEPERCENTACE OWESPONDIMTSWHO
CON SIDE RED THESE ATTRIBUTES l,ESSB<TlAf FOSTHEHlOWLTTr.
RESULTS• 7 OUT OF THE TOP 10 LOYALTY DRIVERS ARE
RELATIONSHIP ISSUES• PRICE, PROMOTIONS AND ESPECIALLY LOYALTY
PROGRAMS ARE WAY DOWN THE UST
Source; The Ivey Business Journal Jan/Feb 2001

Fig 4 Reasons for Desertion
FIGURE 3: REASONS FOR DESERT ION
UNDESIRABLE STAFF ATTITUDE
NOT MAKINC THE CUSTOMER FEEL VALUED
d is h o n e s t y /la c k OF INTEGRITYPOOR SERVICE
UNFAIR RETURN POLICY
POOR PRODUCT SELECTION/CHOICE
LACK OF RESPONSIVENESS
LACK OF CONSISTENCY/RELIABILITY
PRICENO ACCESSIBILITY
INABILITY TO UNDERSTAND CUSTOMERS <
LONG TRANSACTION TIMES
LOCATION
LACK OF CREDIBILITY
POOR PROMOTIONS/SALES
INEFFECTIVE COMMUNICATION
POOR REWARD PROGRAMS
TO CONFIRM THE IMPACT OF RELAHONSHIPBUfLOERS ON CUSTOMER LOYALTY WE ASKED THOSE CUSTOMERS WHO HAD STOPPED DOING BUSINESS WITH A RETAILER TO TELL US WHY. NOTE THAT “STAFFATTITUDE" IS THE NO. 1 REASON FOR ABANDONING A RETAILER IN FACT, THE THREE MOST FREQUENTIY MENTIONED REASONS ARE ALL RELATIONSHIP ISSUES.
Source; The Ivey Business Journal Jan/Feb 2001
This research clearly demonstrates the critical impact of the attitude of
frontline staff in engendering customer loyalty.
2.17 Psychological security and engagement
The work role security aspect concerns how the person feels they are
perceived by co-workers and those co-workers they might judge them, this
can be impacted by the individual’s personality and whether they would
be preoccupied by the impression they leave on others or whether they
24

tend to monitor their social environment and adapt their behaviours to it.
One would assume this construct allies itself to the whole theory of group
norms. Outside activities as a construct of availability, refers to
distraction of membership and engagement in outside organisations so that
the employee has depleted energy left for the workplace it is sometimes
referred to as a resource drain perspective (Edwards & Rothbard 2000). A
note of caution in that Rothbard in 2001 went on to discover the family
engagement can have positive effects on work engagement women. Such
an enrichment effect reinforces the benefits of multiple role involvement
that may lead to energy expansion.
2.18 Job Involvement
Engagement is most closely associated with the existing constructs of job%
involvement (Brown, 1996) and “flow” (Csikszentmihalyi, 1990). Job
involvement (see Illustration 3 McGregor page 34) can be defined as “the
degree to which the job situation is central to the person and his/her
identity” (Lawler & Hall, 1070;310-311). The psychological constructs
for the emotional side of engagement are concerned with job involvement
and flow (May, D R . , Gilson, R. L.. & Harter, L. M. 2004).
2.19 Communication
Hirschman in his seminal work in 1970 devised the concept of the exit-
voice-loyalty model. In it he emphasizes the individual’s rational
25

thinking in weighing gains against costs. He assumed that an individual
would probably exit an organization when there is a better alternative.
When the gain from staying in the organization is great, the employee is
unwilling to leave and will instead voice their demands in order to
maintain the gain. The employee when considering any action would also
take into account the probability of successfully having an influence
(management listening and taking action) and the cost to themselves. He
theorised that those loyal to the organisation believe and value the gains
and benefits in remaining with the organisation and would highly value
their contribution and chances of successfully influencing the
organization. This rational choice would take into account the benefit and
cost of each of the acts and the probability of success related to each. This
evaluation will, in turn, depend on individual and contextual factors. One
premise of rational choice is that the individual is free to move within an
individualist and volatile socio-cultural context (Hirschman, 1970).
2.20 Work-life balance
IBEC’s considered view is that looking at the future structure of the Irish
population, work/life balance will be the biggest issue in 10 years’ time.
WLB policies need to be promoted within an overall context of diversity
management, so as not to stigmatise or adversely affect the careers of .
26

those who take up flexible arrangements. Equally, the benefits of family -
friendly policies to employers need to be promoted. (N.C.P.P.2003)
2.21 Components of Employee Engagement
It is suggested that engaged employees work harder, are more loyal and
are more likely to go the 'extra mile' for the corporation. There are
different levels of engagement.
Questions to Determine Employee Engagement (Q12)
1. Do you know what is expected of you at work?
2. Do you have the materials and equipment you need to do your work right?
3. At work, do you have the opportunity to do what you do best every day?
4.work?
In the last seven days, have you received recognition or praise for doing good
5. Does your supervisor, or someone at work, seem to care about you as a person?
6. Is there someone at work who encourages your development?
7. At work, do your opinions seem to count?
8. Does the mission/purpose of your company make you feel your job is important?
9. Are your associates (fellow employees) committed to doing quality work?
10. Do you have a best friend at work?
11. In the last six months; has someone at work talked to you about your progress?
12. In the past year, have you had opportunities at work to learn and grow?
FIG 5 Source: Thackray, J. (2001,March 15). Feedback for real. Gallup Management Journal
27

It is the comprehension of the types of engagement that can provide a
perspective into staff behaviours that has a positive or negative affect on
organisational performance and consequentially organisational success.
As mentioned earlier employee engagement can encompass three
constructs the cognitive, the emotional and the behavioural. Beliefs about
the organisation, its workplace culture and its leaders are in the cognitive
arena. How employees feel about their colleagues, their manager/leader
and the organisation is the emotional component (CIPD 2004 & Corporate
Leadership Council 2004). This component is the most likely to engender
positive engagement. The behavioural component of engagement is the
value added aspect that reflects the amount of effort employee’s exercise
in the performance of their job. The behavioural component encompasses
the brainpower the energy and extra time exerted by employees while
doing their job. Other authors refer to this as the physical component and
also claim that this is the one that leads to the discretionary behaviour
required in customer service delivery
Organisations are implementing high performance work practices in order
to compete in ever increasing global markets. The competitive rivalries in
a global market are escalating (D’Aveni 1994) coupled with increasinglyi
demanding customers. It is recognised that it the bespoke aspect of a
companies approach to employees and culture that are making the
difference in performance levels for example G.E. and Southwest Airlines.
28

The Ivey Business Journal ( 2003) has reported on a study that analysed
132 U.S. manufacturing firms, found that companies utilizing high-
performance work systems had significantly higher labour productivity
than their competitors. When employees have the power to make decisions
related tdlheirpeTformance, can access information about company, costs
and revenues, and have the necessary knowledge, training and
development to do their jobs-and are rewarded for their efforts—they are
more productive ( Konrad, A. M. 2006, March/April). From a safety
conscious railway environment perspective a recent report in the Strategic
Human Resource Management Foundation reported that employees that
were engaged were five times less likely than non-engaged employees to
have a safety incident (Vance, R. J. 2006) this would indicate that an
engaged workforce is even more desirable.
2.22 Drivers of Employee Engagement
Employers want engaged employees because they deliver improved
business performance. CIPD (2006) research has repeatedly demonstrated
the links between the way people are managed, employee attitudes and
business performance:
When employers deliver on their commitments (when by their actions they
fulfil employees’ expectations), this reinforces employees’ sense of
fairness and trust in the organisation and generates a positive
psychological contract between employer and employee.
29
j

CIPD research into employee attitudes (Robinson, D., Perryman, S., and
Hayday, S., 2004) found that the main drivers of employee engagement
were:
• having opportunities to feed your views upwards
• feeling well-informed about what is happening in the organisation
• believing that your manager is committed to your organisation.
Perceived managerial fairness in dealing with problems also impacts
significantly on individual performance, although it is not significantlyi
related to engagement.
Similarly the Institute of Employment Studies (EES) has concluded that the
main driver of engagement is a sense of feeling valued and involved
(Matthewman, J., & Matignon, F., 2005). The main components of this are
said to be:
• involvement in decision-making
• freedom to voice ideas, to which managers listen
• feeling enabled to perform well
• having opportunities to develop the job
• feeling the organisation is concerned for employees’ health and
well-being.
30

Engagement levels are influenced by employees’ personal characteristics:
a minority of employees are likely to resist becoming engaged in their
work. But people are also influenced by the jobs they do and the
experiences they have at work. The way in which both senior
management' and line managers behave towards, and communicate with, -
employees, plus the way in which work is organised and jobs defined,
contribute significantly towards making work meaningful and engaging
(Matthewman, J., & Matignon, F., 2005).
31

Illustration 1.
Hertzberg’s - Motivators and Hygiene Factors
H e rzb e rg 's m otiva to rs and h ygie n e factors(achievement through to personal grovtth are motivators; the others are hygiene factors)
/ / / / > % / / / / y / s "
/ / ' / .Ml V*/
# «ton JJUJtxm fiom
32

Illustration 2Maslow’s - Hierarchy of Needs
Maslow’s Hierarchy of Needs * (original five-stage model)
ASetf-actaslsatioi
personal growth aud fiilf Imait
Esteem needsachievement. statos, responsibility, reputation
Belonanaifss mid Love needsfamily, affection, relatiouilups, work group, etc
Safety needsprotection, security, order, law, limits, stability, etc
Biological and Pliysiologral needsbasic life needs ■ an, food, drink, M e r , warmth, sex, sleep, etc.
33

Illustration 3|McGregor’s - Theory X Theory Y
'Theory X' 'Theory Y'
T ta y V - b a tin g aid developmental; Controi, srfilevensnt aid tantrums improvamerti achieved by eiaMlngb
err^iveiiig and giving rasponslbilyty.
management
© Kin dan ctapmsn E£a! Dcugta 1HcSjzgsJs XY«Tte>.
ffo £ ifo frn w tf ifcrefcpni tf d a i ilapirth o o f £n B jpajrafrf a d l t n put pnitferf b ii f is * s i^h c a ^ 4 k a s n b« in s & iS £ id Sfi ifiy fern or tiaGi paVcT^fi 2f b i $ 03 fiilp la n d ifo iS 'tflfta A jn it iE & ilru ri ikfi a i l■hkn ai ufig litoiyrtsn b frafi& fan itoiitiptfti V&cbaJ iikiCikjttepitintaii. ySHt_l« ir u t i ara tt ra to fitja .
34

Chapter 3;'•• v:? • r Methodology - *
3.0 Participants
The participants in this study were 104 employees working in the Southern &
Western Business Unit. The research sample was organised to reflect the general
population with respect to age and gender. Geographical region (District) was closely
monitored during the fieldwork period to ensure that the profile of respondents was
broadly in line with the grade breakdown.
There were various methodologies open to me for the investigation into the
measurement of the levels of employee engagement in the Southern & Western
Business Unit (S&W) of Iamrod Eireann. A method incorporating a breadth of
questioning seemed essential and for that reason a questionnaire seemed the most
appropriate aid to analysis. The questionnaire was closely based on the CIPD (2006)
attitude and engagement survey as this had been tested for validity and covered the
breadth of questioning required to cover such a complex area. The adapted
questionnaire was trailed first amongst other colleagues to allow for any changes or
clarifications.
Overall Iamrod Eireann is a bureaucracy and therefore a role culture. It contains
many different Departments, Human Resources, Finance, Communications,
Information Technology, Safety Management, Medical Department and Strategy
Department form the techno structure. The Chief Mechanical Engineering
Department (CME) repair and maintain the trains, the Infrastructure Department
maintain the railway track, New Works oversee the construction of new capitally
35

funded projects, the Signalling and Electrical Department oversee the signals on the
track and the Operations Departments (DART, Northern & Eastern Business Unit and
the Southern & Western Business Unit) operate the trains for customers. The
Infrastructure, New Works, Signalling and Electrical and CME Department are
dominated by professional engineers. The Operations Departments are focused on
delivering the timetable offer to the travelling public.
Iamrod Eireann has a total staffing in the region of four and a half thousand. The
Operating Departments have two thousand three hundred of those staff and the
Southern & Western Business Unit (S&W) has one thousand three hundred staff of
them.
As the S&W encompassed all of the grades that I wished to examine and contained
the newly created grade of Train Host. As well as reflecting and mirroring the other
operational business in Iamrod Eireann it seemed logical to confine my analysis to
that contained group of Districts within the S&W. It was of further benefit as it is the
one operational unit that is predominately inter-city traffic with customers having a
longer time experience of the rail service therefore more critical of the service
standards. Commuters tend to have a shorter although more frequent experience and
to mix the two aspects may have had potential to cloud the findings.\
3.1 Questionnaire Design
The questionnaire used in this survey is adapted from the survey devised by the CIPD
in the UK. It was used in the CIPD’s independent research and conducted for the
36

CIPD by the Kingston Business School and Ipsos MORI. It was devised to measure
employee attitudes and engagement across a stratified sample of 2,000 employees
from across Great Britain.
3.2 Measures
The items in the questionnaire were derived from four sources: previous CIPD
employee attitude survey, the academic research completed by May, Gilson & Harter
(2004) in the Journal of Occupational Psychology, IBEC and bespoke for spread/
status across the S&W in Iamrod Eireann.
The model of the questionnaire is designed to show the links between managerial
behaviour and processes, engagement, performance, and intentions to stay with the
organisation. The factors included are those that emerged in regression analysis as
being the areas of managerial action most significantly related to engagement levels.
(Annual Survey report 2006 How engaged are British employees? CIPD 2006).
Other aspects of employment, such as job satisfaction, flexibility, age, and current job
content are also strongly associated with engagement. Employee’s levels of
engagement need to be considered holistically within the context of managerial
actions, features of the job itself, and individual preferences. The questionnaire was
divided into nine distinct sections to cover all aspect of a persons reemployment
relationship.
37

The nine sections of the questionnaire are;
SectionNumber
Question Area Number of Questions
Section 1 ABOUT YOUR WORKING LIFE Q 1 to Q 3 inclusive with 19 sub questions in total
Section 2 YOUR EMPLOYER Q 4 to Q 9 inclusive with 7 sub questions in total
Section 3 YOUR JOB Q 10 to Q 21 inclusive with 34 sub questions in total
Section 4 YOUR LEADERSHIP AND MANAGEMENT
Q 22 to Q 23 inclusive with 16 sub questions in total
Section 5 COMMUNICATIONS IN YOUR ORGANISATION
Q24 to Q 27 inclusive with no sub questions
Section 6 BULLYING/HARASSMENT Q28 to Q 29 inclusive with 29 sub questions in total
Section 7 THE FUTURE Q 30 to Q 34 inclusive with no sub questions in total
Section 8 YOUR EMPLOYMENT Q 35 to Q 51 inclusive with 2 sub questions in total
Section 9 SCREENING/QUOTA QUESTIONS Q SI to Q S6 inclusive with no sub questions
A copy of the questionnaire issued and the covering letter is attached as Appendix II
3.3 Details on various sections of questionnaires
Section 1- Your Working Life
This section consisted of questions about employees working life as their conditions
have important effects on the levels of engagement, performance and intentions to\
quit and is an area that managers can become active to resolve. Managers are
responsible for 76% of the level of engagement of their reports.
38

Section 2- Your Employer
This section consisted of questions about Iamrod Eireann as an employer. It is an
attempt to gain a view as to how employees speak of the organisation to outsiders,
how proud they are of the company, interest in the organisation, commitment to
helping the company achieve its goals, loyalty to profession, company, immediate
supervisor, fellow employees, customers and extent to which they would recommend
friends and relatives to do business with Iamrod Eireann. In essence the section is
questioning about the branding of the company and how much they would drive to
maintain its standing or improve it.
Section 3 -Your Job
This section consisted of questions about their job- this is probably the most critical in
relation to engagement at the emotional level. It questions about how absorbing the
job is and how engrossed / or detached they become when performing it. The stress
aspects of performance are questioned including how much control they feel theyV
have in the role and how much support they expect in work life balance. Job
satisfaction is questioned as well as aspect of that satisfaction in physical working
conditions, job discretion, relation with fellow workers, recognition, immediate
supervisor, responsibility, rate of pay , opportunities to use abilities, relations with
management, promotion chances, management of the business unit, attention to their
suggestions, hours worked, job variety, job security, knowledge and skills to do the
job, quality of the work completed, comparison with others in relation to job
39

performance, and finally comparison of how the business unto performs with other
business units.
Section 4- Leadership, Management and Commitment
This section consisted of questions about leadership and management in the S&W. It
examines such aspects as clarity of strategy, confidence in senior management, trust
of senior management, and respect by managers for employees, consultation, training
requirements, recognition, and value of contribution of employee, support if there are
problems, communication, and clarity of role, listening, equity and commitment.
Section 5 - Communication
This section consisted of questions about communications in the company covers
information flow, belief in such information, opportunities to feed views etc upwards
and confidence that if there was a problem it would be dealt with fairly.
Section 6 - Bullying and Harassment
This section consisted of questions about and incidents of bullying and harassment
this will be included in the working conditions sections report. Previous reports
conducted by Aquarius have showed that this is at a worrying level in the organisation
but has not been broken down into its varying components of being sexual, racial,
bullying, threats of violence. The questionnaire further breaks down this section to
40

ask under each of the components whether their experience was verbally and by
whom (manager, colleague, or someone from outside the organisation) or physical
and by whom (manager, colleague, or someone from outside the organisation). If
employees are being bullied or harassed the consequences for the individual in
relation to negative psychological states and intention to quit and the human and
systemic failures that may foster a climate where bullying is acceptable will have
huge implications for the capacity to perform.
Section 7 - The Future
This section consisted of questions about the future is broadly concerned with
employees the intention to quit and future expectations concerning their career path.
Section 8 - Your Employment
This section consisted of questions about their employment in relation to current
grade, education levels, status in marriage, children, disability, category of employee,
length of service, earnings, sick leave, annual leave, hours worked and any flexible
working arrangements that may apply.
41

Section 9 - Screening and quota questions
This section consisted of questions that covered quota and screening aspects such as
age, size of location, gender, actual location and District, ethnic group and
employment status.
3.4 Scales
Two types of items were used in the survey. The first requested information about the
individual respondent, for example, age, gender, length of service in Iamrod Eireann.
The second type of item asked respondents how they think or feel about an issue.
Each of these items was of the same type, a Likert scale. This allowed respondents
the opportunity to choose one outcome from a range of five. For example,
Please tell us the extent to which you agree, or disagree w ith each of the
following statements about your work:
My job activities are significant to me
Strongly disagree
Disagree
Neither agree nor disagree
Agree
Strongly agree
The score is stored in the database used for analysis.

3.4.1 Engagement scales
The survey measures the three dimensions of employee engagement- emotional
engagement- cognitive engagement- and physical engagement. Is comprises nine
sections including the usual screening /quota questions. Engagement is a general
passion for work. It was assessed using 13 items from May Gilson & Harter (2006).
Engagement comprises three subcomponents, each of which is measured using a
subset of the 13 items:
Cognitive engagement (4 questions)
Emotional engagement (4 questions)
Physical engagement (5 questions)
The three scales were used both separately, to examine associations between other
aspects of people’s feelings and perceptions, and together to provide an overall
assessment of engagement.
3.4.2 Meaningfulness scale
The meaningfulness scale was derived from the same source as the engagement items.
This scale uses six items to assess the degree to which people find their work
worthwhile, significant, valuable and meaningful.
3.4.3 Job satisfaction scale
Job satisfaction comprises two elements:
• Intrinsic satisfaction, that is, satisfaction with such aspects of work as the
opportunity to use your abilities
43

• Extrinsic satisfaction, that is, satisfaction with such aspects of work as pay.
The scale was developed in previous research (Warr, P. B., Cook, J. D., and
Wall, T. D., (1979). ppl29-148) and has been applied widely in a range of
organisations. The subscales were used both separately, to provide information
about intrinsic and extrinsic satisfaction, and together, to give an overall
measure of job satisfaction.
3.4.4 Job-related well-being scales
The job-related well-being scales measured two aspects of emotions experienced in
the past few weeks at work:
• anxiety - contentment (6 items)
• depression - enthusiasm (6 items).
3.4.5 Self-rating of performance scale
The four-item self-rating of performance scale was developed by Kingston Business
School researchers adapted from the academic literature.
3.5 Other measures
3.5.1 Perceptions of senior managers
Respondents were asked for their views on four aspects of their senior management,
for example, whether senior managers have a clear vision of where the organisation is
going.
44

3.5.2 Perceptions of line managers
Twelve items were used to measure perceptions of line managers, for example,
recognition for good work and commitment to the organisation.
3.5.3 Organisational communication
Three items assessed the perceived quality and trustworthiness of organisational
communication.
3.5.4 Work-life balance
Two items measured respondents’ views of the balance between their work and home
life, and whether they received organisational support to manage this balance.
3.5.5 Advocacy
Three items asked participants about the extent to which they would speak positively
about their organisation, and whether they would recommend their organisation’s
products and services to others.
3.5.6 Stress
The extent to which people experience stress and perceived lack of control over their
work were measured in three items.
45

Due to the numbers involved, location spread, access and fit for purpose it was
decided to canvass only those staff currently employed in the S&W Business Unit.
The Business Unit allowed free access to all grades and locations. A cover letter and
postal questionnaire seemed most appropriate as most of the operations staff and
drivers do not have access to company computers. A copy of the questionnaire was e
mailed to each Station Manager in the Galway and Limerick Districts for distribution
along with cover letter, the personnel office in Cork covered Cork District by way of
both postal and e mail of both the questionnaire and cover letter. The Maniline/
District was covered by myself due to its nearness. All District Managers and direct
reports to the General Manager were sent the questionnaire and cover letter by e mail
and offered the opportunity to respond electronically or print and return by post.
The returns by e mail were identifiable in so far as when printed, they printed on one
side of the paper only and the postal one were copied on both sides. This gave me an
ability to easily identify how representative the returns were between clerical/
executive and all the operational grades. The Train Host grade got individual postal
questionnaires as these were identified as a critical group in the delivery of customer
service.
3.6 Administration of Questionnaire
46

3.7 Data Analysis
3.7.1 Cross-tabulations
Cross-tabulations are used to segment a dataset so that differences between subgroups
can be examined. For example, the number of men and women in each of the grades.
Comparisons can then be made to see whether there are important differences, such as
whether there are relatively fewer women in the managerial grades than the clerical
grades. The frequency data for each column in the cross-tabulations were examined
to see whether the differences between each group were statistically significant.
Differences in results for any two groups can be:
• real differences, that are unlikely to have occurred by chancei
• differences that have occurred by chance *
• small differences or no differences at all.
Statistical testing enables researchers to examine for real, or statistically significant,
differences between groups. As a guide, please note that results for different sub
groups generally need to differ by a certain number of percentage points for the
difference to be statistically significant, although this will depend on the size of the
subgroup sample and the percentage finding itself. The tests were performed with a
5% significance level, which means that 95% of the time when I found a significant
difference there is an actual difference in the population. Where differences between
two groups are reported, this is because I found them to be significant in this way or
worthy of comment.
47

3.7.2 Correlation analysis
Correlation analyses were used to examine the strength and direction of association
between two variables. For example, age and engagement is significantly and
positively associated, engagement increasing with age. However, age and satisfaction
with the way work is managed are negatively associated. This method of analysis is
used throughout this report. Non-significant findings are also reported in places when
an expected association was not verified by the data.
3.7.3 Regression analysis
Another form of analysis used was regression analysis. This enabled exploration of
the relationship between two sets of variables: input or predictor variables, and
outcome or dependent variables. I wanted to know which variables best predicti
outcomes such as engagement and performance.
The predictor variables are seven of the items that assessed perceptions of managers
and senior managers:
• senior managers’ vision of where the organisation is going
• managers’ respect for employees
• managerial commitment to the organisation
• opportunities for upward feedback
• feeling well-informed about what is going on in the organisation
• ability of managers to deal with issues fairly
• credibility of information.
48

The seven items were chosen because they represent distinct areas of leadership and
organisational practice. Each item is itself representative of several issues. For
example, a perception that managers are committed to Iamrod Eireann could
encompass a manager’s productivity, how positively they speak about the
organisation, and whether they are willing to go the extra mile to do their job well.
The breadth of each item needs to be considered when looking at the results of the
regression analyses. These variables were examined in relation to engagement with
work, which has three components:
Engagement with work
• cognitive engagement
• emotional engagement
variables, and the three facets of engagement (the input variables) and the self
reported performance aspects, higher performance and quality in comparison to
others.\
Regression analysis examines the likelihood of association between variables, that is,
the degree to which the relationship is likely to have occurred by chance. A
significant relationship is one that is highly unlikely to have occurred by chance and is
therefore important. Regression also shows the direction of association between
variables. A positive association is when a high score on one variable is associated
with a high score on the second variable, for example high levels of perceived
meaningfulness of work being associated with high levels of engagement with work.
“• physical engagement
Next, analysis focused on the relationship between the six leadership and management
49

A negative association is when a high score on one variable is associated with a low
score on the other variable. To sum up, regression equations show which of the input
variables best predict the value of the dependent variable.
50

Chapter 4
General Overview of Respondents
4 Overview
The survey was carried out amongst current employees working in the Southern &
Western Business Unit (S&W) of Iamrod Eireann. Of the one hundred and four
respondents 80 were men and 24 were women, this represented 77% and 23% of
respondents respectively. One in five is under 30 years of age and the age profile is
set out in Chart 1 below.
Chart 1 Age profile of employees in S&W
What was you age on your most recent birth day.
33 /o
szz) 5%aaz? ansso
lA S & S C ®
The respondents were spread across the four districts in the business, Cork (22%),
Galway (19%), Limerick (13%), Mainline (Heuston Station down to Portarlington)
(31%) and administrative staff (11%).
51

Three quarters have attained their leaving certificate and over one third have attained
a qualification at third level.
The vast majority of the respondents are full time, regular and appointed staff (98%).
While being a true reflection of the company as a whole it did not allow a part time
comparison to be made in the survey. Almost all the respondents described
themselves as white (96%). This placed a limit on the survey in that inter-cultural
difference could not be explored.
A quarter of the respondents work in locations with less than ten colleagues. Almost
one third indicated that they were employed in a location with more than one hundred
colleagues.
52

5 Introduction
It is in this chapter that more detail on levels of engagement is examined. Previous
research shows that it has three components;
• Cognitive engagement; focusing very hard on work, thinking about very little
else during the working day
• Emotional engagement; being involved emotionally with your work
• Physical (behavioural) engagement; being willing to “go the extra mile” for
your employer and put in work beyond contract.
This project sought to know, how engaged employees in Iamrod S&W Business Unit
are with their organisation. To what extent would they recommend Iamrod Eireann to
other people and act as advocates for the company? Engagement is an interesting
concept, because it not only involves how people feel about their work, but also how
they behave.
The core topics examined were;
• Overall engagement
• Cognitive engagement
• Emotional engagement
• Physical engagement
• Advocacy
Chapter 5
Engagement
53

5.1 Overall Engagement
When the three dimensions are averaged it shows that 65% are engaged and 24%
disengaged. The charts below graphically show the level o f engagement versus
disengagement across the three dimensions measured, cognitive, emotional and
physical. I have found that 17% are actively engaged with their work and 43% are
only moderately engaged and 8% are actively engaged. Matched against other
studies these figures are on the low side for engagement (see Table 1 at Appendix 3).
Seijts, G., & Crim (2006) pp. 1-5 found 29% of employees fully engaged in their
work, while 54% are not engaged and 17% are actively disengaged. The CIPD
(2006) survey found 35% actively engaged in their work, 57% moderately engaged
and 8% actively engaged.
Chart 2 Engagement across all measures all employees
Engagement across all measures across all employees
70% -j
60% -
50% -
40%
30% o>cnn«
20%
10% - no/
0s
—ftoo5?
tg5?
U/o 1 i i i
Engaged On the Disengaged fence
54

On further examination of the questions asked of respondents, one of the questions
on physical engagement enquires about taking work home. This is not possible for a
large number of the employees in Iamrod Eireann as they are working on the trains
on in the station. As the Seijts & Crim (2006) study was specifically on customer
service in the USA and the results from my survey agree with the CIPD albeit on the
actively disengaged (8%) giving validity to the figures arrived at, I do not propose to
adjust the responses to eliminate this question.
5.2 Cognitive Engagement
Respondents were asked four questions to evaluate their level of cognitive
engagement. Cognitive engagement means the extent that people become engrossed
in their work (see Chart 3). While, some 53% of respondents report being
cognitively engaged; 26% say they are not cognitively engaged, the lowest level of
the three engagement scales (in line with CBPD Survey (2006)). More than a quarter
of the respondents (26%) surveyed also say that they often think about other things
when performing their job, fortunately 57% do not
Think more about other things Think less about other things
Traffic Staff Train Hosts
Station Controllers Over 55 ’s
Depot Controllers Drivers
DTEs Managers
Executives and Clerical
Fifty seven per cent of respondents say that they are rarely distracted when
performing their job, compared with 21% who say they are. However, 65% of
managers say they are rarely distracted.
55

Key Finding
• Overall, the survey, responses reflect an interaction between individual
engagement with work and the nature o f the work itself. Some jobs are
more likely to demand a high level o f attention, for example managerial
jobs, and they are more also more likely to attract people interested in
cognitively demanding work. It is surprising to note that Train Hosts are
more cognitively engaged than Drivers or managers.
Chart 3 Cognitive Engagement
C o g n ative e n g a g e m e n t all res p o n d e n ts
100%
90%80%
70%60%
50%40%
30%
20%
10%0%
48%
33%
Performing my job is so
absorbing that I forget about
everything else
26%
40%
I often think about other
things w hen performing my
job
21%
57%
I am rarely distracted
when performing my
job
9%
81%
■ Disengaged
O Engaged
Time passes quickly when I perform my job
63%
Average
C o gn ative e n g a g e m e n t q u e s tio n s
53 Emotional Engagement
Emotional engagement is concerned with the extent to which people are involved in
their jobs at an emotional level. Levels o f emotional engagement are higher than
those for the other two forms o f engagement, 64% o f respondents are saying that
they are emotionally engaged (see Chart 4) with their work and 16% are saying that
they emotionally disengaged (see Chart 6). Women are much more emotionally

engaged with their work than men 77% versus 60% (see Chart 5). This is in line
with previous studies.
Chart 4 Levels of engagement for all three dimensions
Levels of eng ag em en t for the 3 dim ensions
-♦— Engaged
Cognative Physical Emotionalengagement engagement engagement
Dim ensions
Chart 5 Emotional Engagement Males v Females
Em otional e n g a g e m e n t M a le s v F em a les
93% ----------OWK-------------------------------------------- --------1---------------------------74%------------- TPk—
....-*rmI I I □ Males Engaged
■ Females Engaged
I really put my heart
into my job
I get I often feel My ow n excited emotionally feelingswhen I detached are
perform from my job affected by weHinnry how well I
job perform myjob
Em otional e n g a g e m e n t q u e s tio n s
Average
57

Chart 6 Emotional EngagementEngagement - Emotional -All Respondents
100%90%
80%
70%
60%
50%
40%
30%
20%
10%0%
82%
14%
59%
20%
58%
25%
56%
16%
64%
■ Disengagec
□ Engaged
I really put m y heart into my job
I get excited when I perform w ell In my job
I often fee l emotionally
detached from my job
My own fee lings are affected by
how w ell I perform my job
Average
Emotional engagement questions
Turning to the detailed questions, I found that 82% o f people say they really put their
heart into their job, with which only 6% disagree. This is truer o f females at 93%
and managers at 91%.
When people were asked whether they fell emotionally detached from their job; 58%
say are not, compared with 20% who say they are. This was the point o f least
difference between the genders.
Key Finding
• Emotional engagement is closely related to the other aspects o f emotions
that have been measured in this survey. Feeling emotionally engaged
with work runs parallel with other positive perceptions o f work and the

organisational environment, and other aspects o f engagement. Effective
individual and organisational management o f the relationships and
processes that increase positive emotions could also raise levels o f
engagement and performance
• Over three fifths of employees are emotionally engaged with their work.
• Train Hosts are more cognitively engaged than Drivers or managers.
5.4 Physical Engagement
Physical engagement is concerned with how much effort people put into their work.
Over three quarters o f respondents are physically engaged with their work and
almost one third are disengaged (see Chart 7). The highest scoring item was the
answer to the question “I stay until the job is done”.
Chart 7 Physical Engagement
Physical engagement all respondents
120%
100%
80%
60%
40%
20%
0%
2%
21%
55%
95%
18%
63%
21%
77%
I exe rt a bt I stay until of energy the job is
performing done my job
I avoid working
overtime w henever po ssb le
I take w ork
home to do
I avoid
working too hard
Physical engagement questions
30%
■ Disengaged
□ Engaged
78%
A ve rag e
59

Females are more physically engaged than males particularly in relation to exerting
energy in the performance o f their job and the non avoidance o f working too hard
(see Chart 8). The difference between the genders in relation to bring work home
could be accounted for the fact that more females that males are located in clerical
administrative roles.
Chart 8 Physical Engagement Males v Females
Physical engagem ent M ales v Fem ales
120%100%80%60%40%20%0%
96^ 5% 96%
I exert a lot of energy performing
my job
I stay until the job is
done
I avoid working overtime
whenever possible
I take w ork I avoid home to do working
too hard
Engaged scores on physical en g ag em en t questions
□ FEMALES
■ MALES
Key Finding• Over three quarters o f respondents are physically engaged with their work and
almost one third are disengaged.
5.5 Engagement by Age
Does engagement significantly change with age? The chart below does indicate that
those over 55 are more engaged than those in the 16 to 35 age bracket. Of interest is
the indication that the emotional engagement level is not any different between those
two age groups. The emotional engagement is the one likely to associated with
performance and therefore this is worthy o f further examination. There is no
difference between the age groups in emotional engagement; this is a significant

result as other studies (CIPD 2006) have shown a lower level for younger employees
on this scale. Physical engagement (see Chari 9) is the likely dimension to indicate
the discretionary behaviour so desired in a customer orientation. It is the
engagement dimension showing the most disparity between the two age groups.
This, therefore, is then of concern. As indicated physical engagement is associated
with age and the younger age group aged between 16 to 35 report the lowest physical
engagement levels.
Chart 9 Engagement by Age Comparison
Engagement Age comparison across all 3 dimensions
60%
50%
40%
5? 30%
20%
10%0%
COGNITIVE EMOTIONAL PHYSICAL
Dimensions
Chart 10 shows the comparative disengagement levels. It would appear that when
the over 55’s disengage they are the most disengaged, with the physical
disengagement dimension the most affected.
6 1

Chart 10 Disengagement by Age comparison
Disengaged com parison across a ll dim ensions
COGNITIVE EMOTIONAL PHYSICAL
Dimensions
5.6 Engagement by Gender
When the genders are compared across the engagement dimensions -fem ales are
more engaged than males. This finding is consistent with the CIPD (2006) survey
(see Chart 11 to 13 below).
Chart 11 Cognitive Engagement Females v Males
Cognitive engagem ent F em ales v M ales
Performing m y job is
so absorbing
that I forget
I often
think about other
things when
performing
I am rarely distracted
when performing
my job
Tim e passes quickly when I perform
m y job
□ Females Engaged
■ Males Engaged
Cognitive eng ag em en t questions
6 2

Chart 12 Emotional Engagement Females v Males
Em otional en gagem en t Fem ales v M ales
I really put my heart
into my job
I get excted when I
perform w ell in nry
job
I often feel emotionally detached
from my job
My own feelings
are affected by how w ell I perform my
job
□ Females Engaged
■ Males Engaged
Em otional eng ag em en t questions
Chart 13 Physical Engagement Females v Males
Physical engagem ent F em a les v M ales
I exert a lot I stay until I avoid I take w ork I avoid of energy the job is working home to do working tooperforming done overtime hard
my job w heneverpossible
□ Females Engaged
■ Males Engaged
Physical engagem ent questions

5.7 Advocacy
The implications o f these responses on (see Chart 14) advocacy, this indicates that 1
in 5 employees are true champions in that they would speak highly o f the company
without being asked.
Chart 14 Employer Advocacy All Respondents
Employer Advocacy all respondents
3 %_ 20% "mo
□ Speak highly of rry organisation w ithout being asked 20%
■ Speak highly of my organisation if asked 38%
□ Neutral tow ards myorganisation 17%
□ Critical of my organisation if asked 21%
■ Critical of my organisation w ithout being asked 3%
Chart 15 Recommend Company to someone seeking seeks advice about a
job opportunity
Recommend Iarnrod Eireann to someone whoseeks my advice about a job opportunity
□ Strongly disagree 7 %
7%
230/0 ^ 9% □ Disagree 9 %
15% □ Neither agree nordisagree 1 4%
□ Agree 4 6 %
46% ■ Strongly agree 2 3 %
64

It can be seen (see Chart 15) that almost 70% of current employees would recommend
Iamrod Eireann as an employer and speak highly of the company. Those who
strongly disagreed at 7% correspond with the figures of 8% that are actively
disengaged.
Almost 80% of employees are proud to work for the company. There is however a
recurring 3% that are not at all proud of working for the company and would be
critical of the company without being asked, and would probably actively deter
someone from applying for a job in the company.
Chart 16 Proud to tell people who you work for
Are you proud to tell people who you work for?
3%
□ Very proud indeed 21%
B Quite proud 57%
a Not very proud 19%
□ Not at all proud 3%
57%
65

5.8 Context
Comparison with the Performance Vitality Curve (see Chart 17 below) referred to
the literature review to give context to the findings
Chart 17 Performance Vitality Curve
The Performance Vitality Curve (In Any Team)
Performance is never equal
(Buchanan, L., 2004)
The above curve would indicate that about 11% would be true believers in the
company and in the region of 13% would be disaffected. The survey reveals the
likelihood of finding 17% in true believers category and 8% in the disaffected
category.
Key Findings
• Older employees are more engaged than younger employees.
• Younger employees are less likely to demonstrate physical engagement
• There is no difference on age grounds in emotional engagement

• Some 53% of respondents report being cognitively engaged; 26% say they
are not cognitively engaged, the lowest level of the three engagement scales
• Females are more engaged than males especially in the emotional
engagement dimension.
• The 17% that are actively engaged with the company could be classified as
true believers and advocates for the company
• The 8% that report being actively disengaged can be classed as the
disaffected and would contain the consistent 3% that are truly active in being
negative and working against their colleagues and the company.
5.9 Management in the Southern & Western Business Unit
5.9.1 All managers’ cognitive engagement matched against all others
As expected managers are more engaged that other employees across all questions on
cognitive engagement. Managers responses indicate that are 10% more likely to feel
that time passes quickly when they are performing their job the average respondent.
They are 7% less likely to be distracted when performing their job. They are only 4%
more likely to not think about other things when performing their job and they are 8%
more likely to forget about everything else when performing their job.
67

Chart 19 Cognitive Engagement Senior Managers to Station Controller level
C ognitive E ngagem ent -Senior M anagers to Station C ontrollers
%
120%100%
80%60%
40%
20%
0%
■ ■ *g r - ' W i1 18%
91%■ 29% 15%65%■ n A 4 OJ ■ ■ 1 44% f H H H
■ — K — 1
Performing my job is so
absorbing that I forget
about everything
else
I often think about other
things when performing
my job
I am rarely distracted
when performing
my job
Tim e passes quickly when I
perform my job
■ d isengaged □ engaged
Cognitive engagem ent questions
5.9.2 All managers’ emotional engagement matched against all others
Again as expected managers are more engaged that other employees across all
questions on emotional engagement.
Managers say that are 13% more likely indicate that their own feeling are affected by
how well they perform in their job. Again managers are 13% more likely not to feel
emotionally detached from their job. Managers are only 3% more likely than others
to get excited when they perform their jobs well. In relation to the question about
really putting your heart into the job, managers' indications are at 91% positive and
the other are at 82% positive.
68

Chart 20 Emotional Engagement Senior Managers to Station Controller
level
Emotional Engagement -Senior Managers to Station Controllers
100%90%80%70%60%50%40%30%20%10%0%
------ rr.— iI----------------------------------------------------------------- 1■
91%
12% 15% -----1------ H 71% 68%
-----__
■ |___ ■ -r ■ — __ j
I really put I get excited I often feel My own
my heart when I emotionally feelings are
into my job perform well detached affected by
in my job from my job how well I
perform my job
Emotional Engagement Questions
■ disengaged □ engaged
5.9.3 All managers9 physical engagement matched against all others
Again as expected managers are more engaged that other employees across all
questions on physical engagement.
Managers say that are 19% more likely to exert a lot o f energy in performing their
jobs. Managers are only 2% more likely to indicate that they stay until the job is done.
The question on avoidance o f working overtime is similar with only a 2% differential
in favour o f managers. Managers are twice as likely to take work home with them.
As most employees other than managers work on the trains or in the station this
understandable and should possible be discounted in the overall averages. It may also
account for the discrepancy in engagement levels in S&W versus the CIPD (2006)

survey. Managers are only 7% more likely to report that they do not avoid working
too hard.
Chart 21 Physical Engagement Senior Managers to Station Controller level
Physical E ngagem ent -Senior M an agers to Station Controllers
I exert a lot I stay until of e n e rg y the job is
perfo rm in g done m y job
I avoid w orking overtim e
w h e n e ve r possible
I take w o rk I avoid hom e to do w o rkin g too
hard
Physical Engagement Questions
■ disengaged□ engaged
Chart 22 Advocacy Senior Managers to Station Controller level
A dvocacy - Senior M anagers to Station Controllers
H ow w o uld you speak of this organisation as an em plo yer to people outside the organisation?
A re you proud to tell people w h o you w o rk for?
Speak highly 68% Proud 79%Be critical 18% Not proud 21%
Agree DisagreeI w o uld recom m end Ia rn ro d Eireann to som eone w h o seeks m y advice about a jo b opportunity_______________ 68% ________ 18%_____________________________________________________I w ould encourage m y friends and relatives to do business w ith Ia rn ro d Eireann
74% 1 2 %
70

This section attempts to identify what are the drivers o f engagement for the three
dimensions.
5.10 Drivers of engagement
5.10.1 Cognitive engagement
Chart 23 Cognitive engagement drivers
Red series represents questions 1 to 4 on table below responses to cognitive 1 engagement questionsBlue series represents questions 1 to 4 on table below line manager's actions
Correlation coefficient 0.90102Co gnitive engagem ent Line m anag em en t actio ns
Performing m y job is so absorbing that I forget about
everything else Agree 25% Q21 iMakes clear what is expected of me Always 37%
Stronglyagree 8% Usually 27%
I often think about other things when performing my job Agree 22% 921 i
Listens if I have a suggestion to make Always 29%
Stronglyagree 4% Usually 29%
I am rarely distracted when performing my job Agree 48% Q21 k Treats me fairly Always 38%
Stronglyagree 9% Usually 32%
Tim e passes quickly when I perform my job Agree 62% 021 1
Is committed to Southern 81 Western Business Unit Iarnrod Eireann Always 49%
Stronglyagree 19% Usually 30%
71

Red series represents questions 1 to 4 on table below responses to emotional engagement questionsBlue series represents questions 1 to 4 on table below line manager’s actions
Emotional engagement questions v line manager actions
100 r
80 -
60
40 ■
20
0 ■0
Chart 24 Emotional engagement drivers
Correlation coefficient 0.89895049Emotional Engagement QuestionLine Managers actions
I really put m y heart into my job
Agree/Stronglyagree 8 5 %
l
Is committed to Southern & Western Business Unit Iarnrod Eireann Always/usually 8 2 %
I get excited when I perform well in m y job
Agree/Stronglyagree 6 1 %
2
Treats me fairly Always/usually 7 2 %
I often feel emotionally detached from m y job
Disagree/Stronglydisagree 6 0 %
3
Makes clear what is expected of me Always/usually 66%
My own feelings are affected by how well I perform my job
Agree/Stronglyagree 5 8 %
4Listens if I have a suggestion to make Always/usually 6 0 %
5.10.2 Physical Engagement
I selected high physical engagement respondents coupled with high quality of work
and high performance respondents and matched them against management, leadership
and commitment responses to see the correlation between physical engagement,
72

performance and management actions. The chart below shoes the most likely
managerial action that would engender physical engagement that would lead to high
performance.
Chart 25 Physical engagement drivers
Pearson's 0.864002522Engaged Engaged
I exert a lot of energy performing my job 100 Treats me fairly 79
I stay until the iob is done 100
Is committed to Southern & Western Business Unit Iarnrod
Eireann 71
I avoid working too hard 92Makes clear what is expected of
me 67I avoid working overtime
w henever possible 75 Is supportive if I have a problem 67
1 take w ork home to do 29Listens if I have a suggestion to
make 58
5.10.3 Results on Drivers of engagement
Any action that appears on all three engagement drivers identified to be associated
with any o f the engagement areas are;
• Immediate manager is committed to S&W business unit
• Treats me fairly
• Makes it clear what is expected o f me
• Listens if I have a suggestion to make
The last action not common to all is “Is supportive if I have a problem” as this has
been tested against performance through self reporting by respondents it should also
be included.0

The literature recommends that a tailored approach be made to encourage engagement
and I would recommend that Iamrod Eireann should course these actions throughout
their management line for actions. It will then be a case of further measurement to
test the intervention against engagement levels.
74

Chapter 6____________________________ Working Life____________________________
6 Introduction
Conditions of work in terms of pay, hours of work, holidays, flexibility and work-life
balance can have an enormous impact on how a person feels about their work.
Iamrod Eireann had an overtime culture in the past. Over the last seven years a
number of agreements have been reached with the trade unions to address this and pay
issues. Is there evidence that hours being worked are reducing or that employee
attitudes to overtime are changing? Railways were originally structured on military
lines for efficiency, with that perspective one might imagine that command and
control issues could lead to a perception of bullying in a more modem times, is this
correct presumption? As the railway is governed by its service offer to the public,
namely the train timetable one would imagine that flexible working would be a
logistical difficulty so one would expect to find a limited amount of flexi worldng if
any.
In developing the building blocks for the model of employee engagement, one of the
questions to be asked is, how do working conditions affect levels of engagement,
intention to leave and performance? What are the critical areas where management
action might be needed? This is being done in the context that management is over
70% responsible for the levels of engagement of the employees under their remit.
The core topics examined were;
Grade Work-life balance
Flexible working Pay
Worldng hours Bullying and harassment
75

6.1 Grade
The sample reflects the grade distribution of the workforce in the business unit as a
whole. Standard categories used by the company to classify groups of employees into
categories were used. Please see Chart 6 below and the table in Appendix 4 for
further details. More managers replied than are proportionate to the actual numbers.
This is acceptable as measurement of their attitudes is critical to identifying their gaps
in engagement as they are the group most responsible for the engagement levels of
their staff.
Chart 26 Employee numbers v actual
As expected, significantly more of those in the managerial grades are men.
Gender Breakdown - Senior Managers to Station Controller level.Male 26 76%
Female 8 24%
Key Finding
• Employees in senior management level down to and including Station
Controller level are more engaged when compared to the general population of
respondents.
76

6.2 Flexible Working
In answer to the question on flexible working, 86% of respondents do not have
flexible working applied to them. This is not a surprising statistic because of the
constraints of working to a train timetable and the union agreement in relation to such
matters. Where flexible working is cited -females are in the majority of beneficiaries
of these practices. The results of the question on this area are shown below.
Fig. 6 Availing of flexible working
Do any of the following flexible working arrangements apply to you?Home working ... ... 1%Flexi-time ... ... 5%Shorter working w e e k ... ... 0%Term time contract ... ... 3%Annualised or compressed hours... 3%None of these ... ... 86%
The numbers are so small in relation to atypical hours, other than flexitime, that it
would not be worthy of further examination in the context of this project.
6.3 Working hours
The results in relation to working hours are surprising in that 48% of the respondents
have indicated that they work over 48 hours per week. One should consider this
against the working time legislation which prohibits such hours. This may be a
hangover from the overtime culture or dissatisfaction with pay?
77

Chart 27 Contracted hours v Actual hours
Contracted hours versus actual hours
B How many hours are you contracted to work in a typical w eek?
□ How many hours do you actually work in a typical w eek? Include overtime /rest day working/other whether paid or not.
% Staff
How many hours do you actually work in a typical week? Include overtime /rest day working/other whether paid or not.4 8 -5 9 ... 38%60 or more ... 8%
In the context of pay for over contract hours, almost half of the respondents get paid
and only 13% get no monetary or time in lieu. This 13% are all in senior management
roles as everyone else is covered by union agreements in relation to extra time
working. Overtime is generally voluntary (unless there is an emergency) and for the
general grades they are paid an extra two hours each week to cover this contingency
and would not be considered overtime.
If you work extra hours, do you get paid; take time in lieu or both?
Paid 47%
Time in lieu 13%
Both 27%
Neither 13%
The issue of working long hours is thought to have implications for engagement
levels (on the intention quit aspect rather than emotional or physical engagement). - . p
78

Perhaps an examination of satisfaction with pay might through some light on this
issue.
Under the area questioning job satisfaction dissatisfaction with pay was the highest
scoring element.
Your rate off pay 43% 39%
Dissatisfied Satisfied
The inference is that employees are dissatisfied with pay more than the overtime
culture.
Key finding
• The Station Managers, with five out of the six respondents reporting
dissatisfaction with their pay rate were the most dissatisfied of all categories
across that dimension.
6.3.1 Engagement implications
Station Manager are more engaged that the average in both the emotional and
cognitive factors. This does not appear to have raised their promotional aspirations.
This may be explained by the fact that many are top of the pyramid in their locations
and promotion would potentially loss them status as they would become a mere
“executive” or possible more critically they may have to move location.
Dissatisfaction with pay does not negatively affect their level of either emotional or
cognitive engagement.

Chart 28 Comparing their emotional and cognitive engagement levels
(Station Managers)
Emotional engagement levels based on agree to questions comparison All respondents to Station Managers
-Station Managers
A llem ployees
I really put my I get excited heart into my job when I perform
well in my job
Questions
I often feel emotion ally
detached from my job
My own feelings are affected by
how well I perform my job
Cognitive engagem ent all respondents com pared to Station Managers
• All Bnptoyees Agree
• Station Managers Agree
m y job is so absorbing that I forget about
everything else
about other things when performing
m yjo b
distractedwhen
performingm yjo b
quickly w hen I perform m y
job
Agree to questions
However, it does as expected affect their intention to quit (Chart 29) but rather than
make them active in the field, just makes them doubtful. Long hours do not lead to
increased performance and is associated with work life balance issues.
80

Chart 29 Station Manager v All respondents future intentions
Future Intentions
■ Station Managers
• All respondents
you are in your promotion to a current job higher level
position of above/other similar
responsibility in another area
of your organisation
All respondents v Station Managers
Do you plan to remain with Iarnrod Eireann for the foreseeable future?
Stationmanager
Allrespondents
Yes 67% 84%No 0% 3%Don't know 33% 11%
The figures in Chart 29 show that retention is not an issue for Iamrod Eireann. Most
of those who indicated don’t know were not actively seeking other employment.
Historically and currently this has not been an issue for the company as it is in a
period of workforce contraction at certain levels due to technological advancements in
the infrastructure area.
6.4 Work life balance
This is an issue for employees given that two fifths of the of respondents report not
achieving the correct balance between their working life and other considerations and
demands they may have. As so few respondents are currently availing/allowed avail
of initiatives and only a quarter of respondents indicate that they are getting support in
this area This is very likely to become a bigger issue with serious implications over
81

time. There are a number o f work life balance facilities available to employees but
due to low response rate from individuals currently availing o f work life balance
initiatives, 1 was unable to delve into any comparisons or impact on engagement
levels.
Chart 30 Work life balance
Worklife Balance
Disagree
Agree
0 % 2 0 % 4 0 % 6 0 % 8 0 % 100%
40% 44%
-----------
46% 26%
□ I achieve the correct balance between my home and work lives
B Southern & W estern Business Unit larnrod Eireann provides support to help me manage my work-life balance
6.5 Bullying and Harassment
A previous confidential study completed by Polaris to equality proof larnrod Eireann
recruitment and selection policies highlighted that bullying and harassment was an
issue o f concern for the company. That report extrapolated an incident level in the
range o f 30%. This survey indicates a 28% level. While this statistic supports the
validity o f the engagement and attitude survey alas it also confirms the area as an
issue o f grave concern.
8 2

Chart 31 Bullying Harassment by experienceWhich, if any, of the follow ing form s of bullying or harassm ent have you experienced in the
last 2 years
0% 2%
63%
28%
7%
□ Which, if any, of the following form s of bullying or harassm e nt have you experienced at w o rk in the last tw o years?
■ a) Sexual h arassm ent 0%
□ b) Racial h arassm ent 2%
□ c) Bullying 28%
I d ) Violence or threat of violence at w ork 7%
□ e) None of the above 63%
Chart 32 Bullying by type
Bullying by type
15%10%
5%0%
____________________ I
. - o I---------------------------- - r - n□ Seriesl
Verba lly , Verbally , from Verbally , P h y s ic a ly , Physica lly , Physica lly , fro m a a colleague from fro m a fro m a from
manager 17% 12% sorreone manager 0% colleague 0% som eoneoutside the outside the
organisation organisation7% 2%
Type of bullying
The racial harassment deserves a comment that, while very low, the number of
respondents describing themselves as being of different ethnicity was correspondingly
low. This is potentially an area for concern as the workforce becomes more culturally
diverse.
Key Findings• Pay levels are not related to engagement.
• Work life balance is an issue for two fifths of the respondents.
83

Over a quarter of respondents reported being bullied or harassed.
The racial harassment deserves a comment that, while very low, the number of
respondents describing themselves as being of different ethnicity was
correspondingly low. This potentially is an area for concern.

Chapter 7_____ Management Leadership and Communication_________
7 Introduction
One of the most critical factors that influence both how employees feel
about their work and their level of performance is the way they are
treated by their managers. Direct supervisors and senior managers
have the power to make or break employee engagement levels in an
organisation.
In this chapter the questions that relate to, -what employees think about
their managers and organisational leaders,- how well they perceive
their organisation to be performing, -how communication is managed
and -what opportunities employees have for participation and
involvement, are examined.
7.1 What employees think about their managers?
A series of questions were aimed at finding out what employees really
think about their supervisor/boss. Chart 33 (strengths and weaknesses
of line managers) shows that although more than half of the sample
responded positively to six out of the twelve statements there was a
large negative response to the other six statements. Of particular
concern is the 58% who state that their manager rarely or never gives
them feedback on their performance nor discusses their training and
development needs with them. It is sad to think that 32% and 38% of
employees say that their manager rarely or never makes them feel that
their work counts or gives recognition when they have done good job.
85

One should consider this against the backdrop of over 80% reporting
that they are working to the best of their ability.
Chart 33 Line Manager Strengths and Weaknesses
Line Manager strenghts and weaknesses
-in order of strengths
Is committed to Southern & Western Business Unit Iamrod Eireann
Treats me fairly
Is supportive if I have a problem
Makes clear what is expected of me
Listens if I have a suggestion to make
Is open and honest
Consults me on matters of importance to me
Keeps me in touch with what's going on
Makes me feet my work counts
Recognises when I have done a good job
Gives you feedback on how I am performing
Discusses my training and development needs with me
0% 10% 20% 30% 40% 50% 60% 70% 80% 90% 100%
-i_______________________79% |10%|
69%
64% 18%
63%
27% j58%
31%-------- 152%
47% | 33%
46% f 31%
44% 38%
43%
30% 58%
30% 53%
These results can be broken down further,
There are significant differences in the responses of the senior
managers compared with all other respondents. Senior managers had
negative responses to two questions only, discuss my training and
development needs with me and, keeps me in touch with what is going
□ Always/Usually
■ Rarely/never
86

on. Their negative responses in these two areas were significantly
lower than the all other respondents.
The senior management are significantly more likely to be consulted
on matters of importance to them with 71% being affirmative to that
question.
Fig 7 Responses to questions on strengths and weaknesses of managers
QuestionsSeniorManagement
SeniorManagement
All respondents excluding Senior Management
All respondents excluding Senior Management
Always/Usually Rarely/never Always/Usually Rarely/neverConsults me on matters of importance to me 71% 0% . • 44% 35%
Discusses my training and development needs with me 43% 29% 29% 55%Recognises when I have done a good job 81% 0% 39% 34%Makes me feel my work counts 71% 0% 41% 44%Gives you feedback on how I am performing 71% 0% 27% 62%Is open and honest 71% 0% 49% 33%Is supportive if I have a problem 57% 0% 64% 20%Keeps me in touch with what's going on 43% 14% 45% 32%Makes clear what is expected of me 86% 0% 61% 20%Listens if I have a suggestion to make 71% 0% 56% 29%Treats me fairly 71% 0% 68% 16%
Is committed to Southern & Western Business Unit Iamrod Eireann 86% 0% 77% 10%
7.1.1 Drivers of engagement
The likely drivers of emotional engagement (Chapter 5) resulting from
line managers actions are that they;
87

• Makes it clear what is expected of me
• Listens if I have a suggestion to make
• Treats me fairly
• Is committed to Southern & Western Business Unit
So these are the issues most worthy of further analysis
Fig 8 Makes it clear what is expected of me
QuestionsSeniorManagement
SeniorManagement
All respondents excluding Senior Management
All respondents excluding Senior Management
Always/Usually Rarely/never Always/Usually Rarely/neverMakes it clear what is expected of me 80% 0% 61% 20%
One in five respondents are saying that their manager does not make it
clear what is expected. On further analysis of the respondent categories
that are in non-managerial grades in traffic operations the picture
becomes a little less positive. In this category 28% say that their
manager rarely/never makes it clear what is expected of them, while a
little over half (53%) of them say the manager always/usually makes it
clear.
Fig 9 Listens if I have a suggestion to make
QuestionsSeniorManagement
SeniorManagement
All respondents excluding Senior Management
All respondents excluding Senior Management
Always/Usually Rarely/never Always/Usually Rarely/neverListens if I have a suggestion to make 71% 0% 56% 29%
88

On further analysis of the respondent categories that are in non-
managerial grades in traffic operations the picture becomes a lot less
positive. In this category 40% say that their manager rarely/never listens
if they have a suggestion to make, while a 44% of them say the manager
always/usually listens to their suggestions.
Fig 10 Treats me fairly
QuestionsSeniorManagement
SeniorManagement
All respondents excluding Senior Management
All respondents excluding Senior Management
Always/Usually Rarely/never Always/Usually Rarely/never
Treats me fairly 71% 0% 68% 16%
Further analysis of the respondent categories that are in non-managerial
grades in traffic operations the picture becomes more positive than the
average. In this category 28% (higher than the average of 16%) say that
their manager rarely/never treats them fairly and 58% (lower than the
average of 68%) say the manager always/usually treats them fairly.
Fig 11 Is committed to Southern & Western Business Unit
QuestionsSeniorManagement
SeniorManagement
All respondents excluding Senior Management
All respondents excluding Senior Management
Always/Usually Rarely/never Always/Usually Rarely/neverIs committed to Southern & Western Business Unit 86% 0% 77% 10%
Analysis of the respondent categories that are in non-managerial grades
in traffic operations the picture becomes less is 10%) say that their
t
89

manager rarely/never treats them fairly and 65% (lower than the average
o f 77%) say the manager always/usually treats them fairly.
Key Findings
• 58% of employees say that their manager rarely/never gives them
feedback on how they are performing.
• 53% of employees say that their manager rarely/never discusses
their training or development needs with them.
• 79% of employees say that their manager is always/usually
committed to the S&W business unit.
• Those employees in the traffic non managerial grades are more
negative across the emotional engagement drives that the average
(excluding senior managers).
7.2 What employees think about their senior managers?
People were asked whether senior managers have a clear vision o f where
the organisation is going.
Chart 34 Leadership 1
■ The senior management team of Southern & W estern Business Unit
Agree 43% 44%
larnrod Eireann have a clear vision of where the organisation is going
■ 1 have confidence in the
Disagree 25% 34%senior management team of Southern & Western Business Unit larnrodEireann
0% 20% 40% 60% 80%
i
100%
90

7.2.1 Vision and Confidence in Senior Management
Just over one third of respondents (34%) agree/strongly agree that they
have confidence in the senior team of the S&W business unit while a
Over two fifths (44%) disagree/strongly disagree. In the age bracket 16
to 35 years 36% agree/strongly agree that they have confidence in the
senior team of the S&W business unit while a 32% disagree/strongly
disagree. It has been reported that younger people have stronger
confidence but there were insufficient numbers in the under 20-age
group to measure this.
In relation to clarity of vision by the senior management team 43% of
respondents agree/strongly agree while 25% disagree/strongly disagree.
In the 16 to 35 age group 41% of respondents’ agree/strongly agree
while only 18% disagree/strongly disagree.
7.2.2 Trust and Respect for Senior Management
Just over one third of respondents (46%) agree/strongly agree that they
In relation to trust of the senior management team 40% of respondents
agree/strongly agree while 35% disagree/strongly disagree. In the 16 to
35 age group 46% of respondents’ agree/strongly agree while 36%
disagree/strongly disagree, are treated with respect by the senior team of
the S&W business unit while a quarter (40%) disagree/strongly disagree.
In the age bracket 16 to 35 years 37% agree/strongly agree that they are
91

treated with respect by the senior team o f the S&W business unit while a
27% are treated with respect by the senior team o f the S&W business
unit while a quarter (40%) disagree/strongly disagree. In the age bracket
16 to 35 years 37% agree/strongly agree that they are treated with
respect by the senior team of the S&W business unit while 27%
disagree/strongly disagree.
Chart 35 Leadership 2 Senior management vision v
individuals support to achieve objectives
Agree 40% 46‘
Disagree 35% 35%
■ I trust the senior management team of Southern & W estern Business Unit Iarnrod Eireann
■ The senior management team of Southern & W estern Business Unit Iarnrod Eireann treat employees with respect.
0% 20% 40% 60% 80% 100%
By comparing whether employees perceive senior management as
having a clear vision as leaders with the extent to which they feel that
they themselves support the achievement o f organisational objective, an
interesting profile emerges. Almost 34% can be described as very
strongly committed visionaries and a further 39% can be described as
committed visionaries both groups agree that there is a clear vision from
92

the top and feel inclined to support the achievement o f the organisational
objectives.
This group taken as a whole less the senior managers (to avoid distortion
as senior managers are the most committed) show an engagement level
o f 66%. If the response to the question on physical engagement relating
to taking work home (most would not be in a position to do so as they
work in the station or on the trains) the engagement level increases to
7 0 % .
One in f iv e are what could be called “fence-sitters” ( 2 6 % ) and with the
obvious benefits that the correlation between those indicating a support
for the organisational goals and demonstrating engagement these
employees need to be convinced if their potential is to be maximised.
lart 36 Senior Management Vision v Support to achieve
<L>ISI§s1-1osC/)
Uncommitted Visionaries (2%)
Belief in senior management’s vision but little support for helping achieve organisational objectiv
Fence
Committed Visionaries (22%) Senior management has clear vision and committed as individuals to helping achieve organizational objectives
BlinkeredNon-committers (8%Little belief in senior management’s vision and little commitment to helping achieve organisational objectives
ommitted Non- Visionaries (41%)
ommitted to helping achieve organisational objectives but lack belief in senior management’s vision
T3<Uao —J
Commitment to helping achieve organisational objectives
I nw/m pHinm High
93

Fig 12 Ail respondents to Question 7 To what extent do you agree or disagree that you are committed to helping larnrod Eireann achieve its objectives and aims?________ _______
7To what extent do you agrec|or disagreathat you are committed to helping Iamrod Eireann achieve its objectives and aims? %
Strongly disagree 2%Disagree 3%
Neither agree nor disagree 22%
Agree 39%
Strongly agree 34%Disagree 5%Agree 73%
Fig. 13 Engagement of those with support of organisational objectives excluding senior managers._____________ _____
Engagementcomponent Engagement questions Engaged
Stronglyengaged Average
CognitivePerforming m y job is so absorbing that l forget about everything else 31% 7% 38%
CognitiveI often think about other things
when performing m y job 38% 7% 45%
CognitiveI am rarely distracted when
performing my job 59% 6% 65%
CognitiveTim e passes quickly when I
perform my iob 69% 18% 87%
Emotional I really put my heart into m y job 58% 32% 90%
EmotionalI get excited when I perform well
in my job 51% 17% 68%
Emotional1 often feel emotionally detached
from my job 46% 18% 64%
EmotionalMy own feelings are affected by
how well I perform m y job 58% 7% 65%
PhysicalI exert a lot of energy performing
my job 52% 10% 62%
Physical I stay until the job is done 65% 32% 97%
Physical1 avoid working overtime
whenever possible 48% • 24% 72%
Physical I take w ork home to do 18% 0% 18%
Physical I avoid working too hard 54% 34% 88%
Average 50% 16% 66%Less I take w ork home to do 18% 0%
Altered average 52% 18% 70%
94

Key Findings
• One quarter of people do not think senior managers have a clear
vision of where the organisation is going.
• Only 35% trust their senior managers.
• Only 34% have confidence in the senior management team of the
S&W Business Unit.
7.3 Communication
Almost a third (32%) of respondents state that they feel they are fully or
fairly informed about what is going on. Almost one third of respondents
(31%) say that they are not told very much about what is going on in the
company. This figure rises to 60% if those who report that they receive
only a limited amount of information are included ( see Chart 37 below).
This is somewhat at odds with the culture survey that reports that over
70% are happy with the company's publications. Perhaps the frequency
and content of the publications need to be reviewed. This may also be a
reflection on the line manager communication deficit. Further analysis
indicated that (a key group for information flow) 83% of the Station
Managers say that the company gave them limited or not much
information.
95

Chart 37 Internal Communications
□ My business unit keeps me fully informed 6%
□ My business unit keeps me fairly well informed 26%
□ My business unit gives me only a limited amount of information 29%
□ My business unit doesn't tell us much at all about w hat goes on 31 %
■ Don* know/no opinion 10%
Over a third (36%) of respondents say that they can usually believe the
information they receive about what is happening in the organisation, but
only 12% say that can always believe it, and 25% say that they can
seldom or never believe it (see Chart 38).
Chart 38 Credibility of information received
Credibility of information received
□ I can always believe it 12%
□ I can usually believe it 36%
□ I can believe itabouthalf the time 16%
□ I can seldom believe it 17%
■ I can nev^r believe it8 %
□ Don't know/no opinion 13%
12% 12%
16%
Internal communications
96

Further cross analysis into the responses on internal communications
gives an interesting perspective. The level of information the
respondents feel they have compared against the perceived credibility of
the information they receive. In Chart 39 the top right hand quadrant
shows that over one third (35%) can be described as “Informed
Believers”; that is they are more likely to know what is happening in the
organisation and feel that the information they receive is credible. This
group is of broadly average age profile; with two major differences, one
expected the other not. The vast majority of senior managers were
located in this category as expected but none of the drivers fell into the
“Informed Believer” category.
Chart 39 Level v credibility o f information
_c00
X
▲
Feel
info
rmed
ab
out
wha
t’s go
ing
on in
the
or
gani
satio
n has
cle
ar vi
sion
Informed Doubters (0%) Fully/fairly well informed but lack of belief in information received
Informed Believers (35%) Fully/fairly well informed and believe information communicated
Fence Sitters~7 31% J
Uninformed
▼
Uninformed Doubters(20%) Little or no information and lack of belief in information received
Believers ( 14%)Little information
but believe that received
Low
/med
ium Believe information communicated
W
I .nw/meHnim High
97

Key Findings
• Over four fifths (83%) of the Station Managers say that the
company give them limited or not much information.
. • No Driver fell into the “Informed Believer” category.
• A quarter of respondents (25%) say that they can seldom or
never believe information they receive.
7.3.1 Participation
Over one third of respondents say that they are dissatisfied/very
dissatisfied with opportunities in the company to feed their views and
opinions upwards, while 28% are satisfied (see chart 40). This does not
appear to be influenced by size of location or location. However over
90% of drivers were dissatisfied/very dissatisfied with the opportunities
they have. The senior managers followed by the train hosts were the
most satisfied with their opportunities.
7.3.2 Downward v Upward Communication
The level of information that employees feel they receive can be
compared with the opportunities they perceive they have for upward
feedback. The "Informed Communicators” group (top right quadrant),
who constitute 17%, are those who feel informed about what is
happening in the organisation and who also feel they have the
opportunity for upward feedback.
98

Chart 40 Satisfaction with opportunities for upward feedback.
This group is more likely to feature executives and clerical employees
(approx 33% of them), surprisingly it only contains 28% of the senior
managers. Conversely, 24% can be described as “Uninformed Non-
Co mmunicators,, these have little information or opportunity for upward
feedback these are predominately in the Driver and Station Operative
grades. No Drivers or traffic grades are in the small group of “Informed
non-communicators” with information but little opportunity, and the
“Uninformed Communicators” (11%) (twice the reported level in the
CIPD 2006 survey) who have the chance for upward feedback but little
information coming to them. Fewer than one in four are “Fence-sitters”
and therefore open to persuasion (see chart 39).
99

Low
/med
ium
H'
Sh
Chart 41 Downward V Upward Communication
ooo•s s0 .2w> 55
1 * > 73
5 •*«j c oT 3 . Oe to^ -ac2 §.5 SP —, o« (U (D £U< -5
Informed Noncommunicators (6%) Fully/fairly well informed but little opportunity to feed information upwards
Informed Communicators(17%) Fully/fairly well informed and have opportunity for upward communications
_ / Fence Sitters \_ _( 230//° ) Uninformed V y Communicators
Uninformed Non- (11%)communicators (24%) Little or no information and lack of opportunity for upward feedback
Little information but have opportunity to feed information upwards
Have opportunity for upward communication
I .Ow/mrdin High
Key Findings
• Over one third of respondents (38%) say that they are
dissatisfied/very dissatisfied with opportunities in the company to
feed their views and opinions upwards.
• Over 90% of drivers were dissatisfied/very dissatisfied with the
opportunities they have.
• One third of the executive/clerical grade respondents are in the
“informed communicators” quadrant.
1 0 0

Chapter 8 Attitudes to Work
S Introduction
In the modem Irish economy many people spend more of their waking hours at
work than with their families. The way we feel at work is therefore an
important part of our overall emotional well-being. Organisational performance
depends not only on the cognitive input of the individual but also on how
employees respond emotionally to their work.
This chapter is concerned with how people feel about their work. Are they
satisfied with the work they do, is their work meaningful to them, do they feel
stressed and pressured and if so what is the impact on their work performance?\
The core topics examined are;
• Job satisfaction
• Experience of stress and work pressure
• Emotional responses to work
• Commitment and loyalty
8.1 Meaningfulness
The correlation between whether someone’s work is personally meaningful to
them should have a big impact on how they feel about their work overall.
People whose work goals are related to their own interests and goals are much
101
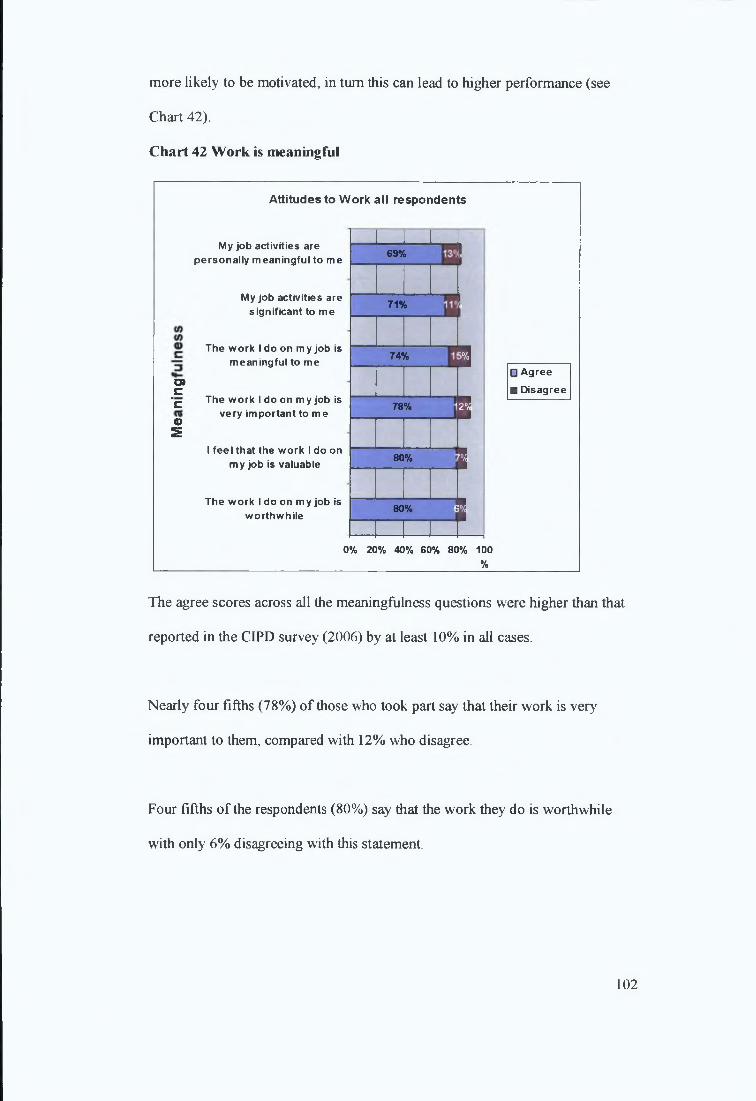
more likely to be motivated, in turn this can lead to higher performance (see
Chart 42).
Chart 42 Work is meaningful
Attitudes to W ork all respondents
o»c’co2
My job activities are personally m eaningful to m e
My job activities are significant to me
Th e w o rk I do on m y job is m eaningful to me
Th e w o rk I do on m y job is very important to m e
I feel that the w ork I do on m y job is valuable
Th e w o rk I do on m y job is w orthw hile
L _ L . . J 1 i69% |
71%1
74% 1I78% I
80% 2
80% " 1I
□ A g re e
■ Disagree
0% 20% 40% 60% 80% 100%
The agree scores across all the meaningfulness questions were higher than that
reported in the CIPD survey (2006) by at least 10% in all cases.
Nearly four fifths (78%) o f those who took part say that their work is very
important to them, compared with 12% who disagree.
Four fifths o f the respondents (80%) say that the work they do is worthwhile
with only 6% disagreeing with this statement.
102

The least positive answer (69%) is in response to the question on job activities
being personally meaningful to the individual.
8.1.1 Managers v non-managers
One particularly strong finding is the difference between managers and non
managers. Work is more meaningful to managers than non-managers overall.
On the negative side on the two questions; the work I do is very important to me
and I feel that the work 1 do on my job is valuable twice as many non-managers
as managers disagree with this statement (Chart 43). The least difference
between the two groups (3%) is the one that scored the lowest in the overall
score “m yjob activities are personally meaningful to me”.
Chart 43 Comparison Manager v non manager meaningfulness
Comparison of Manager v Non manager disagree respones to meaningfulnessquestions
20% 18% 16% 14% 12% 5? 10% 8% 6% 4% 2% 0%
15%---- 17°
9% 9% WK ~6% —
3%
D Disagree non managers
■ Disagree managers
The work I do Myjob The work I do Myjob The work I do I feel that the on myjob is activities are on myjob is activities are on myjob is work I do on
very important personally worthwhile significant to meaningful to myjob is tome meaningful to me me valuable
me
Meaningfulness questions
In the responses to four out of the six questions on meaningfulness o f work
managers were 20% more positive in their responses than non-managers (Chart
44 ).
103

Chart 44 Comparison on meaningfulness managers v non-managers
Comparison of Managers v Non managers agree responses to meaningfulness questions
The work I My job The work! My job The work I (fed thatdo on my activities are do on my activities are do on my the work I do
job is very personally job is significant to job is on my job isimportant to meaningful worth whle me meaningful valuable
me to me to me
Meaningfulness questions
Key Findings
• Four fifths of the respondents (80%) say that the work they do is worthwhile
with only 6% disagreeing with this statement.
• The agree scores across all the meaningfulness questions were higher than that
reported in the CIPD survey (2006) by at least 10% in all cases.
• In all cases the managers scored more positively than non-managers in relation
to the questions on the meaningfulness of their work.
• The least difference between the two groups (3%) is the one that scored the
lowest in the overall score “my job activities are personally meaningful to
me .
8.2 Job satisfaction
Of interest to the company is how satisfied people are with their job overall.
The last culture survey completed in Iamrod Eireann (2005) reported a score of
45% averaged across the section of questions. The CIPD (2006) findings
104

showed that 52% of respondents felt satisfied or very satisfied with their current
job, while 26% were dissatisfied or very dissatisfied. The current survey of
larnrod Eireann showed 63% satisfied or very satisfied with their current jobs,
while 16% were dissatisfied or very dissatisfied (Chart 45).
Chart 45 Overall job satisfaction
Overall job satisfaction
6%□ Very dissatisfied 6%
■ Dissatisfied 11%
□ Neither dissatisfied nor satisfied 13%
□ Satisfied 50%
■ Very satisfied 16%
49%
8.2.1 Involvement v job satisfaction
Almost three fifths (58%) of employees can be described as the “Enchanted -
Involved”, that is, they feel interested and involved in the organization and are
satisfied with their current jobs. This group displays high engagement levels
and is most likely to be found in senior managers, station managers and train
hosts. Conversely, the “Disenchanted -Uninvolved” 6% are those who have
little interest or desire for involvement and who are dissatisfied in their jobs.
This group shows low level of engagement and it is more likely to feature
Drivers.

Of interest is the untapped “Enchanted -Uninvolved” group (13%), who are
happy in their jobs but have a strong desire for greater involvement.
Chart 46 Senior management vision v individual support to achieveorganisational objectives
00
£
-o0)J£oJ
Ofu,O0>
m.5S£D’oC
Disenchanted - Involved Enchanted -Involved(10%) (58%)
Feel involved in the Feel involved in theorganisation but dissatisfied organisation and satisfiedwith current job with current job
/ Fence Sitters( 7% Enchanted -
y UninvolvedDisenchanted -Uninvom*^ (13%)
(6%) Satisfied with currentLittle/no desire for job but would likeinvolvement and dissatisfied greater involvement inwith current job the organisation
Job Satisfaction
T .nw/m fiH ium High
Note ; Fence sitters are those who are neither dissatisfied nor satisfied with job and would like to
know what’s going on and would like to get more involved.
Key Finding
Employees who are more satisfied with their work overall are more engaged.
Further analysis of the data to measure levels of satisfaction with particular
aspects of work (see Chart 46.1 to 46.4)) there are some very important findings.
1 0 6

Chart 46.1 to 46.4 Job Satisfaction
46.1
100%90%8 0%70%60%50%40%3 0%20%10%
0%
Job Satisfaction 1
92%
Overall, how satisfied or dissatisfied
would you say you are with your current
job?
The physical working
conditions
The freedom to choose your
own method of working
Relations with your fellow
workers
Questions on job satisfaction
46.2 Job Satisfaction 2
Job satisfation 2
_Z1%
□ Dissatisfied
H Satisfied
Overall, how satisfied or dissatisfied would you
say you are w ith your
current job?
The recognition you get for good work
Yourimmediate
The amount of
responsibility you are given
Your rate of pay
Questions on job satisfaction
107

463 Job Satisfaction 3
Job s a tis fa c tio n 3
8 0 %7 0 %6 0 %5 0 %
71%
Overall, how satisfied or dissatisfied would you
say you are with your
current job?
Your opportunity to use your
abilities
Relationsbetween
employeesand
managers
Your chances of promotion
The way Southern &
Western Business
Unit larnrod Eireann is managed
Q u e s tio n s on jo b s a tis fa c tio n
□ Dissatisfied
■ Satisfied
46.4 Job Satisfaction 4
Job satisfaction 4
90%80%70%60%50%40%30%20%10%
0%
71% ,
oz-vi/ooo, -*Q0/44%007u007'.'--- —I---- 1
to /o - W1— ■ 1---- 11 § ---1--- LJ ; 1 1
82%
Overall, how satisfied or dissatisfied would you
say you are w ith your
current job?
The attention paid to the
suggestions you make
Your hours of w ork
The amount of variety in
your job
Your job security
□ Dissatisfied
■ Satisfied
Questions on jo b satisfaction
It can be seen here is that people currently derive most of their satisfaction from
their relationship with their fellow workers (92%) and job security (82%), both
1 0 8

are above the overall average. Twelve of the fifteen items scored higher on the
dissatisfaction scale than the average (16%) the top three dissatisfiers were rate
of pay (43%), recognition for good work (40%) and hours of work (38%).
At least a third of respondents cited dissatisfaction in relations between them
and their managers, attention paid to the suggestions they make, the way the
S&W is managed and their opportunities to use their abilities. This last statistic
indicates that there is a huge untapped potential in the workforce.
8.2.2 Managers v Non-managers
Overall managers tend to be more satisfied with most aspects of their work than
non-managers. By separating out managers and non-managers (Chart 47) the
responses become starker. While, a little over a quarter of managers (27%) are
unhappy with the recognition they get for good work, the non-managers are
much more unhappy clocking in at nearly half (45%).
While almost four fifths (79%) of managers are satisfied with their immediate
boss less than half (48%) of the non-managers are satisfied. Managers are
nearly twice as satisfied as non-managers are (70% v 38% respectively) in
relation to opportunities to use their abilities. Managers are more than twice as
satisfied as their staff (55% v 21% respectively) with both how the business is
being managed and attention to being paid to suggestions being made.
109

The only areas where managers are more dissatisfied than non-managers is in
relation to rate of pay (55% v 36% respectively) and hours of work (39% v 36%
respectively).
Chart 47 Comparison Managers v non managers job satisfaction
M anagersNon
m anagersNon
m anagers M anagers
Satisfied Satisfied Job satisfaction questions Dissatisfied Dissatisfied
73% 64% The physical workinq conditions 32% 18%
76% 64%The freedom to choose your own
method of working 21% 9%
97% 89% Relations with your fellow workers 5% 0%
58% 39%The recognition you get for good
work 45% 27%
79% 48% Your immediate boss 33% 15%
79% 62%The amount of responsibility you
are given 18% 12%
30% 44% Your rate of pay 36% 55%
70% 38%Your opportunity to use your
abilities 41% 15%
52% 38%Relations between employees and
manaqers 41% 27%
45% 30% Your chances of promotion 44% 21%
55% 21%
The way Southern &. W estern Business Unit Iam rod Eireann is
managed 41% 12%
56% 27%The attention paid to the
suggestions you make 41% 21%
45% 47% Your hours of work 36% 39%
85% 62% The amount of variety in your job 20% 9%
82% 80% Your job security 9% 9%
Key Findings
• At least a third of all respondents cited dissatisfaction in relations
between them and their managers, attention paid to the suggestions they
make, the way the S&W is managed and their opportunities to use their
abilities.
• When non-managers are look at separately in relation to dissatisfaction
the above figure rises to 41% on the same questions, namely attention
110

paid to the suggestions they make, the way the S&W is managed and
their opportunities to use their abilities.
• Nearly half (45%) of non-managers are dissatisfied with the recognition
they get for good work.
83 Experiences of Stress and Pressure
Levels of stress in the workplace are supposedly on the rise. It has been said
that nearly 10% of the UK GNP is lost every year as a result of workplace
stress (Arnold (2005) p 398). Almost two fifths of respondents (39%) say
that their job in not at all stressful or only mildly stressful, but 23% report
experiencing high level of stress. Interestingly, stress does not appear to be
related to engagement.
Chart 48 Stressfulness of job all respondents
Stressful ness of job all respondents
Extremely s tressfu l 3%
Not at all
□ Not at all stressful 16% B Mildly stressful 23%
Mildly s tre s sfu l ° Moderately stressful 38%23% □ Very stressful 20%
■ Bctremely stressful 3%
Moderately s tressfu l 38%
People were also asked how often they feel under excessive pressure in their
jobs. The comparison between managers and non-managers is shown in
(Chart 50). Nearly two fifths of managers (39%) say they feel very stressful

compared with 14% of non- managerial employees. In the manager group
Station Managers and Station Controllers were the most likely to feel very
stressful and of the non-managers the most likely to be in this category was
Drivers. No manager said they were feeling extremely stressful but o f the
small number o f non-managers feeling extremely stressful the majority were
again Drivers.
Chart 49 Stressfulness managers v non-managers
Stressfulness m anagers v non-m anagers
39% 39%
Not at all Mldly Moderately Very Extremelystressful 3% stressful stressful stressful stressful 0%
18% 39% 39%
Questions on stressfulness
Chart 50 Time under excessive pressure
Time spent under excessive pressure
11% 19%
3 1 %
□ Never
■ O nce or twice a month
□ O n ce or twice a week
□ Everyday
3 9 %
1 1 2

Another important factor is how much control people feel they have over
their work. Perceived control has been shown to be critical psychological.
People who feel that they are not in control o f their work are more likely to
experience stress. Increased autonomy increases control and can reduce
work-related stress. Most employees (84%) report feeling a great deal of
control or a fair amount o f control over the way they do their work, while
(6%) report having little or no control (see Chart 51). It is a surprise that
there is no significant difference between managers and non-managers when
a great deal and fair amount o f control are added together (see Fig 14).
Chart 51 Control over the way the job is done
Control over the w a y the jo b is done
□ A great deal of control3 7 %
■ A fair amount of control 4 7 %
□ Not much control 10%
□ Just a little control 3 %
■ No control 3 %
113

Fig 14 Control over job
How much control do you feel you have over the way you do your job? Managers Non-managers All respondents
A great deal of control 21% 47% 37%
A fair amount of control 64% 39% 47%
Not much control 9% 8% 10%
Dust a little control 6% 2% 3%
No control 6% 3% 3%
Great deal/fair amount of control 85% 86% 84%
Not much/just a little 15% 10% 13%
Key findings
• There is no relationship between levels of stress and engagement.
• Nearly a quarter of employees experience high levels of stress.
• Over 30% feel under excessive pressure once or twice a week and
31 % feel under excessive pressure every day.
• There is no significant difference between managers and non
managers when a great deal and fair amount of control over the way
the job is done are added together.
114

Understanding emotions at work is important to understanding people’s
behaviour and is a critical element in performance management. In many jobs,
people who feel positive about what they do are also engaged and able to
perform to the best o f their ability.
8.4.1 Looking forward to work
Respondents were asked how often they really look forward to coming to work,
only 7% say “all o f the time”, while a further 19% say “some of the time” and
15% say they rarely or never look forward to coming to work (see Chart 52).
The difference between managers and non-managers provides some insight
underlying these figures (see Chart 53). Managers are more likely to look
forward to work most o f the time and less likely to, rarely look forward to
coming to work.
Chart 52 Looking forward to work all respondents
Look forward to work all respondents
8.4 Emotional Responses to Work
□ All of the time 7 %
m Most of the time 5 4 %
□ Som etim es 19%
□ Rarely 15%
■ Never 5 %
115

Chart 53 "Looking forward to work Managers v non-managers
Looking forward to work
80%70%60%50%
67%
□ Managers H Non-managers
All of the Most of Sometimes Rarely Nevertime the time
Response to question-When you get up in the morning, how often do you
really look forward to work?
Over two fifths (44%) of respondents say that their work had not, or only
occasionally, made them feel enthusiastic over the previous few weeks. This is
of particular concern to the company as I have found that high levels of
enthusiasm are associated with high levels of engagement and performance (see
Chart 54).
While
8.4.2 Emotions experienced over the previous few weeks
Respondents were asked twelve questions about the emotions that they had
experienced over the previous few weeks at work. These items were averaged
to create two scales;
1. The extent to which people feel depressed or enthusiastic
116

2. The extent to which people feel anxious or content
3. The respondents say that 40% of them are content with their work, and
44% enthusiastic about their work (see Chart 54). The scores in the CIPD
survey (2006) were 33% and 43% respectively.
Chart 54 Emotions towards work
ScalesAllrespondents Never/occasionally
All/most of the time
Enthusiastic Enthusiastic 44% t 36%
Enthusiastic Optimistic 44% 30%
Enthusiastic Cheerful 39% 55%Average 42% 40%Content Relaxed 63% 42%Content Calm 30% 43%Content Contented 36% 48%Average 43% 44%Anxious Uneasy 82% 3%Anxious Gloomy 79% 6%Anxious Tense 65% 7%Average 75% 5%Depressed Miserable 83% 2%Depressed Depressed 88% * 4%Depressed Worried 78% 6%Average 83% 4%
Over two fifths (44 %) of respondents say that their work, never, or only
occasionally, made them feel enthusiastic over the previous few weeks. This is
particularly concerning; given that I found that high levels of enthusiasm are
associated with high levels of engagement and performance.
While 76% of people report feeling interested and involved in the organisation,
and nearly a quarter (23%) do not feel either interested or involved (see Chart
55). Of the 76% reporting feeling interested and involved, 40% of those would
like to become more involved.
117

8.4.3 Views on working for larnrod Eireann
Chart 55 Views on working for larnrod Eireann
Views on working for larnrod Eireann
7%
Ifera
40%
□ I’m not reaHy interested in my organisation, it’s just a job 7%
■ I like to know w hat’s going on, but I don't w ant to get involved 16%
□ I like to know w hat's going on and w ould like to get more involved 40%
□ I like to know w hat's going on and am already involved 36%
There are some differences worthy of comment 0% of managers and females
say that they are not really interested in my organisation its just a job. Therefore
all the respondents saying that they are not really interested in my organisation
it’s just a job came from males in non-managerial positions.
Chart 56 Involvement
Involvement
0 Males o >» oj= Females o° N on- o managers
Managers
0% 20% 40% 60% 80% 100%
%
n r r i i i9%| 16% 40% 33%
39% 43%
11%| 21% 45% 21%
■ 21% 70%
□ Tm not really interested in my organisation, it’s just a job
■ I like to know w hat’s going on, but I don’t w ant to get involved
□ I like to know w hat’s going on and would like to get more involved
□ I like to know w hat’s going on and am already involved
118

Key Findings
Only 7% o f people look forward to coming to work all o f the time, while 20%
rarely or never do.
Nearly a quarter of respondents do not feel interested or involved in the
organisation. A surprisingly low figure as the corresponding figure in the CIPD
2006 survey recorded nearly half for the same measurement.
No females or managers say that they are “not really interested in my
organisation it’s just a job”.
8.5 Organisational Commitment and Loyalty
Previous studies in Iamrod Eireann have shown that employees have more
loyalty to their colleagues than to the company.
8.5.1 Loyalty
Compared with some other findings, those on loyalty are generally very
positive. Levels o f loyalty are high overall, but there are some interesting
differences (see Chart 57)
Chart 57 Loyalty
L o ya lty
Yo ur p ro fe ss io n or occupation
Yo u r cu s to m e rs and c lien ts
Iarnrod E ire a n n
Y o u r im m ed iate su p e rv iso r
r ! i m i i i i
K Q I 76%
-
♦ 19% I 73%
H 22% 1 €€%
10% | 9 % | 2 0 % 62%
I 13% | 13% B 2 1 % 49% I
------------------------------------------------------1______________ ______________ 1---------------------------,
0% 20% 40% 60% 80% 100%
□ No loyalty at a ll
■ O nly a little loyalty
□ S o m e loyalty
□ A lot of loyalty
119

Most respondents (82%) feel some loyalty or a great deal o f loyalty towards
Iamrod Eireann (This is a little higher that the recent CIPD (2006) survey where
the corresponding figure was 74%). This response rate for managers is 97%
and 96% for females. Similarly, 78% o f respondents are proud to work for
Iamrod Eireann.
Overall 90% o f respondents feel some or a great deal o f loyalty towards their
occupation or profession. Female respondents reported 100% on the same
question.
Some 70% o f all respondents report some, or a great deal o f loyalty towards
their immediate supervisor. This is particularly true o f females (96%) and
managers (91%) however; males are at 70% (see Chart 58).
Chart 58 How much loyalty comparisons
How much loyalty do you feel?
Females
Males
Non--o 0)E managersE
O Managers >-
*% “ i n i r| 22% 74%
II
13% 113%| 21% 49%
i20% 15%| 17% 45%
■
1 30% 61%
---------- ------- 1
0% 20% 40% 60% 80% 100%
%
□ No loyalty at all
E3 Only a little loyalty
O Som e loyalty
□ A lot of loyalty
1 2 0

Eighty eight per cent report some, or a great deal of loyalty towards their
customers and clients this is particularly true of women, over 55 5s, traffic staff
and train hosts.
Chart 59 Loyalty to customers and clients
Some/a lot of loyalty to your customers and clients question
Categories of em ployees
— ♦— Some/a lot of loyalty1
Drivers have the highest responses; for little or no loyalty to clients and
customers at 30%.
The greatest degree of loyalty is towards co-workers; 91% say that they feel
some or a great deal of loyalty toward their colleagues- and this is significantly
truer of managers than non-managers. This finding is in line with the previous
two CIPD surveys (2006) and (2004).
This reflects the findings reported earlier where more respondents say they are
satisfied with their relations with co-workers than with any other aspect of their
job.
121

8.5.2 Committed to helping Iamrod Eireann achieve its objectives
Responses were sought from people as to whether they felt committed to
helping Iamrod Eireann achieve its objectives and aims.
People were asked whether they felt committed to helping Iamrod Eireann
achieve its objectives and aims; 75 % say that they do, only 5% disagreeing (see
Chart 60). Managers feel more committed than non-managers; 88 % compared
with 67 %.
Chart 60 Commitment to helping achieve objectives
Commitment to helping larnrod achieve its aims and objectives
Strongly
agree
o Agreeo>CO<0
coE
CL0>77
Neither
agree nor disagree
Disagree
Stronglydisagree
□ Women
□ Non-managers
■ Managers
□ All respondents
60%
122

Key findings
• Over four fifths of respondents feel loyal towards larnrod Eireann.
• Eighty eight per cent report some, or a great deal of loyalty towards their
customers and clients.
• Some 70% of all respondents report some, or a great deal of loyalty
towards their immediate supervisor.
• Three quarters of respondents are committed to helping larnrod Eireann
to achieve its objectives.
• Women are more satisfied with all aspects of their work than men.
The importance of positive attitude to work has been emphasised throughout this
project. “ Evidence from research into emotions at work show that there are two
significant influences on individual emotions; personality and environment, which
interact. Some people tend to have a happy outlook on life that is resilient to the
stresses o f working life. Other people tend to have a negative view even in objectively
good circumstances. However, most people need organisations to create a positive
working environment to sustain their ability to work effectively”CTPD (2006 p27).
123
Chapter 9Outcomes
9 Introduction
Iamrod Eireann needs to know what happens as a result of people’s
experiences at work in terms of whether they intend to quit the
organisation, how well they are performing and the levels of absence
due to illness. Prior research has shown that disaffected employees are
more likely to quit and more likely to take sick leave than their more
contented counterparts. The core topics examined were;
• Individual performance
• Intention to quit
• Sick absence
9.1 Individual performance
People were asked to rate their performance according to a number of
criteria. First they were asked whether they feel they have the
knowledge they need to do their work to a high standard. The vast
majority (88%) agree. This figure was 81% in the CIPD survey. They
were then asked if the had the skills they need to do their jobs and a
similar figure (85%) agree (this was 76% in the CIPD survey). When
asked about the quality of their work and their performance in relation
to their ability most agreed on both counts (see Chart 61),

Chart 61 Individual Performance
Please state the extent to which you agree or disagree with each of the following statements
relating to your knowledge, skills and job performance
120%
100%
80%
60%
40%
20%
0%
8b% 81%
6% 5% 1% 1%
□ Agree
■ Disagree
I have the I have all the My work is of Overall, I know ledge that skills excellent perform to theI need to do my necessary to quality best of rryw orktoahigh do my job ability
standard
Questions
The performance chart below (62) shows that 86% of respondents
consider their work performance to be the same to much higher than
others. The implication of this report is that people do not have an
accurate picture of their performance. This could be considered an
issue in relation to a failing of honest feedback from line managers in
relation their staff s performance. This was indicated as one of the
drivers of engagement in Chapter 5.
125

Chart 62 Performance comparison
Overall, how do you think that your performance at work compares with
others doing a similiar job?□ My performance is much
low er 0%
■ My performance is lower 1%
□ My perform ance is about the same as other people in a similar role 42%
□ My performance is higher 13%
■ My performance is much higher 13%
□ Don't know 12%
9.2 Intentions to quit
Some 84% of employees plan to remain within larnrod Eireann for the
foreseeable future.
Chart 63 Intentions to stay
Only 6% are actively seeking outside employment
1 2 6

Chart 64 Consideration of exit
Have you ever thought about leaving this job;
6%
/ \ M \ 4 3 %
□ 1 have never even thought about leaving this job 43%
O 1 have so m e tim e s thought about leaving this job but have never done anything about it 30%
-------- - □ 1 have looked around for other jobs 21%
□ I am currently in the pro cess in trying to leave this job 6%
Over one third of employees hope to gain upward promotion and two
fifths plan to remain in their current role. It would appear that 10% are
probably seeking a transfer.
Chart 65 Future intentions
□ Stay w h e re you are in your cu rre n t job 40%
Gain upw ard prom otion to a higher level 35%
□ M ove to a position of sim ilar responsibility in another area of your organisation 10%
□ None of the above/other 2%
Don’t know 13%
127

Of those who intend to move, the following chart shows the reasons in
descending order of frequency of response. In the era of the celtic tiger
and the pressures on the commuting working population this aspect
does not appear to have impacted on larnrod Eireann employees. The
top four responses appear to indicate promotion, job satisfaction
promotion and flexible working hours.
Fig, 15 Reasons for leaving
If you intend to leave your job within the next year, what are your reasons? %
To find a different job within your organisation 15%
Job satisfaction 11%
Opportunities for promotion 10%
More flexible working hours 10%
Better pay/benefits elsewhere 10%
To do a different type of work 4%
Other reason 4%
To find another similar job with a different organisation 3%
To return to (full time) study 2%
To retire 2%
To care for vour children 2%
T o be self-employed 2%
To care for other dependents 0%
Easier/shorter journey to work 0%
9.3 Sickness Absence
The majority of employees (82%) take under 6 days sick absence per
annum, with 66% taking under 3 days per annum.
(128

Chart 66 Sick leave taken in last year all respondents
How many days have you taken as sick leave in the past year?
Q■ 0-1 day 38%
□ 2-3 days 28%
□ 4-5 days 16%
■ 6-10 days 8%
□ 11-15 days 5%
Q 16-20 days 1%
□ 21 + days 3%
28%
The average compared with the over 55 years of age group is worth
considering as the older age who are more engaged than the average
report a sick leave rate of 71% who take under 3 days sick days per
annum. There is a significant difference at the zero to one day sick
absence rate with the average being 38% compared to 57 % of the over
55 age group. This means that a lot more of the over 55’s take a
minimal amount of sick leave. This could indicate that levels of
engagement are correlated to the taking of less sick leave.
129

Chart 67 Sick leave over 55’s
□ 0-1 day 57%
■ 2-3 days 14%
□ 4-5 days 0 %
□ 6-10 days 14%
■ 11-15 days 14%
□ 16-20 days 0%
■ 21+ days 0%
When the genders are compared in relation to sick absence there is no
significant difference between them. As females are more likely to be
engaged one would have expected to see a difference. Perhaps other
factors such as family responsibilities are impacting. At the four to
five days measure females are almost twice as likely to take a week off
sick but less likely than a male to take two weeks off.
130

Chart 68 Sick Absence by gender
Sick absence by gender
0-1 2-3 4-6 6-10 11-15 16-20 21+day days days days days days days
Number of days
Station Managers are an engaged category and matched against the drivers they take
significantly less sick leave. Drivers are more likely to take a longer sick absence than
the average across all respondents.
Chart 69 Sick Absence Station Managers v Drivers
Average sick leave v Station Managers v Drivers
90% 83”&■■■
| □ Statii
|| 38% a Drivei| > 1A°L □ All rcI I m 17%sJ n 18%n I 9 1 Wr ■ h ■ 5%I I o % U 0% r i 0,m__ 0%0%1% 0% 0%
1— 1
0-1 day 2-3 days 4-6 days 6-10 days 11-15 days 16-20 days 21+ days
____________________________ Number of days_____________________________
131
/

Key Findings
• The majority of people believe they have the knowledge and skills they need.
• Most people think they are performing well.
• Over 80% of current employees intend to remain with the
company
• In the region of 40% of employees expect to be doing the same
job next year, a further 10% expect to be doing the same job
but in different location next year.
• The over 55 years take less sick leave than younger employees.
• Employees who take more sick leave are less engaged with
their work
• There is no link between sick leave and performance.
t
132

Chapter 10 Findings and Managerial Implications
10.1 Introduction
The findings of this study have important implications for managers in Iamrod
Eireann. In this chapter, I wish to consider the overall findings of the survey,
and the key actions that managers can take to drive up the levels of engagement
and performance and improve employees’ experiences of their working lives.
10.2 Model of Engagement
The model in Chart 70 shows the links between managerial behavior and
processes, engagement, performance and intentions to stay with the Iamrod
Eireann. The factors included are those that emerged through regression
analysis as being the areas of managerial action most significantly related to
engagement levels. Aspects other than engagement, such as, job satisfaction,
age and job content are also strongly associated with engagement. Engagement
and people's choice of engaging and the levels of engagement they are prepared
to offer an organisation must be considered in a holistic and systemic context. It
cannot be demanded by management although management are responsible for
the largest component of it through their actions and words, other contributors
are the job itself and individual preferences.
10.3 Factors for consideration
Five factors that should be taken into consideration are those that have been
shown in Chapter 5 to be the drivers of engagement in Iamrod Eireann. The
aspects of managerial actions required to foster engagement identified as a result

of the survey and analysis are the same at those identified by the CIPD 2006
except for item, the CIPD identified “feeling informed about what is going on”
but my analysis showed that in larnrod Eireann “support for colleagues who
have problems” to have a stronger association, albeit with physical engagement
rather that the other two aspects. Nonetheless, I would accept its validity on the
basis that the organisation has quite a family feel to it and very if not exceptional
strong loyalty towards other colleagues.
Chart 70 Managerial action, engagement, performance
134

103.1 Factors when interpreting the model
Four factors should be taken into consideration when interpreting the model.
Firstly, the managerial factors shown in overall model above are those which I
found to be significantly associated with engagement and performance. I did not
consider the intention to stay, in the mode, as currently Iamrod Eireann does not
have a history or current issue with turnover.t
Secondly, the relationships between managerial actions/factors and the outcomes
of engagement and performance are represented by arrows. The arrows show
direct associations. Some of the factors notably managerial commitment to the
organisation, fairness in dealing with problems, clarity of expectations and
upward feedback (listening to suggestions) are directly linked with all factors of
engagement. Support for colleagues by management is directly linked to
physical engagement but is directly linked to the respondents that responded
favorably to quality of work and reported higher'performance that others.
Commitment to the organisation by managers has a direct link through all the
engagement factors to performance, the other have a direct link to engagement/
and thus influence performance through engagement.
Thirdly, each of the factors included in analysis should be considered as the sum
of the factors given that a holistic and systemic view of the organisation needs to
be taken. In other words, the concept of ripple factor should be kept in mind
when any interventions are being considered. It is the range of processes and
practices that should be considered. For example if one was considering the
factor of upward feedback, the whole range of possibilities in relation to
communication strategy should be considered in the context of the culture and

the increasing of managerial responsiveness in its totality. Clarity of
expectations as an intervention and considered in its totality would encompass
the honest feedback to poor performers. Being treated fairly has the strongest
association with employee engagement in this overall model.
Finally, individuals differ as we have seen throughout this survey and the
relationship between managerial processes, engagement that leads to
performance will vary according to the individuals’ personality and
environmental factors the organisation will not have control over.
10.4 Gender
The analysis has thrown up differences between the genders. There appears to
me many more factors with strong association for females than for males. This
would indicate that females have a wider selection of drivers than men. For
example when one looks at Chart 71 below where comparison is drawny
between male and female respondents who reported having higher than average
performance and higher quality of work that other colleagues. The chart shows
that females are slightly more engaged overall (even if the difference is slight
amongst the self reported high performers). Females appear to be more
emotionally involved in that they report more depth of feeling in the questions
“get more absorbed5V’ time passes quicker”, “exited when performing well” and
“their own feelings being affected when performing well”. Males score higher
in one of the questions “emotional attachment”.

Chart 71 Gender Differences engaged responses to all engagement questions by self reporting high performers
Males
Females
The difference in drivers for female high performers from the overall findings is
the making them feel that their work counts is a driver. I would therefore
suggest that this should be included by managers in their drivers o f engagement,
it also gives added weight to the driver o f “support if I have a problem”. Senior
management treating employees with respect is a female engagement driver.
This is an important issue in what is a male dominated business with potential
for macho tendencies.
Fig 15 Engagement Drivers Females
Th e senior management team of Southern & Western Business Unit Iarnrod Eireann treat employees with respect. 100
Makes me feel my work counts 100
Is supportive if I have a problem 100
Listens if I have a suaaestion to make 100Treats me fairly 100
Is committed to Southern & Western Business Unit Iarnrod Eireann 100
137

10.5 Managers and non-managers
There are several differences between managers and non-managers. In general
managers are focused on the behaviour of peers and leaders. The commitment \
of their manager is critical and consultation on matters of importance and
listening to suggestions is an engagement driver of managers5 performance.
Fig 16 0 Engagement drivers for managers
Pearson’s correlation_________________________________________________________ .922889472
Managers__________________________________________________________Is committed to Southern & Western Business Unit larnrod Eireann____________________________________________________________
Listens if I have a suggestion to make___________________________
Is supportive if I have a problem_________________________________
Treats me fairly___________________________________________________
Consults me on matters of importance to me____________________
Non-managers have a different focus and are more concerned with processes of
managerial actions.r
Fig 17 Engagement drivers for non-managers
Correlation with all 0.939656134 Non Managers
Correlation with Emotional
0.97236291Is committed to Southern & Western Business Unit larnrod Eireann
Correlation with cognitive Treats me fairly
0.897625197 Gives you feedback on how I am performing
Correlation with physical Makes clear w hat is expected of me
0.90932076 Is supportive if I have a problem
Managerial commitment to the organisation, feedback, clarity of expectations,
being treated fairly and support if problem arises are most important drivers of
engagement.
138

The performance o f non-managers is associated with performance and the
perceived commitment o f managers to the organisation.
Managerial commitment is an important driver across all groups as a driver o f
engagement and performance.
10.6 Grade Categories
The most engaged group is the newly created grade o f Train Host. These
colleagues were recruited to deliver customer service on board the new fleet on
the Cork/Dublin route. This is good news for the company. The competency
based selection process included a customer service personality questionnaire for
the majority of the successful colleagues. The driving grade has disappointingly
recorded the lowest engagement scores. This cause for concern as low
engagement can be associated with accidents.
Chart 72 Average engagement across grade categories
A verage engagem en t/d isen g agem en t levels across grade category
□ Engaged
■ Disengaged
Train Hosts Exec/Clerical Traffic Station DriversCntls, Depot
Cntls DTE
G rade Categories
I have re- analysed the engagement driver specifically for the self reported high
performers in both the Train Host and Driver grades and can confirm that the

engagement drivers are identical, namely clarity of what is expected, supportive
if they have a problem, fair treatment, and the manager being committed to
Iamrod Eireann.
10.8 Train Hosts drivers of engagement in order of strengthi
The main drivers of engagement for one of the top engaged categories are;
Clarity of what is expected, support if they have problems, fairness in treatment
both personally, and in relation to problems and commitment of manager to
organizatioa
10.9 Train Driver, drivers of engagement in order of strength
Commitment of the manager to the organisation, confidence of fair treatment if
they have a problem at work, personally being treated fairly, clarity of what is
expected of them and support if they have a problem.
Key Findings
• Employee engagement is strongly linked to individual performance levels, not
withstanding that there is a tendency of over reporting of higher performance.
• Commitment to the organisation by immediate manager is the key driver of
engagement.
• Opportunities for upward feedback is a critical driver of engagement that
appears to be absent in those who are reporting low engagement levels.
• Clarity of expectations as a driver is closely associated with the engagement
driver of upward feedback.
140

• Having fair and just management process for dealing with problems is important
in driving up engagement levels.
• Supportive line management is a driver especially for colleagues encountering
problems.
• Different categories of colleagues are influenced by different combinations of
factors and managers need to consider carefully what is most important to their
own staff, beyond the finding of this report This project while identifying that
there are different drivers for different grade categories set out a starting list for
managers to encourage engagement from their direct reports.
10.10 Managerial Issues
Additional to the general issues surrounding engagement, many other issues
have emerged through this study as being significant to managers, particularly
those who wish to drive up engagement levels as an aid to performance and
delivery of customer service. It was unfortunate that flexible working could not
be explored in this project as there were so few on these arrangements. This is
despite a quarter of respondents saying that they do get support in this area and
one of the drivers of engagement is support if problems are encountered.
10.11 Findings - WorkingLife
Two fifths of employees (40%) are saying that they do not achieve the correct
work life balance.
141

Chart 73 All respondents to work life balance questions
Work life balance is important to all employees, especially an organisation with
a culture of working long hours. Those who are often neglected are men,
managers. Working long working is detrimental to health and does not lead to
higher performance (CIPD 2006).
• More important than pay is whether the content of the job is meaningful
to the individual. All highly engaged colleagues scored high on this
factor. Managers may need to consider job fit whenever possible.
• Bullying and harassment is worrying prevalent in the organisation, this
leads to poor performance, negative psychological states of mind, poor
performance. There is an urgent need to address the human and systemic
failures that may foster a climate where bullying and harassment is
accepted.
• Only 7% of people look forward to coming to work all of the time, while
20% rarely or never do.
142

• Nearly a quarter of respondents do not feel interested or involved in the
organisation. A surprisingly low figure as the corresponding figure in the
CIPD (2006) survey recorded nearly half for the same measurement.
• No females say that they are “not really interested in my organisation its
just a job”.
• Over four fifths of respondents feel loyal towards larnrod Eireann
• Eighty eight per cent of respondents report some, or a great deal of
loyalty towards their customers and clients
• Some 70% of all respondents report some, or a great deal of loyalty
towards their immediate supervisor.
• Three quarters of respondents are committed to helping larnrod Eireann
to achieve its objectives
• Women are more satisfied with all aspects of their work than men
• Over four fifths of the Station Manager grades record dissatisfaction with
their pay rate. This grade was the most dissatisfied of all categories
across thatDimension-
Over a quarter of respondents reported-being bullied or harassed.

• Racial harassment deserves a comment that, while very low, the number
of respondents describing themselves as being of different ethnicity was
correspondingly low. This has potential to be an area for concern.
10.12 Findings - Management, Leadership and Communication
There is a lack of attention being paid to training and development needs
and in the long run this is likely to have a detrimental effective on
performance.
Notwithstanding this, current levels of responses in relation to colleagues
having sufficient training knowledge and ability to the job is quite high.
One would feel that value for the training and focus on development
would enhance delivery of service.
Employees should receive feedback on their performance on a regular
basis if they are to understand what is expected of them and how to
improve; this is a current weakness for the organisation. People need to
feel that their work counts in order to perform well.
The ability to consult and inform are critical managerial skills that
require more development for a substantial proportion of managers as
41% of employees report that they are dissatisfied with the way the
business is being run.
A significant minority of colleagues has a very low opinion of their
senior managers and perceives them to be untrustworthy; this is likely to
be related to visibility, communication and involvement in the
144

workplace, there is an opportunity for senior management to make a
difference by strengthening employee involvement practices.
• Over half (58%) of employees say that their manager rarely/never gives
them feedback on how they are performing.
• Some 53% of employees say that their manager rarely/never discusses
their training or development needs with them.
• Almost four fifths (79%) of employees say that their manager is
always/usually committed to the S&W business unit.
• Those employees in the traffic non managerial grades are more negative
across the emotional engagement drivers than the average (excluding
senior managers).
10.13 Findings - Attitudes to Work
• There is ai virtuous circle of people who feel positively about their
organisation, feeling more engaged.
, * Some 13% of employees are the “Enchanted - Uninvolved” plus another
7% who are fence sitters. This means that one five are an untapped
resource.
• Four fifths of the respondents (80%) say that the work they do is worthwhile
with only 6% disagreeing with this statement.
145

The agree scores across all the meaningfulness questions were higher than that
reported in the CIPD survey (2006) by at least 10% in all cases.
• In all cases the managers scored more positively than non-managers in
relation to the questions on the meaningfulness of their work.
• One third of employees are dissatisfied with the opportunities to use their
abilities, this implies that managers are missing the chance to enhance
performance.
, • While there is no relationship between levels of stress and engagement,
nearly a quarter of employees experience high levels of stress and over
30% feel under excessive pressure one or twice a week and 31% feel
under excessive pressure every day
• There is no significant difference between managers and non-managers
when a great deal and fair amount of control over the way the job is done
are added together.
• At least a third of all respondents cited dissatisfaction in relations
between them and their managers, attention paid to the suggestions they
make, the way the S&W is managed and their opportunities to use their
abilities.
146

• When non-managers are look at separately in relation to dissatisfaction
the above figure rises to 41% on the same questions, namely attention
paid to the suggestions they make, the way the S&W is managed and
their opportunities to use their abilities.
• Nearly half (45%) of non-managers are dissatisfied with the recognition
they get for good work.
• Employees who are more satisfied with their work overall, are more
engaged.
10.14 Findings - Engagement (see also key findings above)
Overall, the survey, responses reflect an interaction between individual
engagement with work and the nature of the work itself Some jobs are more
likely to demand a high level of attention, for example managerial jobs, and they
are more also more likely to attract people interested in cognitively demanding
work. It is surprising to note that Train Hosts are more cognitively engaged than
Drivers or managers.
Emotional engagement is closely related to the other aspects of emotions that
have been measured in this survey. Feeling emotionally engaged with work runs
parallel with other positive perceptions of work and the organisational
environment, and other aspects of engagement. Effective individual and
organisational management of the relationships and processes that increase
positive emotions could also raise levels of engagement and performance.
147

• Over three fifths of employees are emotionally engaged with their work.
(
• Train Hosts are more cognitively engaged than Drivers or managers
• Over three quarters of respondents are physically engaged with their
work and almost one third are disengaged
• Older employees are more engaged than younger employees.
\
• Younger employees are less likely to demonstrate physical engagement
• There is no difference on age grounds in emotional engagement
• Some 53% of respondents report being cognitively engaged; 26% say
they are not cognitively engaged, the lowest level of the three
engagement scales
• Females are more engaged than males especially in the emotional
engagement dimension and it is this dimension that is most closely
related to performance.
• The 17% that are actively engaged with the company could be classified
as true believers and advocates for the company
148
• The 8% that report being actively disengaged can be classed as the
disaffected and would contain the consistent 3% that are truly active in
being negative and working against their colleagues and the company.
10.15 Findings and Outcomes
• The majority of people believe they have the knowledge and skills they need.
• Most people think they are performing well.
• Over 80% of current employees intend to remain with the company
• In the region of 40% of employees expect to be doing the same job next
year, a further 10% expect to be doing the same job but in different
location next year.
• The over 55 years take less sick leave than younger employees.
• Employees who take more sick leave are less engaged with their work.
• There is no link between sick leave and performance.
149

Engagement is an area that essentially concerns itself with the emotions and
even the spirituality of individuals; it's easy to dismiss it as another fluffy
’people1 initiative. But the idea of employee engagement shouldn't be written
off as just another HR fad with its concomitant metrics and bureaucracy.
Neither should it be viewed as a quick fix. This idea is much bigger than that,
because it relates to the core of a business — its values, culture and way of
managing. Changing that is a tall order. In the long term — the path to
engagement is a marathon, not a sprint — a truly engaged company is likely to
be a 'great' one. \ \
Employee engagement can be considered as cognitive, emotional and
behavioural (physical). Cognitive engagement refers to employees’ beliefs
about the company, its leaders and the workplace culture. The emotional
aspect is how employees feel about the company, the leaders and their
colleagues, that is why there is such a strong connection to the managerial
influences to emotional engagement and as it is closest to performance it is
therefore most critical. The behavioural factor is the value-added component
reflected in the amount of effort employees put into their work (e.g.,
brainpower, extra time and energy).
Mayo, Hertzberg were on the right path and the search for engagement and
component metrics is building on their seminal works. The fact that
engagement has been broken down into component parts is critical point as it»\
150

the recognition that employees cannot be forced to be engaged. Engagement
and its association with increased performance and thus increased chances of
improving competitive advantage through bespoke interventions is in my view
a win- win. Employees need to be enticed to demonstrate the desired
behaviours they cannot be forced and engagement theories highlight the
bespoke aspect. This in turn adds weight to the benefits of encouraging
movement towards a culture that defies imitation as the interventions to
encourage engagement are based on what your current staff is saying. This in
turn reduces the possibility of imitation. A great company to work for will be
endeavouring to foster the factors that are shown improve engagement. The
hankering after the metric for insertion on the balance sheet is still some
distance away probably due to the time lag between interventions and
unfortunately the economic view that labour is a cost not an asset.
It was disappointing that the engagement scores were lower than the CIPD
(2006) study particularly on the actively engaged. However, to be able to say
that 60% o f your colleagues are actively or moderately engaged is still a good
news story and there are a least a further one fifth of the workforce up for
grabs. Management factors can make or break engagement levels and this is
where the company needs to focus attention, they themselves are already more
engaged than the average employee. A key driver for their staff was to see
them demonstrate their own commitment to the company.
It was pleasing to see that the Train Hosts scored very well on engagement and
sadly not pleased to be proven correct in relation to the Driving grade. Train
151

drivers are selected through assessment that require the candidates to be very
rules oriented and I think this may be impacting on their ability to be more
engaged as they are perfectionists at heart. In line with previous theorists pay
was not a motivator (harking back to Hetzberg) it is a satisfier once a person is
satisfied it no longer motivates. The Station Managers were a classic example
of this - (they have onejthe highest overtime bills in the company and ont\
average earn up to another half on their salary in overtime payments) perhaps
their view of the salary level is based on comparison and status may be more
an issue (the value the company places on you is demonstrated by the salary
level not by the amount of overtime).
Those who are engaged appear overall to have a happier outlook on life
although not all were very high scorers on the “how do you feel questions”. It
was good news to see that colleagues were anxious to talk and make
suggestions to their line managers as this is one path to innovation and it has
been identified as an engagement driver.
It is hoped that this project adds a body of knowledge that managers in the S &
W might usefully use as part of their tool kit to manage and drive forward
engagement in their colleagues, so that as a company world class customer
service standards can attained.
This was journey that at times made me happy when I would come across a
batch of respondents and you knew form the first and second page of the
questionnaire that the chances were that they were going to be one of the
152

enchanted engaged and made me very sad when I could see that a managers
behaviour or having experienced bullying could turn what had been a possible
star into a disengaged person.
End-

Chapter 12
Recommendations for Further Research
The area of Human Capital Management is attempting to devise
metrics for the people input component that can be reflected on both
internal and external financial returns. It is in essence an attempt to
measure the contribution of people component. It is now agreed that it
is the people component and contribution that makes the unique
contribution to the business that cannot be copied and thus gives
organisations the edge over their competitors, a good examples is the
Southwest Airlines and Seers cases. The CIPD is currently researching
into this aspect of devising metrics on behalf of the government in the
UK.
Following from this current study the next piece of research required is
to accurately measure the engagement drivers as recommend by Bassi
and McMurrer (2007) to gauge the readiness of the managers for
leadership practices, specifically those related to managerial
communication, inclusiveness, supervisory skills, executive skills,
leadership development, and succession planning systems.
By necessity this study was of breadth rather than depth as it tried to
encompass the whole experience of work in Iamrod Eireann. It is a
complex area as it encompasses the whole of the working experience
of the individual employee and the myriad of interactions.
154

One limitation of the study is that the data came from a cross-sectional
population that used a self-report survey instrument. A structured in
depth questionnaire may be most appropriate in further studies to
follow up on any concerted interventions.
Managers could usefully use organisational selection devices such as a
'realistic job preview ’ to not only obtain better work role' fit, but to also
expose future employees to potential co-workers to help improve fit
with co-workers and their norms.
* %
It was beyond this study to ascertain the impact of the strong culture
with a view to identifying any barriers to engagement that may be
counterintuitive, especially in relation the bullying and harassment
identified.
A follow up study should be completed on a regular basis to gain the
metrics required to prove improvement in engagement from a number
of perspectives. Firstly, there is a need to value the drivers identified
so it can be calculated what level is the optimum for your organisation
and the category of staff. An example would be to place a standard for
Train Hosts at say 4 and measure all against this. Secondly,
performance reviews can highlight to the individual gaps between
them and the standard required and encourage through interventions
and encouragement to increase those below the standard for the job.
This initiative could value each individual and then measure the
155

cumulative contribution of people to the bottom line through
engagement interventions. There is no point in actioning interventions
that are nice to do but do not ultimately contribute to the bottom line.
Over time the drivers of engagement that have been identified will
change and the business will need to refocus its activities to match.
This is ongoing not a one off exercise if it is to be of value. This
means that continuous research will be required.
The developing a structured plan for managers that would target
methods for them to improve employee perceptions by developing
supportive, trustworthy relations with their staff. Specifically, it could
develop a performance plan that would ensure that they encourage
employees to develop new skills, participate in decisions, treat
employees fairly, be consistent in their actions, demonstrate integrity
between their words and actions, use open communication and
demonstrate genuine concern for employees.
The development of survey instruments that align with business goals
and pay particular emphasis on action plans. A why, what, when,
approach to implementation could be devised and qualitative research
into the process and delivery of the findings would be valuable. This
would through some light on why so many surveys lie on shelves.
156

BIBLIOGRAPHY
Annunzio, S. (2001). How to find and develop talent. People Management, 7: 21, 64-
66.
Armstrong A,. & Brown D., (2006) Strategic Reward Making it happen Kogan Page
Ltd. London.
Armstrong M., & Murlis H., (2004) Reward Management “A Handbook o f
remuneration Strategy and Practice ” 5th Ed. .Kogan Page. London.
Armstrong M., (2006) 3rd Ed., Performance management Key Strategies and practical
guidelines. Kogan Page Ltd., Philadelphia USA.
Armstrong, P. (1995). Accountancy and HRM in Human Resource Management: A
Critical Text. J. Storey (ed). Routledge. London.
Arnold, J., (2005). Workplace psychology. FT Prentice Hall. Harlow London.
Bassi and McMurrer (2007) Harvard Business Review March. Harvard Business
School, Boston MA.
Becker, B.E, Huselid, M.E. and Ulrich, D. (2001/ The HR Scorecard: Linking
People, Strategy and Performance, Harvard University Press Cambridge, Mass.
Bell, E., Taylor, S. and Thorpe, R. (2001). Investors in people and the standardization
o f professional knowledge in personnel management. Management Learning, 32: 2,
201-219.

Berkowitz, S.J. (2001). Measuring and reporting human capital The Journal of
Government Financial Management, 50: 3, 13-17.
Bonds, N. and Dragonetti, N.C. (1999). The knowledge toolbox: a review o f the tools
available to measure and manage intangible resources. European Management
Journal, 17: 4, 391-402.
Brockbank, W., (2000). Strategic Human Resource Planning. University of
Michigan.
Brown, S., P. (1996/ A meta-analysis and review o f organisational research on job
involvement. Psychological Bulletin, 120,235-255.
Buchanan, L., (2004) The things they do for love, Harvard Business Review;
Dec2004, Vol. 82 Issue 12, pl9-20, 2p, 2cs
Carpenter, M.A, Sanders, G.W. and Gregerson, H.B. (2001). Bundling human capital
with organizational context: the impact o f international assignment experience on
multinational firm performance and CEO pay. The Academy of Management Journal,
44:3, 493-511.
Chartered Institute of Personnel and Development. (2006) Smart work: people,
productivity and performance. Public policy perspectives. CIPD. London
Child, J. and Smith, C. (1987). The context and process o f organizational
transformations — Cadbury Limited in its sector. Journal of Management Studies, 24:
6, 565-593.

Csikszentmihalyi, M., (1990). Flow; The psychology of optimal experience. New
York; Harper.
Corporate Leadership Council. (2004). Driving performance and retention through
employee engagement. Washington, DC: Corporate Executive Board.
Cox A., Zagelmeyer S., Marchington M., (2006) Embedding employee involvement
and participation at work. Human Resource Management Journal Vol 16 No 3 CIPD
Blackwell Oxford.
r ♦
Danford A., Richardson M., Stewart P., Tilby S., Upchurch M., (2005) Partnership
and the High Performance Workplace; Work and Employment Relations in the
Aerospace Industry, Palgrave Macmillan Basingstoke;
Davenport, T.O. (1999). Human Capital: What It Is and. Why People Invest In It,
Jossey-Bass San Francisco
De Vita, Emma Vernon, Mark (Apr 2007) Get Engaged Management Today.
Drake, K. (1998/ Firms, knowledge and competitiveness. The OECD Observer, 211,
24-26.
Drucker P. F., (2006) Classic Drucker “The man who invented management
Harvard Business School Publishing Corporation. USA.

Edwards, J. R., & Rothbard, N. P. (2000). Mechanisms linking work and family:
clarifying the relationship between work and family constructs. Academy of
Management Review, 25, 178-199.
Eisenhardt, K.M. (1989). Building theories from case-study research. Academy of
Management Review, 14: 4, 532-550.
Feeling good matters in the workplace. (2006, January 12). Gallup Management
Journal.
Feldman, D. (1984) The development and enforcement o f group norms. Academy of
Management Review, 9, 47-53
Fitz-Enz, J. (2000/ The ROI o f Human Capital: Measuring the Economic Value o f
Employee Performance Amacom New York.
Flamholtz, E.G. (1999). Human Resource Accounting, New York: Kluwer Academic
Publishers.
Fleming,J,.H., Coffman, C., & Harter, J.,K., (Jul/Aug2005) Manage your Human
SIgMA Harvard Business Review;, Vol. 83 Issue 7/8, pl06-114, 9p, 1 diagram, 2
graphs, 2c
Friedson, E. (1994). Professionalism Reborn: Theory, Prophecy and P o l i c y Polity
Cambridge.
Grugulis, I. and Bevitt, S. (2002). The impact o f Investors in People: a case study o f a
hospital trust. Human Resource Management Journal, 12: 3, 44-60.

Guest, D.E. and Conway, N. (2004) Employee well-being and the psychological
contract Research report. Chartered Institute of Personnel and Development.
Cambridge London.
Guest, D, Michie, J, Sheehan, M, Conway, N. and Metochi, M. (2000). Effective
People Management, CIPD London.
Guest, D. and Peccei, R. 2001. Partnership at Work: Mutuality and the Balance o f
Advantage. British Journal of Industrial Relations, 39:2 June 2001
Guillen, M. (2003). The New Economic Sociology: Developments in an Emerging
Field, Russell Sage New York:.
Haker, C.A. (2001). How to Compete in the War for Talent, DC Press Sanford.
Hall B., (2004) Incentives Within Organisations, Article in Harvard Business School,
Boston MA.
Harzing, A,-W and A. Sorge. 2003 The Relative Impact o f Country o f Origin and
Universal Contingencies on Internationalisation Strategies and Corporate Control in
Multinational Enterprises Worldwide and European Perspectives. Organisation
Studies 24 (20:187-214)
Hendry, C. (1995). Human Resource Management: a Strategic Approach to
Employment, Butterworth-Heinemann London.

Hermanson, R. (1964). Accounting for Human Assets, Michigan: Michigan State
University, Bureau of Business and Economic Research.
Hirschman O., (1970)Exit Voice and Loyalty
Hitt, M.A, Bierman, L, Shimizu, K. and Kochar, R. (2001). Direct and moderating
effects o f human capital on strategy and performance in professional service firms: a
resource based perspective. Academy of Management Journal, 44: l; 13-28.
Hoque, K. and Noon, M. (2001). Counting angels: a comparison o f personnel and HR
specialists. Human Resource Management Journal, 11:3, 5-22.
Hochschild, A. (1983). The managed heart. University of California Press Berkeley.
Hyman J., Mason B., 1993 Managing Employee Involvement and Participation Sage.
London.
Johanson, U. (1999). Why the concept o f human resource costing does not work: a
lesson from seven Swedish cases. Personnel Review, 28: 1/2, 91-107.
Kahn, W. A. (1990) Psychological conditions o f personal engagement and
disengagement at work. Academy of Management Journal, 33,692-724
Kaplan, R. and Norton, D.P. (1996). The Balanced Scorecard,: Harvard Business
School Press Boston.
Keegan, A. (1998). Management Practice in Knowledge-Intensive Firms: the Future
o f HRMin the Knowledge Era. Paper presented at the BAM Conference, Nottingham.
Konrad, A. M. (2006, March/April), Engaging employees through high-involvement
work practices. Ivey Business Journal on line, 1-6, www.iveybusinessioureaLcom.

Korczynski, M. (2002/ HRM in Service Work, Palgrave: Basingstoke.
Lave, J. and Wenger, E. (1991). Situated Learning: Legitimate Peripheral
Participation, Cambridge University Press Cambridge
Lawler, E. E., I l l , & Hall, D. T., (1970) Relationship o fjob characteristics to job
involvement, satisfaction, and intrinsic motivation. Journal of Applied Psychology,
54, 305-312.
Leadbeater, C. (2000). New Measures for the New Economy: A Discussion Paper for
the Institute of Chartered Accountants in England and Wales, London
LeBlanc, P.V, Mulvey, P.W. and Rich, J.T. (2000). Improving the return on human
capital: new metrics. Compensation and Benefits Review, January 2000, 32: 1, 13-20.
Lee, J. and Miller, D. (1999). People matter: commitment to employees, strategy and
performance in Korean firms. Strategic Management Journal, 20: 6, 579-593.
Legge, K. (1978). Power, Innovation, and Problem-Solving in Personnel
Management, McGraw-Hill New York
Lockwood, Nancy R. (2006). HR's Strategic Role, SHRM Special Expertise Panels
2006 trends report.
Luthans, F., Organisation Change Development and the Future. Organizational
Behavior, Sixth Edition, McGraw Hill International, New York.
Matthewman, J. and Matigonon, F. (2005) Human capital reporting: an internal
perspective. A guide. Chartered Institute of Personnel and Development; London.

March, J. and Simon, H. (1958). Organizations, John Wiley; New York .
Marks, N. (2006) Happiness is a serious business. In: Chartered Institute of
Personnel and Development. Reflections on employee engagement. Change agenda;
London
May, D. R., Gilson, R. L.. & Harter, L. M. (2004). The psychological conditions o f
meaningfulness. safety and availability and the engagement o f the human spirit at
work. Journal of Occupational and Organizational Psychology, 77, 11-37.
Mayo, A. (2001). The Human Value o f the Enterprize: Valuing People as Assets —
Monitoring, Measuring, Managing, Nicholas Brealey London.
Mayo, A. (2002/ A thorough evaluation People Management (April), 8: 7, 36-39.
Michels, E., Handfield-Jones, H. and Axelrod, B. (2001). The War for Talent,
London: Harvard Business School Press; Boston.
Miller, R. and Wurzburg, G. (1995). Investing in human capital. The OECD
Observer, 193, 16-19.
Mooney, P., (2005) Creating a Committed and Productive Workforce Union Free.
Dublin
N.C.P.P. (2003) Forum on Workplace of the future. Working to our advantage A
National Workplace Strategy. Dublin.
O'Reilly, C.A. and Pfeffer, J. (2000). Hidden Value: How Great Companies Achieve
Extraordinary Results with Ordinary People,: Harvard Business School Press;
Boston, MA.

Pettigrew, A.M. (1985). The Awakening Giant: Continuity and Change in ICI, Basil
Blackwell; Oxford.
Pfeffer J., (1998) Human Equation Building Profits by Putting People First Harvard
Business School Press; USA.
Pfeffer, J. (2001). Fighting the War for Talent is Hazardous to Your Organization's
Health, research paper, Stanford University, Graduate School of Business; Stanford.
Purcell, J. et al (2003) Understanding the people and performance link: unlocking the
black box. Research report: Chartered Institute of Personnel and Development;
London.
Robinson, D., Perryman, S. and Hay day, S. (2004) The drivers o f employee
engagement.: Institute for Employment Studies; Brighton.
Roos, J., Roos, G., Dragonetti, N.C. and Edvinson, L. (1997). Intellectual Capital:
Navigating the New Business Landscape:. MacMillan; Basingstoke.
Roslender, R. and Dyson, J.R. (1992). Accounting for the worth o f employees: a new
look at an old problem. British Accounting Review, 24: 4, 311-329.
Roth bard, N. P., (2001) Enriching or depleting? The dynamics o f engagement in work
and family roles. Administrative Science Quarterly, 26, 655-684.
Sackman, S, Flamholz, E. and Bullen, M. (1989). Human resource accounting: a
state o f the art review. Journal of Accounting Literature, 8, 235-264.

Sadler, P. and Milmer, K. (1993). The Talent Intensive Organization: Optimising
Your Company's Human Resources Strategy, London: Economist Intelligence Unit.
Salanova, M., Agut, S.. & Marfa Pelr, J. (2005). Linking organizational resources and
work engagement to employee and customer loyalty :The mediation o f service climate.
Journal of Applied Psychology, 90, 6, 1217-1227.
Sandberg, J. (1994). Human Competence at Work: an Interpretative Approach, BAS;
Gothenburg.
Scarbrough, H. (1997). Making the matrix matter: the social construction o f strategic
information systems. Journal of Management Studies, 34: 2, 171-190.
Scarbrough, H. (2000). The HR implications o f supply chain relationships. Human
Resource Management Journal, 10: 1, 5-17.
Schultz, T. (1961) Investment in human capital. American Economic Review, 51: 1,
1-17.
Sisson, K. and Scullion, H. (1985). Putting the corporate personnel department in its
place. Personnel Management, 17:12 , 36-39.
Sonnentag, S. S. (2002): Psychological Management o f Individual Performance, John
Wiley & Sons, Ltd; Chichester.
Sonnentag, S. and Frese, M. (2002) : Performance Concepts and Performance
Theory in S. Sonnentag (ed.)

Storey, J. (1989). New Perspectives on Human Resource Management, Routledge;
London.
Storey, J. (1992). Developments in the Management o f Human Resources, Blackwell;
Oxford.
Sung, J. and Ashton, D. (2005) High performance work practices: linking strategy
and skills to performance outcomes. London: Department of Trade and Industry in
association with CIPD.
Seijts, G., & Crim, D. (2006) What engages employees the most or the top ten Cs of
employee engagement. Ivey Business Journal. Mar-April.
i
Sveiby, K. (1997). The New Organizational Wealth: Managing and Measuring
Knowledge-Based Assets, Berett-Koehler; San Francisco.
Towers Perrin. (2006, February). Winning strategies for a global workforce.
Retrieved October 25, 2006, from www.towersperrin.com.
Truss, C., Soane, E. and Edwards, C. (2006) Working life: employee attitudes and
engagement 2006. Research report. Chartered Institute of Personnel and
Development; London.
Ulrich, D. and Brockbank, W. (2005) The HR value proposition. Harvard Business
School Press; Boston, MA.

Ulrich, D. (1998). 'Intellectual Capital = Competence x Commitment' Sloan
Management Review, Winter 1998, 51:1, 15-26.
Vance, C. (2001). Valuing Intangibles, Centre for Business Performance; London.
Vance, R. J. (2006). Effective practice guidelines: Employee engagement and
commitment. SHRM Foundation; Alexandria, VA.
Warr, P. B., Cook; J. D., and Wall, T. D., (1979). Scales fo r the measurement o f some
work attitudes and aspects o f psychological well-being, Journal of Occupational
Psychology. Vol 52.
Whiteley, P., (2006) History repeating itself Personnel Today, 4/11/2006, p28-30, 3p,
2c
Work Employment and Society Dec (2006) Partnership and The High Performance
Workplace. Journal of the British Sociological Association Vol 20 No 4 P 814). Sage
Publications. London
Zwell, M. and Ressler, R. (2000). Powering the human drivers o f financial
performance. Strategic Finance, 81: 11, 40-45.

Appendix 1
I am currently studying for Masters Degree in Human Resources. In order to successfully finish my course I have to complete a thesis. The subject matter I have chosen is to measure how engaged are my colleagues working in the railway (specifically the Southern & Western Business Unit). The railway has a great history of its dedicated people and people coming from “railway families”. This should give us the edge over other companies in how we perform. I want to compare my results against other surveys on the same topic. I am presuming that we are more engaged in our work than they are. The other area I am examining is to see if there are any differences between Grades and gender in their level of engagement. I am presuming that those frontline colleagues dealing with the public every day are more engaged than those who do not normally deal with the public. I may be wrong and the survey results should show this one way or the other. Just X the boxes accurately. The first answer that comes into your head is usually the most heartfelt and honest.
You are possibly sick and tired of getting surveys but please just one more time. The more replies I get the more valuable the results will be and the more analysis I can do, so I am depending on you.
I would be most grateful if you could complete the questionnaire and return it to me in the attached pre addressed envelope as soon as possible as I am working to a very tight deadline. It takes about 11 minutes to complete.
Some of the questions are sensitive but I can assure you that all replies will be kept under lock and key by me and I can guarantee that nobody other than me will have access. Once I am finished I will destroy the documentation and I am guaranteeing that no individual will be identifiable in any of the results.
However, if you wish to put your name at the end of the questionnaire I will forward you a personal copy of my findings.
Thank you in anticipation of your co-operation.
Louise Morgan Footplate Offices Heuston Station Dublin 8.
Dear Colleague

ABOUT YOUR WORKING LIFE
Apppendix I IEngagement Questionnaire for Southern & Western Colleagues June 2007
Ql When you get up in the morning, how often do you really look forward to work?
All o f the tim e
Most of the tim e
Som etim es
Rarely
Never i m i1Q2 a
Thinking about the past few weeks, how much of the time has your job made you feel each of the following?
TenseNever
O ccasiona lly
Som e of the tim e
Most of the tim e
All o f the tim e
Q2 b Thinking about the past few weeks, how much of the time has your job made you feel each of the following?
Miserable
Never
Occasiona lly
Som e of the tim e
Most of the tim e
A ll o f the tim e
Q 2 cThinking about the past few weeks, how much of the time has your job made you feel each of the following?
Depressed
Never iOccasiona lly
Som e of the tim e
Most of the tim e
A ll o f the tim e
Q2 dThinking about the past few weeks, how much of the time has your job made you feel each of the following?
Optimistic
Never
Occasiona lly
Som e of the tim e
Most of the tim e
A ll o f the tim e
Q2 e Thinking about the past few weeks, how much of the time has your job made you feel each of the following?
CalmNever - IO ccasiona lly
Som e of the tim e
Most of the tim e
A ll o f the tim e -------------------
1

Apppendix IIEngagement Questionnaire for Southern & Western Colleagues June 2007
Q 2 f Thinking about the past few weeks, how much of the time has your job made you feel each of the following? ,
Relaxed
Never
Occasionally
Some of the time
Most of the tim e
All of the time l
Q 2 g Thinking about the past few weeks, how much of the time has your job made you feel each of the following?
Worried
Never
Occasionally
Some of the time
Most of the time
All of the time
Q2 h Thinking about the past few weeks, how much of the time has your job made you feel each of the following?
EnthusiasticNever
Occasionally . • , .
Some of the time
Most of the tim e l
AH of the time I
Q 2 i Thinking about the past few weeks, how much of the time has your job made you feel each of the following?
UneasyNever
Occasionally
Some of the time l
Most of the time
All of the time
Q 2 j
Q2 k
Thinking about the past few weeks, how much of the time has your job made you feel each of the following?
ContentedNever
Occasionally
Some of the time
Most of the tim e
All of the time
Thinking about the past few weeks, how much of the time has your job made you feel each of the following?
Gloomy
Never
Occasionally 1 • ]
Some of the tim e 1 .Most of the time
All of the time
2

Apppendix IIEngagement Questionnaire for Southern & Western Colleagues June 2007
Q 2 I Thinking about the past few weeks, how much of the time has your job made you feel each of the following?
Cheerful
Never 1 ... . 1Occasionally
Some of the time
Most of the tim e
All of the time
Q3 a Please state the extent to which you agree, or disagree with each of the following statements about your work:
The work I do on my job is very important to meStrongly disagree
Disagree
Neither agree nor disagree
Agree
Strongly agree
1Q 3 bPlease state the extent to which you agree, or disagree with each of the following statements about your work:
My job activities are personalty meaningful to meStrongly disagree
Disagree 1Neither agree nor disagree
Agree
Strongly agree
Q 3 c Please tell us the extent to which you agree, or disagree with each of the following statements about your work:
The work I do on my job is worthwhileStrongly disagree
Disagree 1Neither agree nor disagree
Agree
Strongly agree
Q3 d Please tell us the extent to which you agree, or disagree with each of the following statements about your work:
My job activities are significant to me 1
Strongly disagree
Disagree
Neither agree nor disagree 1 '
Agree
Strongly agree
Q3 e Please tell us the extent to which you agree, or disagree with each of the following statements about your work:
The work I do on my job is meaningful to meStrongly disagree r ~ "
Disagree
Neither agree nor disagree
Agree
Strongly agree i
3

Apppendix I IEngagement Questionnaire for Southern & Western Colleagues June 2007
Q 3 f Please tell us the extent to w hich you agree, or disagree w ith each of the fo llow ing statem ents about yo u r w o rk:
I feel that the w o rk I do on m y jo b is valuable
Strongly disagree
Disagree
Neither agree nor disagree
Agree
Strongly agree
YOUR EMPLOYERQ 4 N ow please talk about Ia rn ro d Eireann.
H ow w o u ld you speak of this organisation as an em plo yer to people outside the organisation?
I would speak highly of my organisation without being asked
I would speak highly of my organisation if asked
I would be neutral towards my organisation
I would be critical of my organisation if asked rI would be critical of my organisation without being asked
Q5 A re yo u proud to te ll people w ho you w o rk for? W ould you say you are ...?
Very proud indeed
Quite proud
Not very proud
Not at all proud
Q6 W hich of these statem ents best describes your view s on w o rk in g for Ia rn ro d Eireann?
I'm not really interested in my organisation, it's just a job
I like to know what's going on, but I don't want to get involved
I like to know what's going on and would like to get more involved
I like to know what's going on and am already involved
Q7To w h a t extent do you agree or disagree that you are co m m itted to helping Ia rn ro d Eireann achieve its objectives and aims?
Strongly disagree
Disagree
Neither agree nor disagree
Agree
Strongly agree
Q 8 a How m uch loyalty w o u ld you say you feel tow ards:Your profession or occupation
No loyalty at all
Only a little loyalty
Some loyalty
A lot of loyalty IDon't know
Q 8 b How m uch loyalty w o u ld you say yo u feel tow ards:Ia rn ro d Eireann
No loyalty at all
Only a little loyalty
Some loyalty
A lot of loyalty
Don't know
4

Apppendix I IEngagement Questionnaire for Southern & Western Colleagues June 2007
Q8 c How much loyalty would you say you feel towards:
Your immediate supervisorNo loyalty at all
Only a little loyalty
Some loyalty
A lot of loyalty
Don't know
Q8 d How much loyalty would you say you feel towards:Your fellow employees
No loyalty at all
Only a little loyalty
Some loyalty
A lot of loyalty
Don't know
Q8 e How much loyalty would you say you feel towards:
Your customers and clientsNo loyalty at all
Only a little loyalty
Some loyalty
A lot of loyalty
Don't know
Q9 a To what extent do you agree or disagree with each of the following statements about Iarnrod Eireann?
I would recommend Iarnrod Eireann to someone who seeks my advice about a job opportunity
Strongly disagree
Disagree
Neither agree nor disagree
Agree
Strongly agree
Q9 b To what extent do you agree or disagree with each of the following statements about Iarnrod Eireann?I would encourage my friends and relatives to do business with Iarnrod EireannStrongly disagree
Disagree
Neither agree nor disagree
Agree
Strongly agree
YOUR JOB
Q10 a To what extent do you agree, or disagree with each of these statements about your job?
Performing my job is so absorbing that I forget about everything elseStrongly disagree
Disagree
Neither agree nor disagree
Agree
Strongly agree
5

Apppendix I IEngagement Questionnaire for Southern & Western Colleagues June 2007
QIO b To what extent do you agree, or disagree with each of these statements about your job?
QIO c
I often think about other things when performing my job
Strongly disagree
Disagree
Neither agree nor disagree
Agree
Strongly agree QTo what extent do you agree, or disagree with each of these statements about your job?
I am rarely distracted when performing my job
Strongly disagree
Disagree
Neither agree nor disagree
Agree
Strongly agree
QIO d To what extent do you agree, or disagree with each of these statements about your job?Time passes quickly when I perform my jobStrongly disagree
Disagree
Neither agree nor disagree
Agree
Strongly agree
QIO e To what extent do you agree, or disagree with each of these statements about your job?I really put my heart into my job
Strongly disagree
Disagree
Neither agree nor disagree
Agree
Strongly agree
QIO f To what extent do you agree, or disagree with each of these statements about your job?I get excited when I perform well in my jobStrongly disagree
Disagree
Neither agree nor disagree
Agree
Strongly agree
1 Q io gTo what extent do you agree, or disagree with each of these statements about your job?I often feel emotionally detached from my job
Strongly disagree
Disagree
Neither agree nor disagree
Agree
Strongly agree
6

Apppendix IIEngagement Questionnaire for Southern & Western Colleagues June 2007
QIO hTo what extent do you agree, or disagree with each of these statements about your job?
QIO i
My own feelings are affected by how well I perform my jobStrongly disagree
Disagree
Neither agree nor disagree
Agree
Strongly agree
To what extent do you agree, or disagree with each of these statements about your job?
I exert a lot of energy performing my job
Strongly disagree
Disagree
Neither agree nor disagree
Agree
Strongly agree
iQ lO j To what extent do you agree, or disagree with each of these statements about your job?I stay until the job is done
Strongly disagree
Disagree
Neither agree nor disagree
Agree
Strongly agree
(QIO k To what extent do you agree, or disagree with each of these statements about your job?I avoid working overtime whenever possible
Strongly disagree
Disagree
Neither agree nor disagree
Agree
Strongly agree
QIO 1 To what extent do you agree, or disagree with each of these statements about your job?I take work home to do
Strongly disagree
Disagree
Neither agree nor disagree
Agree
Strongly agree
QIO m To what extent do you agree, or disagree with each of these statements about your job?
I avoid working too hard
Strongly disagree
Disagree
Neither agree nor disagree
Agree
Strongly agree
7

Apppendix IIEngagement Questionnaire for Southern & Western Colleagues June 2007
Q l l In general, would you say that your job is...?
Q12
Not at all stressful
Mildly stressful
Moderately stressful
Very stressful
Extremely stressful 1 ' "
Approximately how much of the time do you feel under excessive pressure in your job?Never
Once or twice a month
Once or twice a week
Everyday
Q13 How much control do you feel you have over the way you do your job?
A great deal of control
A fair amount of control 1
Not much control
Just a little control
No control
Thinking about the balance between your work life and your home life, to what extent do you agree or disagree with each of the following?
Q14 a
Q14 b
I achieve the correct balance between my home and work lives
Strongly disagree
Disagree ' 1Neither agree nor disagree
Agree
Strongly agree
Southern & Western Business Unit Iarnrod Eireann provides support to help me manage my work-life balanceStrongly disagree
Disagree v
Neither agree nor disagree
Agree
Strongly agree
Q15 Overall, how satisfied or dissatisfied would you say you are with your current job?
Very dissatisfied
Dissatisfied
Neither dissatisfied nor satisfied
Satisfied
Very satisfied
Q16 a Please state how satisfied or dissatisfied are you with each of the following aspects of your current job?The physical working conditions
Very dissatisfied
Dissatisfied l
Neither dissatisfied nor satisfied
Satisfied
Very satisfied
8

Apppendix IIEngagement Questionnaire for Southern & Western Colleagues June 2007
Q16 b Please state how satisfied or dissatisfied are you with each of the following aspects of your current job?The freedom to choose your own method of working
Very dissatisfied
Dissatisfied
Neither dissatisfied nor satisfied
Satisfied
Very satisfied
Q16c Please state how satisfied or dissatisfied are you with each of the following aspects of your current job?Relations with your fellow workers
Very dissatisfied
Dissatisfied
Neither dissatisfied nor satisfied
Satisfied
Very satisfied - m
Q16 d Please state how satisfied or dissatisfied are you with each of the following aspects of your current job?The recognition you get for good work
Very dissatisfied
Dissatisfied
Neither dissatisfied nor satisfied
Satisfied
Very satisfied i
Q16 e Please state how satisfied or dissatisfied are you with each of the following aspects of your current job?Your immediate boss
Very dissatisfied
Dissatisfied
Neither dissatisfied nor satisfied
Satisfied
Very satisfied
Q16 f Please state how satisfied or dissatisfied are you with each of the following aspects of your current job?The amount of responsibility you are given
Very dissatisfied
, Dissatisfied
Q16g
Neither dissatisfied nor satisfied
Satisfied
Very satisfied iPlease state how satisfied or dissatisfied are you with each of the following aspects of your current job?Your rate of pay
Very dissatisfied r '
Dissatisfied
Neither dissatisfied nor satisfied
Satisfied
Very satisfied
9

Apppendix IIEngagement Questionnaire for Southern & Western Colleagues June 2007
Q16 h Please state how satisfied or dissatisfied are you with each of the following aspects of your current job?
Your opportunity to use your abilities
Very dissatisfied
Dissatisfied
Neither dissatisfied nor satisfied l
Satisfied
Very satisfied
Q16 i Please state how satisfied or dissatisfied are you with each of the following aspects of your current job?Relations between employees and managers
Very dissatisfied 1Dissatisfied
Neither dissatisfied nor satisfied
Satisfied
Very satisfied
Q16j Please state how satisfied or dissatisfied are you with each of the following aspects of your current job?Your chances of promotion
Very dissatisfied
Dissatisfied
Neither dissatisfied nor satisfied
Satisfied
Very satisfied
Q16 k Please state how satisfied or dissatisfied are you with each of the following aspects of your current job?
The way Southern & Western Business Unit larnrod Eireann is managed
Very dissatisfied IDissatisfied
Neither dissatisfied nor satisfied
Satisfied
Very satisfied
Q16 1 Please state how satisfied or dissatisfied are you with each of the following aspects of your current job?The attention paid to the suggestions you make
Very dissatisfied
Dissatisfied
Neither dissatisfied nor satisfied
Satisfied JVery satisfied
Q16 m Please state how satisfied or dissatisfied are you with each of the following aspects of your current job?Your hours of work
Very dissatisfied I
Dissatisfied
Neither dissatisfied nor satisfied
Satisfied l
Very satisfied
10

Apppendix IIEngagement Questionnaire for Southern & Western Colleagues June 2007
Q16 n Please state how satisfied or dissatisfied are you with each of the following aspects of your current job?The amount of variety in your job
Very dissatisfied
Dissatisfied
Neither dissatisfied nor satisfied
Satisfied ~ 1Very satisfied
Q16o Please state how satisfied or dissatisfied are you with each of the following aspects of your current job?Your job security
Very dissatisfied
Dissatisfied l
Neither dissatisfied nor satisfied
Satisfied
Very satisfied
Q17 a Please state the extent to which you agree or disagree with each of the following statements relating to your knowledge, skills and job performance:
I have the knowledge that I need to do my work to a high standard
Strongly disagree
Disagree 1Neither agree nor disagree
Agree
| Strongly agree
Q17 b Please state the extent to which you agree or disagree with each of the following statements relating to your knowledge, skills and job performance:
I have all the skills necessary to do my job
Strongly disagree
Disagree
Neither agree nor disagree
Agree
Strongly agree
Q17 c Please state the extent to which you agree or disagree with each of the following statements relating to your knowledge, skills and job performance:
My work is of excellent quality
Strongly disagree l
Disagree
Neither agree nor disagree
Agree
Strongly agree
Q17d Please state the extent to which you agree or disagree with each of the following statements relating to your knowledge, skills and job performance:
| Overall, I perform to the best of my ability I
Strongly disagree
Disagree
Neither agree nor disagree
Agree
11

Apppendix I IEngagement Questionnaire for Southern & Western Colleagues June 2007
Strongly agree
Q18 Overall, how do you think that your performance at work compares with others doing a similar job?
My performance is much lower
My performance is lower
My performance is about the same as other people in a sim ilar role
My performance is higher
| My performance is much higher
Don't know
Q19 Overall, how do you think that the Southern 81 Western Business Unit Iarnrod Eireann performs compared with other similar business units in Iarnrod Eireann?
YOUR LEi
(My business unit's performance is much lower
My business unit's performance is lower
My business unit's performance is about the same as other sim ilar business unit's
My business unit's performance is higher
My business unit's performance is much higher
Don't knowIDERSHIP AND MANAGEMENT
Q20 a To what extent do you agree or disagree with each of the following statements?The senior management team of Southern & Western Business Unit Iarnrod Eireann have a clear vision of where the organisation is goingStrongly disagree 1Disagree
Neither agree nor disagree
Agree
Strongly agree
Q20 b To what extent do you agree or disagree with each of the following statements?I have confidence in the senior management team of Southern & Western Business Unit Iarnrod EireannStrongly disagree
Disagree
Neither agree nor disagree
Agree
Strongly agree
Q20 c To what extent do you agree or disagree with each of the following statements?I trust the senior management team of Southern & Western Business Unit Iarnrod EireannStrongly disagree
Disagree
Neither agree nor disagree
Agree
Strongly agree
Q20 d To what extent do you agree or disagree with each of the following?The senior management team of Southern & Western Business Unit Iarnrod Eireann treat employees with respect.Strongly disagree
Disagree
Neither agree nor disagree
Agree
12

Apppendix IIEngagement Questionnaire for Southern & Western Colleagues June 2007
Strongly agree
Q21 a To what extent does your immediate manager/boss do each of the following?Consults me on matters of importance to me
Always
Usually
Sometimes
Rarely
Never
Q21 b To what extent does your immediate manager/boss do each of the following?Discusses my training and development needs with me
Always
Usually
Sometimes
Rarely
Never
Q21 C To what extent does your immediate manager/boss do each of the following?Recognises when I have done a good job
Always I
Usually
Sometimes
Rarely * r ~Never
Q21 d To what extent does your immediate manager/boss do each of the following?Makes me feel my work counts
Always rUsually
Sometimes .............. !Rarely
Never
Q21 e To what extent does your immediate manager/boss do each of the following?Gives you feedback on how I am performingAlways
Usually . jSometimes iRarely
Never
Q21 f To what extent does your immediate manager/boss do each of the following?Is open and honestAlways
Usually
Sometimes
Rarely
Never
Q21 g To what extent does your immediate manager/boss do each of the following?'Is supportive if I have a problem
Always iUsually
Sometimes
Rarely
13

Apppendix I IEngagement Questionnaire for Southern & Western Colleagues June 2007
Never
Q21 h To what extent does your immediate manager/boss do each of the following?Keeps me in touch with what's going onAlways
Usually
Sometimes
Rarely
Never
Q21 i To what extent does your immediate manager/boss do each of the following?Makes clear what is expected of meAlways
Usually
Sometimes
Rarely
Never
Q21 j To what extent does your immediate manager/boss do each of the following?Listens if I have a suggestion to makeAlways
Usually
Sometimes
Rarely
Never
Q21 k To what extent does your immediate manager/boss do each of the following?Treats me fairlyAlways
Usually
Sometimes
Rarely
Never
Q21 1 To what extent does your immediate manager/boss do each of the following?
COMMUN
Is committed to Southern & Western Business Unit Iarnrod EireannAlways
Usually
Sometimes
Rarely
Never
ICATIONS IN IARNROD EIREANN
Q 22How well informed do you feel about what is happening within Southern & Western Business Unit Iarnrod Eireann?My business unit keeps me fully informed
My business unit keeps me fairly well informed
My business unit gives me only a limited amount of information
My business unit doesn't tell us much at all about what goes on
Don't know/no opinion
Q23To what extent can you believe the information you receive about what is happening within Southern & Western Business Unit Iarnrod Eireann?I can always believe it ■ □I can usually believe it
I can believe it about half the time
I can seldom believe it
I can never believe it
14

Apppendix I IEngagement Questionnaire for Southern & Western Colleagues June 2007
Don't know/no opinion 1
Q24And how satisfied are you with the opportunities that exist to feed your views/issues/ideas upwards?
Very dissatisfied
Dissatisfied
Neither satisfied nor dissatisfied
Satisfied
Very satisfied
Don't know/no opinion
To what extent do you agree or disagree with the following:Q25 I would be confident that, if I had a problem at work, it would be dealt with fairly
BULLYIN
Strongly disagree
Disagree
Neither agree nor disagree
Agree
Strongly Agree
G/HARASSMENTI would like to ask you some questions about bullying and harassment. This is a sensitive subject, and I would remind you that your views will be treated in confidence and not linked to you as an individual.Which, if any, of the following forms of bullying or harassment have you experienced at work in the last two years?
Q26a-e a) Sexual harassment
b) Racial harassment
c) Bullying
d) Violence or threat of violence at work
e) None of the above
Q27i-vi Please tell us for each type of bullying or harassment you experienced, if it was:
a) Sexual harassmenti) Verbally, from a manager
ii) Verbally, from a colleague
iii) Verbally, from someone outside the organisation
iv) Physically, from a manager
v ) Physically, from a colleague
vi) Physically, from someone outside the organisation
b) Racial harassmenti) Verbally, from a manager
ii) Verbally, from a colleague
iii) Verbally, from someone outside the organisation
iv) Physically, from a manager
v) Physically, from a colleague
vi) Physically, from someone outside the organisation
c) Bullyingi) Verbally, from a manager
ii) Verbally, from a colleague
iii) Verbally, from someone outside the organisation
iv) Physically, from a manager
v ) Physically, from a colleague
15

Apppendix I IEngagement Questionnaire for Southern & Western Colleagues June 2007
vi) Physically, from someone outside the organisation
d) Violence or threat of violence at worki) Verbally, from a manager
ii) Verbally, from a colleague
iii) Verbally, from someone outside the organisation
iv) Physically, from a manager
v) Physically, from a colleague
vi) Physically, from someone outside the organisation
THE FUTUREQ28 Within the next year, in your job, do you intend to:
Stay where you are in your current job
Gain upward promotion to a higher level
Move to a position of similar responsibility in another area of your organisation
None of the above/other
Don't know
| Q29 Do you plan to remain with Iarnrod Eireann for the foreseeable future?Yes
No
Don't know
Q30 Have you ever thought about or done anything to leave your current job?Which of the following statements best describes your situation?I have never even thought about leaving this job
I have sometimes thought about leaving this job but have never done anything about it
I have looked around for other jobs
I am currently in the process in trying to leave this job
Q31 If you intend to leave your job within the next year, what are your reasons?To find a different job within your organisation
To find another similar job with a different organisation
To do a different type of work
To be self-employed
To retire
To return to (full tim e) study
To care for your children
To care for other dependents
Job satisfaction
Better pay/benefits elsewhere
Opportunities for promotion
Easier/shorter journey to work
More flexible working hours
Other reason
16

Apppendix I IEngagement Questionnaire for Southern & Western Colleagues June 2007
YOUR EMPLOYMENTQ 3 2 Which one of these best describes the type of work you do in your current job?
Senior Manager
District Traffic Executive [..........District Traction Executive
Station Manager
Station Controller
Depot Controller
Loco D river
Ticket Checker
Guard
Signalperson
Train Host
Station Operative
Gatekeeper
Executive
Clerical
Other please specify
Q 3 3 What is the highest educational qualification that you hold, including any that you have gained since leaving school?Degree or degree equivalent, and above
Other higher education below degree level
Leaving Cert
Intermediate or Junior Cert
Primary Certificate if applicable
Other qualifications (including foreign qualifications)
No qualifications
1Q 3 4 ___________ Do you have any children of school age or younger?Yes
No
Q 3 5 Do you have caring responsibilities for any family members other than children?Yes
No
Q 3 6 Marital statusSingle
Married or co-habiting
Separated or divorced
Widowed
Other
Q 3 7 Do you consider that you have a disability?Yes
No
Q 3 8 Is your contract of employment?
Permanent
Tem porary or fixed term
Q 3 9 Do you manage or supervise any other employees?Yes
17

Apppendix IIEngagement Questionnaire for Southern & Western Colleagues June 2007
No
Q40 For how many years have you worked at Southern & Western Business Unit or larnrod Eireann at any location or job?Less than 12 m onths
1 year & up to 2 years
2 years & up to 5 years
5 years & up to 10 years
10 years or more
Q41 | Do you generally take the full amount of annual leave that you are entitled to?Yes
No
iQ42 How many days have you taken as sick leave in the past year?
0-1 day
2 -3 days
4 -5 days
6-10 days
11-15 days
16-20 days
21+ days
Q43a Do you receive your payWeekly
Monthly
Some other time period
Q44b | On average, how much do you get paid per year, including rest day working or overtime, before tax and other deductions are removed i.e. gross?€20,001 - €30,000 per year
€30,001 - €40,000 per year
€40,001 - €50,000 per year
€50,001 - €60,000 per year
€60,001 - €70,000 per year
€70,000 or over per year
Q45 How many hours are you contracted to work in a typical week?0-20
21-35
36- 39
4 0-43
4 4 -4 5
46 -4 8
Q46 How many hours do you actually work in a typical week? Include overtime /rest day working/other whether paid or not.0 -1 4
15-29
36- 39
4 0-43
43-45
48
60 or more
Q47 If you work extra hours, do you get paid; take time in lieu or both?Paid
Tim e in lieu (this means that you are given equivalent time off by your em ployer to compensate you for the extra hours you have worked, instead of m oney)
Both
18

Apppendix I IEngagement Questionnaire for Southern & Western Colleagues June 2007
| Neither
Q 48 Do any of the following flexible working arrangements apply to you?Home working
Flexi-time
Shorter working week
Te rm time contract
Annualised or compressed hours
| None of theseSCREENING/0 UOTA QUESTIONSS I What was your age on your most recent birthday?
16-24
25-29
30-34
35-44
45-54
55-65
S2 Thinking about your main job, how many people are currently employed at your particular location at which you are based?Fewer than 10 employees
10-24 employees
25-99 employees
100-150 employees
S4 Are you:
Male
Female
S6 In which District/Area do you work?Cork
Galway
Limerick
Mainline
Administration/other
S7 In which location do you work?Cork Cork CoachingCork
Cork GoodsCork Ki HarneyCork MallowCork North EskCork TraleeCork
Cork Dist. AdministrationCork
Cork Running/ShedCork
Travel Centre CorkLimerick EnnisLimerick
Limerick Coaching/goods.Limerick
Limerick JunctionLimerick
Limerick GoodsLimerick ThurlesLimerick
Limerick District Administration
19

Apppendix IIEngagement Questionnaire for Southern & Western Colleagues June 2007
Limerick
Limerick
Galway
Galway
Calway
Galway
Galway
Galway
Galway
Galway
Galway
Galway
Galway
Mainline
Mainline
Mainline
Mainline
Mainline
Administration
Administration
Administration
Limerick Running/shed
Regional Sales Offices Limerick
Ballina i i
Claremorris
G alw ay Coachina
W estport
Galway District Administration
Athlone
Roscommon
Tullam ore
Athlone District
Athlone Running/shed
Reaional Sales Offices Galwav
Heuston Coaching.
Portlaoise
Mainline District Administration
Inchicore Runninq/Shed
Portlaoise Running/Shed
Finance/ Revenue Dept
HR/personnel S&W
Other please state -w here
S8 How would you describe your ethnic group?White
Mixed
Asian or Asian Irish
Black or Black Irish
Other ethnic group
|S9 Is your employment full-time or part-time?
S 10
Regular appointed colleague full time
Part time appointed colleague
Job Sharing colleague
Contract colleague
Casual colleague
Other please specify
Any comments you wish to make.
If you wish to get a personal copy of the findings please print your name in block capitals below in the space provided
20
/*

Appendix III
Engagement l evels in Iarnrod Eireann 2007
Cognitiveengagement
Perform in g my job issoabsorbingthat Iforgetabouteverythingelse
1 oftenthinkaboutotherthingswhenperforming my job
I am rarelydistractedwhenperforming my job
Time passes quickly when I perform my job
Actively engaged 8% 8% 9% 19%
Moderatelyengaged 25% 33% 48% 62%
Neither agree nor disagree/on the fence 23% 3% 17% 13% 12%
Not engaged 32% 22% 16% 7%
Activelydisengaged 16% 4% 5% 2%
Physicalengagement
I exert a lot of energy perform in g my job
I stay until the job is done
1 avoidworkingovertimewheneverpossible
I take work home to do
I avoid working too hard
Actively engaged 11% 32% 22% 2% 31%
Moderatelyengaged 44% 63% 41% 19% 46%
Neither agree nor disagree/on the fence 23% 3% 17% 13% 12%

Appendix IVStaff Numbers April 2007
Breakdown of the the staff numbers in each location of the Southern & W estern Business Unit
Jan-07
Executives including Senior Managers to Station Managers Clerical Supervisors
Station Operatives including Train Hosts
Ticket Checkers and Train Guards Train Drivers Total
General Manager and Administration 20 11 0 4 0 0 35
Cork District 11 27 13 112 30 54 247
Limerick District 12 18 10 69 9 44 162
Galway District 15 21 6 81 27 39 189
Mainline District 13 21 9 84 26 96 249
Totals 71 98 38 350 92 233 882

APPENDIX VSouthern & Western Business Unit Attitude and Engagement Survey
2007Data regarding distribution of Questionnaires and
__________ _____________ return statistics__________ _______
DistrictCost Centre Description
Address of Person in Charqe
Method for issuing questionnaire
Number of questionnaires issued Number returned
AcrossBusinessUnit Various All Senior Managers E mail to each individual 10 7
MainlineLoco Shed Inchicore
Dinny Tierney Depot Controller Inchicore Issued 80 questionnaires by
hard copy e mail not available/appropriate 80 13
Mainline he us ton Station
Ms Ashling Whelan Station Managers Office Heuston Station Dublin 8 and Station Controllers Heuston
Hard copies to Ashling, Stn Controllers (Peter) and J Dent for Train Hosts for hand distribution and placing in signing on area 80 18
Mainline Portiaoise Station
Ray Delaney Station Manager Portiaoise Questionnaire e mailed as
agreed with Stn Manager 5 1
Administrate Hesuton
Tony Cassidy Business Development Manager Heuston
8x Hard copies issued - Returns included in Administration below
Limerick Ennis
Mr. Tony Browne, Station Manager, Ennis
Station, Co. Clare
Questionnaire e mailed as agreed with Stn Manager to
print 10 copies 10 4
Limerick Limerick Junction
Mr. Thomas Martin, Station Manager, Umerick Junction
Station, Co. Tipperary
Questionnaire e mailed as agreed with Stn Manager to
print 10 copies 10 2
Umerick Umerick
Mr. Philip Conway, Station Manager, Colbert
Station, Limerick indudinq qoods
Questionnaire e mailed as agreed with Stn Manager to
print 10 copies 10 6
Umerick Thurles
Mr. Nicholas Moroney, Station Manager, Thurles
Station. Co. Tipperary
Questionnaire e mailed as agreed with Stn Manager to
print 10 copies 10 3
Cork Cork Chg.
Mr. Hilary Twomey,Station
Manager, Kent Station, Cork.
Questionnaire issued throuqh Personnel Dept 80 12
Cork Killamey
Mr. M. Leahy, Station Manager, Killamey Station, Co. Kerry ,
Questionnaire issued throuqh Personnel Dept see above 3
Cork Mallow
Mr. P. O'Sullivan, Station Manager, Mallow
Station, Co. Cork.Questionnaire issued throuqh Personnel Dept see above
Cork Tralee
Mr R Dempsey Acting Station Manager, Tralee
Station. Co. KerryQuestionnaire issued throuah Personnel Dept see above
Cork Cork Shed
Ken Collins, Loco Supervisor, Loco
Running Dept., Kent Station, Cork.
Questionnaire issued throuqh Personnel Dept see above 5
Galway Clare morris
Ms. D. Keaveney, Station Manager, Claremorris
Station; Co. Mayo
Questionnaire e mailed as agreed with Stn Manager to
print 10 copies 10 2
GalwayGalway Chg/
Ballinasioe
Mr. Philip Caulfield, Station Manager, Ceannt
Station. Galway
Questionnaire e mailed as agreed with Stn Manager to
print 10 copies 10 3
Galway Athlone
Ms. M. Larkin, Station Manager, Athlone
Station, Co. Westmeath
Questionnaire e mailed as agreed with Stn Manager to
print 10 copies 10 4
Galway Tullamore
Ms. A. Breslin, Station Manager, Tullamore Station, Co. Offaly
Questionnaire e mailed as agreed with Stn Manager to
print 10 copies 10 1
Galway Athlone Runninq
Thomas O'Brien, Deport Controller, Loco Running Dept., Athlone Station,
Co. Westmeath
Questionnaire e mailed as agreed with Stn Manager to
print 10 copies 10 0
Galway WestportPat Hopkins Station
Manaqer Ballina Ca Mayo
Questionnaire e mailed as agreed with Stn Manager to
print 10 copies 10 2
BaltinaAnn Elliot Station Manager Ballina
Questionnaire e mailed as agreed with Stn Manager to
print 10 copies 10 1
Min line/Cork Cork and Heuston John Dent forTrain Hosts
Hard copy of Questionnaire issued personally addressed in sianinq on area 26
replies included in Coaching Heuston and
CorkAdministration offices finance and HR across
businessQuestionnaire e mailed as
agreed with Managers 48 24Totals 439 104% returns 24%

APPENDIX VI
^Iarnrod Eireann
STAFF SURVEY 2005
SOUTHERN & WESTERN -
Iamrod Eireann Staff Survey 2005 - South W esf

Background
This year, for the fourth time, we sought your opinions and views concerning our overall performance in the following key areas:
Our level of response to people needs within our organisation
Our organisation performance in business terms
W e have listened to, and endeavoured to learn from opinions and views previously expressed. Consequently some key
changes have been introduced. These include concentration on improving pay and conditions of employment; additional
development and learning programmes, more family friendly policies and the opening of our Career Development Centre.
Our ongoing commitment to you is to continue to ask for your opinion and to continue to listen and to respond appropriately.
The survey covered 13 different areas as outlined below:
Direction/Clarity of Strategy Customer Focus/Concern for Quality
Performance Management Commerical Focus
Change Management Concern for Safety/Working Environment
Human Resource Management Involvement and Inclusion
tStaff were asked to rate individual items relating to the areas above according to the following scale:
How closely does the statement r e f le c t reality?5 Strongly Agree4 Agree3 Unsure2 Disagree1 Strongly Disagree
Workplace Diversity
Working Together
My Manager
Internal Media
Overall Job Satisfaction
This report presents the results for S o u th & W e s tThe number of complete questionnaires received for this area were : 116
The report is structured according to the following sections:Page
O verview o f re su lts 3This presents average performance scores for each of the 13 areas outlined above.
M o st su c c e s s fu l / L e a s t S u c c e s s fu l Item s 4This section outlines the top 12 items in terms of performance a s well as the bottom 12.
D etailed re su lts b y area 5-17This section presents detailed results per area, outlining the average rating for each item
both 2005 and the previous 2003 results (note: 2003 results not available)
C om parison b y D ep a rtm en t 18This section presents a comparison across each of the department's performance
across each of the 13 areas
P ro g re ss iv e n e ss a n d P hysica l C onditions 20This section outlines the extent to which each area is rated a s progressive as well
as presenting staff views on physical conditions in your area
Narrative c o m m e n ts from re sp o n d e n ts 21This section outlines the views of respondents in your area on best and worst aspects
iamrod Eireann Staff Survey 2005 - South West

o f wording for the company as well as things they would change about the CompanyOVERVIEW OF THE CATEGORIESThis section presents the average score for each of the 13 areas against performance in the last survey.
Key:South & West
2003 2005
MoreDetail
dir Direction/Clarity of Strategy 3.07 p.5per Performance Management 2.65 P-6cha Change Management 2.91 P-7hr Human Resource Management 2.87 p.8cfq Customer Focus/Concern for Quality 3.19 P-9foe Commerical Focus 3.19 p.10saf Concern for Safety/Working Environment 3.93 P 11inv Involvement and Inclusion 2.94 P-12div Workplace Diversity 3.28 p.13wor Working Together 3.10 p.14man My Manager 3.21 p.15med Internal Media 3.81 p.16sat Overall Job Satisfaction 3.04 P-17
r4
larnrod Ereann Staff Survey 2005 - South West

ITEM LEVEL ANALYSIS
MOST SUCCESSFUL ITEMS % positive
The following list presents the top 12 items ranked according to the % who viewed the issue positively (i.e. strongly agreed or agreed).
1 Appropriate safety equipment (e.g. PPE) is provided by the company. 89
2 Iamrod Eireann is safety conscious organisation. 87
3 I receive Rail Brief and Stop Press regularly 87
4 Safety is the prime concern of the company. 83
5 Management make people aware of the Iamrod Eireann responsibilities regarding safety. 81
6 I understand how my role contributes to the business. 81
7 The people I work with co-operate to get the job done 80
8 I am familiar with the equality policy & procedures in relation to Bullying, Sexual Harassment & Harassment 79
9 Stop P ress is a worthwhile staff magazine 77
10 I am happy with the content of both Rail Brief and Stop Press 76
11 There is scope within Iarnrod Eireann to develop knowledge, new skills, and experience. 74
12 Appropriate training is provided to support our safety standards. 74
LEAST SUCCESSFUL ITEMS % negative
The following list presents the bottom 12 items ranked according to the % who viewed the issue negatively (i.e. disagreed or strongly disagreed)
1 l get regular feedback on my performance. 74
2 People are paid for the level of their performance, not merely for being at work. 64
3 My manager regularly reviews how I am doing. 63
4 Management seek views of staff on relevant issues. 61
5 People are rewarded appropriately for their contribution to the business, 58
6 Candidates are promoted on the basis of merit. 57
7 Poor performance is dealt with positively by managers (not ignored). 56
8 Reward system s are being upgraded positively 52
9 Customers describe us a s an organisation who pride ourselves on our level of service. 52
10 Senior management provide clear direction and leadership to take the business forward. 51
11 W e fill vacancies with the right people. , ' 51
12 A s a result of the survey, I believe management will carefully consider problems brought to its attention. 50
Iamrod Eireann Staff Survey 2005 - South West

RESULTS BY SCALE
Item No.
Direction/Clarity of Strategy PERFORMANCE 5 Strong apee 4 Agree 3 Urrsure 2 Disagree 1 Strongly disagree
2005 resultsStatement % positive %negative
1 Senior management provide clear direction and leadership to take the business forward. 22 51
2 In my opinion, Iamrod Eireann is, on the whole, well managed. 27 46
3 My manager sets clear direction for the team. 49 35
4 My manager understands and explains the commercial implications of his actions. 41 38
5 I have a clear understanding of the goals of my department 65 19
6 I understand how my role contributes to the business. 81 7
7 Senior managers take a long-term view in planning for the future. 33 44
Iamrod Eireann Staff Survey 2005 - South West

RESULTS BY SCALE
Performance ManagementPERFORMANCE 5 SJroogty agree4 Agree 3 Unsure 2 Disagree 1 Strongty disagree
% positive
2005 resultsItem No. Statement % positive ^negative
1 I get regular feedback on my performance. 18 74
2 My manager regularly reviews how I am doing. 18 63
3 Poor performance is dealt with positively by managers (not ignored). 30 56
4 I get support from my manager when I need it. 52 35
5 I have targets which I am accountable for, 62 23
larnrod Ereann Staff Survey 2005 - South West 6

RESULTS BY SCALE
Change ManagementPERFORMANCE 5 Strongly agree 4 Agree 3 Unsure 2 Disagree 1 Strongly disagree
% positive
2005 resultsitem No. Statement % positive ^negative
1 Senior management make appropriate changes 22 44
2 Senior management support others effectively through change. 21 46
3 Senior management make changes too frequently. 35 37
4 Senior managers implement changes successfully. 13 49
5 I understand why change is happening. 68 12
6 The organisation encourages innovation and continuous improvement. 46 . 30
7 My manager listens to suggestions for change from staff. 43 35
Iamrod Eireann Staff Survey 2005 - South West 7

RESULTS BY SCALE
Human Resource ManagementPERFORMANCE 5 Strongly agree 4 Agree 3 Unsure 2 Disagree 1 Strongly drsa^ee
2005 resultsItem No. Statement % positive ^negative
1 The organisation attracts highly capable talent at entry. 31 40
2 New recruits have the appropriate skills/behaviours/attitudes etc. for the jobs. 32 42
3 W e fill vacancies with the right people. 19 51
4 There is scope within Iamrod Eireann to develop knowledge, new skids, and experience. 74 12
5 The Career Development Centre provides a valuable service to my colleagues 47 21
6 My manager ensures that I have access to whatever training/support I need. 51 36
7 The training I receive is effective. 62 19
8 My performance really affects decisions that are made about me, such a s promotion. 51 26
9 Candidates are promoted on the basis of merit. 18 57
10 I feel that there are opportunities for career advancement in Iarnrod Eireann. 58 19
11 People are rewarded appropriately for their contribution to the business. 20 58
12 People are paid for the level of their performance, not merely for being at work. 17 64
13 Reward system s are being upgraded positively 12 52
14 Personnel policies are administered consistently throughout the organisation. 23 39
15 Senior managers are concerned about employee welfare. 24 49
16 Managers seek to support people when they have problems. 43 37
17 I feel that I am valued a s an employee. 35 35
Iamrod Breann Staff Survey 2005 - South West

RESULTS BY SCALE
Customer Focus/Concern for QualityPERFORMANCE 5 Strongly agree 4 Agree 3 Unsure2 Disagree 1 Strongly disagree
40 50 60
% p o s it iv e
V*
2 0 0 5 r e s u lt s
Item No. Statement % positive %negativa
1 larnrod Eireann is committed to delivering the highest standards of customer service. 59 23
2 Senior management set very high standards of quality. 45 30
3 Customers describe us as an organisation who pride ourselves on our level of service. 19 52
4 W e respond rapidly and positively to external customers when things go wrong/people recognise the need to put custor 43 35
5 My manager does not tolerate things that hinder customer service. 56 23
6 I would recommend our services to family/friends. 70 13
7 W e seek regular feedback from our customers. 43 29
larnrod Ereann Staff Survey 2005 - South West

RESULTS BY SCALE
Commercial FocusPERFORMANCE 5 Strongly agrw 4 Agree 3 Unsure 2 Disagree 1 Strongly disagree
40 50 60
% positive
2005 resultsItem No. Statement % positive ‘/.negative
1 Iarnrod Eireann is managed as a commercial organisation. 45 21
2 Reducing cost is an important activity within Iamrod Eireann 60 22
3 My manager encourages me to look at the cost/profitability of activities/projects. 42 38
4 Iamrod Eireann is a profit-orientated organisation. 45 32
5 There is a great emphasis on commercial results. 45 23
Iamrod Eireann Staff Survey 2005 - South W esf 10

RESULTS BY SCALE
Concern for SafetyJ______ 1______ I____I— , . I__________L
PERFORMANCE
50 60
% positive
Strongly agree Agree Unsure Disagree Strongly disagree
2005 resultsItem No. Statement % positive %negative
1 Safety is the prime concern of the company. j 83 12
2 Iamrod Eireann is safety conscious organisation. 87 9
3 Management make people aware of the Iamrod Eireann responsibilities regarding safety. 81 9
4 Safety checks are always carried out. 60 26
5 Appropriate safety equipment (e.g. PPE) is provided by the company. 89 5
6 Appropriate training is provided to support our safety standards. 74 15
7 I am satisfied with my physical working environment (heat, light, ventilation, space). 52 37
Iamrod Eireann Staff Survey 2005 - South W esf

RESULTS BY SCALE
Involvement and InclusionPERFORMANCE 5 Strongly agree 4 Agree 3 Unsure 2 Disagree 1 Strongfy disagree
Item No. Statement
1 Senior Management take a visible interest in our welfare.
2 My manager keeps us informed on work related issues - what's happening and why.
3 Management seek views of staff on relevant issues.
4 Management tries to resolve work related issues locally.
5 My views are listened to by my manager.
6 I am satisfied with my involvement in decisions that affect my work.
7 I have sufficient authority to do my job well.
2005 results% positive %negative
50
48
61
31
35
39
20
larnrod Ereann Staff Survey 2005 - South W esf 12

RESULTS BY SCALE
Workplace Diversity
2005 resultsItem No. Statement % positive %negative
1 I have never experienced any form of treatment which I would describe as negative discrimination “Y 55 37
2 I am familiar with the equality policy & procedures in relation to Bullying, Sexual Harassment & Harassment 79 8
3 Women's careers have been limited by attitudes/practices... but are now improving 49 15
4 Policies and procedures tend to be applied fairly and equally to all employees 49 35
5 My current working arrangements suit my family/personal commitments 60 33
6 Employees have equal access to flexible/family friendly working arrangements 39 437 The Equality Office effectively raises awareness around issues of Equality and Diversity
r
50 18
Iamrod Ereann Staff Survey 2005 - South West 13

RESULTS BY SCALE
Working Together PERFORMANCE 5 Stronft? agree 4 Agree 3 Unsure 2 Disagree 1 Strongly disagree
% positive
2005 resultsItem No. Statement % positive % negative
1 Different departments/function work together and effectively to achieve results for the company. 34 50
2 Other departments provide my team with excellent service. 31 45
3 Relations between management and other work groups are good. 35 31
4 Management and other employees trust each other (and work together effectively). 30 50
5 My team provides excellent service to other departments, 63 14
6 The people I work with co-operate to get the job done. 80 12
7 Departments are often in conflict with each other 48 32
Iamrod Eireann Staff Survey 2005 - South West. 14

RESULTS BY SCALE
My ManagerPERFORMANCE5 Strongly agree 4 Agree3 Unsure2 Disagree1 Strongly disagree
% positive
2005 resultsItem No. Statement % positive ^negative
1 My manager manages his/her people well. 53 31
2 My manager can be relied on to do what he/she says that he/she will do. 51 29
3 My manager treats me with respect. 68 20
4 My manager gives me support in managing my workload. 56 33
5 I am thanked by my manager for a good job well done. 55 35
6 Senior managers follow through on commitments they have made. 20 43
Iamrod Eireann Staff Survey 2005 - South West

RESULTS BY SCALE
item No.
Internal MediaPERFORMANCE 5 Strongly agree4 Agree3 Unsure2 Disagree 1 Srongty disagree
2003 resultsStatement % positive ^n ega tive
1 I receive Rail Brief and Stop Press regularly 87 102 I am happy with the content of both Rail Brief and Stop Press 76 10
3 R A IL B R IE F is a worthwhile staff magazine 77 11
4 Stop Press is a worthwhile publication 73 12
5 Organisational policy is clear 55 18
larnrod Eireann Staff Survey 2005 - South West

RESULTS BY SCALE
2005 resultsItem No. Statement % positive ^negative
1 Morale is generally high around here. 37 47
2 I am proud to work for Iamrod Eireann. 71 17
3 I look forward to coming to work. 61 24
4 A s a result of the survey, I believe management will carefully consider problems brought to its attention. 28 50
5 A s a result of the survey, I believe management will act on problems identified. 26 48
Iamrod Eireann Staff Survey 2005 - South IVesf 17

COM PARISON BY FUNCTIO N (1)
Central Services; Chief Mechanical Engineer; DART
lnfrastructure;North&East
Iamrod Eireann Staff Survey 2005 - South West

COMPARISON BY FUNCTION (2)
Key: C serv CME D A RT Infra NE New W orks swNumber of respondents 79 82 40 94 74 30 116
dir Direction/Clarity of Strategy 3.54 2.78 3.30 3.35 3.42 3.5 3.07per Performance Management 3.14 2.58 3.05 3.10 3.17 2.86 2.65cha Change Management 3.24 2.72 3.12 3.09 3.18 2.96 2.91hr Human Resource Management 3.18 2.70 2.79 3.07 3.04 2.94 2.87cfq Customer Focus/Concern for Quality 3.23 2.95 3.15 3.36 3.23 3.09 3.19foe Commerical Focus 3.42 3.15 2.98 3.27 3.14 3.29 3.19saf Concern for Safety/Working Environmei 3.73 3.43 3.70 3.77 3.85 3.83 3.93inv Involvement and Inclusion 3.30 2.67 3.16 3.23 3.24 3.05 2.94div Workplace Diversity 3.46 3.08 3.02 3.41 3.37 3.27 3.28wor Working Together 3.32 3.00 3.08 3.38 3.26 3.31 3.10man My Manager 3.48 2.73 3.64 3.52 3.64 3.49 3.21med Internal Media 3.99 3.64 3.48 3.71 3.83 3.57 3.81sat Overall Job Satisfaction 3.30 2.63 3.04 3.38 3.43 3.02 3.04
Iamrod Eireann Staff Survey 2005 - South West

How progressive is each area.
0 % 10% 20% 30% 40% 50% 60% 70% 80% 90% 100%
North & East
South &West
Infrastructure
Finance & Admin
Corporate
Human Resources
Freight
Safety
Network Catering
CM E
New W orks
Dart
=fc
□ Not forward looking □ Steadily forward looking Q Moving forward
Not forward looking Steadily forward lookm Moving forward
North & East 13 48 40South SW est 21 38 41
Infrastructure 17 44 39Finance & Admin 26 49 24
Corporate 16 44 40
Human Resources 34 41 25Freight 92 5 3Safety 8 22 71
Network Catering 68 21 11
CM E 29 57 13New W orks 11 46 44Dart 7 28 66
larnrod Eireann Staff Survey 2005 - South l/Vesf