Embed Size (px)
Citation preview

Elsevier Editorial System(tm) for Aquaculture
Manuscript Draft
Manuscript Number:
Title: Growth performance and osmoregulation in the shi drum (Umbrina cirrosa) adapted to different
environmental salinities
Article Type: Research Paper
Keywords: shi drum; Umbrina; osmoregulation; growth; chloride cells; gill Na+/K+-ATPase; chloride cells
Corresponding Author: Dr. Constantinos Chrysanthos Mylonas, Ph.D.
Corresponding Author's Institution: Hellenic Center for Marine Research
First Author: Constantinos C Mylonas, Ph.D.
Order of Authors: Constantinos C Mylonas, Ph.D.; Michalis Pavlidis; Nikos Papandroulakis; Mario M Zaiss;
Dimitris Tsafarakis; Stamatis Varsamos
Abstract: In order to investigate the ability of shi drum (Umbrina cirrosa) to be reared at diverse locations,
growth and osmoregulatory performance were assessed at full-strength seawater (40 psu), nearly iso-
osmotic water (10 psu) and low salinity, hypo-osmotic water (4 psu). At the end of the 84-day experimental
period, fish reared at 4 psu displayed shorter mean fork length, lower mean body weight, lower specific
growth rate and higher food conversion efficiency than fish reared at 10 or 40 psu. The effect of salinity on
growth performance was also reflected by changes in plasma triglycerides and cholesterol, with fish reared
at 4 psu exhibiting the lowest mean concentrations, while there was no significant difference in mean plasma
glucose concentrations among treatments. Plasma osmolality was lower at 4 psu from day 42 onwards,
while there was no significant difference in mean plasma K+ and Cl- concentrations. Plasma sodium and gill
Na+/K+-ATPase activity showed minimum values on day 42 at 4 psu, but at the end of the experiment there
was no difference among groups. Pavement cells, mucus cells and chloride cells were identified by
histology on the gill epithelium. In shi drum reared at full seawater, mucus cells contained a mixture of acid
and neutral mucins, whereas in fish adapted to hypo-osmotic environment neutral mucins were mainly
observed. The total number of chloride cells did not differ between the three salinities, however differences
in their location were found. Our results indicate that shi drum reared from full-strength seawater to nearly

iso-osmotic salinity do not face any osmoregulatory imbalance, while fish reared in hypo-osmotic water
displayed osmoregulatory impairment and low growth performance.
Suggested Reviewers: Gert Flik Ph.D.
Head of Department, Animal Physiology, University of Nijmegen
Steven McCormick Ph.D.
Section leader, Physiology, U.S. Geological Survery, Conte Anadromous Fish Research Center
Opposed Reviewers:

1
2
Growth performance and osmoregulation in the shi drum (Umbrina cirrosa)
adapted to different environmental salinities4
Constantinos C. Mylonas1,* Michalis Pavlidis2, Nikos Papandroulakis1, Mario M. Zaiss1, 6
Dimitris Tsafarakis1,2 and Stamatis Varsamos3, #
8
1 Institute of Aquaculture, Hellenic Center for Marine Research, P.O. Box 2214, Iraklion, 10
Crete 71003, Greece
2 Department of Biology, University of Crete, P.O. Box 2208, Iraklion, Crete 71409, 12
Greece
3 Université Montpellier II, SkuldTech, CC 091, Place Eugène Bataillon, 34095, 14
Montpellier, France
16
18
* Corresponding author: tel +30 2810 337878, fax +30 2810 7825, 20
# Current address: European Commission, DG Fisheries and Maritime Affairs, Unit A3. 22
Research, Data Collection and Scientific Advice, Rue Joseph II 79, 2/34, B 1049
Brussels.24Comment [C1]: Check if OK
Manuscript

2
Abstract
In order to investigate the ability of shi drum (Umbrina cirrosa) to be reared at 26
diverse locations, growth and osmoregulatory performance were assessed at full-strength
seawater (40 psu), nearly iso-osmotic water (10 psu) and low salinity, hypo-osmotic 28
water (4 psu). At the end of the 84-day experimental period, fish reared at 4 psu
displayed shorter mean fork length, lower mean body weight, lower specific growth rate 30
and higher food conversion efficiency than fish reared at 10 or 40 psu. The effect of
salinity on growth performance was also reflected by changes in plasma triglycerides and 32
cholesterol, with fish reared at 4 psu exhibiting the lowest mean concentrations, while
there was no significant difference in mean plasma glucose concentrations among 34
treatments. Plasma osmolality was lower at 4 psu from day 42 onwards, while there was
no significant difference in mean plasma K+ and Cl- concentrations. Plasma sodium and 36
gill Na+/K+-ATPase activity showed minimum values on day 42 at 4 psu, but at the end
of the experiment there was no difference among groups. Pavement cells, mucus cells 38
and chloride cells were identified by histology on the gill epithelium. In shi drum reared
at full seawater, mucus cells contained a mixture of acid and neutral mucins, whereas in 40
fish adapted to hypo-osmotic environment neutral mucins were mainly observed. The
total number of chloride cells did not differ between the three salinities, however 42
differences in their location were found. Our results indicate that shi drum reared from
full-strength seawater to nearly iso-osmotic salinity do not face any osmoregulatory 44
imbalance, while fish reared in hypo-osmotic water displayed osmoregulatory
impairment and low growth performance. 46
Key words: shi drum, Umbrina, osmoregulation, growth, chloride cells, gill Na+/K+-48
ATPase, chloride cells

3
Introduction50
Euryhaline fishes exhibit the ability to maintain relatively constant ionic
composition of plasma, lymph and interstitial fluid, in a broad range of environmental 52
salinities (Marshall and Grosell, 2006). This is achieved through morphological, cellular,
physiological and endocrine adaptations (McCormick and Bradshaw, 2006; Sakamoto 54
and McCormick, 2006; Shane et al., 2006). The strategy of ion exchange with the
external medium is mediated mainly through the gastrointestinal epithelium, kidney and 56
gills (Marshall and Grosell, 2006). In adult teleost fish, the gills are recognized as the
main site for ion exchange (Wilson and Laurent, 2002) mediated by different 58
transporters, mainly Na+/K+-ATPase (McCormick, 1995; McCormick, 2001), and ion
channels located in the chloride cells, which are also called mitochondria-rich cells 60
(MRCs) or more generally ionocytes (Pisam and Rambourg, 1991; Hirose et al., 2003;
Marshall and Grosell, 2006).62
Adaptation of euryhaline fish to different salinities involves changes in ion
transport mechanisms that generally induce changes in oxygen consumption, suggesting64
variations in the energetic demands for osmoregulation (Morgan and Iwama, 1991).
Several scenarios have been suggested to describe changes in oxygen metabolism in fish 66
following salinity challenge that, in some cases, can result in altered or enhanced growth
(Boeuf and Payan, 2001). The relationship between osmoregulation and growth 68
performance in marine fish has stimulated a large amount of research and, so far, it
seems to be species-specific (Boeuf and Payan, 2001). Each fish species seems to have 70
its own salinity optimum for growth, and osmoregulatory imbalance is often associated
with whole animal-level stress changes, including decreased growth performance (De 72
Silva and Perera, 1976; Boeuf and Payan, 2001; Imsland et al., 2001).

4
Some members of the family Sciaenidae (Nelson, 2006) display a great potential 74
for aquaculture, and some have been reared in commercial facilities for some time.
These include the red drum (Sciaenops ocellatus) in the United States (Miranda and A.J., 76
1985; Thomas et al., 1995; Gardes et al., 2000), the mulloway (Argyrosomus japonicus)
in Australia (Battaglene and Talbot, 1994; Fielder and Bardsley, 1999), and the maigre 78
(Argyrosomus regius) in Europe (Pastor Garcia et al., 2002; Poli et al., 2003). Another
Sciaenid species of interest in the eastern part of the Mediterranean Sea is the shi drum 80
(Umbrina cirrosa) (Cardellini et al., 1999; Barbaro et al., 2002; Mylonas et al., 2004;
Zaiss et al., 2006). Sciaenid fishes are considered as euryhaline species (Miranda and 82
A.J., 1985; Fielder and Bardsley, 1999; Doroudi et al., 2006), therefore they could be
considered for aquaculture diversification in coastal lagoons with brackish water and 84
areas near the mouth of large rivers, where the commonly employed marine species are
not suitable. In the case of the shi drum, as well as some of the other sciaenids with 86
aquaculture potential, there is a complete lack of knowledge on its adaptation potential
and growth performance in different salinities.88
The objective of the present work was to study the osmoregulatory capacity and the
interaction between salinity adaptation and growth performance in shi drum, in order to 90
provide scientific background for the development of optimized husbandry practices for
this species. For this purpose, fish were reared for three months at different salinities 92
representing full-strength seawater (40 psu), nearly iso-osmotic water (10 psu) and hypo-
osmotic water (4 psu), and changes in gill histology, osmoregulation, growth and 94
energetic metabolism related parameters were evaluated.
96
2. Material and Methods98
2.1. Animal husbandry and experimental design

5
Experiments were conducted using shi drum juveniles at the facilities of the 100
Institute of Aquaculture, Hellenic Centre for Marine Research (Crete, Greece). Fish
were produced in July 2004 from wild-caught, captive-reared broodstock, after hormonal 102
induction of spawning with gonadotropin-releasing hormone agoinst (GnRHa) implants
(Mylonas et al., 2004). Fish with mean ± S.D. total length (TL) of 11.8 ± 0.8 cm and 104
body weight (BW) of 22.8 ± 4.5 g were reared in three independent recirculating
aquaculture systems (RAS) at different salinities (40, 10 and 4 psu). Each RAS was 106
fitted with mechanical and biological filters, and supported two replicated 500-l
cylindroconical polyester tanks containing the experimental fish (n =30). The 108
recirculated water was maintained at 19 ± 1ºC and >80% oxygen saturation throughout
the course of the experiment (84 days), and new water exchange rate was 30% every 2-3110
d. Fish were fed ad libitum with commercial feed (1st period EXCEL, SKRETTING) by
the use of a demand-feeder and the photoperiod was fixed at 24L:0D throughout the 112
experiment.
After randomly allocating the fish in their tanks (n = 30) at 40 psu, two replicated 114
groups were acclimated gradually to the lower experimental salinities over the course of
6 d. Total length and BW measurements were taken from all fish in each tank at 0, 14, 116
28, 42, 56, 70 and 84 days from the start of the experiment. Blood samples were taken
initially (day 0) from ten fish from the stock population and then from five fish from each 118
tank at 46 and 84 d. Blood was collected from the caudal vusculature with heparinized
syringes, centrifuged at 5,000 rpm for 15 min at 4C, and the plasma was stored at -80C 120
until further analysis. Five fish from each treatment group were also sacrificed at 46 and
84 days, the second gill arch was excised for histological analysis and the third gill arch 122
was quickly stored at -80°C for determination of Na+/K+-ATPase activity (see later for
method). For all measurements, fish were first anaesthetized in a solution of 0.4 ml L-1124

6
of clove oil (Mylonas et al., 2005), dissolved first 1:10 v/v in 96% EtOH. Fish handling
was carried out according to the European Union Directive (86/609EEC) for the 126
protection of animals used for experimental and other scientific purposes (EEC, 1986)
and the "Guidelines for the treatment of animals in behavioural research and teaching" 128
(Anonymous, 1998).
130
2.2. Biochemical analyses
Plasma metabolites were determined by enzymatic colorimetric procedures 132
(glucose GOD/PAP; cholesterol PAP; triglycerides GPO/PAP) using commercial kits
(Biosis, Greece). Osmolality was measured using a cryoscopic osmometer (Gonotec, 134
Osmomat 030). Plasma samples were diluted 1:600 with lithium nitrate 15 mmol L-1 and
electrolytes (K+, Na+) were determined by flame emission spectrophotometry. Chloride 136
ions were determined by spectrophotometric method based on the reaction of Cl- with
mercuric thiocyanate. 138
Gill Na+/K+-ATPase activity was determined according to Varsamos et al. (2004).
Briefly, gill arches were homogenized with an IKA disperser (IKA®Yellowline, USA), at 140
9,500 rpm for 5 sec, with 1 ml of buffer containing: 250 mM sucrose, 10 mM Hepes, 5
mM MgCl2, 0.1 mM Na2-EDTA, dH2O (pH 7.4). The homogenate was centrifuged 142
(4,000 rpm, 5 min, 4C) and the supernatant used for assays. Homogenate protein
content was determined in triplicate as detailed by Bradford (1976), using BSA (Sigma, 144
A-4503) as standard. The Na+/K+-ATPase activity was assessed as the difference of total
ATP hydrolysis (in presence of Na+, K+, Mg2+ and ATP) and that in absence of K+ but in 146
presence of an optimal concentration of the specific inhibitor ouabain (1 mg ml-1). The
amount of released phosphate was assessed by comparison with commercial reference 148
standards (Calimat, BioMérieux, France). The Na+/K+-ATPase specific activity was

7
expressed in μmol Pi h-1 mg-1 protein. The total activity was calculated as the product of 150
the specific activity and the total protein amount of the sample and expressed in μmol Pi
h-1. 152
2.5. Histological analyses154
A section of the second gill arch was fixed in 4% formaldehyde: 1% gluteraldehyde
buffered saline (McDowell and Trump, 1976) for at least 24 h. Before embedding in a 156
methacrylate resin (Technovit 7100®, Heraeus Kulzer, Germany) they were dehydrated
through a series of increasing concentrations of ethanol (70-96%). The mounted gills 158
were cut in 3-μm thick sections on a microtome (RM 2245, Leica, Germany), stained
with Methylene Blue (Sigma, Germany)/Azure II (Sigma, Germany)/Basic Fuchsin 160
(Polysciences, USA)(Bennett et al., 1976) and examined under a light microscope (BH-2,
Olympus, Japan). In addition, four sections per gill sample were stained with the 162
combined Alcian blue - periodic acid Schiff (AB-PAS) technique for neutral and acid
mucins (Mowry, 1956) which stains mucus cells specifically and allows identification of164
different types of mucins (Shephard, 1994).
Chloride cell counts were made on histological sections of primary lamellae, where 166
both the cartilaginous vestige of the gill septum was visible and the primary lamella was
sectioned in the middle, along its whole longitudinal axis. Chloride cell counts were 168
made along 1 mm length of three different primary lamellae (starting from the base of
each primary lamella on the gill arch) and the average value was used to represent each 170
fish sampled. It was not possible to make reliable mucus cell counts, because different
sections of the gill filament contained markedly different numbers. 172
2.2. Estimation of growth parameters and statistical analyses174

8
Comparisons of TL and BW between groups reared at different salinities were
made using regression analysis (Sokal and Rohlf, 1981). The general model used was of 176
the form: DtaDataaY 3210 , where Y is the dependent variable, t the time,
D a dummy variable with values 0 and 1 for each condition tested and αi (I = 1, 2 or 3) 178
constants. This method tests the hypothesis that the constants α2 and α3 are zero. Time
series have the same slope when constant α3 is zero, and the same initial value when α2 is 180
zero. When both constants are zero, time series describe similar dependent variables.
Specific growth rate (SGR) was estimated as the slope of the above model. Food 182
conversion ratio (FCR) was estimated as FCR = F / (Bf – Bi), where F = consumed food
(kg), Bf = final biomass (kg), Bi = initial biomass (kg). 184
To evaluate differences in FCR, plasma metabolites, electrolytes, osmolality, gill
Na+/K+-ATPase activity and chloride cell density, data were subjected to 2-way Analysis 186
of Variance (ANOVA) (time x salinity), followed by Duncan’s New Multiple Range
(DNMR) test on main effects, and mean comparisons for interactions. Statistical 188
analysis was performed using linear statistics software (SuperAnova, Abacus Concepts
or SigmaStat, Systat Software, Inc.) at a minimum significance level of P < 0.05. All 190
results are presented as mean ± SEM.
192
3. Results194
3.1. Growth performance of shi drum in different salinities
Survival was unaffected by salinity and at the end of the 84-day experimental196
period it was greater than 97% in all salinities. Also, no differences in feeding behaviour
or appetite were observed. However, salinity did have a statistically significant effect on 198
growth (P < 0.05), with fish reared at 4 psu having significantly smaller TL and BW than
the fish reared at 10 or 40 psu, whereas there were no differences between fish reared at 200

9
10 or 40 psu salinity (Fig. 1). The final mean BW of shi drum reared at the three
salinities were 63.3 ± 3.2, 67.5 ± 2.1 and 44.5 ± 2.2g for 40, 10 and 4 psu, respectively. 202
As expected from the above measurements, SGR over the course of the study was also
affected by environmental salinity, and in fish reared at 4 psu was 0.265 d-1, significantly 204
lower (P < 0.05) than of fish adapted to 10 or 40 psu, which was the same at 0.513 d-1.
There was large variation in the FCR between the two replicates of the 4 psu 206
treatment at different times, as indicated by the large SEM values (Table 1), which could
not be explained by the experimental design. Nevertheless, the statistical analysis over 208
the course of the study indicated the existence of a significant difference (P < 0.05)
between the FCR of fish reared at 4 psu and the FCR of fish reared at 10 or 40 psu, 210
(Table 1). The differences were due to higher values of the 4 psu fish during the first 56
days, when FCR ranged between 1.36 ± 0.14 and 4.71 ± 2.2, compared to a range of 1.06 212
± 0.05 and 1.78 ± 0.07 of fish reared at 10 or 40 psu salinity. During the period between
57 and 84 days after the onset of the experiment no significant difference in FCR was 214
found among the three salinities.
216
3.2. Plasma metabolites, osmolality, electrolytes and gill Na+/K+-ATPase activity
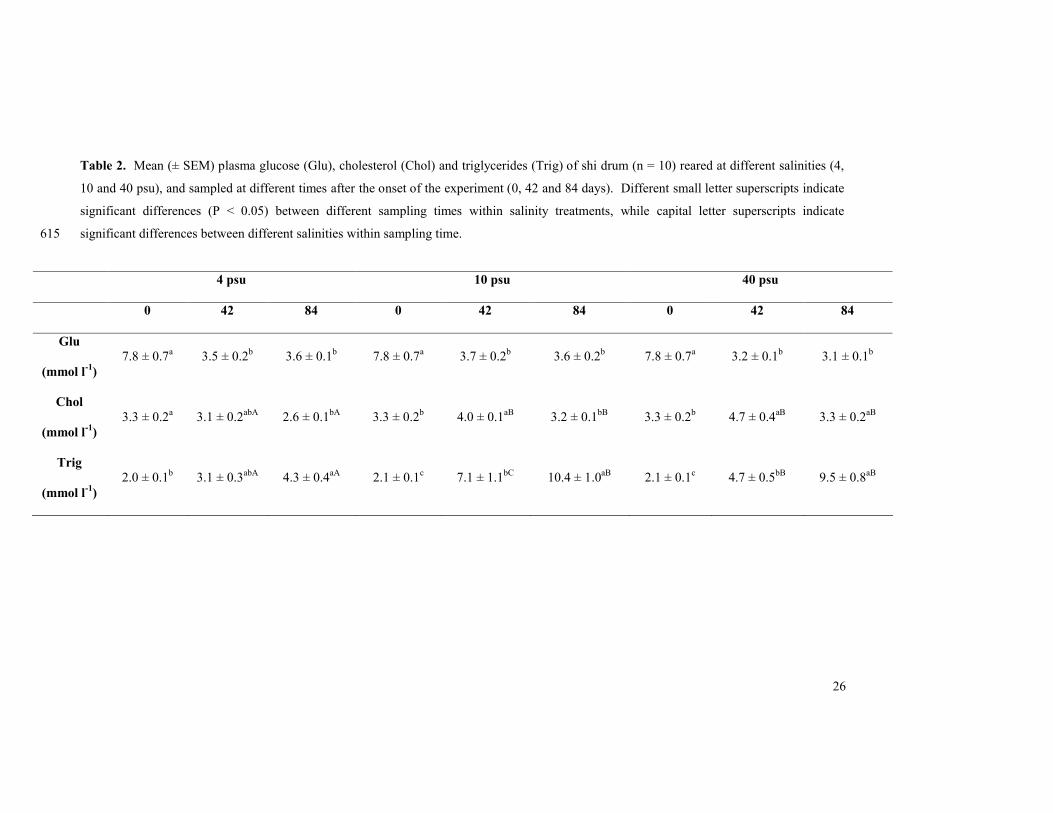
There were no significant differences in mean plasma glucose concentration among 218
fish reared at the different salinities and fish reared in all salinities had significantly (P <
0.05) higher glucose levels at the onset of the experiment (Table 2). In all groups, 220
increased triglycerides concentrations were found at 42 d and reached a maximum at 84
d. Maximum cholesterol concentrations at 10 and 40 psu salinity were found at 42 d, 222
while at 4 psu salinity at 0 d and 42 d (Table 2). Plasma triglycerides and cholesterol
concentrations were significantly lower (P < 0.05) in fish reared at 4 psu than in the other 224
two groups at both sampling points (Table 2).
10
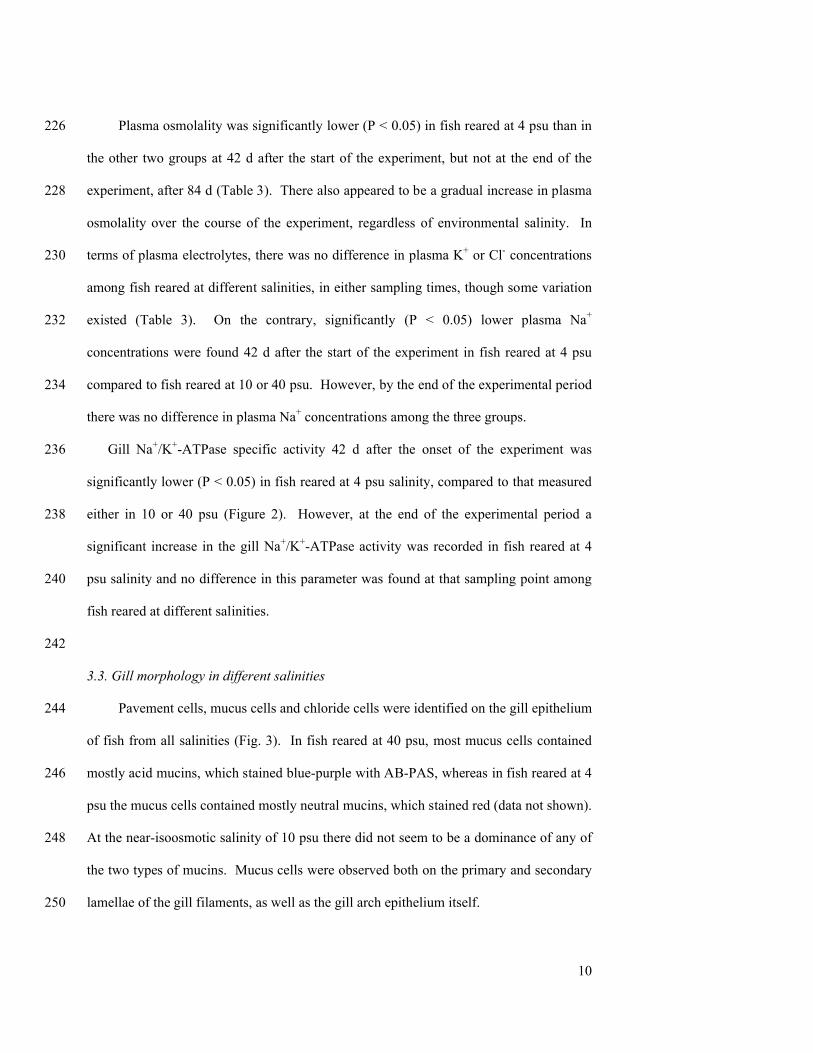
Plasma osmolality was significantly lower (P < 0.05) in fish reared at 4 psu than in 226
the other two groups at 42 d after the start of the experiment, but not at the end of the
experiment, after 84 d (Table 3). There also appeared to be a gradual increase in plasma 228
osmolality over the course of the experiment, regardless of environmental salinity. In
terms of plasma electrolytes, there was no difference in plasma K+ or Cl- concentrations 230
among fish reared at different salinities, in either sampling times, though some variation
existed (Table 3). On the contrary, significantly (P < 0.05) lower plasma Na+232
concentrations were found 42 d after the start of the experiment in fish reared at 4 psu
compared to fish reared at 10 or 40 psu. However, by the end of the experimental period 234
there was no difference in plasma Na+ concentrations among the three groups.
Gill Na+/K+-ATPase specific activity 42 d after the onset of the experiment was 236
significantly lower (P < 0.05) in fish reared at 4 psu salinity, compared to that measured
either in 10 or 40 psu (Figure 2). However, at the end of the experimental period a 238
significant increase in the gill Na+/K+-ATPase activity was recorded in fish reared at 4
psu salinity and no difference in this parameter was found at that sampling point among 240
fish reared at different salinities.
242
3.3. Gill morphology in different salinities
Pavement cells, mucus cells and chloride cells were identified on the gill epithelium 244
of fish from all salinities (Fig. 3). In fish reared at 40 psu, most mucus cells contained
mostly acid mucins, which stained blue-purple with AB-PAS, whereas in fish reared at 4 246
psu the mucus cells contained mostly neutral mucins, which stained red (data not shown).
At the near-isoosmotic salinity of 10 psu there did not seem to be a dominance of any of 248
the two types of mucins. Mucus cells were observed both on the primary and secondary
lamellae of the gill filaments, as well as the gill arch epithelium itself. 250

11
The total number of chloride cells did not differ significantly between the three
experimental salinities, even though at 42 d a slight reduction (P = 0.10) was observed in 252
the fish reared at 4 psu (Fig. 3). However, there was a significant increase (P < 0.01)
over the course of the study, regardless of treatment (Fig. 3). Chloride cells were most 254
frequently observed on the primary lamellae of the gill filaments (Fig. 4). Although not
often, in fish reared at 4 psu, chloride cells were also found on the epithelium of the 256
secondary lamellae. In fish reared at 40 psu salinity, chloride cells appeared to be greater
in size compared to fish adapted to 4 or 10 psu (dat not shown). In fish reared at 4 psu, a 258
thickening of the primary and secondary lamellar epithelium was observed compared to
both fish reared at 10 psu and 40 psu at both sampling times (Fig. 4C).260
262
4. Discussion
It has been shown that several euryhaline teleosts display a two-stage adaptation 264
pattern following salinity challenge, consisting of an adaptive period when changes in
osmotic and metabolic parameters occur, and of a regulatory period which generally 266
leads to a new steady state (Jensen et al., 1998; Sangiao-Alvarellos et al., 2005). Our
data have clearly showed that shi drum juveniles are able to maintain constant plasma 268
osmolality and electrolyte levels over a relatively range of environmental salinities and
during a long period. However, it appears that rearing at very low salinities (4 psu) 270
affects important physiological functions such as osmoregulation and growth. Thus,
body size, SGR and FCR were lower in shi drum exposed to 4 psu salinity compared to 272
those reared at 10 or 40 psu salinity. The blood osmolality of teleosts is around 12 psu,
i.e. approximately one third of that of sea water (~38 psu) and more than 50-fold higher 274
than the salinity of freshwater (~0,2 psu). It is generally admitted that marine fish

12
achieve higher growth rates at lower salinity (Boeuf and Payan, 2001) and that each 276
species has its own salinity optimum for growth, under a certain water temperature and
ontogenetic phase, although existing data are sometimes contradictory. For instance, the 278
best salinity conditions for growth in gilthead sea bream (Sparus aurata) have been
reported at 12 psu (Laiz-Carrión et al., 2005) or 28 psu (Klaoudatos and Conides, 1996), 280
in grey mullet (Mugil cephalus) at 20 psu (De Silva and Perera, 1976), in turbot
(Scopththalmus maxumus) at 15 psu (Imsland et al., 2001) and in European sea bass 282
(Dicentrarhus labrax) at 15 psu (Saillant et al., 2003) or 28-30 psu (Dendrinos and
Thorpe, 1985; Conides and Glamuzina, 2006). The present results indicate that salinity 284
affects FCR and growth in shi drum juveniles adapted to low salinity. The metabolic and
energetic cost of osmoregulation should, at least partly, reflect the effect of salinity on 286
growth, however other possibilities should be taken into account. This may include the
effect of salinity on feeding behavior, appetite, or stimulation/inactivation of other 288
metabolic and endocrine pathways (Boeuf and Payan, 2001; McCormick, 2001).
To our knowledge this is the first report on plasma cholesterol and triglyceride 290
concentrations for shi drum, and the values reported are within the range measured in
other marine species (Kavadias et al., 2003). Interestingly, both parameters seemed to 292
reflect metabolic effects of long term salinity adaptation in this species, whereas plasma
glucose levels where unaffected by salinity treatments. Thus, the low growth 294
performance of shi drum reared at 4 psu was concomitant with lower plasma cholesterol
and triglyceride concentrations compared to those measured in fish reared at 10 or 40 296
psu, suggesting a negative effect of low salinity on energy metabolism. It has been
already suggested that changes in plasma metabolites during the first days of salinity 298
challenge are related to modifications in energy supplies in osmoregulatory tissues
(Sangiao-Alvarellos et al., 2005). For example, in gilthead sea bream plasma triglyceride 300

13
did not show significant changes following acclimation to different salinities (i.e., 6, 12,
38 psu) for 100 d, although growth and SGR were correlated to salinity (12>38>6 psu) 302
(Laiz-Carrión et al., 2005). However, in the same species, a 20 and 25% decrease in
plasma glucose and triglyceride levels, respectively, was observed after adaptation to 6 304
psu salinity, which was then followed by full recovery within 7 d (Sangiao-Alvarellos et
al., 2005). The low cholesterol levels recorded in shi drum adapted to 4 psu salinity 306
could be explained partly by differences in feeding rate compared to the other
experimental salinities. That kind of correlation between the feeding rate and plasma 308
cholesterol levels has been reported in European seabass (Lemaire et al., 1991) as well as
in Eurasian perch (Perca fluviatilis) (Vellas et al., 1994). The absence of differences in 310
glucose levels among the salinity treatments in the present experiments seems surprising,
since the role of glucose as fuel for tissues during osmotic challenge or stress conditions, 312
in general, is well known (Wendelaar Bonga, 1997). However, in long term adaptation,
such as in the present study, it seems that the involvement of this metabolite is less 314
discriminating, and similar results have been obtained in gilthead sea bream (Laiz-
Carrión et al., 2005).316
The results obtained in the present experiment indicate that shi drum reared at 40 or
10 psu salinity for 84 days did not phase major osmoregulatory imbalance, based on the 318
fact that there were no significant differences in plasma osmoregulatory parameters. On
the contrary, fish reared at 4 psu displayed osmoregulatory difficulties, as indicated by 320
the observed lower plasma Na+ after 42 d and osmolality after 42 and 84 d. Low Na+
levels have also been reported in the gilthead sea bream after 100 d rearing at 6 psu 322
salinity (Laiz-Carrión et al., 2005) and in European sea bass 24 h after transfer to
salinities less than 20 psu (Venturini et al., 1992). Difficulties in maintaining 324
homeostasis in low salinities have also been reported in other euryhaline teleost species,

14
such as the sheepshead minnow (Cyprinodon variegates) (Nordlie, 1985) and flounder 326
(Paralichthys orbignyanus) (Sampaio and Bianchini, 2002). Franklin et al. (1992)
suggested that such osmoregulatory impairments indicate salinity stress, whereas the 328
negative effect of stress on growth is well documented in teleosts (Wendelaar Bonga,
1997). 330
It is generally admitted that gills are the organs that consume most energy during
adaptation of teleosts in different salinities, since they must maintain differential 332
regulation of intracellular and extracellular fluids. Moreover, in case of transition from
hypoosmotic to hyperosmotic conditions (or vice versa), Na+ and Cl- fluxes across the 334
gill epithelia must switch from ion uptake to ion excretion (and vice versa). The Na+/K+-
ATPase plays a pivotal role in these processes and, thus, its activity could be related to 336
some extent to the energetic cost of osmoregulation (McCormick, 1995). In our
experiments the lowest activity for this enzyme was recorded in shi drum juveniles 338
reared at low salinity after 42 d, and could suggest, at first sight, a lower energy cost for
osmoregulation at that salinity. Our results are in contrast with the U-shaped variations 340
in gill Na+/K+-ATPase activity reported for euryhaline fish, with high levels in freshwater
or very low salinity and seawater, and lower levels in fish adapted to brackish water (10-342
12 psu) (Jensen et al., 1998; Boeuf and Payan, 2001; Varsamos et al., 2002). However, a
direct relationship between salinity and Na+/K+-ATPase activity has been shown in some 344
teleosts (McCormick, 1995; McCormick, 2001; Marshall, 2002). Nevertheless, at the
end of the present experiment there was no significant difference in Na+/K+-ATPase346
activity among the experimental groups, indicating that fish reached a steady state within
84 d after the challenge. These observations, together with the data mentioned above, 348
suggest that it is rather unlikely that the low enzyme activity observed in the gills after 42
d at low salinity corresponds to low osmoregulatory cost. Rather, a transient alteration in 350

15
cellular metabolism and in the function of membrane exchangers/transporters could be
involved, due to salinity-induced stress. Hence, unlike other euryhaline teleosts, it 352
appears that the adaptation period following low salinity acclimation in shi drum
juveniles is much longer and displays a different pattern. Moreover, other transporters, 354
such as H+-ATPase (Lin and Randall, 1995) or Ca+-ATPase (Marshall, 2002), could be
involved in low salinity adaptation of shi drum.356
In fish, the gill epithelium consists mainly of three types of cells, namely the
pavements cells (representing 90–95% of the total epithelial area), the chloride cells and 358
the mucus cells (Shephard, 1994; Wilson and Laurent, 2002). In shi drum reared at full
seawater, most mucus cells of the gills stained purple indicating a mixture of acid and 360
neutral mucins. Similar results were reported in other species, such as the gilthead sea
bream, Senegal sole (Solea senegalensis) and Siberian sturgeon (Acipenser barei)362
(Sarasquete et al., 2001). On the contrary, most mucus cells of shi drum exposed to
hypo-osmotic environment stained reddish, indicating that they consisted mainly of 364
neutral mucins, a result similar to that documented for species maintained in freshwater,
such as the rainbow trout (Oncorhynchus mykiss) (Ferguson et al., 1992) and Atlantic 366
salmon (Salmo salar) (Roberts and Powell, 2003). Our findings suggest that changes in
the mucin production of gill mucus cells, could be part of the salinity adaptation process 368
in the shi drum.
Gill chloride cells are recognized as the main site for ion exchange mediated by 370
different transporters and ion channels (Lin and Randall, 1995; Marshall, 2002; Marshall
and Singer, 2002; McCormick and Bradshaw, 2006). Changes in the number and/or size 372
of these cells have been related to salinity acclimation in several teleost species
throughout the postembryonic development (Pisam and Rambourg, 1991; Varsamos et 374
al., 2002). In the present study there was no significant difference in the chloride cell

16
density among shi drum reared at the three different salinities. This is in accordance with 376
findings from studies in total chloride cells counts in Adriatic sturgeon (A. naccarii)
(Cataldi et al., 1995; McKenzie et al., 1999) or sea trout (Salmo trutta) (Brown, 1992)378
after acclimation from freshwater to saltwater. Future ultrastructural and molecular
studies are necessary to study more thoroughly the role of these cells in shi drum 380
adaptation to different salinities.
In conclusion, the present study indicates that shi drum acclimated to full seawater or 382
nearly isoosmotic water do not phase any osmoregulatory imbalance, while fish reared at
4 psu displayed osmoregulatory difficulties and low growth performance. The ability of 384
shi drum to utilize environments of lower salinity, up the iso-osmotic point, opens new
possibilities in the development of shi drum aquaculture in coastal lagoons and estuaries, 386
thus further contributing to the sustainable diversification of the aquaculture industry.
388
5. Acknowledgements390
Financial support for this study has been provided by a grant to CCM under the
2003-2005 Programme for Research and Technology Cooperation between the Republics 392
of Greece and Cyprus (Project “ICHTHIONIMFI”, Protocol number 2206; 26 February,
2004), from the General Secretariat for Research and Technology, Greece and the 394
Foundation for Promotion of Research, Cyprus.

17
396
6. References
Anonymous, 1998. Guidelines for the treatment of animals in behavioural research and 398
teaching. Animal Behaviour 55: 251-257.
Barbaro, A., Franceson, A., Bertotto, D., Bozzato, G., Di Maria, I., Patarnello, P., Furlan, 400
F., Colombo, L., 2002. More effective induction of spawning with long-acting
GnRH agonist in the shi drum, Umbrina cirrosa L. (Sciaenidae, Teleostei), a 402
valuable candidate for Mediterranean mariculture. Journal of Applied Ichthyology
18: 192-199.404
Battaglene, S.C., Talbot, R.B., 1994. Hormone induction and larval rearing of mulloway,
Argyrosomus hololepidotus (Pisces: Sciaenidae). Aquaculture 126: 73-81.406
Bennett, H.S., Wyrick, A.D., Lee, S.W., McNeil, J.H., 1976. Science and art in preparing
tissues embedded in plastic for light microscopy, with special reference to glycol 408
methacrylate, glass knives, and simple stains. Stain Technology 51:71-94.
Boeuf, G., Payan, P., 2001. How should salinity influence fish growth? Comparative 410
Biochemistry and Physiology C130: 411-423.
Bradford, M.M., 1976. A rapid and sensitive method for the quantitation of microgram 412
quantities of protein utilizing the principle of protein-dye binding. Analls of
Biochemistry 72: 248 - 254.414
Brown, P., 1992. Gill chloride cell surface-area is greater in freshwater-adapted adult sea
trout (Salmo trutta, L.) than those adapted to seawater. Journal of Fish Biology 40: 416
481-484.
Cardellini, P., Franceson, A., Zanella, S., Bozzato, G., Benedetti, P., Borgoni, N., 418
Barbaro, A., 1999. Captive rearing of shi drum, Umbrina cirrosa (L.), in different
thermal conditions. Biologia Marina Mediterranea 6: 287-290.420

18
Cataldi, E., Ciccotti, E., Di Marco, P., Di Santo, O., Bronzi, P., Cataudella, S., 1995.
Acclimation trials of juvenile Italian sturgeon to different salinities: morpho-422
physiological descriptors. Journal of Fish Biology 47: 609-618.
Conides, A.J., Glamuzina, B., 2006. Laboratory simulation of the effects of 424
environmental salinity on acclimation, feeding and growth of wild-caught juveniles
of European sea bass Dicentrarchus labrax and gilthead seabream Sparus aurata. . 426
Aquaculture in press.
De Silva, S.S., Perera, P.A.B., 1976. Studies on the young grey mulet, Mugil cephalus L. 428
I. Effects of salinity on food intake, growth and food conversion. Aquaculture 7:
327-338.430
Dendrinos, P., Thorpe, J.P., 1985. Effects of reduced salinity on growth and body
composition in the European bass Dicentrarchus labrax (L.). Aquaculture 49: 333-432
358.
Doroudi, M.S., Fielder, D.S., Allan, G.L., Webster, G.K., 2006. Combined effects of 434
salinity and potassium concenration on juvenile mulloway (Argyrosomus japonicus,
Temmicnck and Schlegel) in inland saline groundwater. Aquaculture Research 37: 436
1034-1039.
EEC, 1986. Council Directive 86/609 EEC for the protection of animals used for 438
experimental and other scientific purposes. Official Journal L358: 1-28.
Ferguson, H.W., Morrison, D., Ostland, V.E., Lumsden, J., Bryne, P., 1992. Responses 440
of mucus-producing cells in gill desease of rainbow trout (Oncorhynchus mykiss).
Journal of Comparative Pathology 106: 255 - 265.442
Fielder, D.S., Bardsley, W., 1999. A preliminary study on the effects of salinity on
growth and survival of mulloway Argyrosomus japonicus larvae and juveniles. 444
Journal of the World Aquaculture Society 30: 380-387.

19
Franklin, C.E., Forster, M.E., Davison, W., 1992. Plasma cortisol and osmoregulatory 446
changes in sockeye salmon transferred to sea water: comparison between successful
and unsuccessful adaptation. Journal of Fish Biology 41: 113-122.448
Gardes, L., Villanove, P., Buchet, V., Fauvel, C., 2000. Induced spawning of red drum,
Sciaenops ocellatus: use of multivariate and univariate analysis methods in the 450
search for side effects of LH-RHa treatments and ovarian development state upon
spawn quality. Aquatic Living Resources 13:19-27.452
Hirose, S., Kaneko, T., Naito, N., Takei, Y., 2003. Molecular biology of major
components of chloride cells. Comparative Biochemistry and Physiology 136B: 454
593 - 620.
Imsland, A.K., Foss, A., Gunnarsson, S., Berntssen, M.H.G., FitzGerald, R., Bonga, 456
S.W., von Ham, E., Nævdal, G., Stefansson, S.O., 2001. The interaction of
temperature and salinity on growth and food conversion in juvenile turbot 458
(Scophthalmus maximus). Aquaculture 198: 353-367.
Jensen, M.K., Madsen, S.S., Kristiansen, K., 1998. Osmoregulation and salinity effects 460
on the expression and activity of Na+/K+ ATPase in the gills of the European sea
bass Dicentrarchus labrax (L.). Journal of Experimental Zoology 282: 290-300.462
Kavadias, S., Castritsi-Catharios, J., Dessypris, A., 2003. Annual cycles of growth rate,
feeding rate, food conversion, plasma glucose and plasma lipids in a population of 464
European sea bass (Dicentrarchus labrax L.) farmed in floating marine cages.
Journal of Applied Ichthyology 19: 29-34.466
Klaoudatos, S.D., Conides, A.J., 1996. Growth, food conversion, maintenance and long-
term survival of gilthead, Sparus aurata L., juveniles after abrupt transfer to low 468
salinity. Aquaculture Research 27: 765-774.

20
Laiz-Carrión, R., Sangiao-Alvarellos, S., Guzmán, J.M., Martín del Río, M.P., Soenga, 470
J.L., Mancera, J.M., 2005. Growth performance of gilthead sea bream Sparus
aurata in different osmotic conditions: implications for osmoregulation and energy 472
metabolism. Aquaculture 250: 849-861.
Lemaire, P., Drai, P., Mathieu, A., Lemaire, S., Carriere, S., Giudicelli, J., Lafaurie, M., 474
1991. Changes with different diets in plasma enzymes (GOT, GPT, LDH, ALP)
and plasma lipids (cholesterol, triglycerides) of sea bass (Dicentrarchus labrax). 476
Aquaculture 93: 63-75.
Lin, H.R., Randall, D.J., 1995. Proton pumps in fish gills. In: Wood, C.M., Shuttleworth, 478
T.J. (Eds.), Fish Physioogy vol. 14, Cellular and Molecular Approaches to Fish
Ionic Regulation, Academic Press, New York, pp. 229-255.480
Marshall, W.S., 2002. Na+, Cl-, Ca2+ and Zn2+ transport by fish gills: retrospective review
and prospective synthesis. Journal of Experimental Zoology 293: 264-283.482
Marshall, W.S., Singer, T.D., 2002. Cystic fibrosis transmembrane conductance regulator
in teleost fish. Biochemical and Biophysical Acta 1566: 16-27.484
Marshall, W.S., Grosell, M., 2006. Ion transport, osmoregulation, and acid-base balance.
In: Evans, D.H., Claiborne, J.B. (Eds.), The Physiology of Fishes, third edition, 486
Taylor & Francis Group, Boca Raton, Florida, pp. 177-230.
McCormick, S.D., 1995. Hormonal control of gill Na+, K+-ATPase and chloride cell 488
function. In: Wood, C.M., Shuttleworth, T.J. (Eds.), Cellular and Molecular
Approaches to Fish Ionic Regulation, Fish Physiology, vol. 14, Academic Press, 490
New York, pp. 285-307.
McCormick, S.D., 2001. Endocrine control of osmoregulation in teleost fish. American 492
Zoologist 41: 781-794.

21
McCormick, S.D., Bradshaw, D., 2006. Hormonal control of salt and water balance in 494
vertebrates. General and Comparative Endocrinology 147: 3-8.
McDowell, E.M., Trump, B.F., 1976. Histologic fixatives suitable for diagnostic light 496
and electron microscopy. Archives of Pathology and Laboratory Medicine 100:
405-414.498
McKenzie, D.J., Cataldi, E., Di Marco, P., Mandich, A., Romano, P., Ansferri, S.,
Bronzi, P., Cataudella, S., 1999. Some aspects of osmotic and ionic regulation in 500
adriatic sturgeon Acipenser naccarii. II: Morpho - physiological adjustments to
hyperosmotic environments. Journal of Applied Ichthyology 15: 61 - 66.502
Miranda, L.E., A.J., S., 1985. Survival of red drum fingerlings in fresh water: dissolved
solids and thermal minima. Proceedings of the Annual Conference of the 504
Southeastern Association of Fish and Wildlife Agencies 39: 228-237.
Morgan, J.D., Iwama, G.K., 1991. Effects of salinity on growth, metabolism, and ion 506
regulation in juvenile rainbow trout (Oncorhynchus mykiss) and fall Chinook
salmon (Oncorhynchus tshawytscha). Canadian Journal of Fisheries and Aquatic 508
Sciences 48: 2083-2094.
Mowry, 1956. Observations on the use of sulphuric ether for the sulphation of hydroxyl 510
groups in tissue sections. Journal of Histochemistry and Cytochemitsry 4: 407.
Mylonas, C.C., Kyriakou, G., Sigelaki, I., Georgiou, G., Stephanou, D., Divanach, P., 512
2004. Reproductive biology of the shi drum (Umbrina cirrosa) in captivity and
induction of spawning using GnRHa. Israeli Journal of Aquaculture-Bamidgeh 56: 514
75-92.
Mylonas, C.C., Cardinaletti, G., Sigelaki, I., Polzonetti-Magni, A., 2005. Comparative 516
efficacy of clove oil and 2-phenoxyethanol as anesthetics in the aquaculture of

22
European sea bass (Dicentrarchus labrax) and gilthead sea bream (Sparus aurata) 518
at different temperatures. Aquaculture 246: 467-481.
Nelson, R.J., 2006. Fishes of the World, 4th edition. John Wiley & Sons Inc, New York, 520
601 pp.
Nordlie, F.G., 1985. Osmotic regulation in the sheepshead minnow Cyprinodon 522
variegatus Lacépêde. Journal of Fish Biology 26: 161-170.
Pastor Garcia, E., Grau Jofre, A., Massuti Pascual, E., Sanchez-Lamadrid, A., 2002. 524
Preliminary results of growth of meagre, Argyrosomus regius (Asso, 1801) in sea
cages and indoor tanks. In: Basurco, B., Saroglia, M. (Eds.), Aquaculture Europe 526
2002, European Aquaculture Society, Trieste, Italy, pp. 422.
Pisam, M., Rambourg, A., 1991. Mitochondria-rich cells in the gill epithelium of teleost 528
fishes: an ultrastructural approach. International Review of Cytology 130: 191-232.
Poli, B.M., Parisi, G., Zampacavallo, G., Iurzan, F., Mecatti, M., Lupi, P., Bonelli, A., 530
2003. Preliminary results on quality and quality changes in reared meagre
(Argyrosomus regius): body and fillet traits and freshness changes in refrigerated 532
commercial-size fish. Aquaculture International 11: 301-311.
Roberts, S.D., Powell, M.D., 2003. Comparative ionic flux and mucus cell 534
histochemistry: effects of salinity and disease status in Atlantic salmon (Salmo
salar L.). Comparative Biochemistry and Physiology 134A: 525 - 537.536
Saillant, E., Fostier, A., Haffray, P., Menu, B., Chatain, B., 2003. Saline preferendum for
the European sea bass, Dicentrarchus labrax, larvae and juveniles: effect of salinity 538
on early development and sex determination. Journal of Experimental Marine
Biology and Ecology 287: 103 - 117.540
Sakamoto, T., McCormick, S.D., 2006. Prolactin and growth hormone in fish
osmoregulation. General and Comparative Endocrinology 147: 24-30.542

23
Sampaio, L.A., Bianchini, A., 2002. Salinity effects on osmoregulation and growth of the
euryhaline flounder Paralichthys orbignyanus. Journal of Experimental Marine 544
Biology and Ecology 269: 187-196.
Sangiao-Alvarellos, S., Arjona, F.J., Martin del Rio, M.P., Míguez, J.M., Mancera, M., 546
Soengas, J.L., 2005. Time course of osmoregulatory and metabolic changes during
osmotic acclimation in Sparus aurata. Journal of Experimental Biology 208: 4291-548
430.
Sarasquete, C., Gisbert, E., Ribeiro, L., Vieira, L., Dinis, M.T., 2001. Glycoconjucates in 550
epidermal, branchial and digestive mucus cells and gastric glands of gilthead
seabream, Sparus aurata, Senegal Sole, Solea senegalensis and Siberian sturgeon, 552
Acipenser baeri development. European Journal of Histochemistry 45: 267 - 278.
Shane, M.A., Nofziger, C., Blazer-Yost, B.L., 2006. Hormonal regulation of the 554
epithelial Na+ channel: From amphibians to humans. General and Comparative
Endocrinology 147: 85-92.556
Shephard, K.L., 1994. Functions for fish mucus. Reviews in Fish Biology and Fisheries
4: 401-429.558
Sokal, R.R., Rohlf, F.J., 1981. Biometry, 2nd edition. Freeman and Company, New
York, 859 pp.560
Thomas, P., Arnold, C.R., Holt, G.J., 1995. Red drum and other sciaenids. In: Bromage,
N.R., Roberts, R.J. (Eds.), Broodstock Management and Egg and Larval Quality, 562
Blackwell Science, Oxford, pp. 118-137.
Varsamos, S., Diaz, J.P., Charmantier, G., Flik, G., Blasco, C., Connes, R., 2002. 564
Branchial chloride cells in the European sea bass (Dicentrarchus labrax) adapted to
fresh water, salt water and doubly concentrated saltwater. Journal of Experimental 566
Zoology 293: 12-26.

24
Varsamos, S., Wendelaar Bonga, S.E., Charmantier, G., Flik, G., 2004. Drinking rates 568
and Na+/K+-ATPase during early development of the European sea bass
Dicentrarchus labrax: ontogeny and variation following acute salinity changes. 570
Journal of Experimental Marine Biology and Ecology 311: 189-200.
Vellas, F., Ferroni, J.M., Bau, F., Parent, J.P., 1994. Recherches sur l’état physiologique 572
des poissons de la retenue de Pareloup: données relatives a cinq années d’étude.
Hydroecologie Applique 6: 257-292.574
Venturini, G., Cataldi, E., Marino, G., Pucci, P., Garibaldi, L., Bronzi, P., Cataudella, S.,
1992. Serum ions concentration and ATPase activity in gills, kidney and 576
oesophagus of European sea bass (Dicentrarhuc labrax, Pisces, Perciformes)
during acclimation trials to fresh water. Comparative Biochemistry and Physiology 578
103A: 451-454.
Wendelaar Bonga, S.E., 1997. The stress response in fish. Physiological Reviews 77: 580
591-625.
Wilson, J.M., Laurent, P., 2002. Fish gill morphology: inside out. Journal of 582
Experimental Zoology 293: 192-213.
Zaiss, M., Papadakis, I., Divanach, P., Maingot, E., Mylonas, C.C., 2006. Ontogeny of 584
the digestive tract in shi drum (Umbrina cirrrosa L.) reared using the mesocosm
larval rearing system. Aquaculture 260: 357-368.586
588

25
590
Table 1. Mean (± SEM) food conversion ratio (FCR = F / [Bf – Bi], where F =
consumed food, Bf = final biomass, Bi = initial biomass) of shi drum reared at different 592
salinities (4, 10 and 40 psu) in duplicated tanks (i.e., n = 2). Significant differences (P <
0.05) at different sampling points and over the whole course of the study between the 4 594
psu, and the 10 or 40 psu group are indicated by different letter superscripts next to the
mean values. Within each salinity treatment, there were no differences in FCR between 596
different sampling times (P = 0.19)
FCR598
Salinity 4 psu 10 psu 40 psu
Time period (d)600
0-14 3.39 ± 1.89a 1.78 ± 0.05a,b 1.29 ± 0.14b
15-28 3.32 ± 0.22a 1.13 ± 0.08b 1.06 ±0.05b602
29-42 1.36 ± 0.14 1.21 ± 0.14 1.25 ± 0.02
43-56 4.71 ± 2.20a 1.68 ± 0.26b 1.42 ± 0.02b604
57-70 1.28 ± 0.04 1.31 ± 0.21 1.12 ± 0.21
70-84 1.54 ± 0.26 1.54 ± 0.40 1.58 ± 0.68606
Whole duration (d)608
0-84 2.60 ± 0.53 a 1.44 ± 0.10 b 1.28 ± 0.10 b
610
26
Table 2. Mean (± SEM) plasma glucose (Glu), cholesterol (Chol) and triglycerides (Trig) of shi drum (n = 10) reared at different salinities (4,
10 and 40 psu), and sampled at different times after the onset of the experiment (0, 42 and 84 days). Different small letter superscripts indicate
significant differences (P < 0.05) between different sampling times within salinity treatments, while capital letter superscripts indicate
significant differences between different salinities within sampling time.615
4 psu 10 psu 40 psu
0 42 84 0 42 84 0 42 84
Glu
(mmol l-1)7.8 ± 0.7a 3.5 ± 0.2b 3.6 ± 0.1b 7.8 ± 0.7a 3.7 ± 0.2b 3.6 ± 0.2b 7.8 ± 0.7a 3.2 ± 0.1b 3.1 ± 0.1b
Chol
(mmol l-1)3.3 ± 0.2a 3.1 ± 0.2abA 2.6 ± 0.1bA 3.3 ± 0.2b 4.0 ± 0.1aB 3.2 ± 0.1bB 3.3 ± 0.2b 4.7 ± 0.4aB 3.3 ± 0.2aB
Trig
(mmol l-1)2.0 ± 0.1b 3.1 ± 0.3abA 4.3 ± 0.4aA 2.1 ± 0.1c 7.1 ± 1.1bC 10.4 ± 1.0aB 2.1 ± 0.1c 4.7 ± 0.5bB 9.5 ± 0.8aB

27
Table 3. Mean (± SEM) plasma osmolality, sodium (Na+), potassium (K+) and chloride (Cl-) of shi drum (n = 50 - 60) reared at different
salinities, and sampled at different times after the onset of the experiment (0, 42 and 84 days). Different small letter superscripts indicate
significant differences (P < 0.05) between different sampling times within salinity treatments, while capital letter superscripts indicate significant 620
differences between different salinities within sampling time.
4 psu 10 psu 40 psu
0 42 84 0 42 84 0 42 84
Osmolality
(mOsm kg-1)350 ± 3a 338 ± 2aA 410 ± 7b 350 ± 3a 355 ± 2aB 398 ± 5b 350 ± 3a 353 ± 1aB 409 ± 2b
Na+
(mmol l-1)196 ± 8 181 ± 5A 179 ± 5 196 ± 8 201 ± 5B 192 ± 3 196 ± 8 205 ± 8B 188 ± 6
K+
(mmol l-1)8.0 ± 0.3a 6.0 ± 0.2b 8.3 ± 0.3a 8.0 ± 0.3a 6.2 ± 0.3b 8.1 ± 0.4a 8.0 ± 0.3a 6.5 ± 0.3b 8.0 ± 0.2a
Cl-
(mmol l-1)161 ± 7a 145 ± 1a 197 ± 5b 161 ± 7a 158 ± 2a 188 ± 3a 161 ± 7a 156 ± 1a 196 ± 1b

28
Figure legends625
Figure 1. Changes in mean (± SEM) total length (A) and body weight (B) of shi drum (n
= 25 – 30) reared in duplicated tanks at different salinities (4, 10 and 40 psu) during a
period of 84 days. Reduction of salinity to 4 psu had a statistically significant effect on
growth over the whole course of the study (regression analysis, P < 0.05), as indicated by
different letter superscripts next to the growth curves. 630
Figure 2. Changes in mean (± SEM) gill Na+/K+ -ATPase specific activity in shi drum
(n = 10) reared at different salinities during a period of 84 days. Different small letter
superscripts indicate significant differences (P < 0.05) between different salinities within
a sampling date. There were no significant differences between sampling times.635
Figure 3. Number of chloride cells (mm-1 of gill filament) in shi drum (n = 5) reared at
different salinities (4, 10 and 40 psu) during a period of 84 days. Different capital letter
superscripts indicate significant differences (P < 0.05) between sampling times,
regardless of salinity. There were no significant differences between salinity treatments, 640
either at 42 or 84 days.
Figure 4. Histological sections of gill filaments (consisting of primary and secondary
lamellae) showing structural changes in the epithelium of shi drum reared at different
salinities. A: Gill filament of shi drum at the beginning of the experiment (reared at 38 645
psu). B: Gill filament of shi drum control fish reared 40 psu for 84 days. C: Gill
filament of shi drum reared at 4 psu for 84 days. Abbreviations: cc = chloride cell, mc =
mucus cell, pc = pavement cell, pl = primary lamella, sl = secondary lamella. Bars
represent 50 µm.
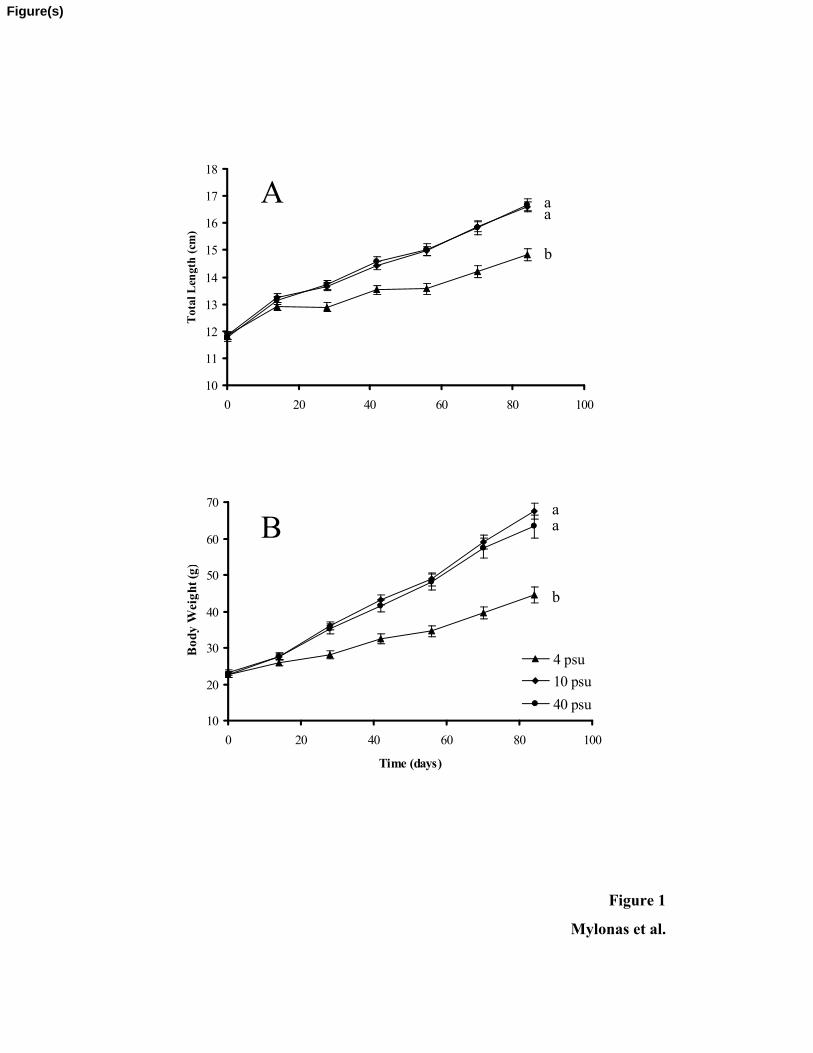
Figure 1
Mylonas et al.
10
11
12
13
14
15
16
17
18
0 20 40 60 80 100
Tot
al L
engt
h (
cm)
10
20
30
40
50
60
70
0 20 40 60 80 100
Time (days)
Bod
y W
eigh
t (g)
4 psu
10 psu
40 psu
B
A aa
b
a
b
a
Figure(s)

Figure 2
Mylonas et al.
0 42 840
0.4
0.8
1.2
1.6
2
Time (days)
4 psu 10 psu 40 psu
a
b b

Figure 3
Mylonas et al.
0 42 840
5
10
15
20
25
30
35
40
Time (days)
4 psu 10 psu 40 psu
A
B
C

sl
cc cc
pc
Figure 4
Mylonas et al.
AA BB CC
pl
sl
cc
cccc
cc mc
sl
plpl