Embed Size (px)
Citation preview
NATIONAL RADIO ASTRONOMY OBSERVATORY
GREEN BANK ) WEST VIRGINIA
ELECTRONICS DIVISION INTERNAL REPORT No. 184
REFLECTION MEASUREMENTS ON THE
140-FOOT AND 300-FOOT RADIOTELESCOPES
J. RICHARD FISHER
JANUARY 1978
NUMBER OF COPIES: 150
NATIONAL RADIO ASTRONOMY OBSERVATORY
REFLECTION MEASUREMENTS ON THE140-FOOT AND 300-FOOT RADIOTELESCOPES
J. Richard Fisher
Summary
A 3.3 GHz swept frequency reflectometer has been used at the prime focus of
the 140-foot and 300-foot telescopes to identify sources of reflection which
cause frequency dependent antenna gain and noise spectra on the scale of a few
MHz. This fine scale structure in the frequency domain of the antenna response
is in many cases the limiting factor in detection and measurement of microwave
spectral lines from cosmic radio sources.
Measurements on the 140-foot show that the primary sources of reflection
are the roof and miscellaneous metal on top of the Cassegrain radiometer house,
the Cassegrain feeds, the inner portion of the main reflector, and the circum-
ferential gaps between the panels in the main reflector. The 300-foot measure-
ments show a strong reflection from the center of the dish with at least three
multiple bounces between the main reflector and the focal cabin. Studies have
been made of several metalic spoiler surfaces, and some success has been had in
reducing the reflections on the 140-foot and in identifying sources of multiple
reflections on the 300-foot.
Wideband noise spectra have been measured with various NRAO radiometers
on the 140-foot, and qualitative agreement between these spectra and the re-
flectometer results has been obtained.
The mechanics of the reflectometer technique are gone into in some detail,
but later sections can be read without going into this detail.
2
Introduction
The problem of "baseline ripple" or "baseline curvature" has plagued
radio astronomical measurements since the first spectral line was discovered
in 1952, but because the causes have been many and complex they have not been
well understood. By "baseline" we mean the intensity of radiometer output as
a function of frequency in the absence of narrowband cosmic radiation. Gener-
ally the problem has been circumvented by subtracting reference spectra taken
under similar conditions at a spot in the sky not containing a radio emitter,
"fitting" the baseline with a polynominal, or moving the radiometer feed focal
position to phase-cancel dish reflections. These methods tend to waste observ-
ing time or lead to spurious results. Until a few years ago the roots of the
problem had been only randomly attacked.
Baseline problem causes are many: e.g., radiometer passband drift, tele-
scope RF cable mismatches, local oscillator leakage, frequency dependent re-
ceiver temperature, and reflections or standing waves in the telescope struc-
ture. The latter manifests itself in several ways by distorting the frequency
structure of ground radiation, the receiver noise itself, solar radiation in
the antenna sidelobes and continuum radiation from a source in the main beam.
Studying these various effects with standard radiometric spectrometers can be
very frustrating because of the long integration times involved and the diffi-
culty of disentangling the different effects. An interesting compendium of
baseline anomalies was recently written by Lockman and Rickard [1].
No one has yet succeeded in reasonably complete cancellation of prime
focus telescope reflections at more than a few isolated frequencies although
a fair number of internal observatory reports have been written on the subject.
Morris [2], [3] has written two mathematical treatments of telescope reflec-
tions. Reports and memos dealing mainly with observations of spectrometer
3
baselines and some trials of spoilers in the center of paraboloids are by
Weinreb [4], [5]; Padman [6], [7]; and Beiging and Pankonin [8]. Some other
reports which apparently pertain to the subject and have been referred to by
the above authors are written by Morris [9]; Poulton [10], [12]; Padman [11];
and Gardner [13]; but I have not seen any of these reports. Experimental
radiometric work has been done at the secondary focus of two-reflector tele-
scopes by Wilson and Hills [14] and Ulich [15] with the latter having success
at canceling secondary mirror reflections near 100 GHz with a controlled re-
flector plate.
In an attempt to unravel various telescope reflections Morris and Beiging
[16], [17] and we have been making swept frequency reflectometer measurements
from the prime focus of our respective telescopes. This report outlines the
work at the NRAO and makes a few comparisons with the 100-meter results at
the M.P.I.f.R.
The Measurement Technique
The purpose of swept frequency reflectometry is to separate reflections
occurring at different distances from the signal source. This is done by
transmitting a CW signal and measuring the amplitude and phase with respect
to the source of the returned wave over a reasonably wide band of frequencies.
The Fourier transform of this amplitude and phase versus frequency is
then a function of return amplitude versus distance from the source. The
basic principle is that the farther a reflection is from the source the faster
the phase of its returned wave will change with frequency. Descriptions of
this technique as applied to waveguide measurements are given by Holloway [18]
and Somlo [19] among others, and its application dates back at least to 1925
in ionospheric measurements cf. Appleton and Barnett [20]). As far as I know
4
the first application to radio astronomy antennas was at the M.P.I.f.R. in
Bonn [16], [17].
The test setup used in this study is shown in Figure 1. Instead of
directly measuring the phase of the returned wave it is added to a sample of
the outgoing wave,and the voltage vector sum is measured. After subtraction
of a DC term this is equivalent to measuring the cosine component of the com-
plex return wave voltage. For this purpose the sine component is redundant.
The data acquisition and reduction is controlled by an HP 9825A desktop
calculator. It feeds a BCD encoded frequency to the NRAO universal local os-
cillator (ULO) consisting of an HP 5105A 0-500 MHz synthesizer and a X4 fre-
quency multiplier. This in turn sends an L-band signal to the prime focus
box where it is amplified, frequency doubled, and amplified to be fed into a
dual directional coupler type reflectometer and then to a wideband corrugated
horn (return loss and beamshapes shown in Figure 2). The outgoing wave di-
rectional coupler pickup is sent to a level detector to keep the transmitted
amplitude constant and to a hybrid for addition to the return voltage. The
linear sum is rectified by a square law detector and sent down the telescope
on a shielded pair cable to an integrating type digital voltmeter. The calcu-
lator reads and stores the DVM output (typically 1 second integration) and
then sets a new frequency.
To start a measurement run the total bandwidth, number of sample points,
starting frequency and high pass data filter distance are keyed into the cal-
culator. It then collects the amplitude vs. frequency data and stores them
in internal memory. The square roots of the DVM readings are taken to convert
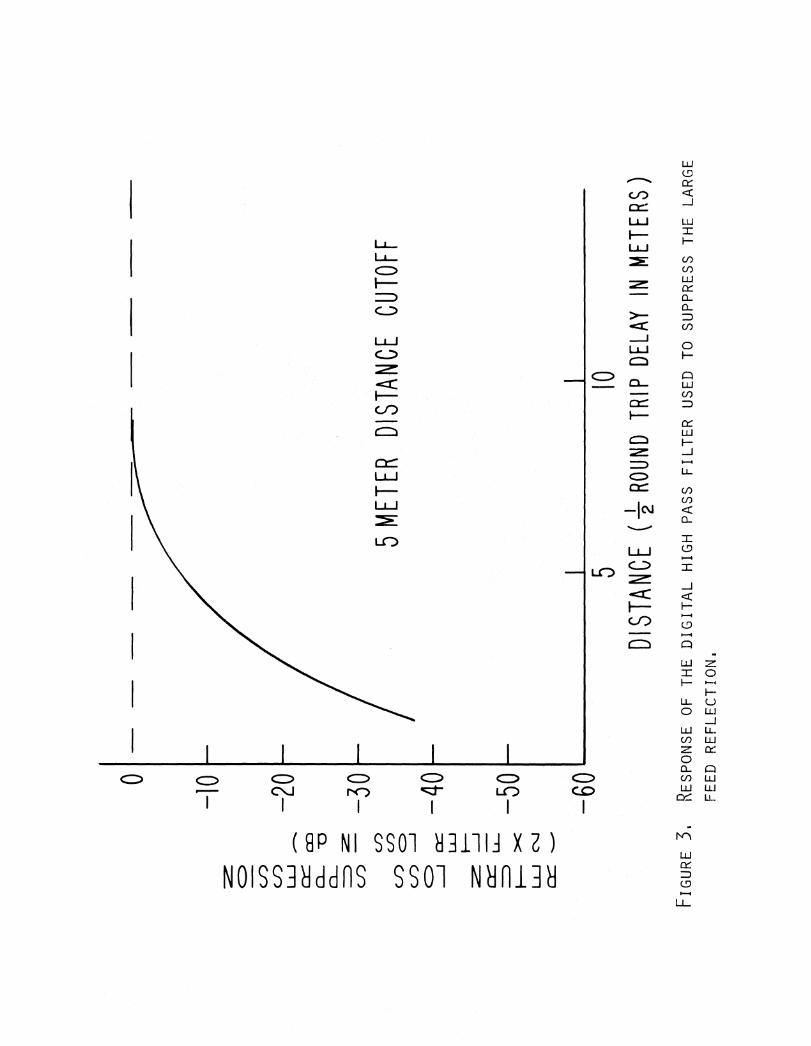
them to amplitudes, and then they are passed through a digital high pass filter
to attenuate the large return from the feed. To eliminate end effects of the
filter process, data are taken beyond either end of the desired bandwidth.
5
The digital high pass actually consists of a truncated error function-sinc
product low pass represented by
sin 7X exp [(- n (x/2)2
7X
+2
x = -2
convolved with the data, and the result is subtracted from the original data.
Figure 3 shows the cutoff characteristics of this filter. The filtered data
are plotted on the X-Y plotter for inspection, and the calculator then proceeds
with the transform.
Before performing the Fourier transform the data are weighted with a half
cycle of a sine function with zeros at either end of the frequency range to
reduce the transform sidelobes. The transform algorithm is adapted from a
FORTRAN version by Brenner [21].
A Fourier transform of N real unsymmetric data points produces N/2 + 1
power spectrum points with minimum sampling in the frequency and distance or
delay domains. Hence, 256 data points give 129 return power versus distance
points. However, with minimum sampling density the power spectra are a bit
difficult to interpret by eye because depending on the exact distance of the
reflection the return power can either appear all in one data point or be dis-
tributed between two adjacent points each being smaller in amplitude than the
single point. This makes the reflection amplitude appear to bob up and down
with small distance changes so I elected to over sample in the distance co-
ordinate by factor of two. This is wasteful of computer storage space because
a number of zeros equal to the number of data points must be added to the data
field making the transform twice as large, but there was still room in the
calculator for a 257 point (129 minimum sampling) output spectrum which was
sufficient for most purposes. With 256 non-zero data points the transform took
6
about 50 seconds. Toward the end of the reported measurements the calculator
memory was doubled so 512 point output spectra were available on the last 300-
foot run.
Figure 4 shows the 256-point "instrumental profile" with sine function
data weighting for a reflection unresolved in distance. In the actual measure-
ments the sidelobes tend to be lower because most reflections are partially re-
solved. It will also be seen that in the presence of several very strong reflec-
tions the large-distance background noise can get quite strong (as much as -20
dB relative to the main signals). This may be due to slight nonlinearities in
the detector system causing intermodulation of the various signals.
Note in Figure 4 as in all succeeding spectra that the vertical scale is
logarithmic with a nonlinearity on the bottom end. Since a log scale is un-
bounded a small arbitrary quantity was added to all power values. Above about
-80 dB the scale is essentially constant. Keep in mind also that in a dis-
crete transform it is generally assumed that no reflections exist beyond the
largest displayed distance. If they do they will alias back into the spec-
trum and cause confusion. This can be a problem with multiple reflections on
the telescope.
Calibrations
Return loss intensity calibrations rely on the nominal values of at-
tenuators and coupling coefficients of the components in Figure 1. The over-
all calibration accuracy should be about ± 2 dB, and it was felt that more
accuracy than this was not necessary. Back of the envelope calculations of
the expected return from a 1 meter diameter flat test reflector agreed with
the measured value to within a few dB.
7
Because the phase reference in the reflectometer is not at the phase
center of the feed the computed distances are not the distances from the feed.
The distance offset was measured to be 0.5 ± 0.1 meters with a flat calibra-
tion reflector at a known distance. This offset must be subtracted from the
distances shown on the figures to follow to get the true feed-reflector dis-
tance.
! iaJe
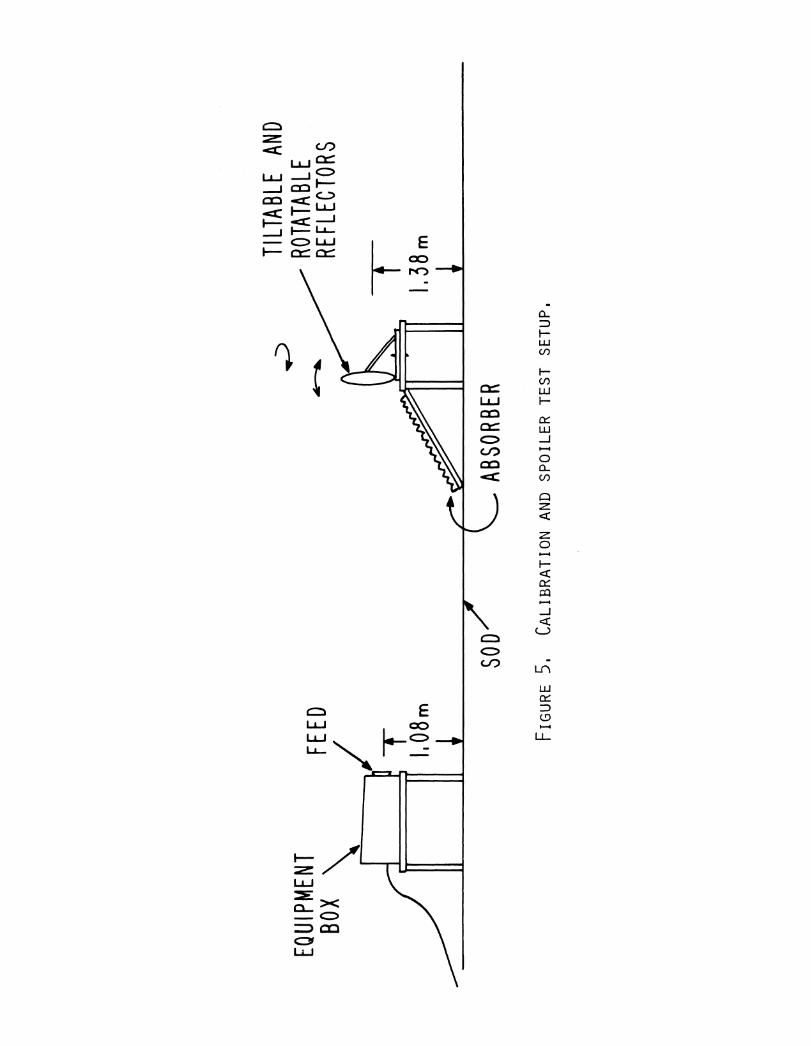
In addition to calibration tests a considerable number of reflection
trials with the system were made on the ground before putting the device on
the telescope both to get a feel for the vagaries of the system and to try
several methods of spoiling reflections. The test configuration is shown in
Figure 5.
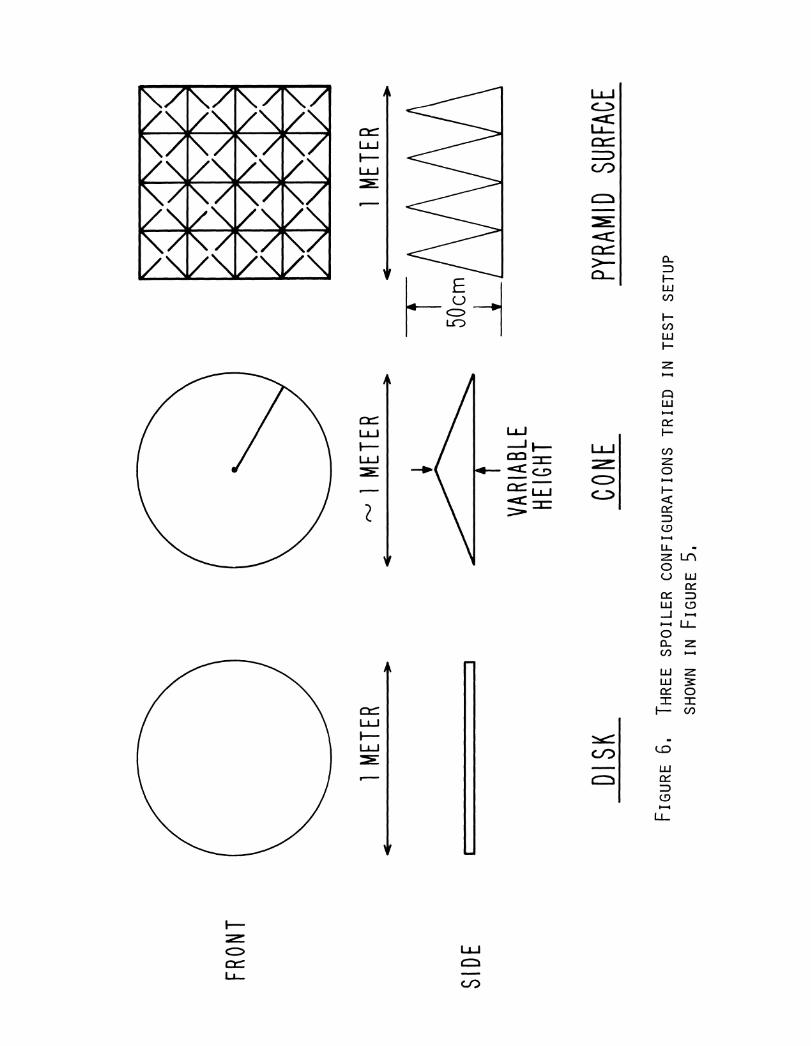
Three basic spoiler configurations were tried: a flat disk, a cone, and
a steep-sided multipyramid surface (Figure 6). As shown in Figure 5 each was
mounted on a rotatable platform and return loss was measured as a function of
angle with respect to the feed-reflector line. The tilt and rotation of the
flat disk were adjusted for maximum reflected power and its return loss was
used as a reference. The results are shown in Figures 7, 8, and 9.
It is clear that the smallest return is obtained from the tilted disk.
This seems reasonable since this reflector has a smooth phase variation of
currents on its surface,and no edges are along constant phase lines. I sus-
pect that a tilted square at the same angle would cause a higher reflection
than the disk if two of its edges were nearly perpendicular to the feed-
reflector line.
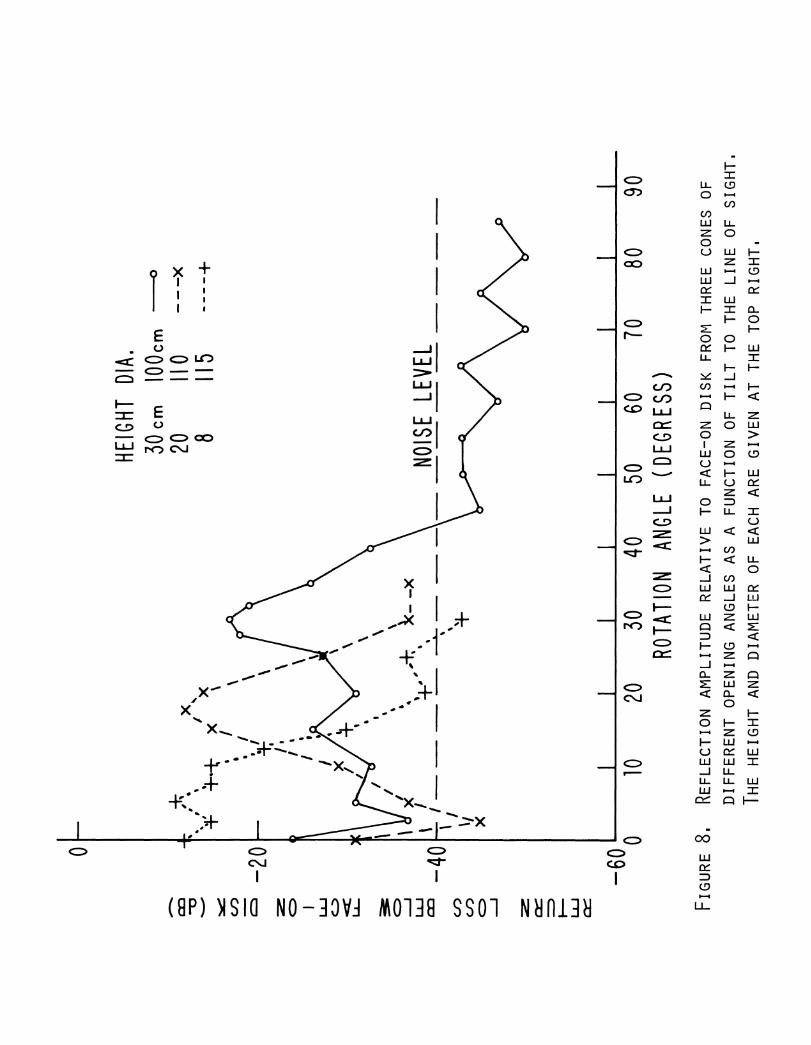
Three cone opening angles were tried as seen in Figure 8. The angle was
changed by overlapping adjacent sectors of a sheet metal disk, so as the height
8
of the cone increased the projected diameter decreased, but this should not
affect the general conclusions to be drawn from Figure 8. The steeper cones
have a smaller return when face-on, but rise to a maximum when one side becomes
perpendicular to the line of sight. Return loss at very large rotation angles
are similar to those for the disk. The main disadvantage of the face-on cone
is that the outer edge is a discontinuity along a constant phase line.
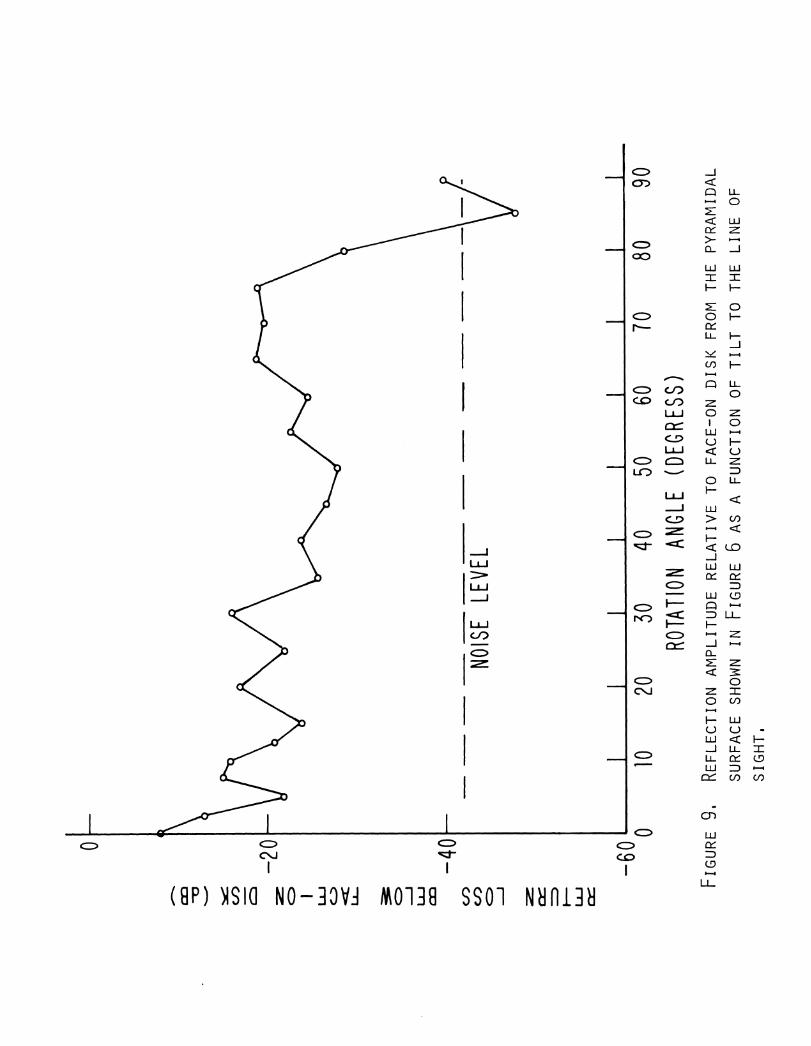
The pyramidal surface is the poorest spoiler of the three. The configu-
ration tried was a rather periodic surface, so the surface current phases were
not well randomized. The return from a perfectly isotropic scatterer of one
meter cross section would be about 30 dB below the face-on disk.
Some generalizations about good spoilers might be as follows: (1) Smooth
surfaces are better than irregular ones as long as none of the surface is
nearly perpendicular to the line of sight. (2) Discontinuities in the surface
(edges, bends, cracks) should not follow lines of constant phase for long dis-
tances. (3) Long, slender reflectors should have their long dimension tilted
away from the source. I suspect that if the long dimension is perpendicular to
the line of sight and the short dimension is smaller than a wavelength (e.g., a
pipe) changing the short dimension cross sectional shape will not substantially
change the reflection intensity. It might be better to cover a narrow object
with a large flat reflector with no edges perpendicular to the line of sight.
During the tests with the flat, 1-meter disk the reflection properties of
the equipment box itself (a standard NRAO prime focus box) were tested by look-
ing for a double bounce return (feed-reflector-box-reflector-feed path). At a
reflector distance of 10 meters from the face-on disk the double bounce was
25 dB below the first return which had a 47 dB return loss. The double bounces
were easily eliminated by covering the sections of the box which were parallel
to the reflector with absorber. Reflections from the feed itself were not
strong enough to be measurable.
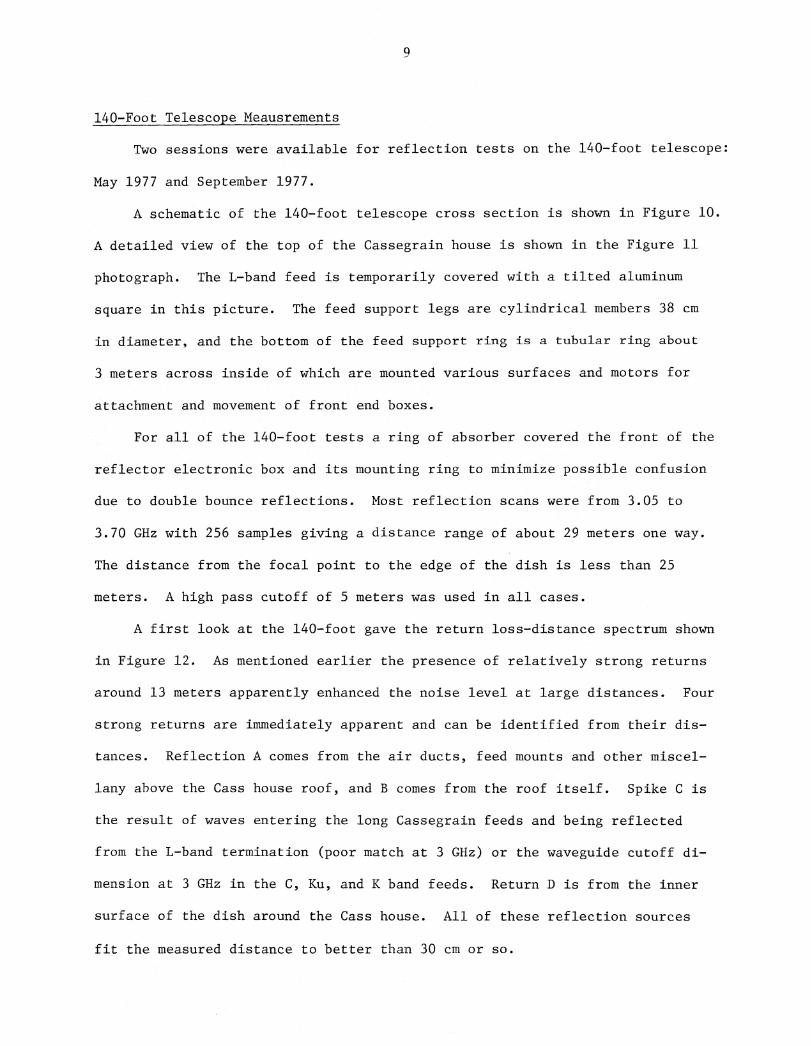
140-Foot Telescope Meausrements
Two sessions were available for reflection tests on the 140-foot telescope:
May 1977 and September 1977.
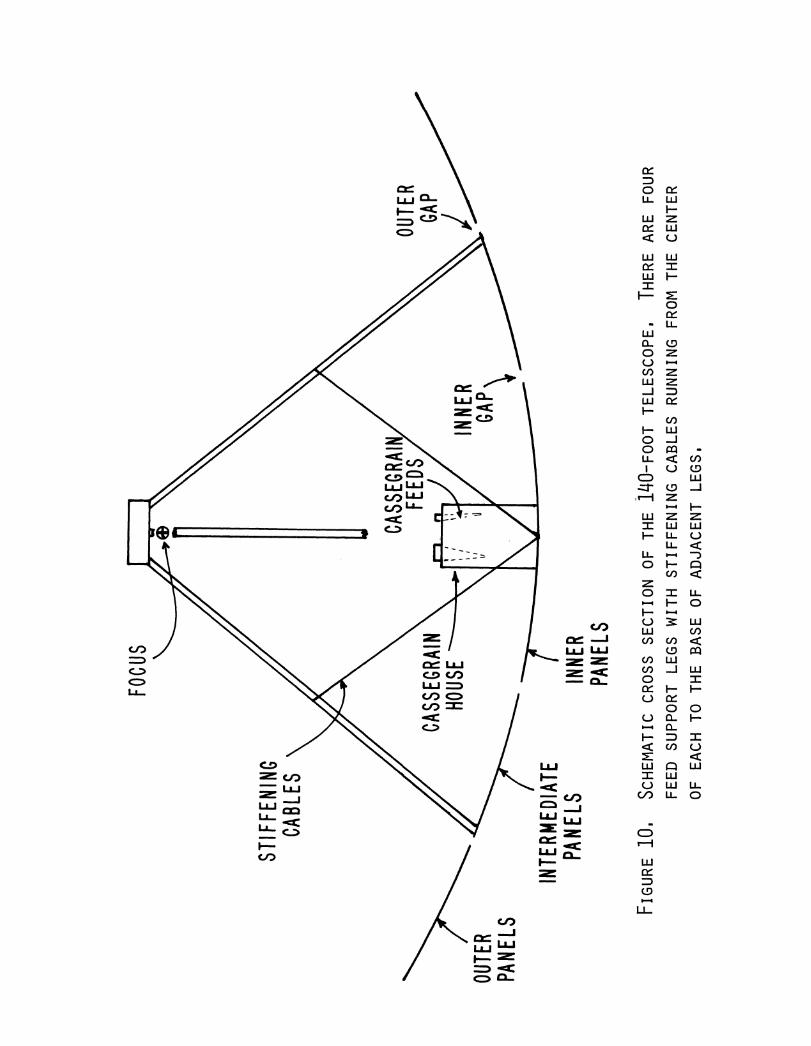
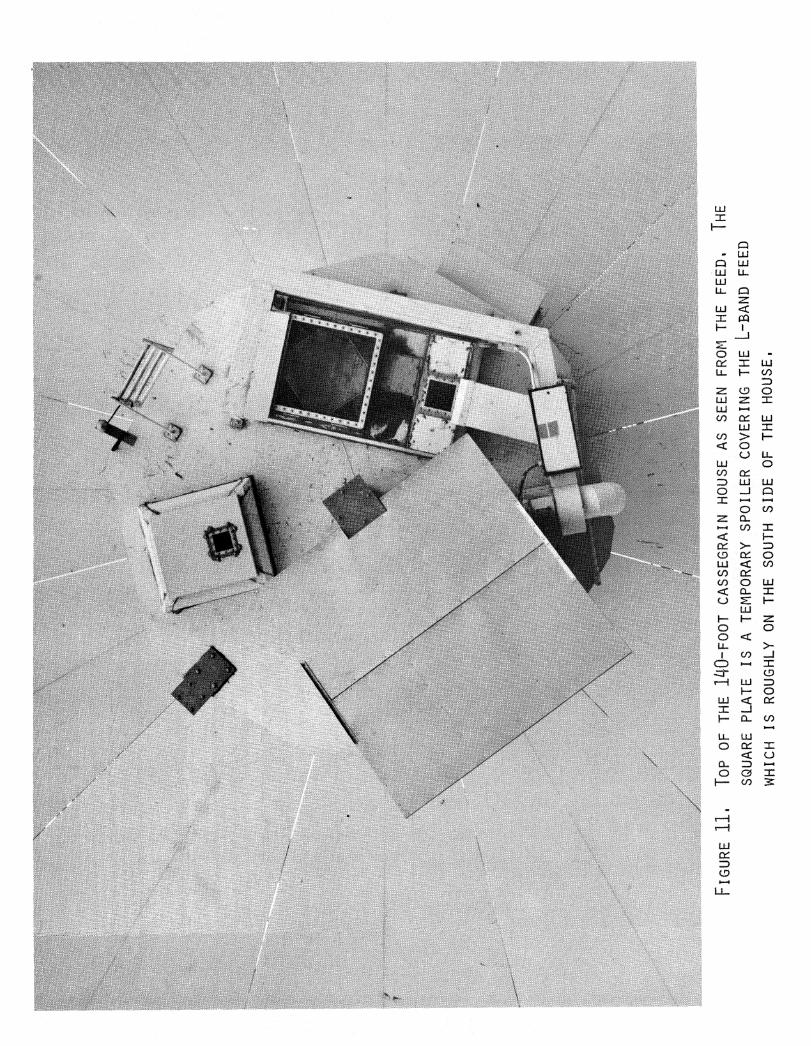
A schematic of the 140-foot telescope cross section is shown in Figure 10.
A detailed view of the top of the Cassegrain house is shown in the Figure 11
photograph. The L-band feed is temporarily covered with a tilted aluminum
square in this picture. The feed support legs are cylindrical members 38 cm
in diameter, and the bottom of the feed support ring is a tubular ring about
3 meters across inside of which are mounted various surfaces and motors for
attachment and movement of front end boxes.
For all of the 140-foot tests a ring of absorber covered the front of the
reflector electronic box and its mounting ring to minimize possible confusion
due to double bounce reflections. Most reflection scans were from 3.05 to
3.70 GHz with 256 samples giving a distance range of about 29 meters one way.
The distance from the focal point to the edge of the dish is less than 25
meters. A high pass cutoff of 5 meters was used in all cases.
A first look at the 140-foot gave the return loss-distance spectrum shown
in Figure 12. As mentioned earlier the presence of relatively strong returns
around 13 meters apparently enhanced the noise level at large distances. Four
strong returns are immediately apparent and can be identified from their dis-
tances. Reflection A comes from the air ducts, feed mounts and other miscel-
lany above the Cass house roof, and B comes from the roof itself. Spike C is
the result of waves entering the long Cassegrain feeds and being reflected
from the L-band termination (poor match at 3 GHz) or the waveguide cutoff di-
mension at 3 GHz in the C, Ku, and K band feeds. Return D is from the inner
surface of the dish around the Cass house. All of these reflection sources
fit the measured distance to better than 30 cm or so.
10
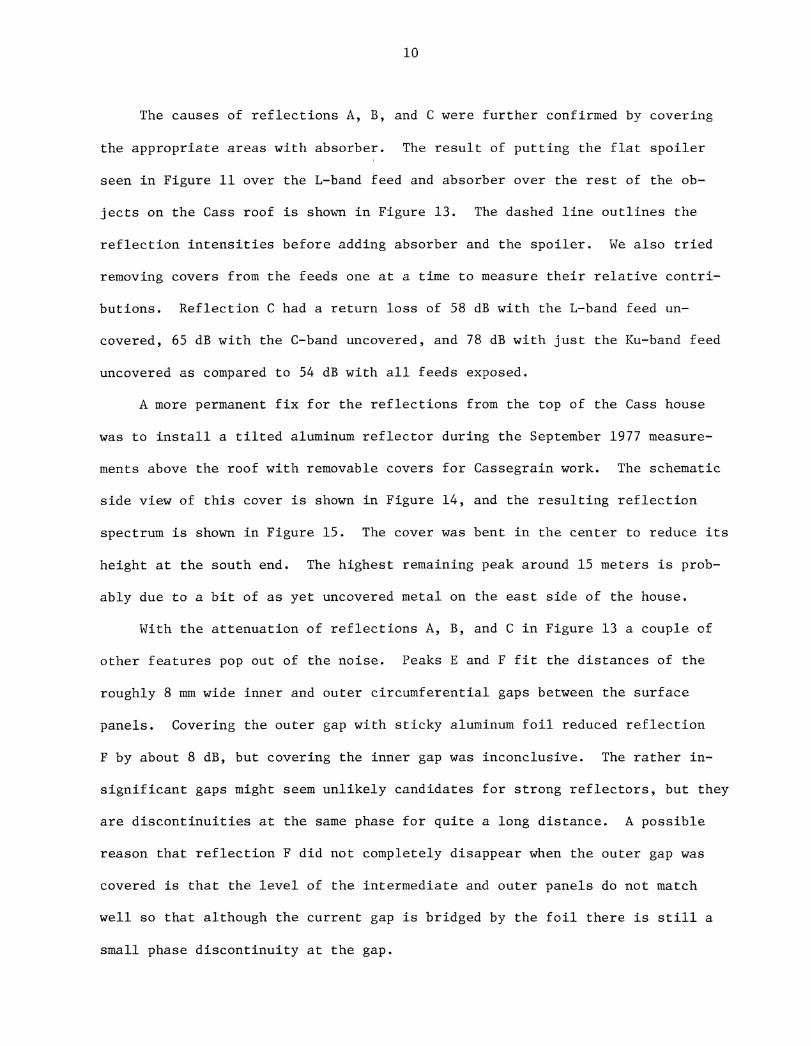
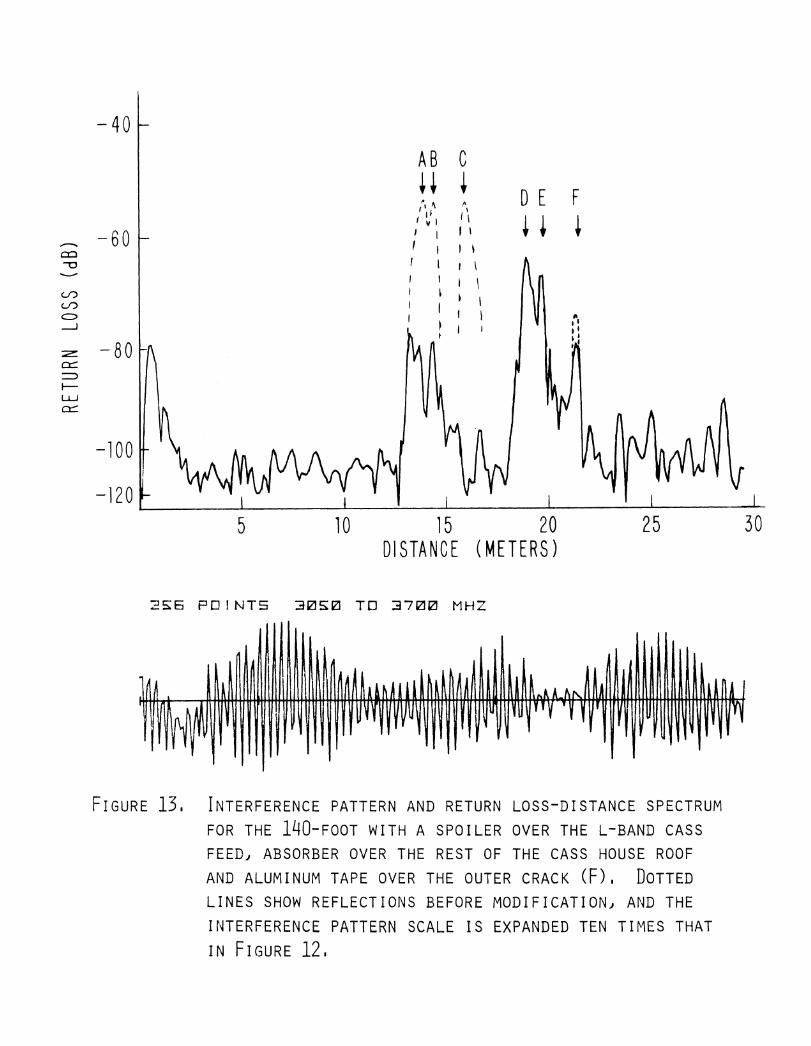
The causes of reflections A, B, and C were further confirmed by covering
the appropriate areas with absorber. The result of putting the flat spoiler
seen in Figure 11 over the L-band feed and absorber over the rest of the ob-
jects on the Cass roof is shown in Figure 13. The dashed line outlines the
reflection intensities before adding absorber and the spoiler. We also tried
removing covers from the feeds one at a time to measure their relative contri-
butions. Reflection C had a return loss of 58 dB with the L-band feed un-
covered, 65 dB with the C-band uncovered, and 78 dB with just the Ku-band feed
uncovered as compared to 54 dB with all feeds exposed.
A more permanent fix for the reflections from the top of the Cass house
was to install a tilted aluminum reflector during the September 1977 measure-
ments above the roof with removable covers for Cassegrain work. The schematic
side view of this cover is shown in Figure 14, and the resulting reflection
spectrum is shown in Figure 15. The cover was bent in the center to reduce its
height at the south end. The highest remaining peak around 15 meters is prob-
ably due to a bit of as yet uncovered metal on the east side of the house.
With the attenuation of reflections A, B, and C in Figure 13 a couple of
other features pop out of the noise. Peaks E and F fit the distances of the
roughly 8 mm wide inner and outer circumferential gaps between the surface
panels. Covering the outer gap with sticky aluminum foil reduced reflection
F by about 8 dB, but covering the inner gap was inconclusive. The rather in-
significant gaps might seem unlikely candidates for strong reflectors, but they
are discontinuities at the same phase for quite a long distance. A possible
reason that reflection F did not completely disappear when the outer gap was
covered is that the level of the intermediate and outer panels do not match
well so that although the current gap is bridged by the foil there is still a
small phase discontinuity at the gap.

11
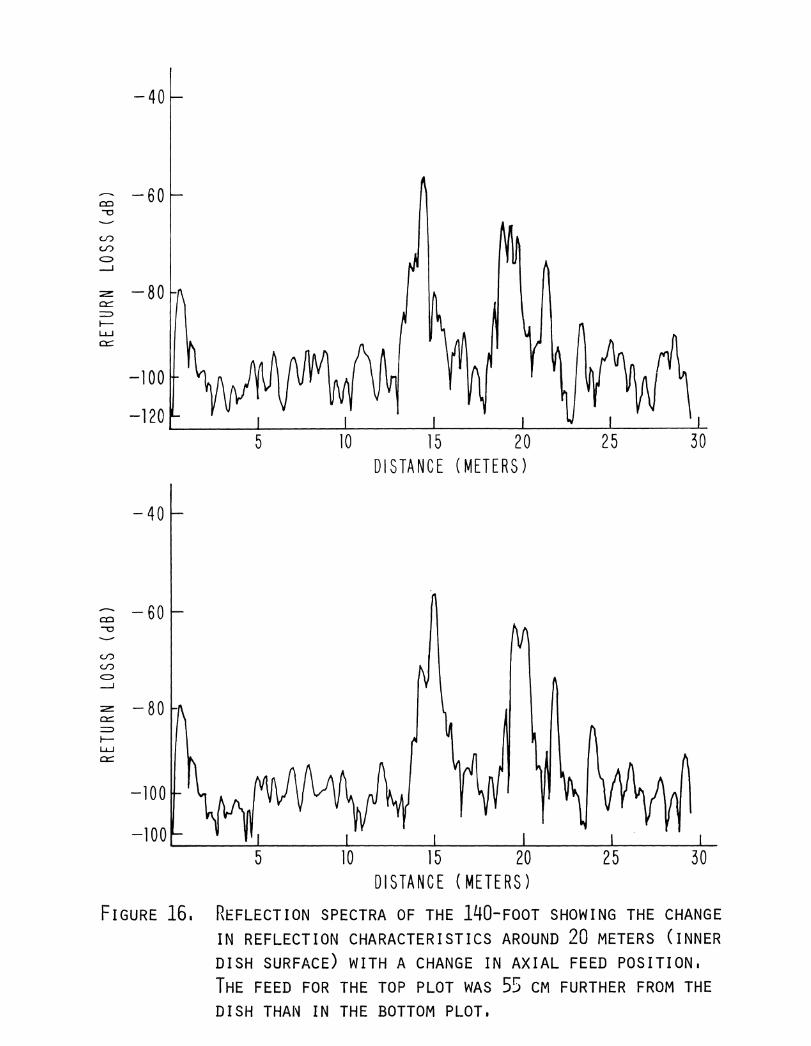
The reflection zone around D and E is a muddled one. The phase error
pattern on the inner portion of the dish produced by diffraction around the
Cass house roof is probably a complicated one, and the situation is not helped
by the inner gap. The individual peaks in this distance region are not easily
interpreted. Figure 16 shows the effect of changing the axial position of the
transmitting feed by 55 cm. In one case there are two peaks at approximately
-64 dB and in the other there are three peaks around -68 dB. I do not believe
this effect can be due to interaction of the sidelobes of two reflections, but
it is difficult to rule out Many of the reflection peaks seen on the 100-
meter telescope by Morris and Bieging were interpreted as involving reflec-
tions from the feed support sturcture onto the dish surface and back to the
feed. Such effects could be involved in the reflection complex around peaks
D and E although the 140-foot feed supports are not nearly as massive as those
on the 100-meter dish.
In any event reducing the reflections from the inner surface of the dish
over a wide range of frequencies is not easy. Even if the full set of inner
panels and the Cass house were removed the reflection at the distance of the
inner gap would be as strong as the present inner panel reflection because of
the discontinuity at the inner edge of the intermediate panels. The reason a
reflection is not seen from the outer edge of the dish is that the illumina-
tion is down by about 17 dB which reduces the reflection by 34 dB and puts it
in the noise. One could imagine putting a jagged spoiler in the center of
the dish so that the edge of the "hole" is not along a constant phase line,
but to do a proper job of tapering the hole at 21 cm the spoiler would cover
a large portion of the center of the aperture.
One solution to the inner surface reflections is to tune them out at the
frequency being used at any given time. This requires a controllable reflector

12
near the center of the dish to create a return equal in amplitude and out of
phase with the dish reflection. A reasonably good cancellation can probably
be realized over a 50 MHz bandwidth. This bandwidth is limited by the fact
that the inner surface reflections are spread over about one meter in dis-
tance. The amplitude of the compensating reflection could be controlled
either by changing the size of the reflector, or having two reflectors which
partially cancel one another by putting them partially out of phase. The
latter would be mechanically easier to implement.
Some experimenting with manually adjusted reflectors was done in Septem-
ber 1977. The main result was to find that, even for two people, adjusting
these plates from the surface of the dish is extremely tedious. Some sort of
remote control from the control room will have to be devised. We also looked
at the phase of the reflected wave pattern from the dish itself as a function
of telescope position. To within an accuracy of about 200 at 3 GHz the phase
did not vary as the telescope was moved from zenith to horizon. This indi-
cates that reflector adjustments would not need to be made often during an
observing run at one frequency.
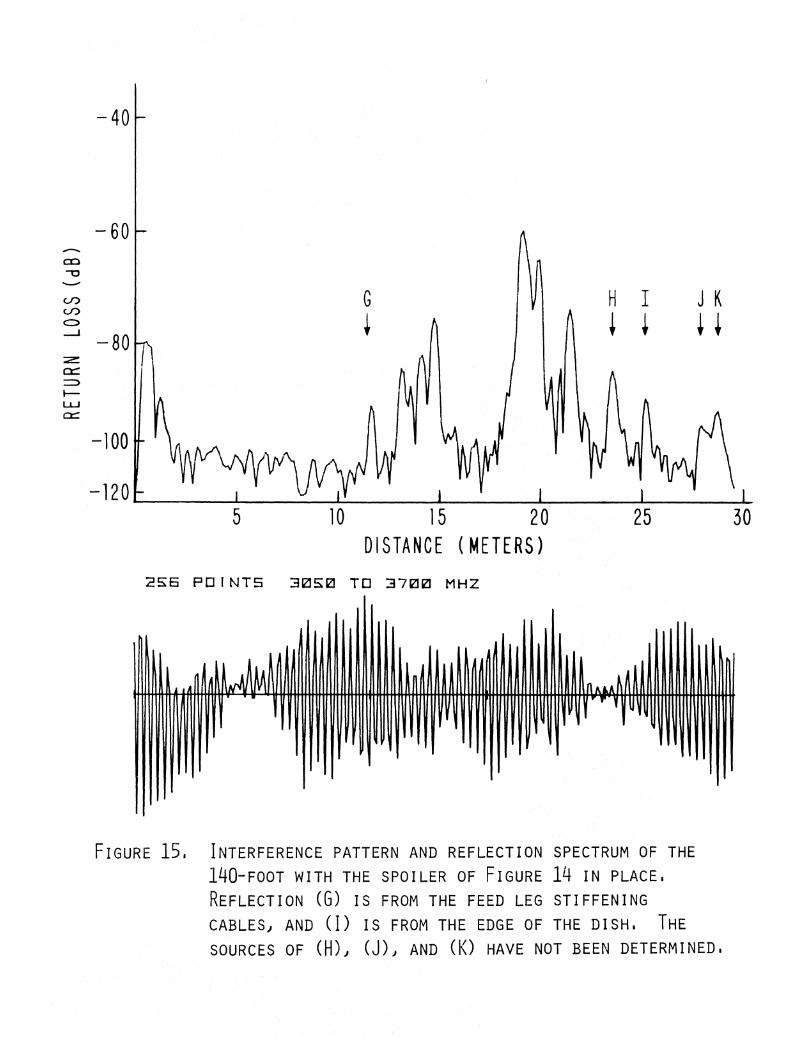
With the reduction of some of the stronger reflections a few more weak
returns become apparent in Figure 15. Reflection G is from the stiffening
cables near their attachment point at the mid-point of the feed support legs.
This was verified by changing the axial position of the feed by 90 cm and see-
ing that the distance change of peak G was only about 70 cm which is consist-
ent with the cosine of the angle of the feed support legs (34°). It is a bit
curious that this reflection was not seen earlier such as in Figure 13, but
this may be a good example of how careful one must be in interpreting sig-
nals near the noise threshold.
13
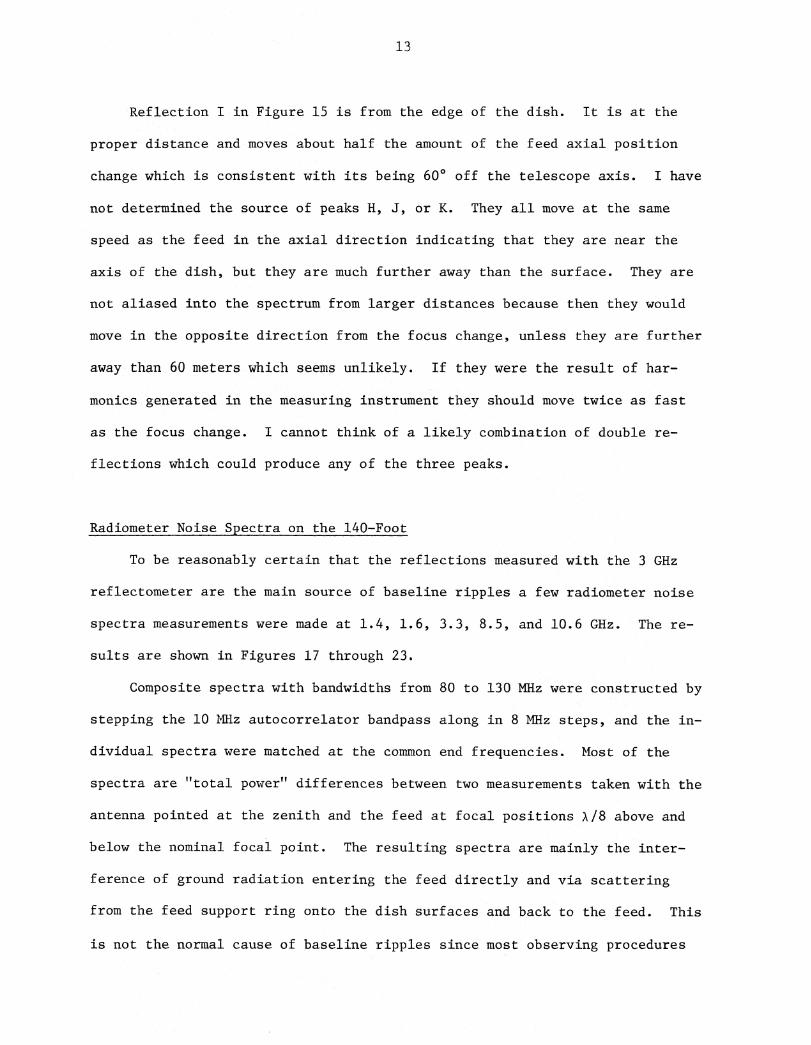
Reflection I in Figure 15 is from the edge of the dish. It is at the
proper distance and moves about half the amount of the feed axial position
change which is consistent with its being 60 0 off the telescope axis. I have
not determined the source of peaks H, J, or K. They all move at the same
speed as the feed in the axial direction indicating that they are near the
axis of the dish, but they are much further away than the surface. They are
not aliased into the spectrum from larger distances because then they would
move in the opposite direction from the focus change, unless they are further
away than 60 meters which seems unlikely. If they were the result of har-
monics generated in the measuring instrument they should move twice as fast
as the focus change. I cannot think of a likely combination of double re-
flections which could produce any of the three peaks.
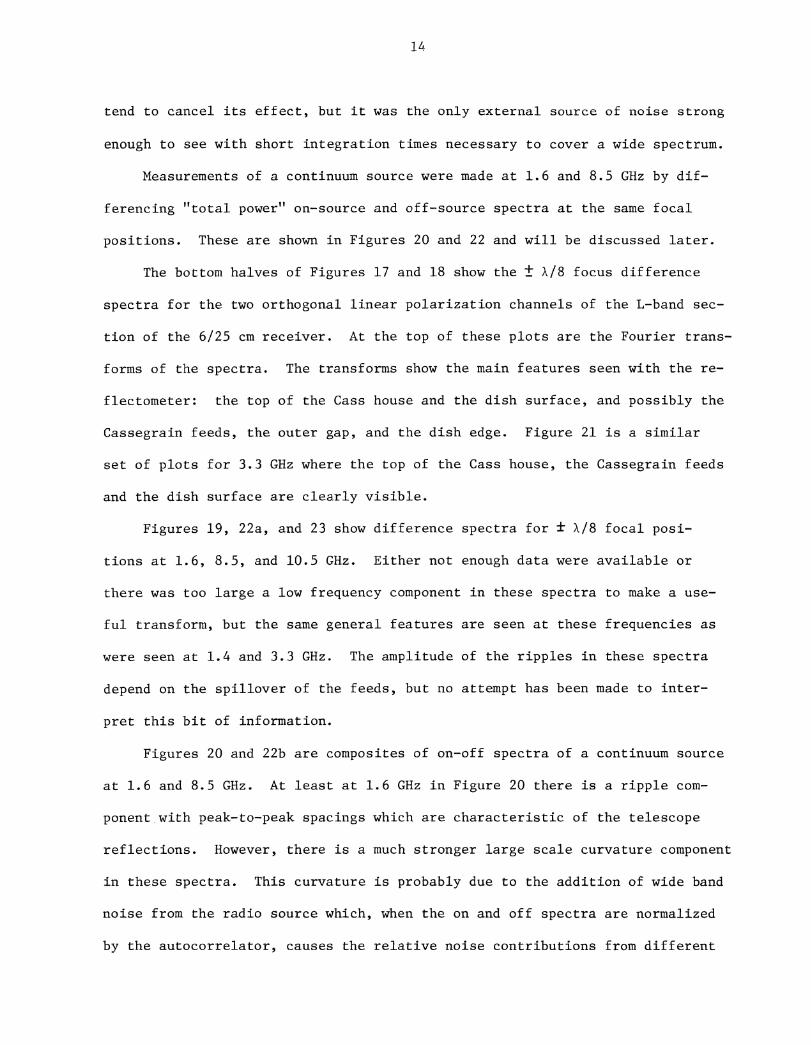
Radiometer Noise Spectra on the 140-Foot
To be reasonably certain that the reflections measured with the 3 GHz
reflectometer are the main source of baseline ripples a few radiometer noise
spectra measurements were made at 1.4, 1.6, 3.3, 8.5, and 10.6 GHz. The re-
sults are shown in Figures 17 through 23.
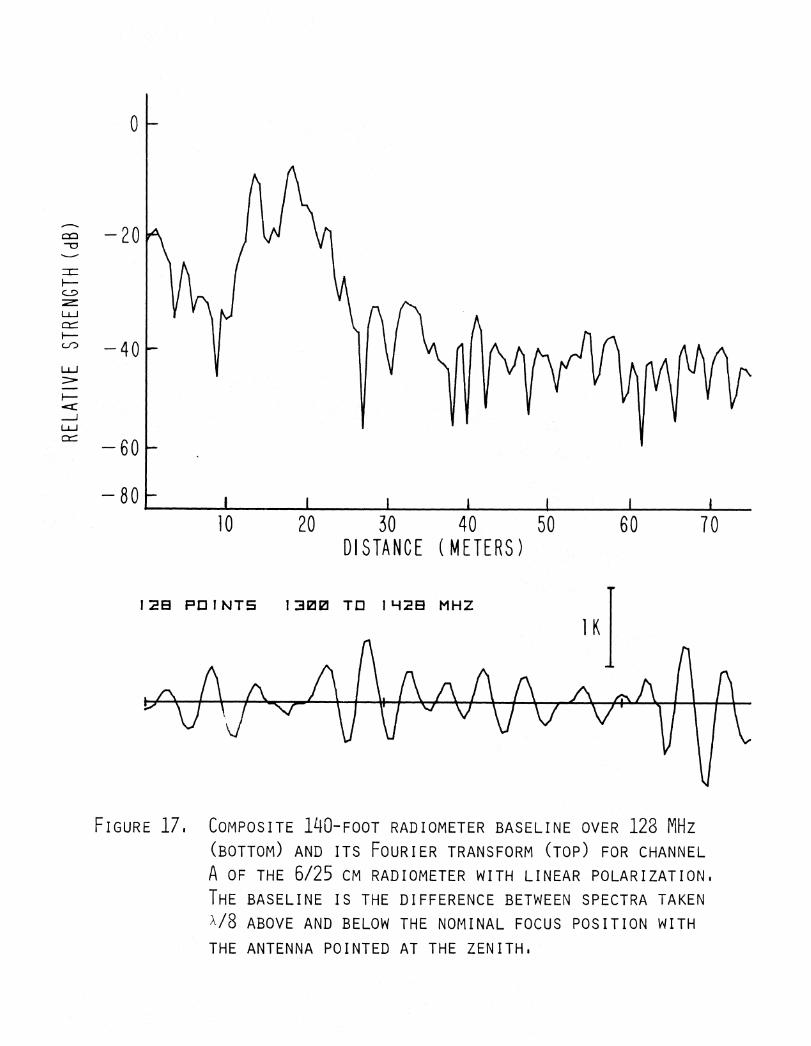
Composite spectra with bandwidths from 80 to 130 MHz were constructed by
stepping the 10 MHz autocorrelator bandpass along in 8 MHz steps, and the in-
dividual spectra were matched at the common end frequencies. Most of the
spectra are "total power" differences between two measurements taken with the
antenna pointed at the zenith and the feed at focal positions A/8 above and
below the nominal focal point. The resulting spectra are mainly the inter-
ference of ground radiation entering the feed directly and via scattering
from the feed support ring onto the dish surfaces and back to the feed. This
is not the normal cause of baseline ripples since most observing procedures
14
tend to cancel its effect, but it was the only external source of noise strong
enough to see with short integration times necessary to cover a wide spectrum.
Measurements of a continuum source were made at 1.6 and 8.5 GHz by dif-
ferencing "total power" on-source and off-source spectra at the same focal
positions. These are shown in Figures 20 and 22 and will be discussed later.
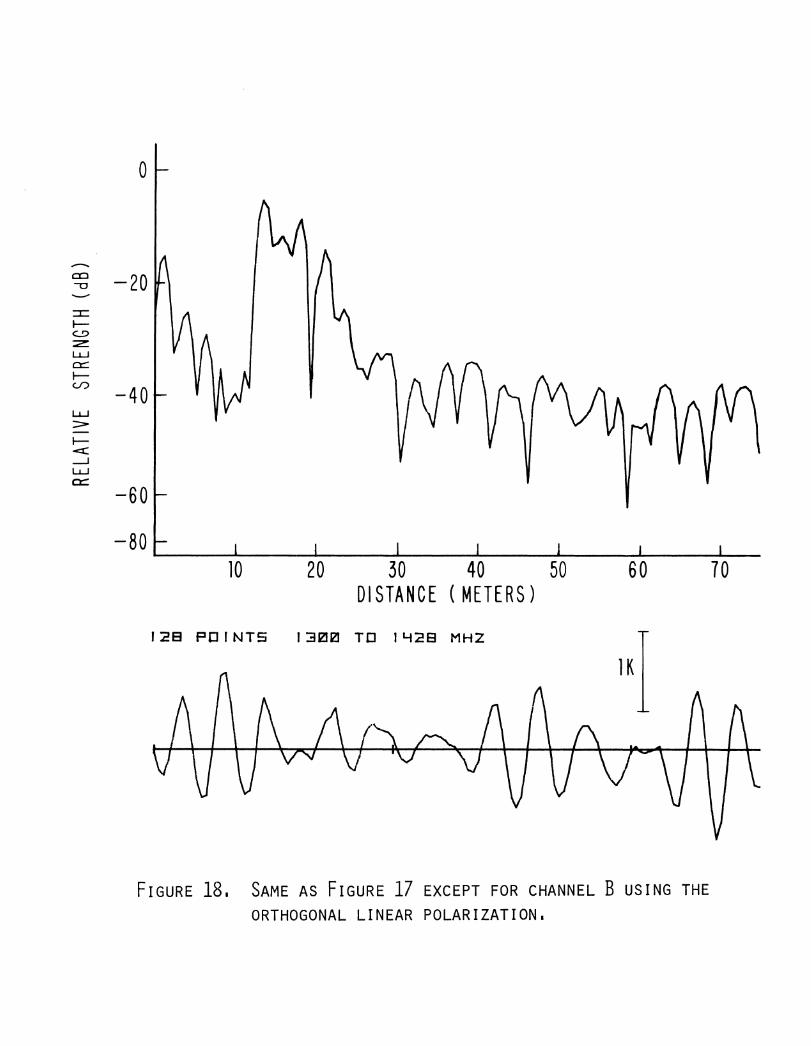
The bottom halves of Figures 17 and 18 show the ± 1/8 focus difference
spectra for the two orthogonal linear polarization channels of the L-band sec-
tion of the 6/25 cm receiver. At the top of these plots are the Fourier trans-
forms of the spectra. The transforms show the main features seen with the re-
flectometer: the top of the Cass house and the dish surface, and possibly the
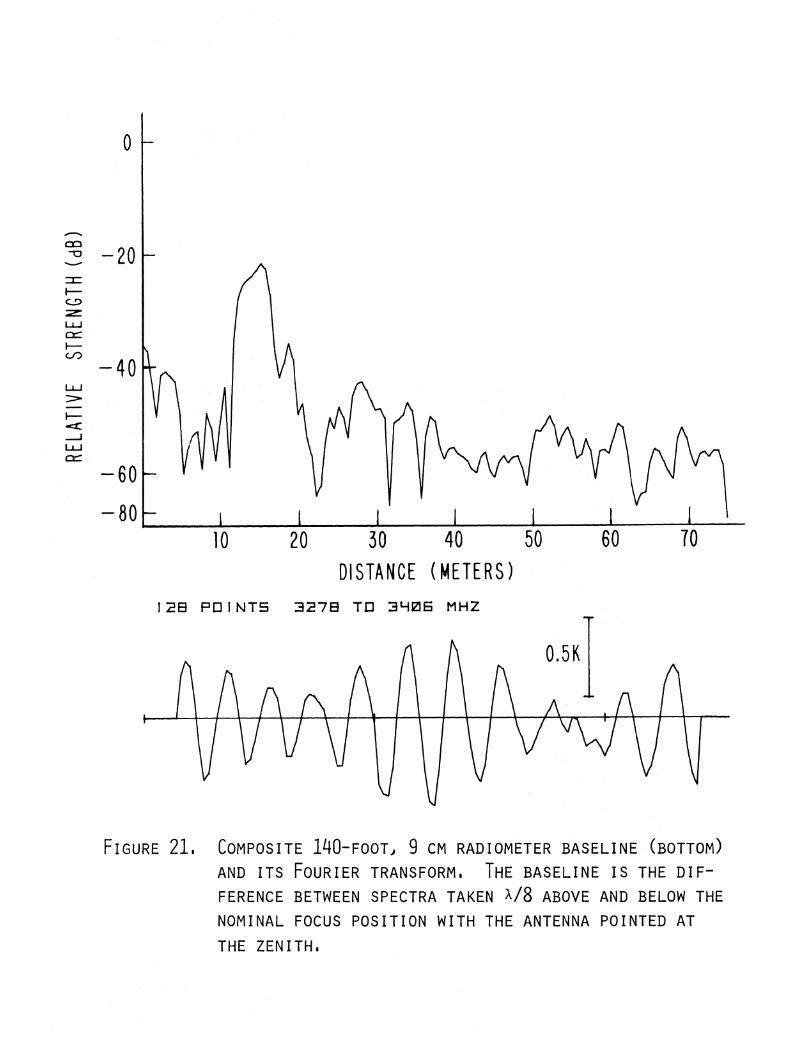
Cassegrain feeds, the outer gap, and the dish edge. Figure 21 is a similar
set of plots for 3.3 GHz where the top of the Cass house, the Cassegrain feeds
and the dish surface are clearly visible.
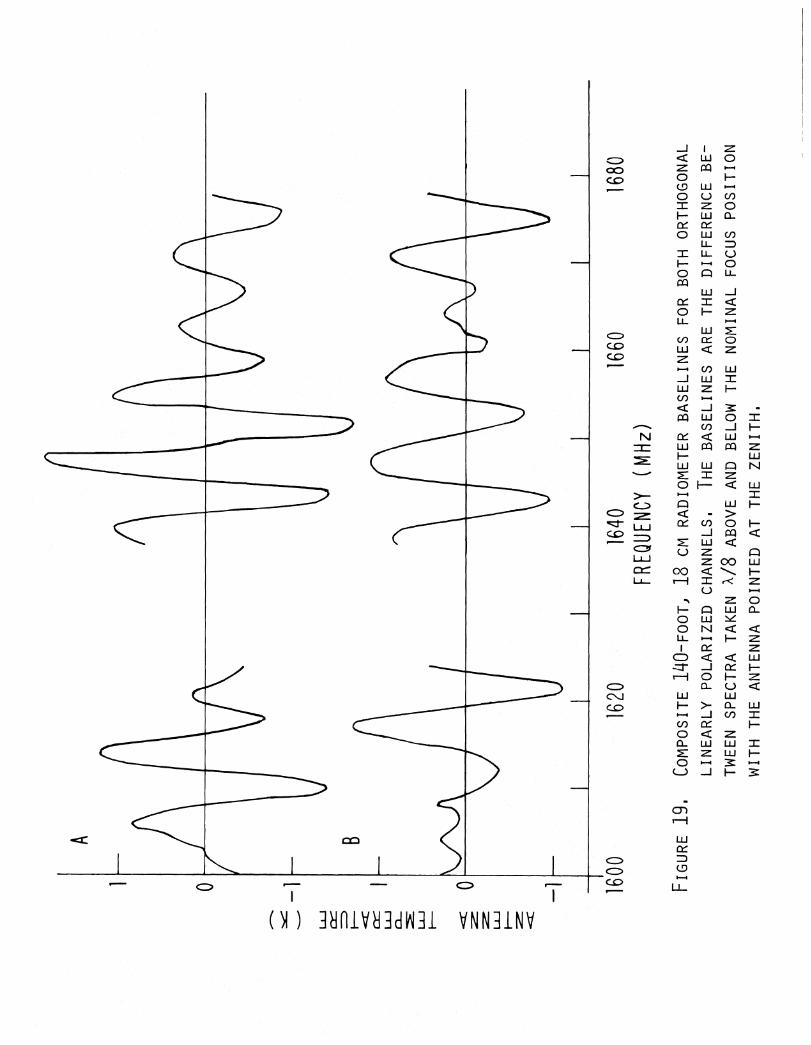
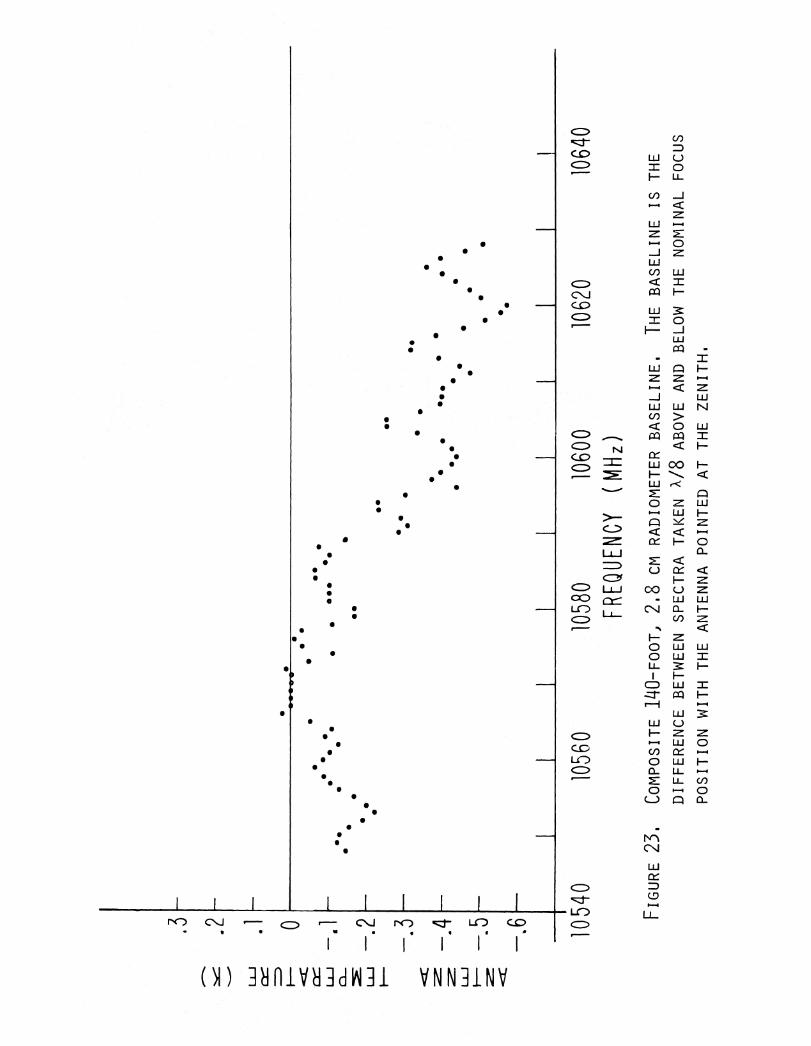
Figures 19, 22a, and 23 show difference spectra for ± 1/8 focal posi-
tions at 1.6, 8.5, and 10.5 GHz. Either not enough data were available or
there was too large a low frequency component in these spectra to make a use-
ful transform, but the same general features are seen at these frequencies as
were seen at 1.4 and 3.3 GHz. The amplitude of the ripples in these spectra
depend on the spillover of the feeds, but no attempt has been made to inter-
pret this bit of information.
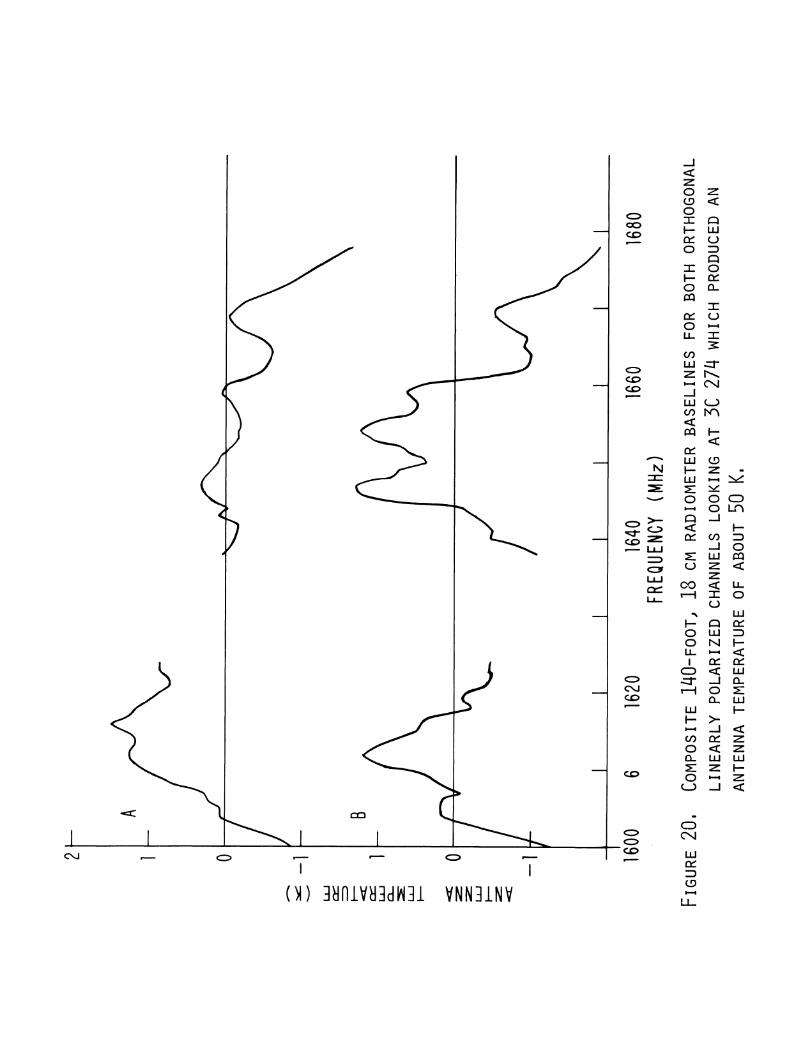
Figures 20 and 22b are composites of on-off spectra of a continuum source
at 1.6 and 8.5 GHz. At least at 1.6 GHz in Figure 20 there is a ripple com-
ponent with peak-to-peak spacings which are characteristic of the telescope
reflections. However, there is a much stronger large scale curvature component
in these spectra. This curvature is probably due to the addition of wide band
noise from the radio source which, when the on and off spectra are normalized
by the autocorrelator, causes the relative noise contributions from different

15
parts of the front end passband to be different and not cancel in the subtrac-
tion. Also, variation of the feed transfer characteristics with frequency
could distort the continuum spectra slightly and cause the observed curvature.
Unfortunately, I did not record the antenna temperature of the 3C 147.1 at
8.5 GHz so ripple amplitude comparisons are not very useful.
300-Foot Telescope Reflectometry
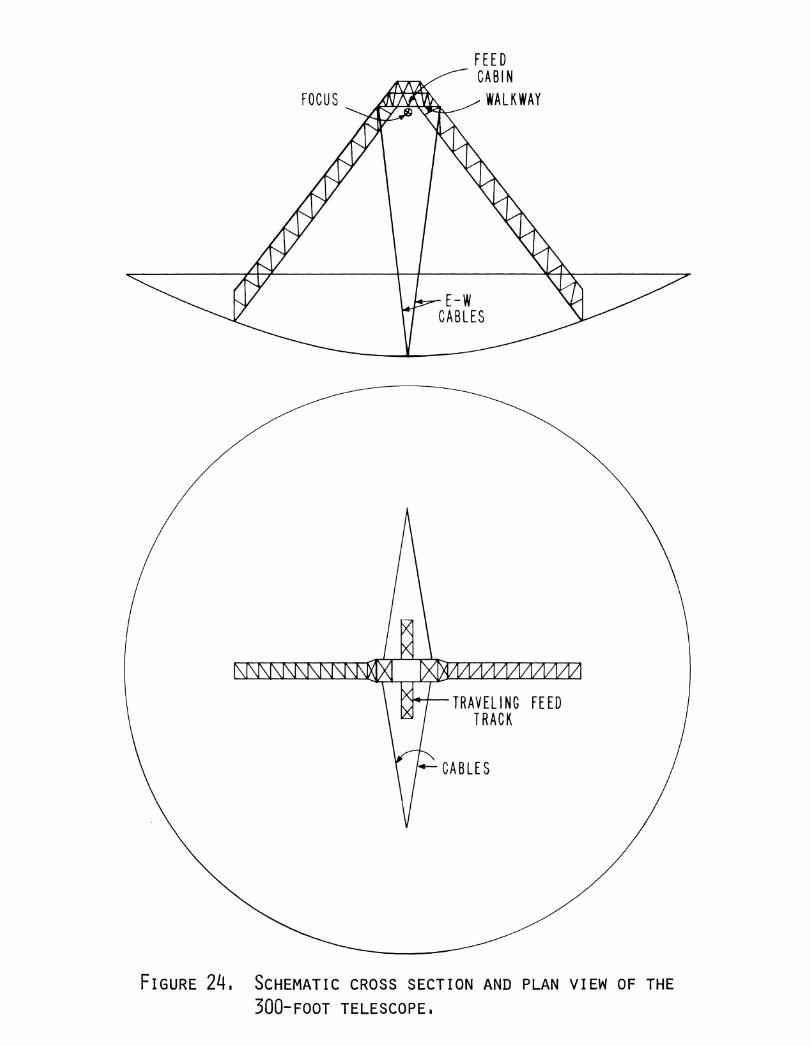
The focal ratio of the 300-foot telescope is the same as the 140-foot,
but there the similarity ends. The focal length of the 300-foot is 38.7
meters compared to 18.3 meters on the 140-foot. There is no Cassegrain house
on the 300-foot, and there are many more tiers of surface panels than on the
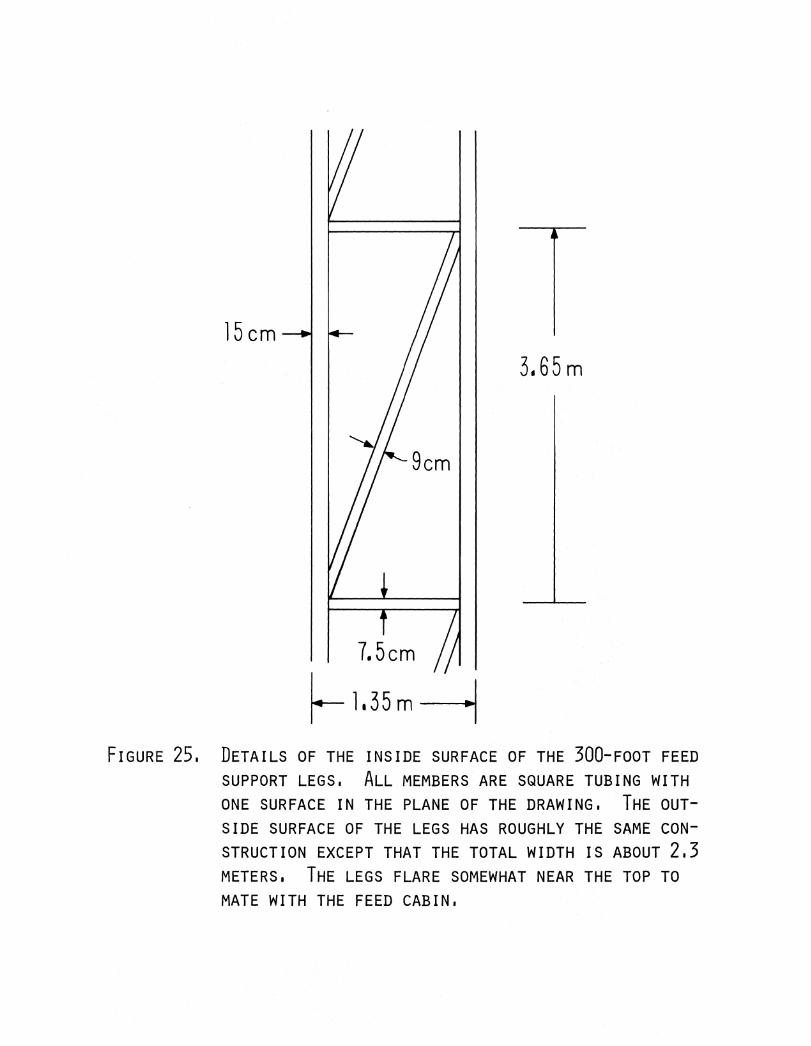
140-foot. As seen in Figures 24 and 25 the feed support structure is two
north-south bridgework legs which are 1.37 meters across on the inside of the
legs, and the base of the feed cabin is 2.1 x 2.7 meters between the feed legs.
Part of the feed cabin and a walkway extend into the leg structure in a plane
perpendicular to the telescope axis.
Two sets of 300-foot telescope measurements were made in July and Decem-
ber 1977. The December measurements were made with additional memory in the
calculator which permitted better distance resolution so all reflection spectra
shown are from the December run.
Figure 26 shows the reflection spectrum of the 300-foot before any modi-
fications were made to reduce reflections. The number of data points is 512
instead of 256 so the relative resolution is a factor of two better than that
shown in Figure 4. In Figure 26 three harmonics plus the main reflection are
visible. As will be shown later the harmonics are due to multiple bounces
between the dish vertex and the underside of the feed cabin. The high noise
level between 40 and 70 meters is again possibly due to slight nonlinearities
in the detection circuitry.

16
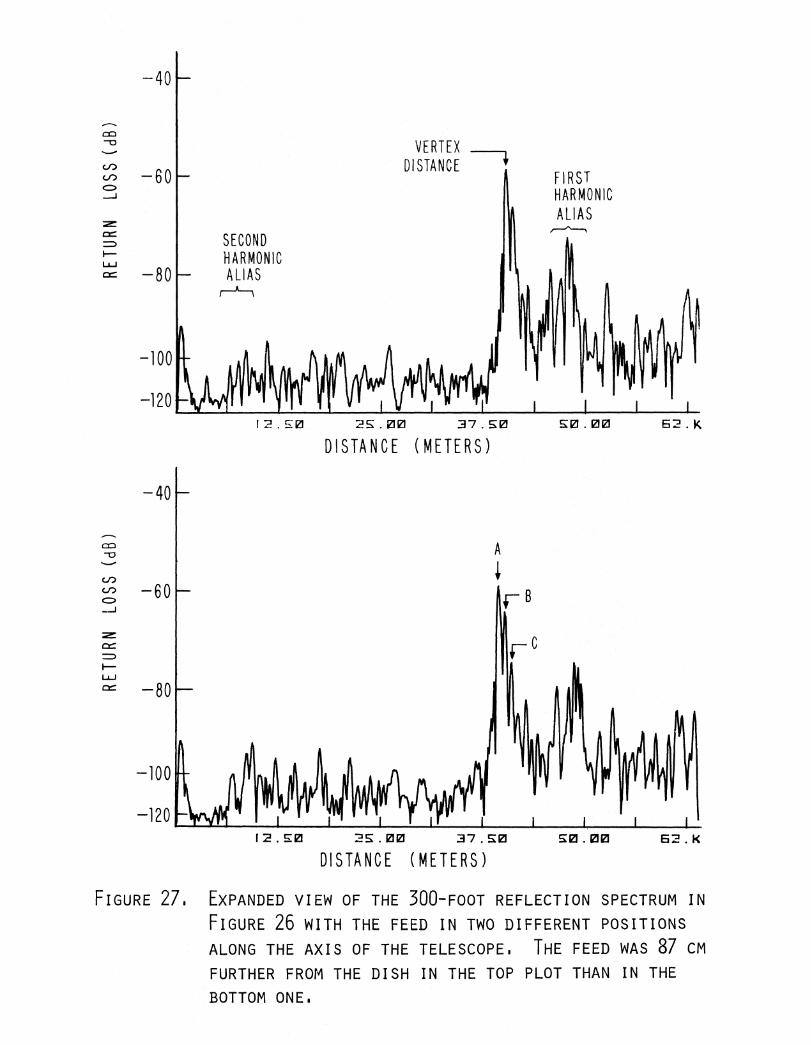
Figure 27 is an expanded look at the main vertex reflection with the
harmonics folded back but not overlapping the fundamental. The bottom half
of this figure is with the feed nearest the vertex, and the top is with the
feed's focal position 87 cm further from the vertex. Peak A fits the distance
to the vertex very well, but the origins of features B and C are not yet de-
termined. These could be produced by reflections from the feed support legs
to the surface and back to the feed or by circumferential gaps between the
inner surface panels. Feature C nearly disappeared with the feed farthest
from the dish vertex, but B did not change its position relative to the main
return. The circumferential panel gaps on the 300-foot are composed of
straight line segments as opposed to being perfect circles as on the 140-foot
which may explain why this source of reflection is not as prominent as it was
on the 140-foot.
So far most of the experimentation with absorbers and spoilers on the
300-foot has been aimed at reducing the multiple reflections. Three ways of
reducing these reflections were tried: absorber under the feed cabin, tilted
reflectors at the vertex and metal screen under the top part of the feed sup-
port legs. As on the 140-foot a ring of absorber covered the dish side of
the reflectometer equipment box during all measurements.
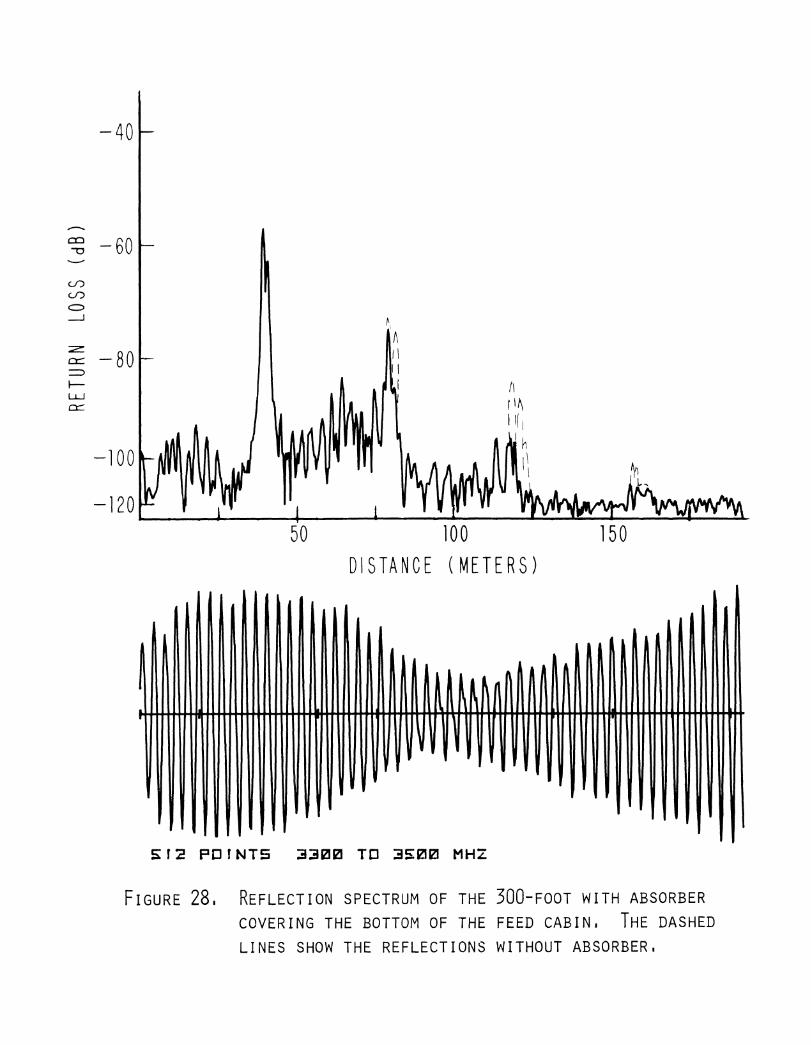
Figure 28 shows the result of placing a 2.5 (N-S) x 3.4 (E-W) meter
absorber panel under the feed cabin with a 1.4 meter square hole in the center
to let the equipment box stick through. This panel was large enough to cover
all of-the feed cabin between the feed support leg attachment points. Some
of the harmonic components were substantially reduced. (The broken lines
show the reflections without absorber.) Enough tests on the measurement sys-
tem had been performed to be reasonably confident that the harmonics were not
due to detector nonlinearities, but the results in Figure 28 show conclusively
17
that the harmonics are a property of the telescope since the main reflection
did not change.
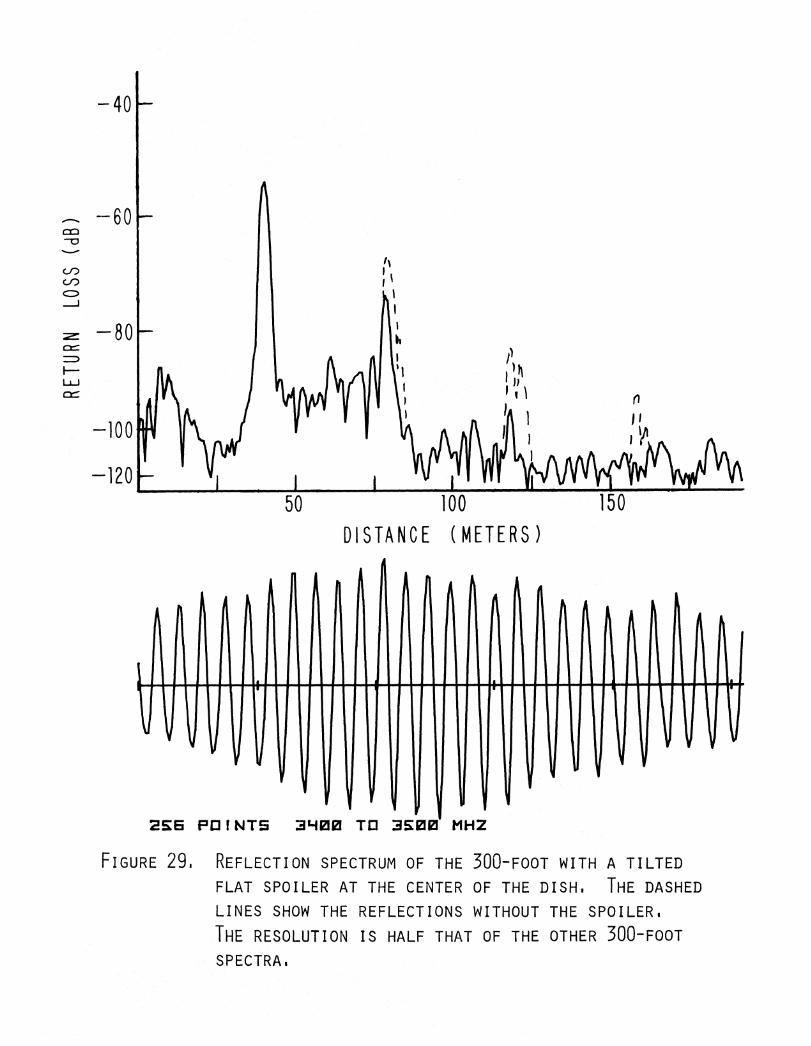
Another method of reducing the multiple reflections was tried, but only
a low resolution spectrum of the result is available (Figure 29). In this
experiment a 3.7 (N-S) x 3.0 (E-W) meter area of metal screen tilted 18° to
the west from the horizontal was placed at the center of the dish. Reduction
of the multiple reflections was about as good as if not slighly better than
that realized with absorber under the feed cabin.
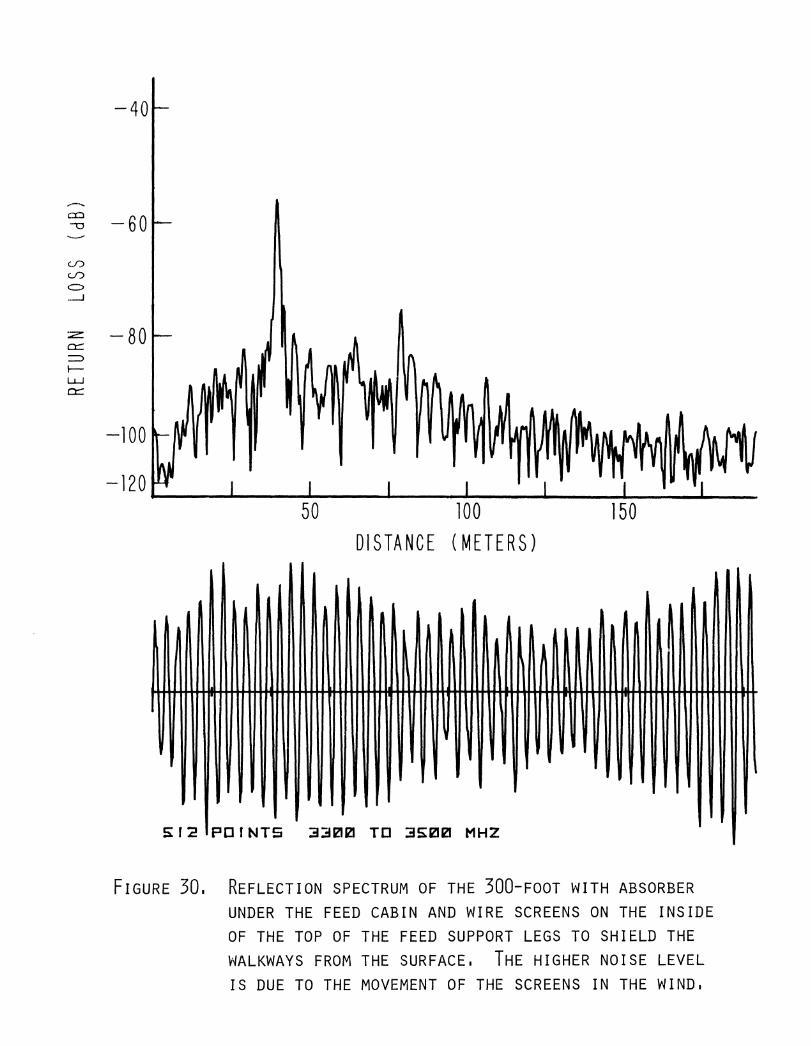
Both the absorber panels under the feed cabin and the tilted screen at
the vertex left a relatively strong first harmonic and a weak second harmonic
reflection component. In both trials the walkways north and south of the feed
cabin and the traveling feed rails were left uncovered. An attempt was made
to shield the walkways with metal screen hung under the top of the feed sup-
port legs from the north and south edges of the absorber panels to a distance
of about 6 meters down each leg. Unfortunately this screen tended to flop
around in the breeze which caused a time variable reflectometer return. This
raised the reflection spectrum noise level as can be seen in Figure 30. How-
ever, the first harmonic is still visible at about the same level as with the
absorber alone. Apparently the walkways are not the strongest remaining con-
tributors to the second bounce features.
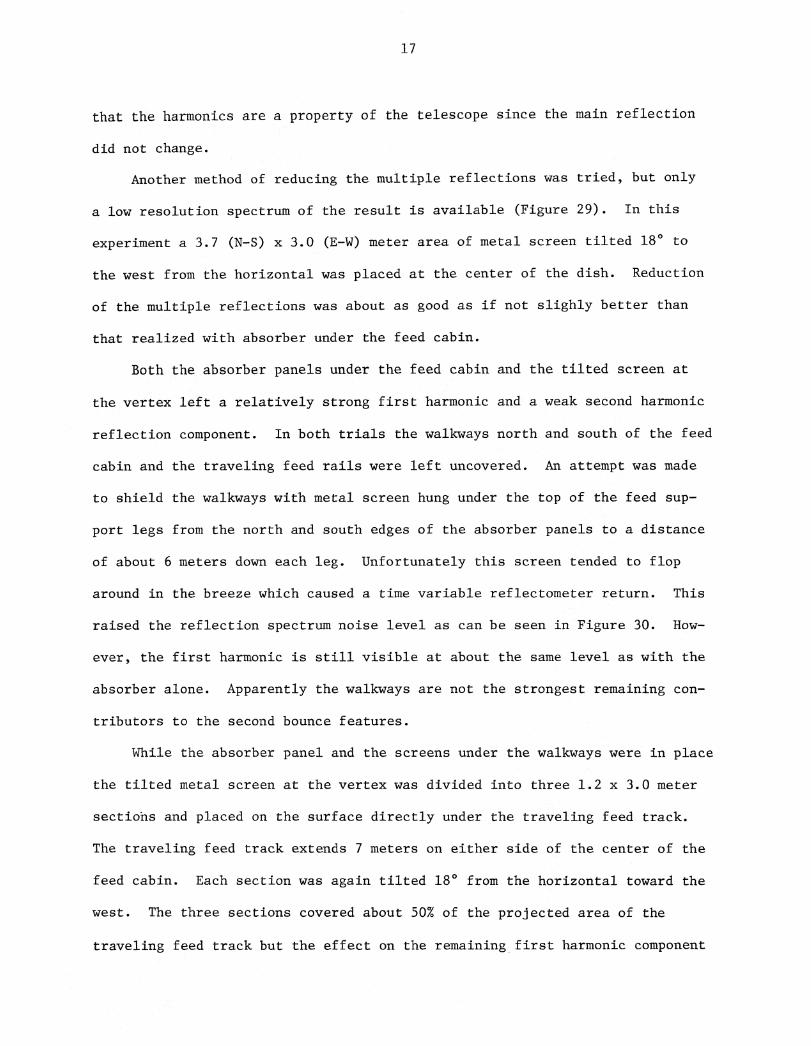
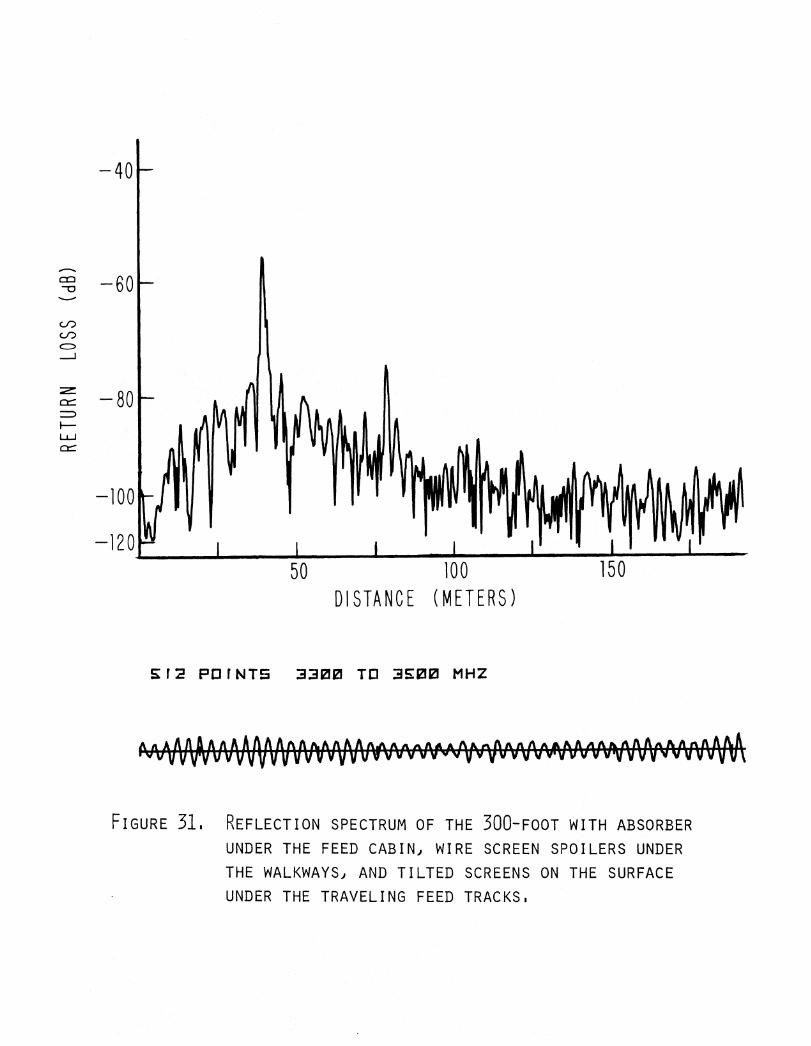
While the absorber panel and the screens under the walkways were in place
the tilted metal screen at the vertex was divided into three 1.2 x 3.0 meter
sections and placed on the surface directly under the traveling feed track.
The traveling feed track extends 7 meters on either side of the center of the
feed cabin. Each section was again tilted 18° from the horizontal toward the
west. The three sections covered about 50% of the projected area of the
traveling feed track but the effect on the remaining first harmonic component
18
was negligible as shown in Figure 31. More screen to cover the full traveling
feed track projection will have to be tried before anything conclusive can be
said about this potential source of reflection, however.
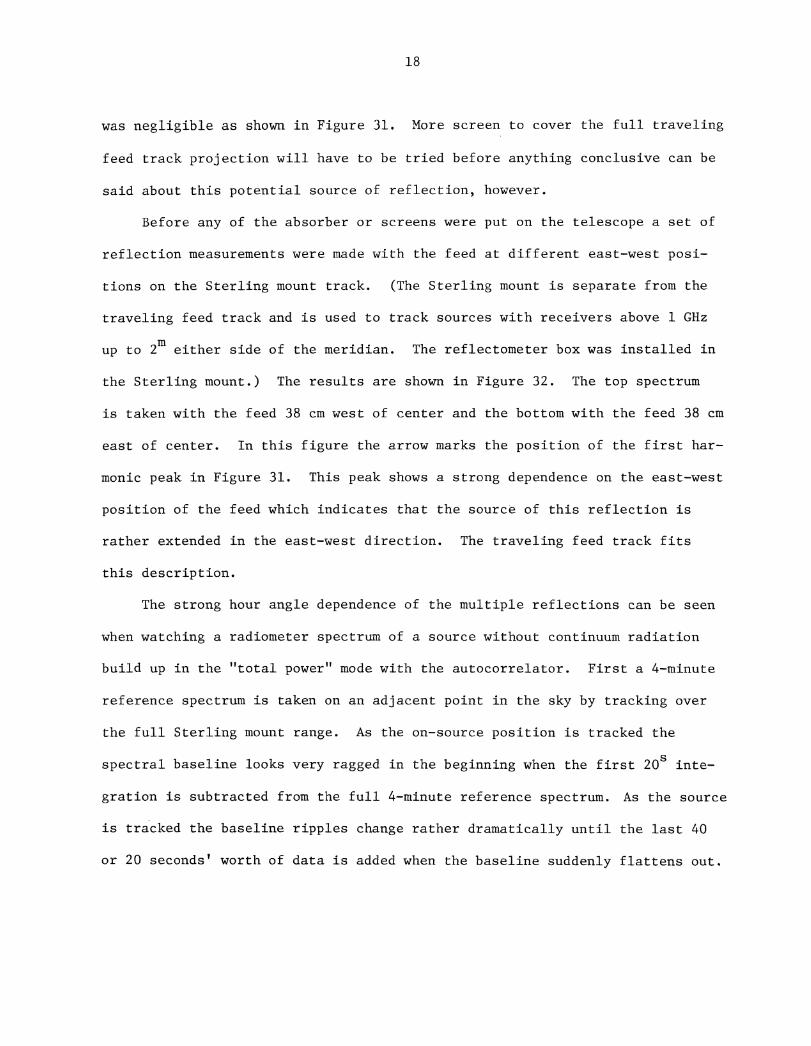
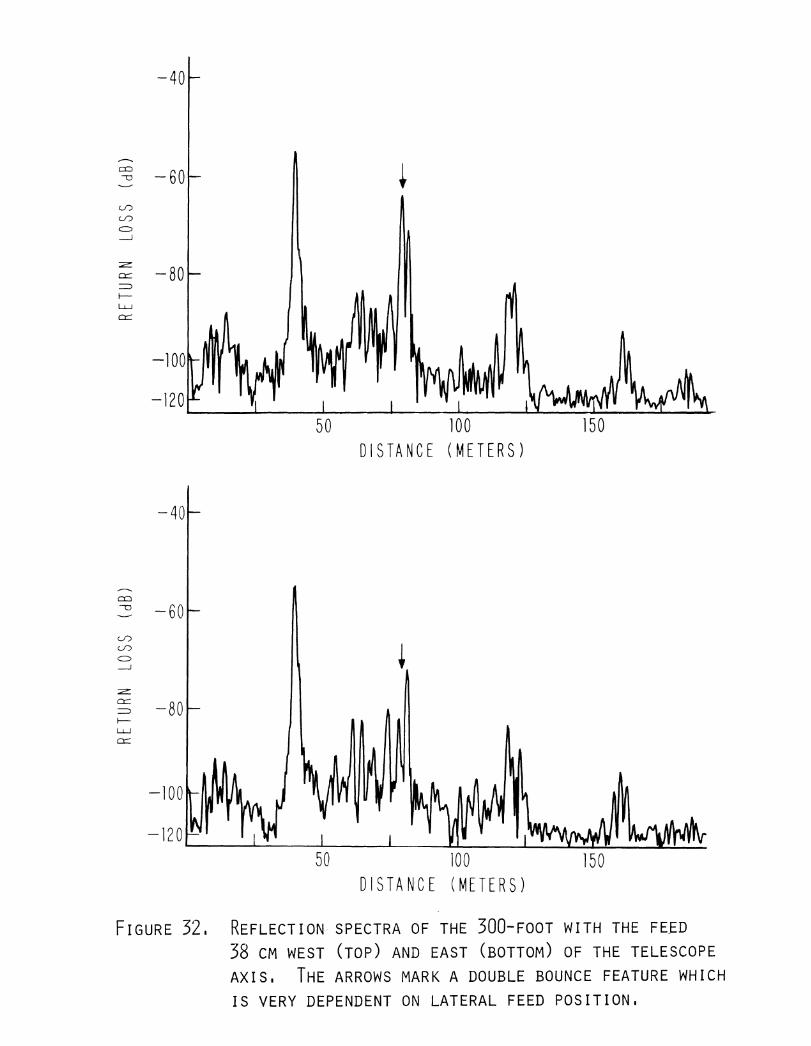
Before any of the absorber or screens were put on the telescope a set of
reflection measurements were made with the feed at different east-west posi-
tions on the Sterling mount track. (The Sterling mount is separate from the
traveling feed track and is used to track sources with receivers above 1 GHz
up to 2m either side of the meridian. The reflectometer box was installed in
the Sterling mount.) The results are shown in Figure 32. The top spectrum
is taken with the feed 38 cm west of center and the bottom with the feed 38 cm
east of center. In this figure the arrow marks the position of the first har-
monic peak in Figure 31. This peak shows a strong dependence on the east-west
position of the feed which indicates that the source of this reflection is
rather extended in the east-west direction. The traveling feed track fits
this description.
The strong hour angle dependence of the multiple reflections can be seen
when watching a radiometer spectrum of a source without continuum radiation
build up in the "total power" mode with the autocorrelator. First a 4-minute
reference spectrum is taken on an adjacent point in the sky by tracking over
the full Sterling mount range. As the on-source position is tracked the
spectral baseline looks very ragged in the beginning when the first 20 s inte-
gration is subtracted from the full 4-minute reference spectrum. As the source
is tracked the baseline ripples change rather dramatically until the last 40
or 20 seconds' worth of data is added when the baseline suddenly flattens out.

19
Conclusions
The 140-foot telescope is a complicated structure in terms of reflections.
Six sources of reflection have been identified: metal atop the Cassegrain
house, the Cassegrain feeds, the dish surface, circumferential gaps in the
surface, the edge of the dish, and stiffening cables on the feed support legs.
The first three are by far the most important, and the first two have been re-
duced by more than 20 dB with a metal spoiler on the top of the Cass house.
Reflections from the gaps were reduced by covering them with aluminum tape,
but a more permanent solution must be found since the tape peels up with thermal
contraction of the surface panels.
On the 300-foot telescope the direct reflection from the center of the
dish is the most prominent feature in its reflection spectrum. TWO weaker re-
flections involving slightly larger path lengths are seen but have not been
identified, yet. The feed cabin plays a strong role in creating multiple re-
flections between it and the vertex. Even though these higher order reflec-
tions are weaker than the main one they are quite important in spectral line
observations because they cause fine scale structure in the baselines. We had
some success in reducing the multiple reflections with spoiler screens at the
vertex or absorber under the feed cabin, but somewhat larger spoiler areas
must be tried to completely identify and suppress the multiple reflections.
Attenuation of the first reflection from the inner dish surface of either
telescope will require a rather large spoiler in the center of the dish or
tuning platesto selectively compensate for the telescope reflections at the
observing frequency. The spoiler may have to be so large that a significant
portion of the dish collecting area will be lost, particularly on the 140-
foot. The tuning plate approach suffers from its relative complexity and the
need for adjustment every time the observing frequency is changed. The main
2 0
surface reflection on both telescopes seems to be reasonably independent of
telescope position so an elaborate computer controlled servo for the tuning
plates would not be needed, but some sort of convenient adjustment from the
control room would be necessary.
So far all of the identified reflection paths involve a single reflection
source with the exception of the multiple bounce harmonics on the 300-foot.
This is quite different from the interpretation of most of the reflection
peaks on the 100-meter telescope by Morris and Bieging [16], [17]. We do see
structure in the distance range just beyond that of the center of the main
dish which could involve reflections from the feed support sturcture, but more
work remains to be done to see if such is the case.
Observations of instrumental noise spectra indicate that the reflectometer
tests are aimed in the right direction. Naturally one cannot cover a wide
range of frequencies with the sensitivity normally attained in spectral line
work to show a direct improvement in baselines with each telescope modifica-
tion. Observations of a couple of strong continuum sources show baseline
sturcture characteristic of the measured reflection distances, but other base-
line effects are present at the same time. Their solution is also important.
Acknowledgements:
With some thought I can trace most of the ideas contained in this report
to bits of conversations with many people or to partially forgotten pieces of
literature read over the last few years. Just a few examples are: conversa-
tions with John Armstrong and Russ Hulse on fast Fourier transforms; a Hewlett-
Packard note on swept frequency relfectometry; John Brooks' remarks about re-
flections from steps in the surface of the 210-foot at CSIRO, and a Bill
Brundage speculation about reflections from the Cassegrain feeds. Dave Morris
21
of the MPI sent me a thoughtful letter on many aspects of his work which were
not included in the referenced reports after talking to John Findlay about
some of my work.
John Ralston and Omar Bowyer designed the sheet metal work and the Green
Bank shop put it together. The telescope operators and Herb Hanes' crew made
the many telescope modifications. Bill Kuhlken constructed the reflectometer
and helped with the measurements. Carolyn Dunkle, Tony Miano and the Green
Bank photographics group put this report together.
22
References:
[1] Lockman, F.J. and Rickard, L. J, "Spurious Spectral Features at the
NRAO 140-Foot Telescope", NRAO Electronics Division Internal
Report No. 183, December 1977.
[2] Morris, D., "Chromatism at Millimeter Wavelengths", Rapport technique
provisoire, G.I. mm/DM/No. 125, 10 April 1973.
[3] Morris, D., "Chromatism in Radio Telescopes due to Blocking and Feed
Scattering", internal report, Observatoire de Paris, 92190
Meudon, France, date unknown.
[4] Weinreb, S., "Effect of Feed-Paraboloid Reflections upon Line Receiver
Performance on the 140-ft Telescope", NRAO memo, 14 November 1967.
[5] Weinreb, S., "Effect of 140' Vertex Cone on Spectral-Line Baselines",
NRAO memo, 22 May 1970.
[6] Padman, R., "Report on Baseline Ripple - 64 m Dish", CSIRO internal
report, 22 January 1976.
[7] Padman, R., "Reduction of Baseline Ripple on Spectra Recorded with the
Parkes 64 m Radio Telescope", CSIRO preprint RPP 2094, 1977.
[8] Bieging, J. and Pankonin, J., "Experimental Investigations of the
Causes of Spectroscopic Baseline Ripple at 5 GHz", M.P.I.f.R.
Technischer Bericht No. 16.
[9] Morris, D., "Chromatism and Antenna Design", Internal Report G.I. mm
No. 125a, 1974.
[10] . Poulton, G.T., "Minimization of Spectrometer Ripple in Prime Focus
Radiotelescopes", CSIRO Research Report, 1974.
[11] Padman, R., CSIRO Division of Radiophysics Report RPP 2056(L), 1977.
[12] Poulton, G.T., "An Investigation into Ripple Causing Mechanisms in a
Large Two Reflector Telescope", Queen Mary College, London, 1975.
23
[13] Gardner, F.F., "An Investigation of Instrumental Effects with Spectral
Line Observations with the 100 m Telescope", M.P.I.f.R. Internal
Report, 1973.
[14] Wilson, T.L. and Hills R.E., "The Instrumental Frequency Baseline of
the 100-meter Telescope from the Secondary Focus at 11 cm",
M.P.I.f.R. Technischer Bericht No. 11.
[15] Ulich, B.L., "Telescope Standing Waves: Their Causes and Cures",
National Radio Science Meeting, Boulder, Colorado, January 1978.
[16] Morris, D. and Beiging, J., "Progress Report on Baseline Ripple Prob-
lem", M.P.I.f.R. internal report, 20 January 1976.
[17] Bieging, J. and Morris, D., "Further Efforts to Improve the Spectro-
scopic Baseline of the 100-meter Telescope", M.P.I.f.R. internal
report, 6 December 1976.
[18] Holloway,D.L., "The Comparison Reflectometer', IEEE Trans. MTT-15,
No. 4, 250, April 1967.
[19] Somlo, P.I., "The Locating Reflectometer", IEEE Trans. MTT-20, N
105, February 1972.
[20] Appleton, E.V. and Barnett, M.A.F., "Local Reflection of Wireless
Waves from the Upper Atmosphere", Nature, Vol. CXV, 333,
March 7, 1925.
[21] Brenner, N., "The Fast Fourier Transform", Astrophysics Part C, Radio
Observations, Ed. M. L. Meeks, Academic Press, New York, 1976.

115-1
.85G
Hz
3.0
3,7
GH
z
X2LI
MIT
ER
FEED
i>121
1BPO
WER
DIV
IDER
ALC
X4
SYN
TH
ESI
ZER
HP 9
8254
CALC
ULA
TO
R
PLO
TTER I
111.
.■■
■41
1111
11.
VO
LTAG
ECO
MBI
NER
REF
LECT
OR
UN
DER
TES
T
SQU
ARE
LAW
DET
ECTO
R
FIG
URE 1
. SW
EPT F
REQ
UEN
CY R
EFLE
CTO
METER T
EST S
ETU
P.

—20
0
—5
—10
cc, —15
I-1-J —20(r)
0- —25(i)
—30
—35
FREQUENCY (CHz)
2.4 2.6 2.8 3.0 3.2 3.4 3.6 3.8 4.0
co7D NORMAL SWEEP RANGE
cr)
—30
80 60 40 20 0 20 40 60 80
ANGLE FROM TELESCOPE AXIS (DECRESS)
FIGURE 2. CHARACTERISTICS OF THE FEED USED FOR REFLECTION
MEASUREMENTS. THE TOP FIGURE IS THE REFLECTION
AMPLITUDE FROM THE FEED AND THE BOTTOM IS THE
FEED PATTERN.
1111■
0
-30
-10
-20
C=>
-60
.1■
1•••■
■■
••11,
5 M
ETER D
ISTAN
CE C
UTO
FF
■1
11
11
11
.1.
10
DIS
TAN
CE
RO
UN
D T
RIP
DEL
AY IN
MET
ERS)
FIG
UR
E 3
. R
ES
PO
NS
E O
F T
HE
DIG
ITA
L H
IGH
PA
SS
FIL
TE
R U
SE
D T
O S
UP
PR
ES
S T
HE
LA
RG
E
FE
ED
RE
FL
EC
TIO
N.

1015
2025
30D
ISTA
NC
E (M
ETER
S)FIGURE
1 4. INSTRUMENTAL RESPONSE TO A SINGLE UNRESOLVED
REFLECTION WITH 256 AMPLITUDE-FREQUENCY SAMPLES.
TIL
TABLE
AN
DRO
TATA
BLE
REF
LECTO
RS
EQU
IPM
ENT
FEED
BO
X \
1108
m1.
38m
SOD
ABSO
RBER
FIG
UR
E 5
. C
AL
IBR
AT
ION
AN
D S
PO
ILE
R T
ES
T S
ET
UP
.
FRO
NT
SIDE
1
1 M
ETER
MET
ER
I M
ET
ER
)
VARI
ABLE
HEIG
HT
DIS
KCO
NE
PYRA
MID
SU
RFAC
E
FIG
URE 6
. TH
REE S
PO
ILER C
ON
FIG
URATIO
NS T
RIE
D I
N T
EST S
ETU
P
SH
OW
N I
N F
IGU
RE 5
.

L-1,1 —
40
air*
(i)
NO
ISE
LE
VE
L
102
030
40
506
0"T
O80
90
RO
TATI
ON
AN
GL
E (
DE
GR
ES
S)
FIG
UR
E 7
. R
EL
AT
IVE
RE
FL
EC
TIO
N A
MP
LIT
UD
E F
RO
M T
HE
1-M
ET
ER
DIA
ME
TE
R D
ISK
AS
A
FU
NC
TIO
N O
F T
ILT
TO
TH
E L
INE
OF
SIG
HT
. (Z
ER
O D
EG
RE
ES
IS
FA
CE
-ON
.)
+;
•* -1 1! -
4-. ±
XX‘
$ .• . 'It"!
Is
27 "
—20
HE
IGH
T D
IA.
30 c
m 1
00cm
2011
08
115
1//
/it\ ■
C=.0
/-J
1 X
%
.4; 3( -
-X
UJ
1/
4----
'%
cc,
II—
40 U I —
I /
..up C
l)I/
±c::
:,X
NO
ISE
LE
VE
L
1020
3040
5060
7080
90
RO
TA
TIO
N A
NG
LE (
DE
GR
ES
S)
FIGURE 8. REFLECTION AMPLITUDE RELATIVE TO FACE-ON DISK FROM THREE CONES OF
DIFFERENT OPENING ANGLES AS A FUNCTION OF TILT TO THE LINE OF SIGHT.
THE HEIGHT AND DIAMETER OF EACH ARE GIVEN AT THE TOP RIGHT.
CX3
C./
)
-20
C.)
UJ
II
11
11
11
11
1
NO
ISE
LE
VE
L
U-1
NO
M.
010
2030
4050
6070
8090
RO
TATI
ON
AN
GLE
(DE
GR
ES
S)
FIG
URE 9
, REFLE
CTIO
N A
MPLI
TU
DE R
ELA
TIV
E T
O F
ACE-O
N D
ISK F
RO
M T
HE P
YRAM
IDAL
SU
RFA
CE S
HO
WN
IN
FIG
URE 6
AS A
FU
NCTIO
N O
F T
ILT T
O T
HE L
INE O
F
SIG
HT.
INTE
RM
EDIA
TEPA
NEL
SIN
NER
PAN
ELS
FOCU
S
STIF
FEN
ING
CABLE
S
OUT
ERPA
NEL
S
CASS
EGRA
1NHO
USE
OUT
ERGA
P
INN
ERG
AP
FIG
URE 1
0. SCH
EM
ATIC
CRO
SS S
ECTIO
N O
F T
HE 1
40-F
OO
T T
ELE
SCO
PE. TH
ERE A
RE F
OU
R
FEED
SU
PPO
RT L
EG
S W
ITH
STIF
FEN
ING
CABLE
S R
UN
NIN
G F
RO
M T
HE C
EN
TER
OF E
ACH
TO
TH
E B
ASE O
F A
DJA
CEN
T L
EG
S.
• • • M
k,
FIG
UR
E I
L T
OP
OF
TH
E 1
40-F
OO
T C
AS
SE
GR
AIN
HO
US
E A
S S
EE
N F
RO
M T
HE
FE
ED
. T
HE
SQ
UA
RE
PL
AT
E I
S A
TE
MP
OR
AR
Y S
PO
ILE
R C
OV
ER
ING
TH
E L
-BA
ND
FE
ED
WH
ICH
IS
RO
UG
HL
Y O
N T
HE
SO
UT
H S
IDE
OF
TH
E H
OU
SE
.

-100
-120
-60
cw.„-80
B C D
-40
3010
15 20
25
DISTANCE (METERS)
2SE POINTS 30E0 TO 3700 MHZ
fy v • ill ' lw 1 1, It ft !! '11 I'll /1 r
FIGURE 12. INTERFERENCE PATTERN BETWEEN INCOMING AND TRANSMITTED
WAVES WITH VARYING FREQUENCY (BOTTOM) AND ITS FOURIER
TRANSFORM (TOP) WHICH SHOWS THE RETURN LOSS (REFLEC-
TION COEFFICIENT) AS A FUNCTION OF DISTANCE FROM THE
REFLECTOMETER. THIS SPECTRUM WAS TAKEN ON THE 140-
FOOT BEFORE ANY MODIFICATIONS WERE MADE TO SUPPRESS
REFLECTIONS. REFLECTIONS ARE FROM (A AND B) THE TOP
OF THE CASSEGRAIN HOUSE, (C) THE CASSEGRAIN FEEDS,
AND (D) THE INNER DISH SURFACE.
-40
10 15 20 25 30
DISTANCE (METERS)
2E6 POINTS 3050 TO 3700 MHZ
FIGURE 13. INTERFERENCE PATTERN AND RETURN LOSS-DISTANCE SPECTRUM
FOR THE 140-FOOT WITH A SPOILER OVER THE L-BAND CASS
FEED, ABSORBER OVER THE REST OF THE CASS HOUSE ROOF
AND ALUMINUM TAPE OVER THE OUTER CRACK (F). DOTTED
LINES SHOW REFLECTIONS BEFORE MODIFICATION, AND THE
INTERFERENCE PATTERN SCALE IS EXPANDED TEN TIMES THAT
IN FIGURE 12.

FLA
T A
LUM
INU
M
0.4
9m
16°
0.3
0m
10°
CE
NTE
R
3.4
5m
FIG
URE 1
4.
CRO
SS S
ECTIO
N O
F C
IRCU
LAR S
PO
ILER P
LACED
OVER T
HE T
OP O
F T
HE 1
40-F
OO
T
CASSEG
RAIN
HO
USE. TH
E R
ESU
LTS A
RE S
HO
WN
IN
FIG
URE 1
5.
-40
-60
DISTANCE (METERS)
26 POINTS 30S0 TO 3700 MHZ
-80
-100
-120
FIGURE 15. INTERFERENCE PATTERN AND REFLECTION SPECTRUM OF THE
140-FOOT WITH THE SPOILER OF FIGURE 14 IN PLACE.
REFLECTION (G) IS FROM THE FEED LEG STIFFENING
CABLES/ AND (I) IS FROM THE EDGE OF THE DISH. THE
SOURCES OF (H) ) (A AND (K) HAVE NOT BEEN DETERMINED.
-40
- -60
C..r)
-100
-120
s.P
A 25 30
A
-40
- -60
Cr)CC)(=>
-80
-100
-100
A
Ati#1\?\11(
10 115 20
DISTANCE (METERS)
10 15 20 25 30
DISTANCE (METERS)
FIGURE 16. REFLECTION SPECTRA OF THE 140-FOOT SHOWING THE CHANGE
IN REFLECTION CHARACTERISTICS AROUND 20 METERS (INNER
DISH SURFACE) WITH A CHANGE IN AXIAL FEED POSITION.
THE FEED FOR THE TOP PLOT WAS 55 cm FURTHER FROM THE
DISH THAN IN THE BOTTOM PLOT.
-20
-40
60
-80
60 7050
1 1 1 1
10 20 30 40
DISTANCE (METERS)
1 28 POINTS 1300 TO I L-1 28 MHZ
FIGURE 17. COMPOSITE 140-FOOT RADIOMETER BASELINE OVER 128 MHz
(BOTTOM) AND ITS FOURIER TRANSFORM (TOP) FOR CHANNEL
A OF THE 6/25 CM RADIOMETER WITH LINEAR POLARIZATION.
THE BASELINE IS THE DIFFERENCE BETWEEN SPECTRA TAKENX /8 ABOVE AND BELOW THE NOMINAL FOCUS POSITION WITH
THE ANTENNA POINTED AT THE ZENITH.
LUCC
—40U-J
—60
—80
10 20 30 40 50 60 70DISTANCE ( METERS)
1 28 POINTS 1 300 TO 1 1.128 MHZ
FIGURE 18. SAME AS FIGURE 17 EXCEPT FOR CHANNEL B USING THE
ORTHOGONAL LINEAR POLARIZATION.
1640
FREQ
UEN
CY
(MH
z)16
0016
8016
2016
60
„•••
••••
•,„
FIG
URE 1
9,
CO
MPO
SIT
E 1
40-F
OO
T, 18
CM
RAD
IOM
ETER B
ASELI
NES F
OR B
OTH
ORTH
OG
ON
AL
LIN
EARLY
PO
LARIZ
ED
CH
AN
NELS
. TH
E B
ASELI
NES A
RE T
HE D
IFFEREN
CE B
E-
TW
EEN
SPECTRA T
AKEN
X/8
ABO
VE A
ND
BELO
W T
HE N
OM
INAL
FOCU
S P
OSIT
ION
WIT
H T
HE A
NTEN
NA P
OIN
TED
AT T
HE Z
EN
ITH
.
A
1
11
11
I1
11
61620
1640
1660
FREQUENCY (MHz)
FIGURE 20. COMPOSITE 140-FOOT, 18 CM RADIOMETER BASELINES FOR BOTH ORTHOGONAL
LINEARLY POLARIZED CHANNELS LOOKING AT 3C 274 WHICH PRODUCED AN
ANTENNA TEMPERATURE OF ABOUT 50 K.
1600
1680
-20
-40
U_J
-60
-80 I i i I 1 1 I10 20 30 40 50 60 70
DISTANCE (METERS)
1 28 POINTS 3278 TO 3HOS MHZ
FIGURE 21. COMPOSITE 140-FOOT ) 9 CM RADIOMETER BASELINE (BOTTOM)
AND ITS FOURIER TRANSFORM. THE BASELINE IS THE DIF-
FERENCE BETWEEN SPECTRA TAKEN X /8 ABOVE AND BELOW THE
NOMINAL FOCUS POSITION WITH THE ANTENNA POINTED AT
THE ZENITH.

j1
1
11
1
.1.3 .2 Si
-.4
-.5
A
8420
4060
8085
0020
40
8420
4060
8085
0020
40
FR
EQ
UE
NC
Y (
MH
z)
FIG
URE 2
2.
CO
MPO
SIT
E 1
40-F
OO
T, 3
.5 C
M R
AD
IOM
ETER B
ASELI
NES. TH
E B
ASELI
NES A
RE
TH
E D
IFFEREN
CE B
ETW
EEN
SPECTRA T
AKEN
(A)
X18 A
BO
VE A
ND
BELO
W T
HE
NO
MIN
AL
FOCU
S P
OSIT
ION
WIT
H T
HE A
NTEN
NA P
OIN
TED
AT T
HE Z
EN
ITH
AN
D
(13)
ON
AN
D O
FF O
F T
HE S
OU
RCE 3
C 1
47.1
,
1054
010
560
1058
010
600
1062
010
640
FRE
QU
EN
CY
(MH
z)
FIG
URE 2
3.
CO
MPO
SIT
E 1
40-F
OO
T, 2
.8 C
M R
AD
IOM
ETER B
ASELI
NE. TH
E B
ASELI
NE I
S T
HE
DIF
FEREN
CE B
ETW
EEN
SPECTRA T
AKEN
X/8
ABO
VE A
ND
BELO
W T
HE N
OM
INAL
FOCU
S
PO
SIT
ION
WIT
H T
HE A
NTEN
NA P
OIN
TED
AT T
HE Z
EN
ITH
.
FEEDCABIN
WALKWAYFOCUS
getwoonemoloomegoommenesserTRAVELING FEED
TRACK
CABLES
FIGURE 24, SCHEMATIC CROSS SECTION AND PLAN VIEW OF THE
300-FOOT TELESCOPE.
15cm
1.5cm
FIGURE 25. DETAILS OF THE INSIDE SURFACE OF THE 300-FOOT FEED
SUPPORT LEGS. ALL MEMBERS ARE SQUARE TUBING WITH
ONE SURFACE IN THE PLANE OF THE DRAWING. THE OUT-
SIDE SURFACE OF THE LEGS HAS ROUGHLY THE SAME CON-
STRUCTION EXCEPT THAT THE TOTAL WIDTH IS ABOUT 2.3METERS, THE LEGS FLARE SOMEWHAT NEAR THE TOP TO
MATE WITH THE FEED CABIN.
3.65m

- 40
-60
cip(_C)(=>
-100
-120
till vitt,1
50 100
DISTANCE (METERS)
150
If
ill Al
iAi
IS12 PITS 3300 TO 3.5:00 MHZ
' 11 I I I illifill yi
FIGURE 26. INTERFERENCE PATTERN AND REFLECTION SPECTRUM OF THE
300-FOOT TELESCOPE BEFORE ANY MODIFICATIONS. THE
REFLECTION AT ABOUT 39 METERS IS FROM THE CENTRAL
DISH SURFACE, AND THE HARMONICS ARE MULTIPLE BOUNCES
BETWEEN THE SURFACE AND STRUCTURE NEAR THE FEED CABIN.
SECONDHARMONIC
-80 ALIAS
1 2.E0 25.00
FIRSTHARMONICALIAS
62.K37 . EVI 50.00
VERTEX
DISTANCE
DISTANCE (METERS)
DISTANCE (METERS)
FIGURE 27. EXPANDED VIEW OF THE 300-FOOT REFLECTION SPECTRUM IN
FIGURE 26 WITH THE FEED IN TWO DIFFERENT POSITIONS
ALONG THE AXIS OF THE TELESCOPE. THE FEED WAS 87 CM
FURTHER FROM THE DISH IN THE TOP PLOT THAN IN THE
BOTTOM ONE.
-40
—60
(r)
—100
—120
50 100 150
DISTANCE (METERS)
512 POINTS 3300 TO 3500 MHZ
FIGURE 28. REFLECTION SPECTRUM OF THE 300-FOOT WITH ABSORBER
COVERING THE BOTTOM OF THE FEED CABIN. THE DASHED
LINES SHOW THE REFLECTIONS WITHOUT ABSORBER.
-40
—60on-C3
(r)Cr)(=>
-80c:=
UJ
—100
—120
50 100
DISTANCE (METERS)
1
11 1
V
C
\1 1\l'A2E POINTS 3H00 TO 3500 MHZ
FIGURE 29. REFLECTION SPECTRUM OF THE 300-FOOT WITH A TILTED
FLAT SPOILER AT THE CENTER OF THE DISH. THE DASHED
LINES SHOW THE REFLECTIONS WITHOUT THE SPOILER.
THE RESOLUTION IS HALF THAT OF THE OTHER 300-FOOT
SPECTRA.
-40
-100
-120
I I1
III tIII3:300 TO SPJVJ MHZ
50 100 150
DISTANCE (METERS)
FIGURE 30. REFLECTION SPECTRUM OF THE 300-FOOT WITH ABSORBER
UNDER THE FEED CABIN AND WIRE SCREENS ON THE INSIDE
OF THE TOP OF THE FEED SUPPORT LEGS TO SHIELD THE
WALKWAYS FROM THE SURFACE. THE HIGHER NOISE LEVEL
IS DUE TO THE MOVEMENT OF THE SCREENS IN THE WIND.
50
100
150
DISTANCE (METERS)
S12 POINTS 3300 TO 3E00 MHZ
FIGURE 31. REFLECTION SPECTRUM OF THE 300-FOOT WITH ABSORBER
UNDER THE FEED CABIN, WIRE SCREEN SPOILERS UNDER
THE WALKWAYS, AND TILTED SCREENS ON THE SURFACE
UNDER THE TRAVELING FEED TRACKS.
Ifs
i'tNAS01115050 100
DISTANCE (METERS)
-40
CC)--0
(X)(r)CD
LLJC2C
-60
-80
-40
I_ I50 100
DISTANCE (METERS)
150
II
FIGURE 32. REFLECTION SPECTRA OF THE 300-FOOT WITH THE FEED
38 CM WEST (TOP) AND EAST (BOTTOM) OF THE TELESCOPE
AXIS. THE ARROWS MARK A DOUBLE BOUNCE FEATURE WHICH
I S VERY DEPENDENT ON LATERAL FEED POSITION.