Embed Size (px)
Citation preview

S-1
Electronic Supplementary Information
A TICT based NIR-fluorescent probe for Human Serum Albumin: a pre-
clinical diagnosis in blood serum
Shahi Imam Reja, Imran A. Khan, Vandana Bhalla and Manoj Kumar*
Department of Chemistry, UGC Sponsored Centre for Advanced Studies-1, Guru Nanak Dev University,
Amritsar, Punjab, India. E-mail: [email protected]
Page No. Contents
S-2: Experimental: Materials and reagents, estimation of human serum albumin (HSA) in
human blood serum and denaturation of proteins.
S-2 to S-4: Synthesis of probe 3 and 1H,
13C NMR and Mass spectra of probe 3.
S-5: UV-vis and fluorescence spectra of probe 3 in HEPES buffer.
S-5: UV-vis spectrum in presence of human serum albumin and Normalized fluorescence
spectrum of probe 3 in different solvent systems.
S-5: Fluorescence spectra of probe 3 (10.0 μM) in the presence of different viscosity and
calculated λfl for different concentration of glycerol: H2O systems.
S-6: HOMO-LUMO energy level of probe 3 for ground state and excited state.
S-6: Theoretical Oscillator strength vs percentage of glycerol and Tables of structural
properties and electrochemical properties at various concentration of glycerol.
S-7 to S-8: Limit of detection graph and calculation.
S-8: Fluorescence selectivity bar diagram of probe 3 (10.0 μM) in the presence of various
analytes.
S-9: Fluorescence lifetime decay profiles of probe 3 in the presence HSA (15 μM) in H2O
buffered with HEPES, pH = 7.4.
S-9: Job’s plot for determining the stoichiometry and displacement of probe 3 from HSA-3
complex by addition of different site-specific drugs.
S-10: Different docking poses with HSA and BSA.
S-11: HOMO-LUMO using the ground state configuration in QM/MM protocol in HSA-
probe and BSA-probe complexes.
S-11 to S-13: Output results of QM/MM calculation of both the proteins with the respective
probe.
S-14 to S-15: Results with the trimmed proteins of the both BSA and HSA
S-15 to S-16: Results of the trimmed protein optimization.
S-16: Different states of HSA-3 complex used for the calculation of reorganization energy.
Electronic Supplementary Material (ESI) for Chemical Communications.This journal is © The Royal Society of Chemistry 2015
S-2
S-17: Different states of BSA-3 complex used for the calculation of reorganization energy
and calculation of reorganisation energy values for both HSA-3 and BSA-3 complex.
S-18: HSA level in different human blood samples using probe 3 and clinical test.
Experimental Section
General information
All reagents were purchased from Aldrich and were used without further purification.
HPLC grade solvent was used in UV-vis and fluorescence studies. Human serum
albumin (HSA), bovine serum albumin (BSA), glutathione reductase (GSSR),
hemoglobin, trypsin, lysozyme and other amino acids were purchased from Sigma-
Aldrich. UV-vis spectra were recorded on a SHIMADZU UV-2450
spectrophotometer, with a quartz cuvette (path length 1 cm). The fluorescence spectra
were recorded with a SHIMADZU 5301 PC spectrofluorimeter. 1H and
13C NMR
spectra were recorded on a Bruker Avance III HD 500 MHz spectrophotometer using
CD3CN as solvent. Data are reported as follows: chemical shift in ppm (d),
multiplicity (s = singlet, d = doublet, t = triplet, m = multiplet, br = broad singlet),
coupling constants J (Hz). Protein Sensing Experiments was carried out followed by
previous report.
Estimation of HSA in Human Blood Serum
Blood samples were collected from university health center, healthy donors and hypertension
patients into a blood collecting tube using sterilized syringe and needle. Serum on the top
portion is then pipetted out and used for the analysis. The HSA content in blood serum was
estimated with probe 3 by standard addition method. A calibration plot was prepared by
measuring the emission maximum at 680 nm upon addition of different concentration of HSA
into the probe 3. The unknown concentration of HSA protein in the blood serum was
calculated from the calibration curve by diluting the serum sample appropriately within the
linear range.
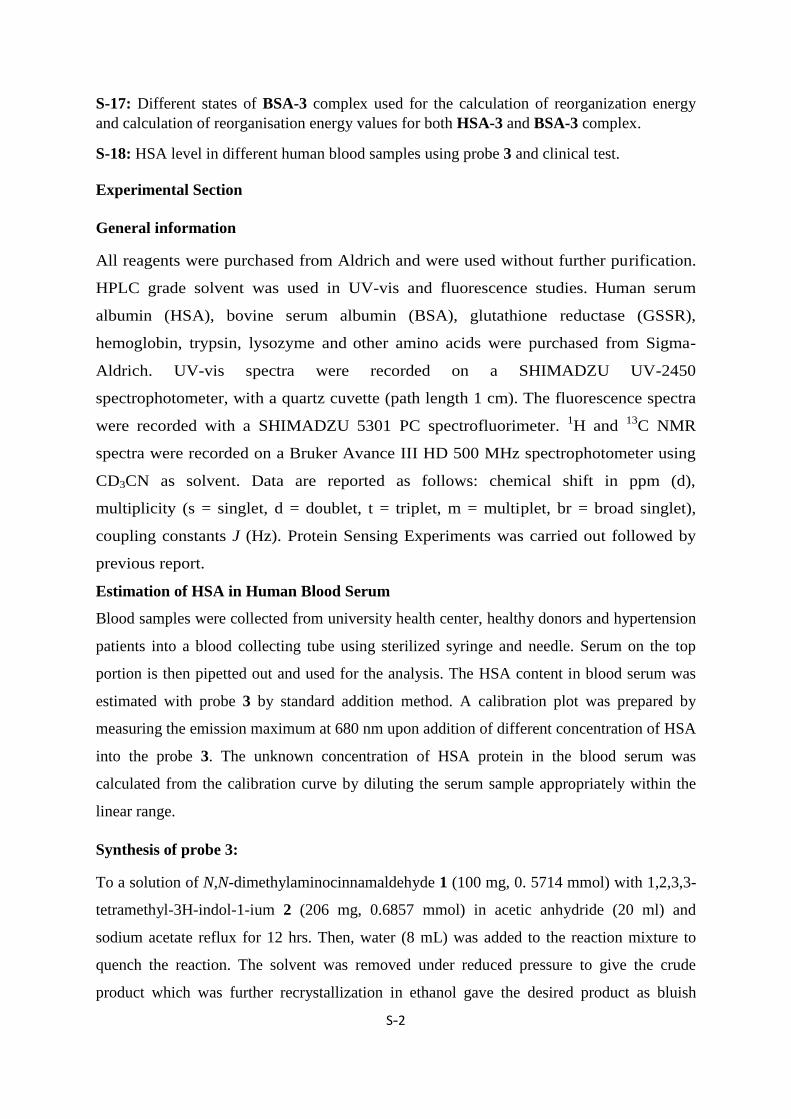
Synthesis of probe 3:
To a solution of N,N-dimethylaminocinnamaldehyde 1 (100 mg, 0. 5714 mmol) with 1,2,3,3-
tetramethyl-3H-indol-1-ium 2 (206 mg, 0.6857 mmol) in acetic anhydride (20 ml) and
sodium acetate reflux for 12 hrs. Then, water (8 mL) was added to the reaction mixture to
quench the reaction. The solvent was removed under reduced pressure to give the crude
product which was further recrystallization in ethanol gave the desired product as bluish
1-10-ArLr
1-10-AsLs
Ns2
Nr
2
Ds
Dr
Фfs = Фfr × × ×
S-3
coloured solid. 1H NMR (CD3CN, 500 MHz ) δ (ppm) = 1.74 (s, 6 H), 3.12 (s, 6 H), 3.81 (s,
3 H), 6.66 (d, J = 10 Hz, 1 H), 6.83 (d, J = 5, 2 H), 7.23-7.18 (m, 1 H), 7.54-7.52 (m, 1 H),
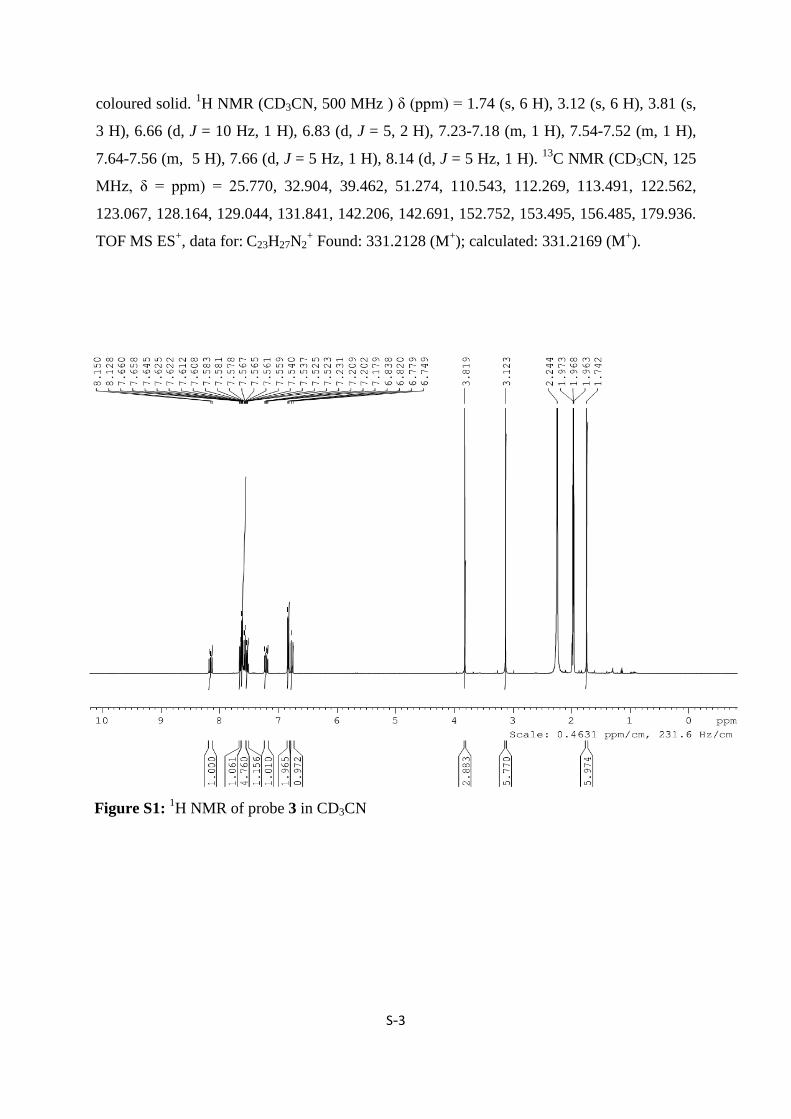
7.64-7.56 (m, 5 H), 7.66 (d, J = 5 Hz, 1 H), 8.14 (d, J = 5 Hz, 1 H). 13
C NMR (CD3CN, 125
MHz, δ = ppm) = 25.770, 32.904, 39.462, 51.274, 110.543, 112.269, 113.491, 122.562,
123.067, 128.164, 129.044, 131.841, 142.206, 142.691, 152.752, 153.495, 156.485, 179.936.
TOF MS ES+, data for: C23H27N2
+ Found: 331.2128 (M
+); calculated: 331.2169 (M
+).
Figure S1: 1H NMR of probe 3 in CD3CN
S-4
Figure S2: 13
C NMR of probe 3 in CD3CN
331.2128
Temp\Rar$DIa0.167: +MS, 0.0-0.5min #2-29
0.00
0.25
0.50
0.75
1.00
1.25
5x10
Intens.
200 400 600 800 m/z
331.2128
+MS, 0.0-0.5min #2-29
0.00
0.25
0.50
0.75
1.00
1.25
1.50
5x10
Intens.
322.5 325.0 327.5 330.0 332.5 335.0 337.5 m/z
Figure S3: Mass spectra of probe 3 (inset expand the region)
S-5
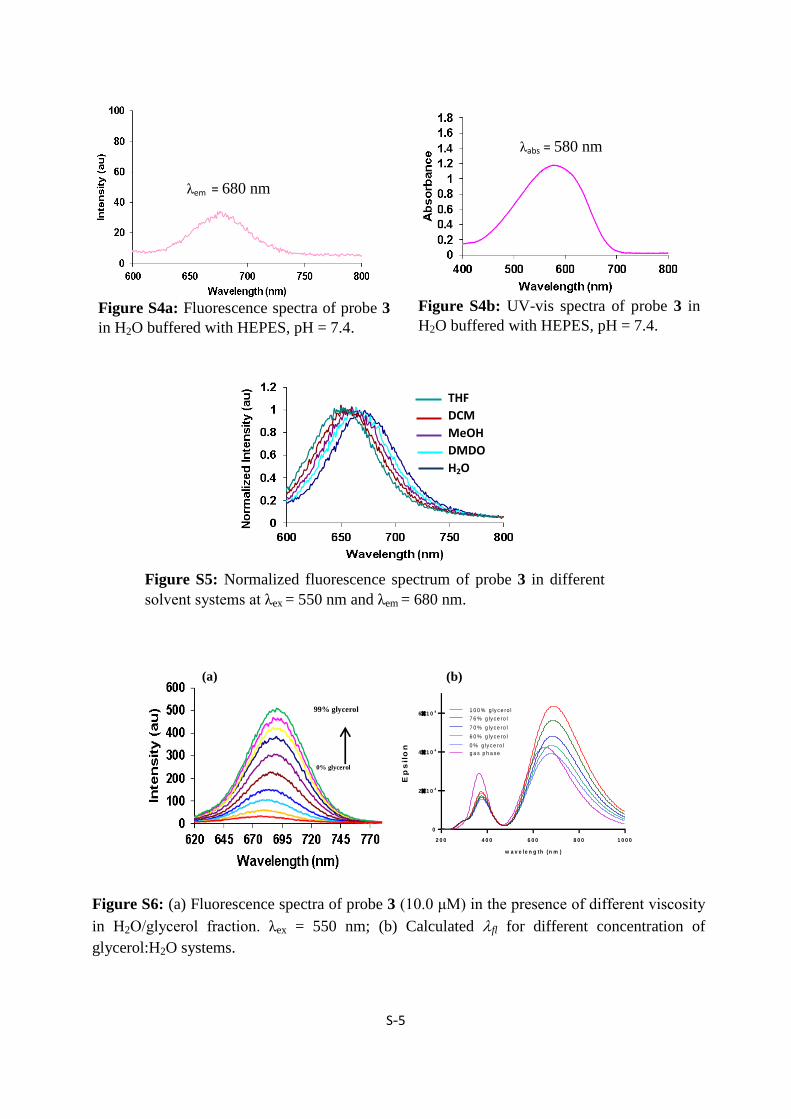
Figure S6: (a) Fluorescence spectra of probe 3 (10.0 μM) in the presence of different viscosity
in H2O/glycerol fraction. λex = 550 nm; (b) Calculated fl for different concentration of
glycerol:H2O systems.
w a v e le n g th (n m )
Ep
sil
on
2 0 0 4 0 0 6 0 0 8 0 0 1 0 0 0
0
21 04
41 04
61 04
g a s p h a s e
0 % g ly c e ro l
6 0 % g ly c e ro l
7 0 % g ly c e ro l
7 6 % g ly c e ro l
1 0 0 % g ly c e ro l
0% glycerol
99% glycerol
(b) (a)
Figure S4b: UV-vis spectra of probe 3 in
H2O buffered with HEPES, pH = 7.4.
λabs = 580 nm
Figure S4a: Fluorescence spectra of probe 3
in H2O buffered with HEPES, pH = 7.4.
λem = 680 nm
THF
DCM
MeOH
DMDO
H2O
Figure S5: Normalized fluorescence spectrum of probe 3 in different
solvent systems at λex = 550 nm and λem = 680 nm.

S-6
Entry Glycerol (percentage) f Dielectric constant Flouresence (abs)
1 0. 0.9659 78.50 676.67
2 60. 1.0705 60.00 680.3
3 70. 1.1885 55.60 684.41
4 76. 1.3915 50.60 686.3
5 100. 1.5729 40.10 688.39
6 Gas phase 1.0489 - 652.23 (520.89)
Table S1.1. Table of structural properties and electrochemical properties at various
concentration of glycerol
0% glycerol 60% glycerol 70% glycerol 76% glycerol glycerol
Ci-C4 1.43323 1.43769 1.43453 1.43552 1.43882
C4-C3 1.38957 1.38526 1.38827 1.38731 1.38423
C3-C2 1.46775 1.47447 1.46976 1.47126 1.47609
C2-C1 1.36745 1.3627 1.366 1.36494 1.36159
C1-Cd 1.50370 1.50802 1.50265 1.50036 1.50009
HOMO -0.13315 -0.13448 -0.13518 -0.13723 -0.14048
LUMO -0.05488 -0.05551 -0.05743 -0.06021 -0.06403
HOMO-1 -0.18312 -0.18435 -0.18579 -0.18772 -0.19268
LUMO+1 -0.04014 -0.03912 -0.03790 -0.03587 -0.03204
Table S1. Theoretical Oscillator strength (CAM-B3LYP 6-311G*) versus concentration
of glycerol
Glycerol (percentage)
Figure S8: Theoretical Oscillator strength vs percentage of glycerol
Figure S7: HOMO-LUMO energy level of probe 3 for ground state and excited state.
Ground State (S0) Excited State (S1)
HOMO
LUMO
S-7
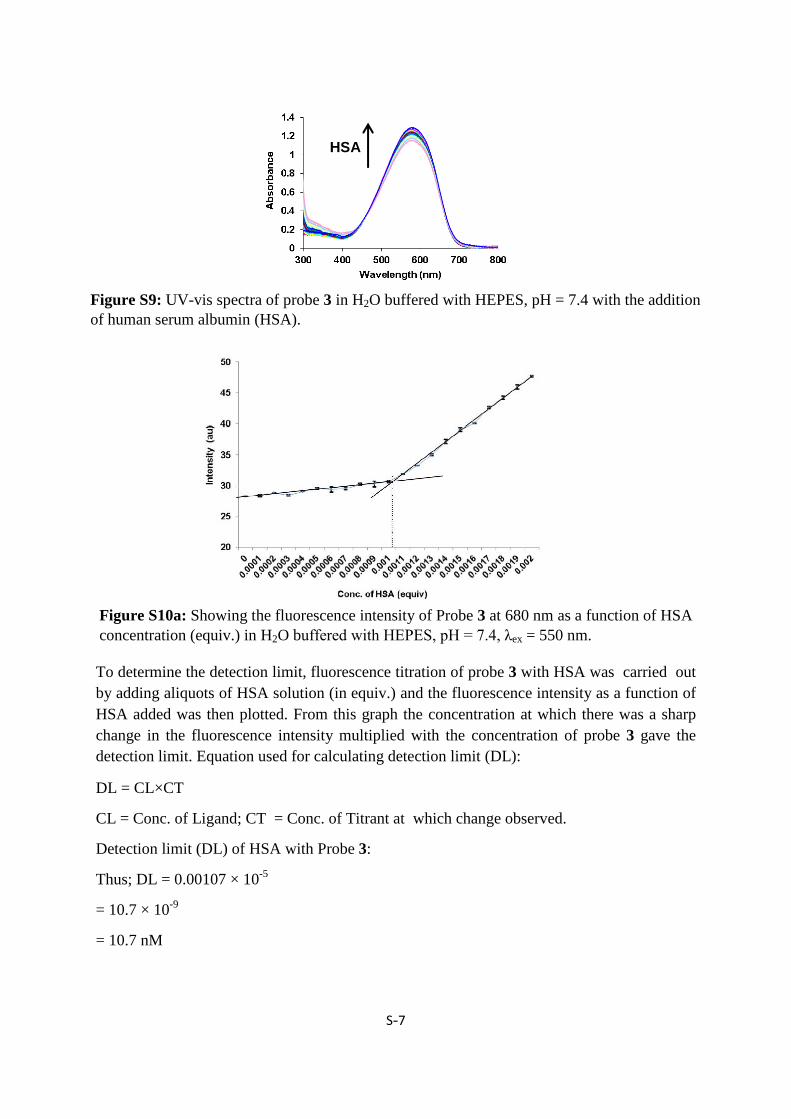
To determine the detection limit, fluorescence titration of probe 3 with HSA was carried out
by adding aliquots of HSA solution (in equiv.) and the fluorescence intensity as a function of
HSA added was then plotted. From this graph the concentration at which there was a sharp
change in the fluorescence intensity multiplied with the concentration of probe 3 gave the
detection limit. Equation used for calculating detection limit (DL):
DL = CL×CT
CL = Conc. of Ligand; CT = Conc. of Titrant at which change observed.
Detection limit (DL) of HSA with Probe 3:
Thus; DL = 0.00107 × 10-5
= 10.7 × 10-9
= 10.7 nM
Figure S10a: Showing the fluorescence intensity of Probe 3 at 680 nm as a function of HSA
concentration (equiv.) in H2O buffered with HEPES, pH = 7.4, λex = 550 nm.
Figure S9: UV-vis spectra of probe 3 in H2O buffered with HEPES, pH = 7.4 with the addition
of human serum albumin (HSA).
HSA

S-8
The detection limit1 was calculated based on the fluorescence titration. To determine the S/N
ratio, the emission intensity of probe 3 without HSA was measured by 10 times and the
standard deviation of blank measurements was determined. The detection limit is then
calculated with the following equation:
DL = 3 × SD/S
Where SD is the standard deviation of the blank solution measured by 10 times; S is the slope
of the calibration curve.
From the graph we get slope (S) = 1797436.36, and SD value is 0.0062
Thus using the formula we get the Detection Limit (DL) = 10.03 × 10⁻⁹
M i.e. probe 3 can
detect HSA in this minimum concentration through fluorescence method.
1 S. Goswami, S. Das, K. Aich, D. Sarkar, T. K. Mondal, C. K. Quah, H.-K. Fun, Dalton Trans., 2013, 42,
15113.
Multiple R 0.981341
R Square 0.96303 Adjusted R Square 0.961084
Standard Error 2.241952
Observations 21
Figure S10b: Showing the fluorescence intensity of Probe 3 at 680 nm as a function of
HSA concentration (equiv.) in H2O buffered with HEPES, pH = 7.4, λex = 550 nm.
Figure S11: Fluorescence selectivity of probe 3 (10.0 μM) in the presence of various analytes
(15 µM HSA and 60 µM for other analytes); 1 = glutathione reductase (GSSR), 2 =
haemoglobin, 3 = trypsin, 4 = DNase, 5 = lysozyme, 6 = cysteine, 7 = BSA, 8 = homocysteine,
9 = glutathione, 10 = HSA, 11 = dithiothreitol, 12 = RNA (4µg/ml), 13 = Glucose, 14 =
ctDNA (5µg/ml).
S-9
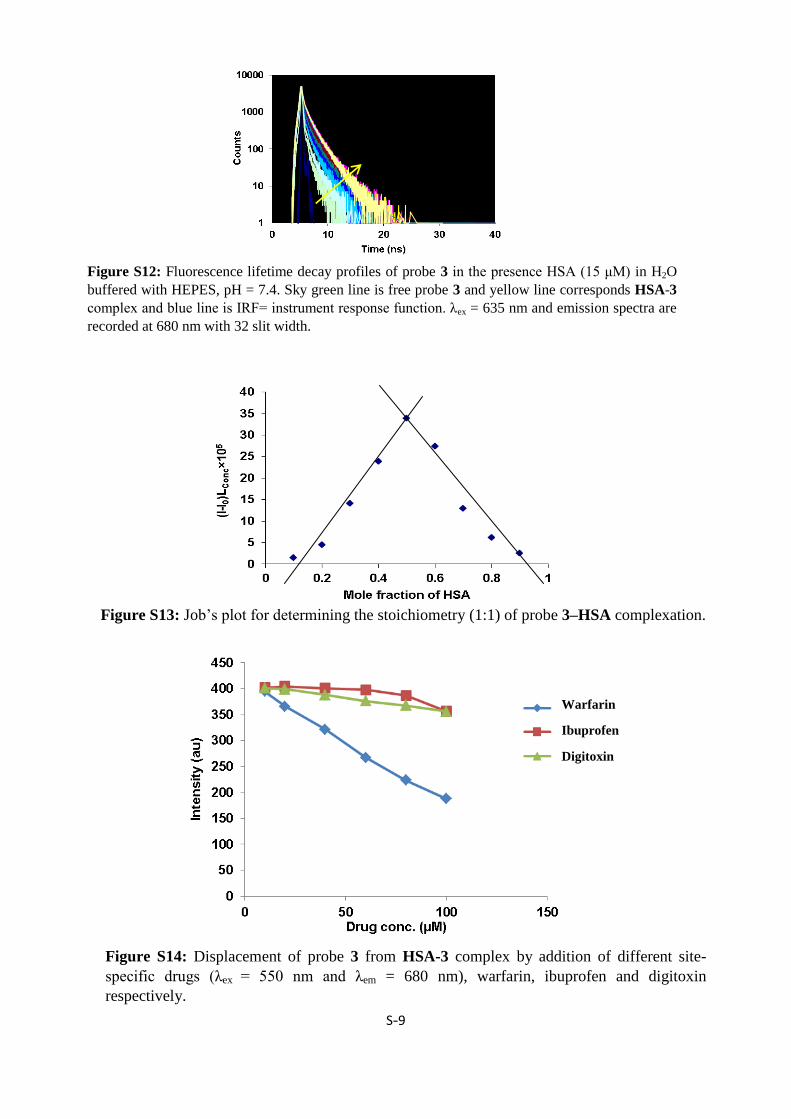
Figure S14: Displacement of probe 3 from HSA-3 complex by addition of different site-
specific drugs (λex = 550 nm and λem = 680 nm), warfarin, ibuprofen and digitoxin
respectively.
Warfarin
Ibuprofen
Digitoxin
Figure S12: Fluorescence lifetime decay profiles of probe 3 in the presence HSA (15 μM) in H2O
buffered with HEPES, pH = 7.4. Sky green line is free probe 3 and yellow line corresponds HSA-3
complex and blue line is IRF= instrument response function. λex = 635 nm and emission spectra are
recorded at 680 nm with 32 slit width.
Figure S13: Job’s plot for determining the stoichiometry (1:1) of probe 3–HSA complexation.

S-10
Figure S16: Docking poses for HSA-3 and BSA-3 complexes
Figure S15: (A) Comparison of the HSA-warfarin complex in docked pose (green) and X-
ray pose (yellow); (B) Superimposed HSA-Warfarin and BSA-warfarin complexes
(alignment score 0.066, RMSD 1.26, pink for HSA and Blue for BSA); ligand-protein
interaction plots of (C) warfarin at HSA site I; (D) warfarin at BSA site I
(A) (B)
(C) (D)

S-11
HOMO = -0.115624au, HOMO-1= 0.14917au; HOMO-2=-0.160727au
LUMO=-0.052122au; LUMO+1=0.038112au; LUMO+2=0.047760au
HOMO= -0.222719au; HOMO-1=-0.244588au; HOMO-2=-0.276831au;
LUMO=-0.176057au; LUMO+1=-0.103816au; LUMO+2=-0.089385au
Table S2: Output results of QM/MM calculation of both the proteins with the respective
probes QM/MM energy S (cal/mol/K,
298K)
Enthalpy
(kcal/mol)
G Total Energy
HSA-war -1058.19 130.881 -11.156 -27.866 -1057.86
BSA-war -1058.01 114.810 -9.359 -24.871 -1057.68
HSA-3 -1026.49 148.187 -14.009 -30.173 -1026.01
BSA-3 -1025.55 135.195 -12.185 -28.123 -1025.05
The ligand and protein preparation jobs were carried out in Schrodinger 2014 suite,
for ligand preparation first diverse conformations were generated in ConfGen protocol using
the OPLS 2005 at Distance-dependant electrostatic mode using the enhanced planarity of the
conjugated pi groups using water as solvent, then the generated conformation were subjected
to LigPrep protocol using the default settings at pH range of 7.0-2.0. Followed by the ligand
preparation the obtained PDB files of HSA (2BXD, co-crystallised with warfarin) and BSA ()
the water molecules (except within 5.0Ao range) and ligands were removed and subjected
under the protein preparation wizard for pre-processing, modifying and refining. Thus
obtained proteins were found with the RMSD of 1.26 and Alignment Score of 0.066 which
than used for (i) Normal Glide docking then the best pose configuration were sorted on the
Figure S18: HOMO-LUMO using the ground state configuration in QM/MM protocol in
BSA-probe complex (DFT631G:OPLS2.1)
Figure S17: HOMO-LUMO using the ground state configuration in QM/MM protocol in
HSA-probe complex (DFT631G:OPLS2.1)

S-12
basis of minimum OPLS energy; (ii) Induced Fit Docking (IFD) protocols. Thus obtained
best poses were subjected to the QM/MM calculation using the DFT/6-31G for the QM
region and Amber for the Molecular mechanics region. The binding energies of the protein-
ligand complexes were also calculated using the Molecular Mechanics/Generalized Born
Surface Area (MM-PBSA) method following the equation Gbind=G(complex)+G(P)+G(L). The
obtained optimised structure of the protein-ligand complexes were used for the calculation of
the emission pattern which was carried out using the trimmed protein (Figure XX). The
optimised structure thus obtained was subjected for the further trimming just to the extent
containing the aromatic amino acid residues for the approximated prediction of the
fluorescence enhancement.
The structure corroborating at the minimum energy was further optimised using the
B3LYP/6-31G* basis set under trimmed protein environment (using NMA and Ac as the
capping group prepared using the Maestro academic edition). The flexibility at the binding
pocket was considered using the Induced fit docking method in the Glide docking protocol in
the Schrodinger 2015 suite. The docking studies depicted that the probe under biological
condition (pH 7.0-3.5) is capable of showing the salt-bridge interaction between the
(dimethylaminophenyl) DMAP-Nitrogen atom and Glu-291 in BSA and 292, 188 in HSA in
both the proteins the ligand was observed in transcoid forms although during ligand
preparation the possible geometrical isomers due to the rotation along C1linker–C2indoline and
C2linker–C3linker was also considered but were not found showing effective results as shown in
the docking results (Table 1 S1). The Induced fit docking was carried out and it was found
that though the pocket captured with the probe in HSA was found slightly lesser than the
BSA especially at the cross section residing the DMAP residues (Table CS area), in addition
the free rotation in the respective pockets was found more restrictive in the case of the HSA
as was analysed through the coordinate scan using the B3LYP/Lanl2mb.
Table S2.1: Cross-section contribution of different fragments of probe (3) in HSA and BSA
protein at site I obtained through docking poses resulted after Induced fit docking protocol.
HSA BSA
Indoline 268.092 268.092
DMAP 336.631 359.945
linker 216.623 216.623
total 634.535 702.79
Table S2.2: Docking Results for the best rotamers obtained from the Normal glide docking
in XP interaction mode. (The Probes was assumed to be capable of attaining the energy
required or the geometrical isomerism for enabling a larger set of input structures which are
similar so as to better detail about the protein-ligands interaction, the best obtained isomers
are given below along reason of their discordance)
Title Shape Sim docking score glide gscore glide evdw glide ecoul glide emodel glide energy
w 0.897 -6.705 -9.482 -45.723 -4.043 -55.819 -49.766
tt_1 0.537 -6.068 -6.075 -39.391 -2.907 -53.923 -42.298
cis-trans_1 0.572 -8.071 -8.078 -42.653 -3.764 -66.437 -46.417
i 0.398 -4.848 -8.694 -21.2 -11.532 -45.551 -32.732
cis-trans 0.614 -5.539 -5.545 -43.615 -3.362 -73.644 -46.977
cis-trans 0.614 -5.799 -5.805 -39.651 -2.134 -62.113 -41.786
tt_1 0.537 -5.128 -7.789 -41.761 -7.935 -62.435 -49.696
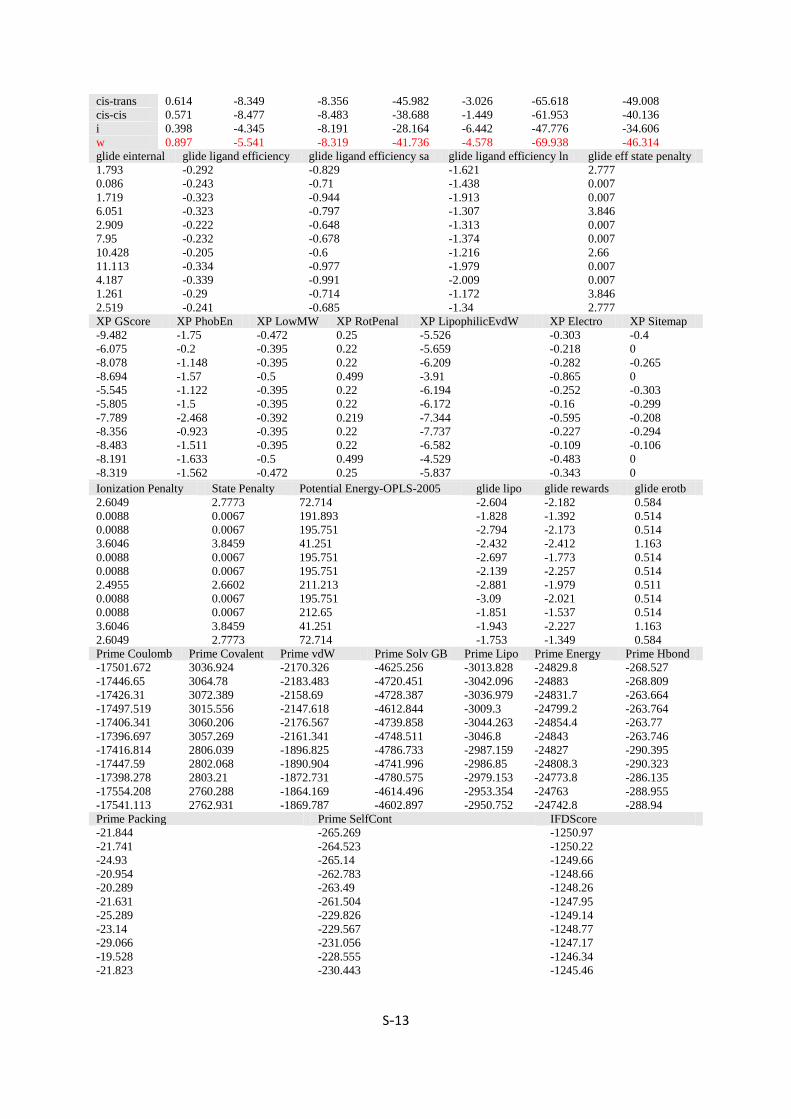
S-13
cis-trans 0.614 -8.349 -8.356 -45.982 -3.026 -65.618 -49.008
cis-cis 0.571 -8.477 -8.483 -38.688 -1.449 -61.953 -40.136
i 0.398 -4.345 -8.191 -28.164 -6.442 -47.776 -34.606
w 0.897 -5.541 -8.319 -41.736 -4.578 -69.938 -46.314
glide einternal glide ligand efficiency glide ligand efficiency sa glide ligand efficiency ln glide eff state penalty
1.793 -0.292 -0.829 -1.621 2.777
0.086 -0.243 -0.71 -1.438 0.007
1.719 -0.323 -0.944 -1.913 0.007
6.051 -0.323 -0.797 -1.307 3.846
2.909 -0.222 -0.648 -1.313 0.007
7.95 -0.232 -0.678 -1.374 0.007
10.428 -0.205 -0.6 -1.216 2.66
11.113 -0.334 -0.977 -1.979 0.007
4.187 -0.339 -0.991 -2.009 0.007
1.261 -0.29 -0.714 -1.172 3.846
2.519 -0.241 -0.685 -1.34 2.777
XP GScore XP PhobEn XP LowMW XP RotPenal XP LipophilicEvdW XP Electro XP Sitemap
-9.482 -1.75 -0.472 0.25 -5.526 -0.303 -0.4
-6.075 -0.2 -0.395 0.22 -5.659 -0.218 0
-8.078 -1.148 -0.395 0.22 -6.209 -0.282 -0.265
-8.694 -1.57 -0.5 0.499 -3.91 -0.865 0
-5.545 -1.122 -0.395 0.22 -6.194 -0.252 -0.303
-5.805 -1.5 -0.395 0.22 -6.172 -0.16 -0.299
-7.789 -2.468 -0.392 0.219 -7.344 -0.595 -0.208
-8.356 -0.923 -0.395 0.22 -7.737 -0.227 -0.294
-8.483 -1.511 -0.395 0.22 -6.582 -0.109 -0.106
-8.191 -1.633 -0.5 0.499 -4.529 -0.483 0
-8.319 -1.562 -0.472 0.25 -5.837 -0.343 0
Ionization Penalty State Penalty Potential Energy-OPLS-2005 glide lipo glide rewards glide erotb
2.6049 2.7773 72.714 -2.604 -2.182 0.584
0.0088 0.0067 191.893 -1.828 -1.392 0.514
0.0088 0.0067 195.751 -2.794 -2.173 0.514
3.6046 3.8459 41.251 -2.432 -2.412 1.163
0.0088 0.0067 195.751 -2.697 -1.773 0.514
0.0088 0.0067 195.751 -2.139 -2.257 0.514
2.4955 2.6602 211.213 -2.881 -1.979 0.511
0.0088 0.0067 195.751 -3.09 -2.021 0.514
0.0088 0.0067 212.65 -1.851 -1.537 0.514
3.6046 3.8459 41.251 -1.943 -2.227 1.163
2.6049 2.7773 72.714 -1.753 -1.349 0.584
Prime Coulomb Prime Covalent Prime vdW Prime Solv GB Prime Lipo Prime Energy Prime Hbond
-17501.672 3036.924 -2170.326 -4625.256 -3013.828 -24829.8 -268.527
-17446.65 3064.78 -2183.483 -4720.451 -3042.096 -24883 -268.809
-17426.31 3072.389 -2158.69 -4728.387 -3036.979 -24831.7 -263.664
-17497.519 3015.556 -2147.618 -4612.844 -3009.3 -24799.2 -263.764
-17406.341 3060.206 -2176.567 -4739.858 -3044.263 -24854.4 -263.77
-17396.697 3057.269 -2161.341 -4748.511 -3046.8 -24843 -263.746
-17416.814 2806.039 -1896.825 -4786.733 -2987.159 -24827 -290.395
-17447.59 2802.068 -1890.904 -4741.996 -2986.85 -24808.3 -290.323
-17398.278 2803.21 -1872.731 -4780.575 -2979.153 -24773.8 -286.135
-17554.208 2760.288 -1864.169 -4614.496 -2953.354 -24763 -288.955
-17541.113 2762.931 -1869.787 -4602.897 -2950.752 -24742.8 -288.94
Prime Packing Prime SelfCont IFDScore
-21.844 -265.269 -1250.97
-21.741 -264.523 -1250.22
-24.93 -265.14 -1249.66
-20.954 -262.783 -1248.66
-20.289 -263.49 -1248.26
-21.631 -261.504 -1247.95
-25.289 -229.826 -1249.14
-23.14 -229.567 -1248.77
-29.066 -231.056 -1247.17
-19.528 -228.555 -1246.34
-21.823 -230.443 -1245.46
S-14
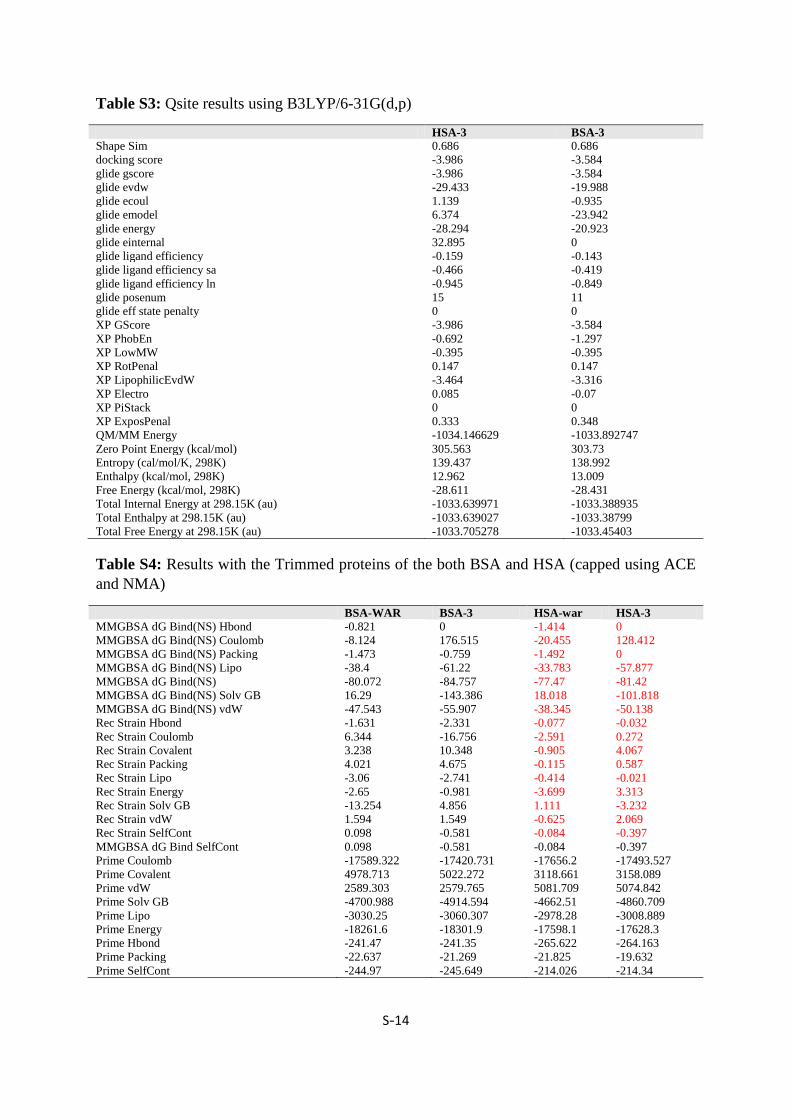
Table S3: Qsite results using B3LYP/6-31G(d,p)
HSA-3 BSA-3
Shape Sim 0.686 0.686
docking score -3.986 -3.584
glide gscore -3.986 -3.584
glide evdw -29.433 -19.988
glide ecoul 1.139 -0.935
glide emodel 6.374 -23.942
glide energy -28.294 -20.923
glide einternal 32.895 0
glide ligand efficiency -0.159 -0.143
glide ligand efficiency sa -0.466 -0.419
glide ligand efficiency ln -0.945 -0.849
glide posenum 15 11
glide eff state penalty 0 0
XP GScore -3.986 -3.584
XP PhobEn -0.692 -1.297
XP LowMW -0.395 -0.395
XP RotPenal 0.147 0.147
XP LipophilicEvdW -3.464 -3.316
XP Electro 0.085 -0.07
XP PiStack 0 0
XP ExposPenal 0.333 0.348
QM/MM Energy -1034.146629 -1033.892747
Zero Point Energy (kcal/mol) 305.563 303.73
Entropy (cal/mol/K, 298K) 139.437 138.992
Enthalpy (kcal/mol, 298K) 12.962 13.009
Free Energy (kcal/mol, 298K) -28.611 -28.431
Total Internal Energy at 298.15K (au) -1033.639971 -1033.388935
Total Enthalpy at 298.15K (au) -1033.639027 -1033.38799
Total Free Energy at 298.15K (au) -1033.705278 -1033.45403
Table S4: Results with the Trimmed proteins of the both BSA and HSA (capped using ACE
and NMA)
BSA-WAR BSA-3 HSA-war HSA-3
MMGBSA dG Bind(NS) Hbond -0.821 0 -1.414 0
MMGBSA dG Bind(NS) Coulomb -8.124 176.515 -20.455 128.412
MMGBSA dG Bind(NS) Packing -1.473 -0.759 -1.492 0
MMGBSA dG Bind(NS) Lipo -38.4 -61.22 -33.783 -57.877
MMGBSA dG Bind(NS) -80.072 -84.757 -77.47 -81.42
MMGBSA dG Bind(NS) Solv GB 16.29 -143.386 18.018 -101.818
MMGBSA dG Bind(NS) vdW -47.543 -55.907 -38.345 -50.138
Rec Strain Hbond -1.631 -2.331 -0.077 -0.032
Rec Strain Coulomb 6.344 -16.756 -2.591 0.272
Rec Strain Covalent 3.238 10.348 -0.905 4.067
Rec Strain Packing 4.021 4.675 -0.115 0.587
Rec Strain Lipo -3.06 -2.741 -0.414 -0.021
Rec Strain Energy -2.65 -0.981 -3.699 3.313
Rec Strain Solv GB -13.254 4.856 1.111 -3.232
Rec Strain vdW 1.594 1.549 -0.625 2.069
Rec Strain SelfCont 0.098 -0.581 -0.084 -0.397
MMGBSA dG Bind SelfCont 0.098 -0.581 -0.084 -0.397
Prime Coulomb -17589.322 -17420.731 -17656.2 -17493.527
Prime Covalent 4978.713 5022.272 3118.661 3158.089
Prime vdW 2589.303 2579.765 5081.709 5074.842
Prime Solv GB -4700.988 -4914.594 -4662.51 -4860.709
Prime Lipo -3030.25 -3060.307 -2978.28 -3008.889
Prime Energy -18261.6 -18301.9 -17598.1 -17628.3
Prime Hbond -241.47 -241.35 -265.622 -264.163
Prime Packing -22.637 -21.269 -21.825 -19.632
Prime SelfCont -244.97 -245.649 -214.026 -214.34
S-15
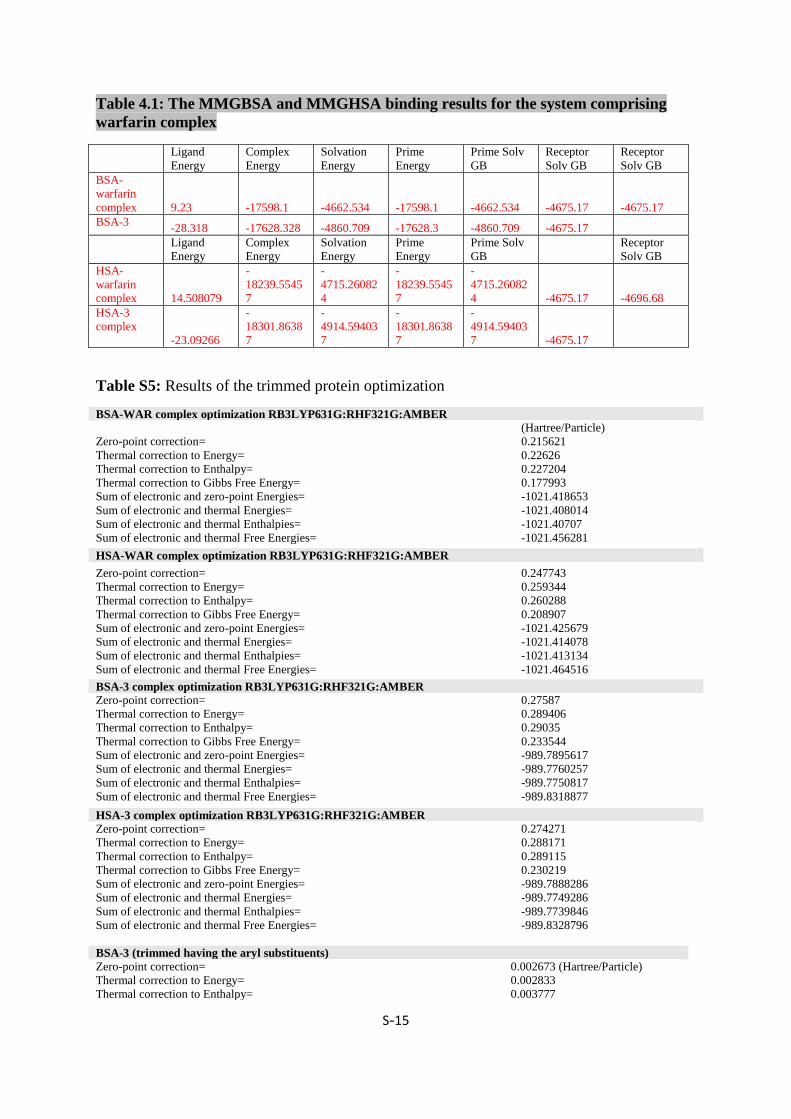
Table 4.1: The MMGBSA and MMGHSA binding results for the system comprising
warfarin complex
Ligand
Energy
Complex
Energy
Solvation
Energy
Prime
Energy
Prime Solv
GB
Receptor
Solv GB
Receptor
Solv GB
BSA-
warfarin
complex 9.23 -17598.1 -4662.534 -17598.1 -4662.534 -4675.17 -4675.17
BSA-3 -28.318 -17628.328 -4860.709 -17628.3 -4860.709 -4675.17
Ligand
Energy
Complex
Energy
Solvation
Energy
Prime
Energy
Prime Solv
GB
Receptor
Solv GB
HSA-
warfarin
complex 14.508079
-
18239.5545
7
-
4715.26082
4
-
18239.5545
7
-
4715.26082
4 -4675.17 -4696.68
HSA-3
complex
-23.09266
-
18301.8638
7
-
4914.59403
7
-
18301.8638
7
-
4914.59403
7 -4675.17
Table S5: Results of the trimmed protein optimization
BSA-WAR complex optimization RB3LYP631G:RHF321G:AMBER
(Hartree/Particle)
Zero-point correction= 0.215621
Thermal correction to Energy= 0.22626
Thermal correction to Enthalpy= 0.227204
Thermal correction to Gibbs Free Energy= 0.177993
Sum of electronic and zero-point Energies= -1021.418653
Sum of electronic and thermal Energies= -1021.408014
Sum of electronic and thermal Enthalpies= -1021.40707
Sum of electronic and thermal Free Energies= -1021.456281
HSA-WAR complex optimization RB3LYP631G:RHF321G:AMBER
Zero-point correction= 0.247743
Thermal correction to Energy= 0.259344
Thermal correction to Enthalpy= 0.260288
Thermal correction to Gibbs Free Energy= 0.208907
Sum of electronic and zero-point Energies= -1021.425679
Sum of electronic and thermal Energies= -1021.414078
Sum of electronic and thermal Enthalpies= -1021.413134
Sum of electronic and thermal Free Energies= -1021.464516
BSA-3 complex optimization RB3LYP631G:RHF321G:AMBER Zero-point correction= 0.27587
Thermal correction to Energy= 0.289406
Thermal correction to Enthalpy= 0.29035
Thermal correction to Gibbs Free Energy= 0.233544
Sum of electronic and zero-point Energies= -989.7895617
Sum of electronic and thermal Energies= -989.7760257
Sum of electronic and thermal Enthalpies= -989.7750817
Sum of electronic and thermal Free Energies= -989.8318877
HSA-3 complex optimization RB3LYP631G:RHF321G:AMBER Zero-point correction= 0.274271
Thermal correction to Energy= 0.288171
Thermal correction to Enthalpy= 0.289115
Thermal correction to Gibbs Free Energy= 0.230219
Sum of electronic and zero-point Energies= -989.7888286
Sum of electronic and thermal Energies= -989.7749286
Sum of electronic and thermal Enthalpies= -989.7739846
Sum of electronic and thermal Free Energies= -989.8328796
BSA-3 (trimmed having the aryl substituents) Zero-point correction= 0.002673 (Hartree/Particle)
Thermal correction to Energy= 0.002833
Thermal correction to Enthalpy= 0.003777

S-16
Thermal correction to Gibbs Free Energy= 0.041192
Sum of electronic and zero-point Energies= -5369.857635
Sum of electronic and thermal Energies= -5369.854802
Sum of electronic and thermal Enthalpies= -5369.853858
Sum of electronic and thermal Free Energies= -5369.898827
HSA-3 (trimmed having the aryl substituents) Zero-point correction= 0.002631 (Hartree/Particle)
Thermal correction to Energy= 0.002833
Thermal correction to Enthalpy= 0.003777
Thermal correction to Gibbs Free Energy= 0.041401
Sum of electronic and zero-point Energies= -5539.909437
Sum of electronic and thermal Energies= -5539.906604
Sum of electronic and thermal Enthalpies= -5539.90566
Sum of electronic and thermal Free Energies= -5539.950837
Ground State (S0) Ground Excitation
State (S0)*
First Excitation
State (S1)
Emission
State (S1)°
HOMO
LUMO
Tyr150
Trp214
Phe149
Phe221
Arg222
Figure S19: Different states of HSA-3 complex used for the calculation of reorganization
energy.
S-17
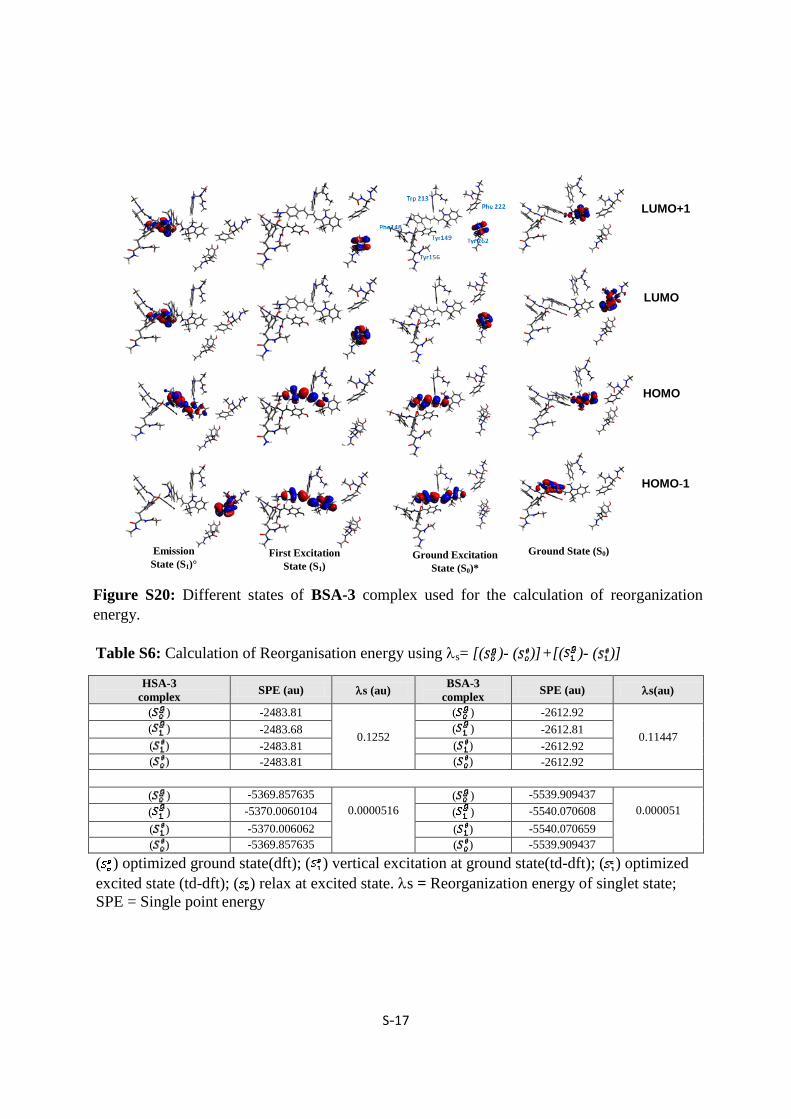
Table S6: Calculation of Reorganisation energy using s= [( )- ( )]+[( )- ( )]
HSA-3
complex SPE (au) s (au)
BSA-3
complex SPE (au) s(au)
( ) -2483.81
0.1252
( ) -2612.92
0.11447 ( ) -2483.68 ( ) -2612.81
( ) -2483.81 ( ) -2612.92
( ) -2483.81 ( ) -2612.92
( ) -5369.857635
0.0000516
( ) -5539.909437
0.000051 ( ) -5370.0060104 ( ) -5540.070608
( ) -5370.006062 ( ) -5540.070659
( ) -5369.857635 ( ) -5539.909437
( ) optimized ground state(dft); ( ) vertical excitation at ground state(td-dft); ( ) optimized
excited state (td-dft); ( ) relax at excited state. s = Reorganization energy of singlet state;
SPE = Single point energy
Ground State (S0)
Ground Excitation
State (S0)*
First Excitation
State (S1)
Emission
State (S1)°
HOMO
HOMO-1
LUMO
LUMO+1
Figure S20: Different states of BSA-3 complex used for the calculation of reorganization
energy.

S-18
Estimated HSA level using probe 3 for
hypertension patients
Estimated HSA level using clinical test
for hypertension patients
Estimated HSA level using clinical test
for healthy normal donors Estimated HSA level using probe 3 for
healthy normal donors
Figure S22: Data obtained for HSA level using probe 3 in six different samples comprising of
normal and hypertension blood samples from fluorometric assay as well was clinical data.
(a) (b)
Figure S21: Data obtained for the HSA level using probe 3 in six different samples
(normal blood samples); (b) data obtained from clinical laboratory using the standard
procedure.


![NIR SIG Administration, by Toshio Tachibana [APNIC 38 / NIR SIG]](https://img.dokumen.tips/doc/110x75/58e949311a28ab262c8b4ecb/nir-sig-administration-by-toshio-tachibana-apnic-38-nir-sig.jpg)