Embed Size (px)
Citation preview
Poweredby:
ElectrificationoftheChemicalIndustry
1
Poweredby:TNO&ECN
• Threewhat-ifelectrificationscenariosdemonstratethatreductionoflifecycleCO2emissionstonear0in2050istechnicallypossible;
• Requiredrenewableelectricitypotentialsarelarge:1,5–2,5timestheDutchNorthseawindenergypotential;
• LifecycleCO2emissionsofheavyindustryandtransportarecomparabletototalDutchGHGemissions(219MtCO2eq);
• Twoscenarios,AllelectricandBigonhydrogen,showpossibilitiesforfossilfuelindependence.TheCompetitionscenarioshowsthepossibilitieswhilerelyingpartlyonconventionaltechnologywithCCS;
• Eachscenarioneedsitsowninfrastructurewithitschallenges;• Afavourablescenarioislikelyacombination.
2
Poweredby:TNO&ECN
• Objective• Approach&modelset-up• Methodology&assumptions• Threewhat-ifelectrificationscenarios• Results• Conclusions&recommendations
3
Poweredby:TNO&ECN
ToexploredeepdecarbonisationscenariosforthedemandoftheDutchheavyindustryin2050,throughelectrificationoftheproductionofbasicmaterialsandtransportationfuels• identifythetechnicalfeasibility,• requiredfeedstockandenergypotentialsand• prosandconsofdifferentelectrificationpathways
4
Poweredby:TNO&ECN
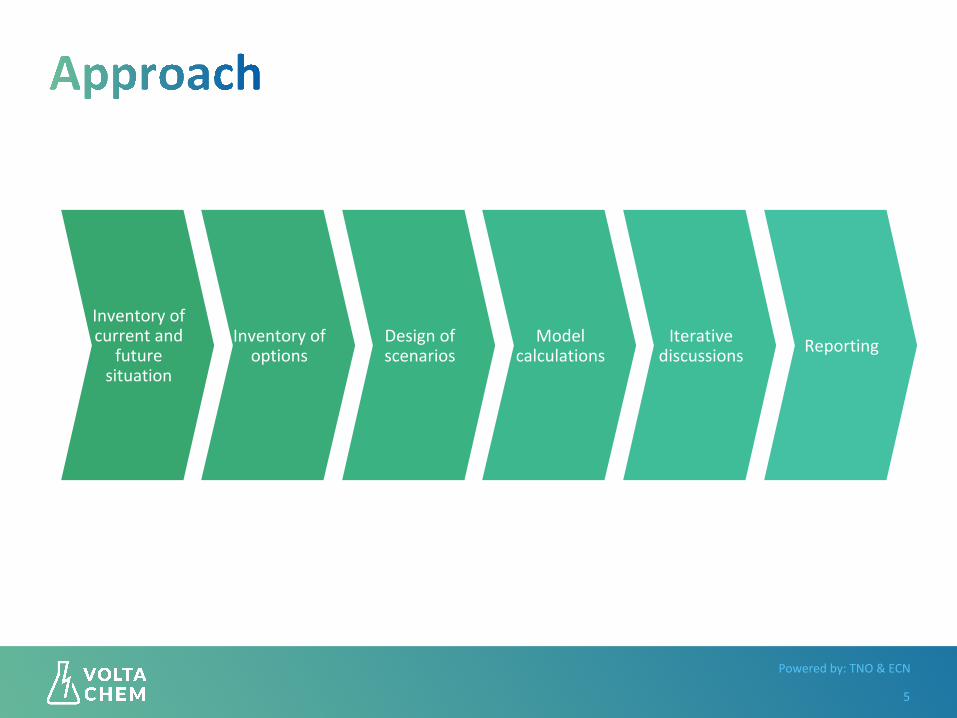
5
Inventoryofcurrentand
futuresituation
Inventoryofoptions
Designofscenarios
Modelcalculations
Iterativediscussions Reporting
Poweredby:TNO&ECN
6
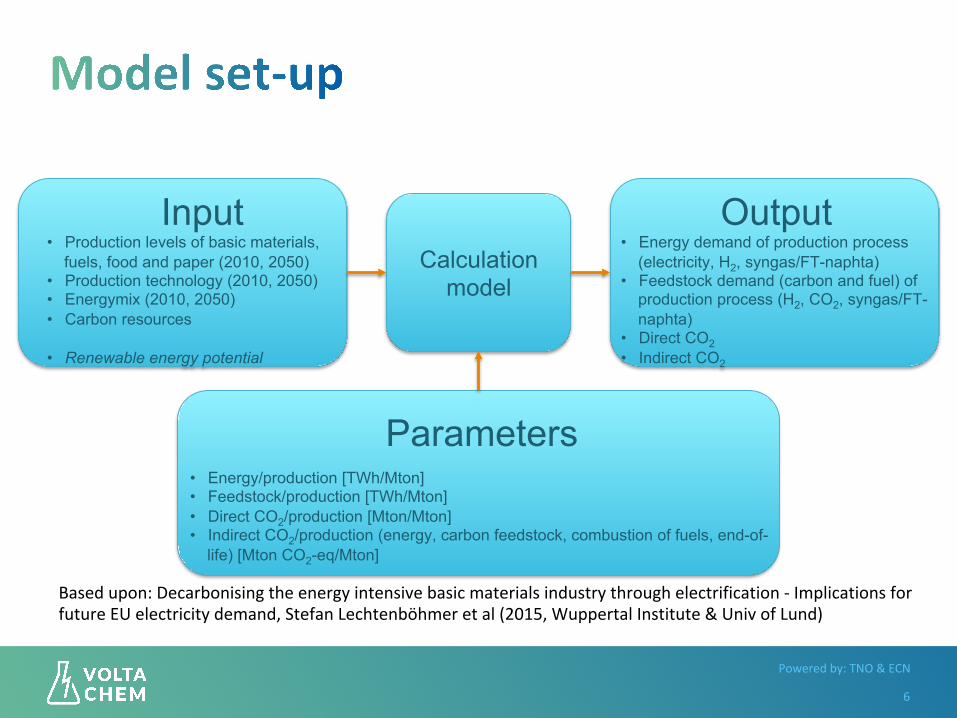
Basedupon:Decarbonisingtheenergyintensivebasicmaterialsindustrythroughelectrification-ImplicationsforfutureEUelectricitydemand,StefanLechtenböhmeretal(2015,WuppertalInstitute&UnivofLund)
Calculation model
Input • Production levels of basic materials,
fuels, food and paper (2010, 2050) • Production technology (2010, 2050) • Energymix (2010, 2050) • Carbon resources
• Renewable energy potential
Output • Energy demand of production process
(electricity, H2, syngas/FT-naphta) • Feedstock demand (carbon and fuel) of
production process (H2, CO2, syngas/FT-naphta)
• Direct CO2 • Indirect CO2
Parameters
• Energy/production [TWh/Mton] • Feedstock/production [TWh/Mton] • Direct CO2/production [Mton/Mton] • Indirect CO2/production (energy, carbon feedstock, combustion of fuels, end-of-
life) [Mton CO2-eq/Mton]
Poweredby:TNO&ECN
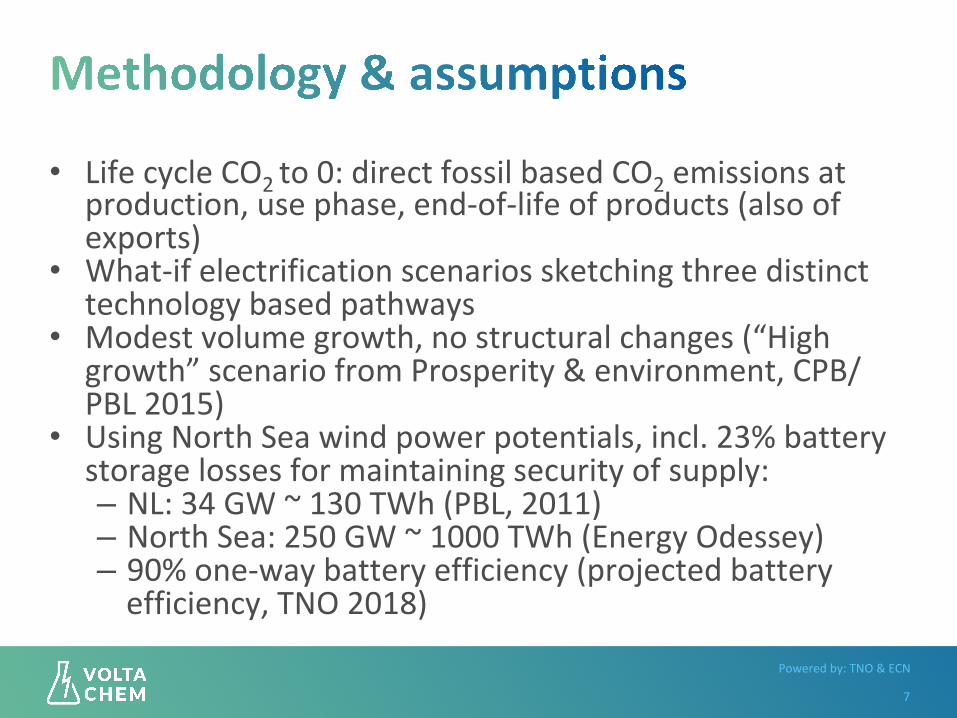
• LifecycleCO2to0:directfossilbasedCO2emissionsat
production,usephase,end-of-lifeofproducts(alsoofexports)
• What-ifelectrificationscenariossketchingthreedistincttechnologybasedpathways
• Modestvolumegrowth,nostructuralchanges(“Highgrowth”scenariofromProsperity&environment,CPB/PBL2015)
• UsingNorthSeawindpowerpotentials,incl.23%batterystoragelossesformaintainingsecurityofsupply:– NL:34GW~130TWh(PBL,2011)– NorthSea:250GW~1000TWh(EnergyOdessey)– 90%one-waybatteryefficiency(projectedbatteryefficiency,TNO2018)
7
Poweredby:TNO&ECN
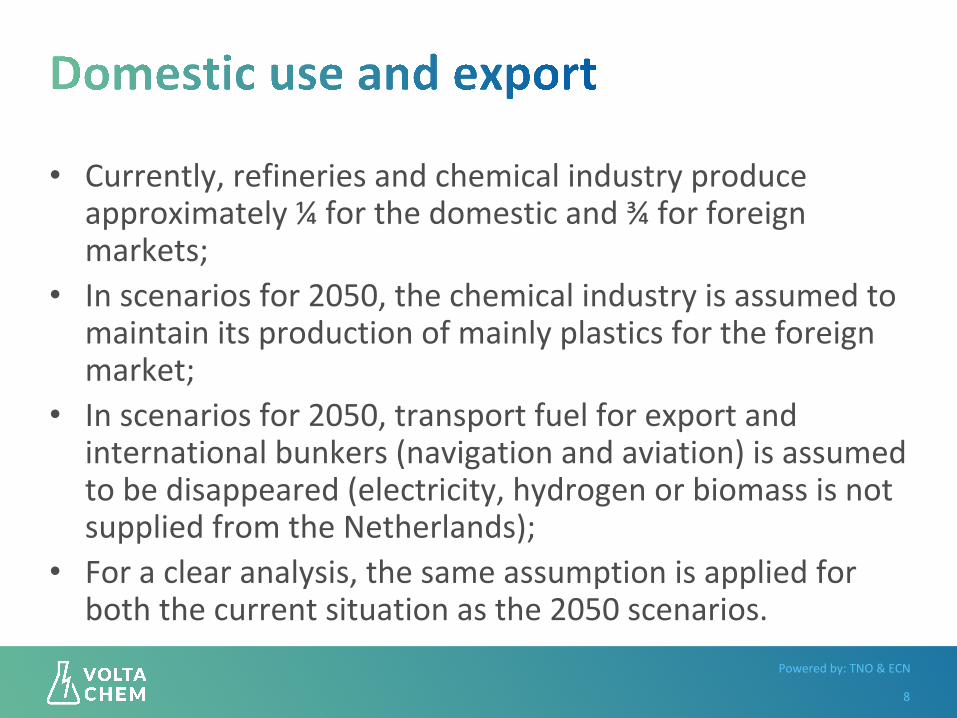
• Currently,refineriesandchemicalindustryproduceapproximately¼forthedomesticand¾forforeignmarkets;
• Inscenariosfor2050,thechemicalindustryisassumedtomaintainitsproductionofmainlyplasticsfortheforeignmarket;
• Inscenariosfor2050,transportfuelforexportandinternationalbunkers(navigationandaviation)isassumedtobedisappeared(electricity,hydrogenorbiomassisnotsuppliedfromtheNetherlands);
• Foraclearanalysis,thesameassumptionisappliedforboththecurrentsituationasthe2050scenarios.
8
Poweredby:TNO&ECN
9
Poweredby:TNO&ECN
10
ScenarioAllelectric&
Bigonhydrogen
ScenarioCom
petition
Currentsituation
Thisstudy:Deepdecarbonisation
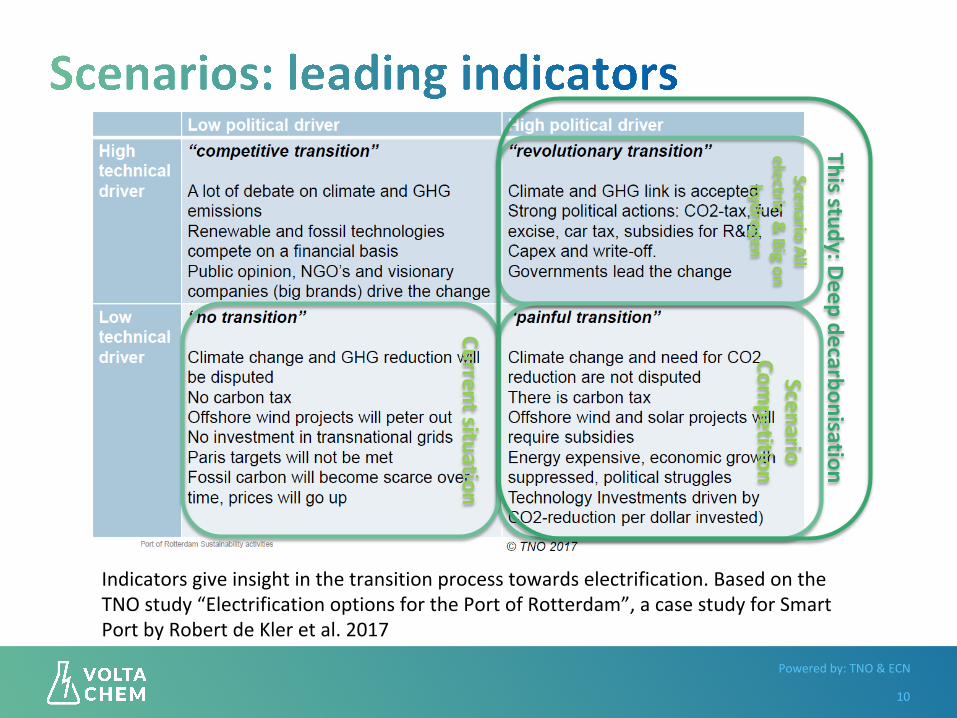
Indicatorsgiveinsightinthetransitionprocesstowardselectrification.BasedontheTNOstudy“ElectrificationoptionsforthePortofRotterdam”,acasestudyforSmartPortbyRobertdeKleretal.2017
Poweredby:TNO&ECN
11
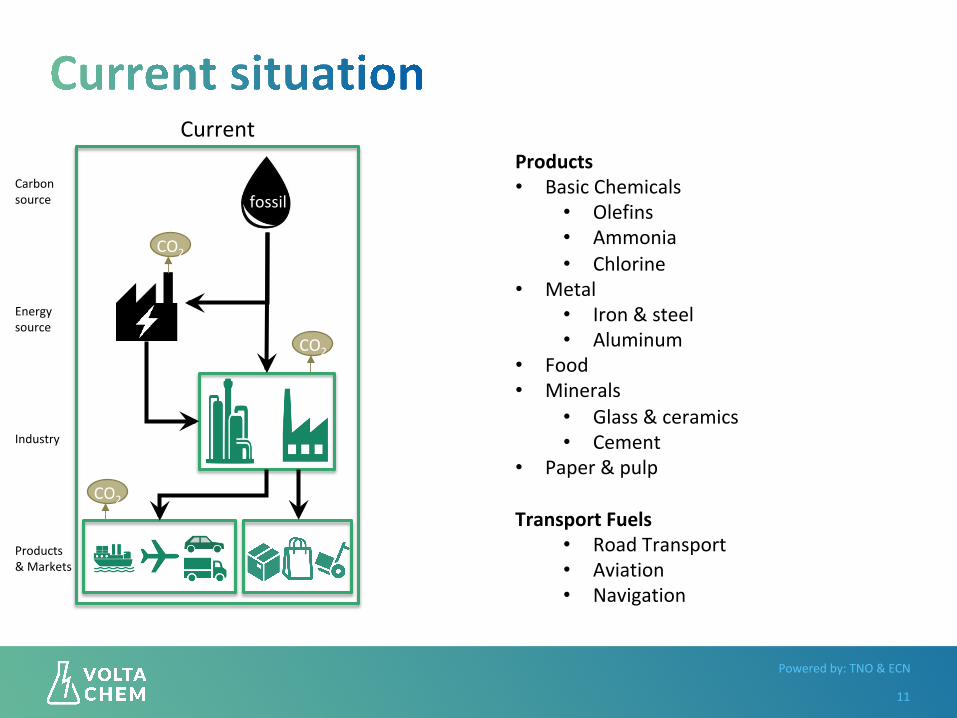
CarbonsourceEnergysourceIndustryProducts&Markets
Products• BasicChemicals
• Olefins• Ammonia• Chlorine
• Metal• Iron&steel• Aluminum
• Food• Minerals
• Glass&ceramics• Cement
• Paper&pulp
TransportFuels• RoadTransport• Aviation• Navigation
fossilCO2
Current
CO2
CO2
CO2
Poweredby:TNO&ECN
H2
12
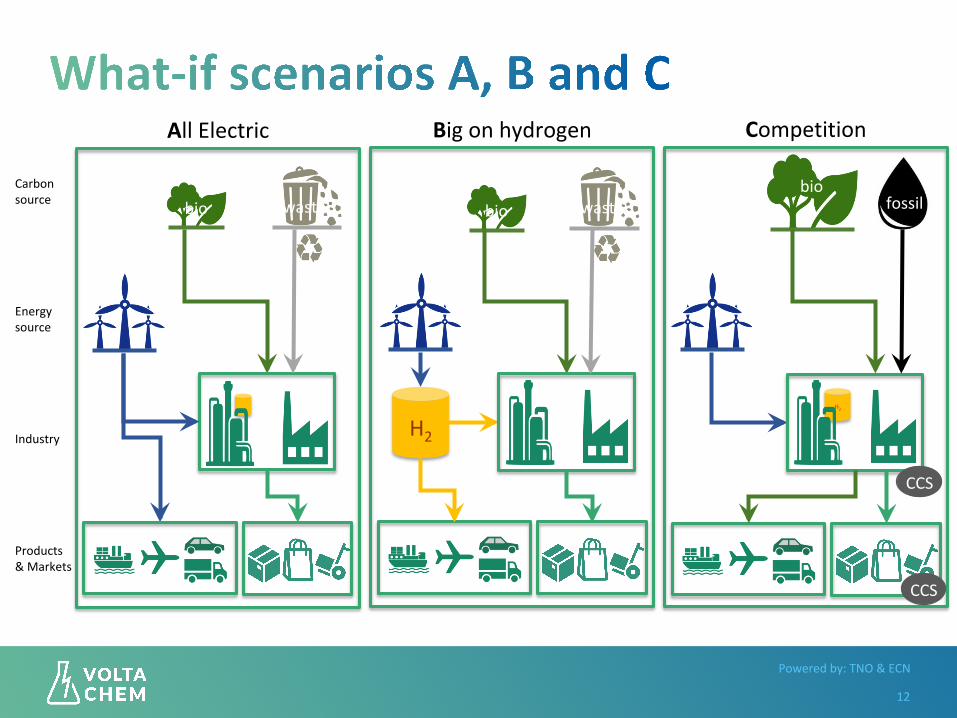
CarbonsourceEnergysourceIndustryProducts&Markets
AllElectric
wastebio
H2
bio
Bigonhydrogen
waste
H2
fossilCO2 bio
Competition
CCS
CCS
Poweredby:TNO&ECN
13
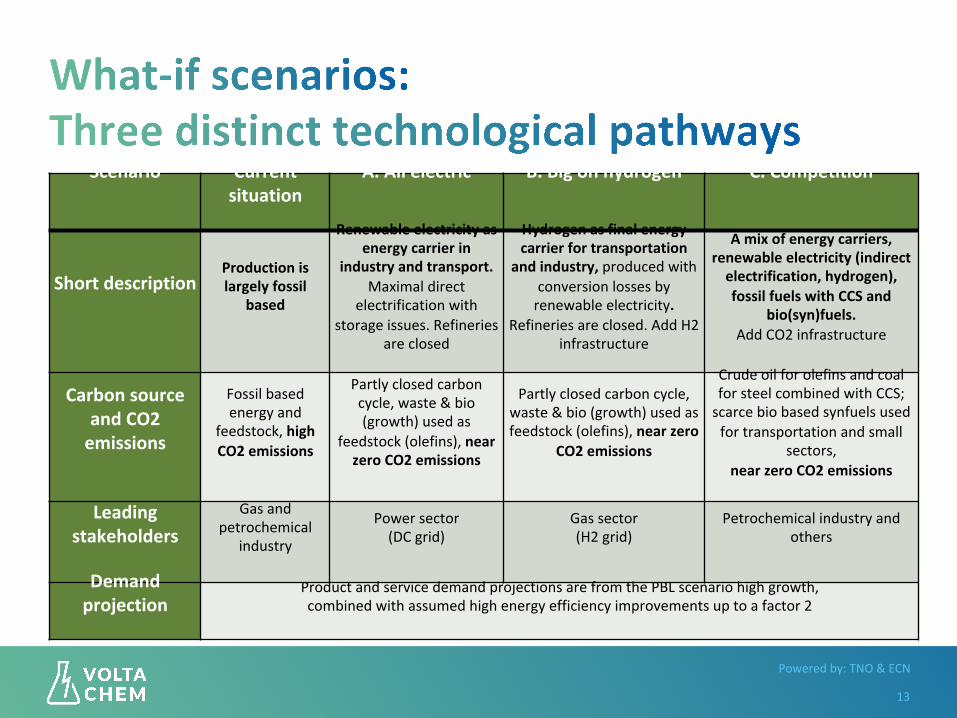
Scenario Currentsituation
A.Allelectric B.Bigonhydrogen C.Competition
ShortdescriptionProductionislargelyfossil
based
Renewableelectricityasenergycarrierin
industryandtransport.Maximaldirect
electrificationwithstorageissues.Refineries
areclosed
Hydrogenasfinalenergycarrierfortransportation
andindustry,producedwithconversionlossesbyrenewableelectricity.
Refineriesareclosed.AddH2infrastructure
Amixofenergycarriers,renewableelectricity(indirectelectrification,hydrogen),fossilfuelswithCCSand
bio(syn)fuels.AddCO2infrastructure
CarbonsourceandCO2emissions
Fossilbasedenergyand
feedstock,highCO2emissions
Partlyclosedcarboncycle,waste&bio(growth)usedas
feedstock(olefins),nearzeroCO2emissions
Partlyclosedcarboncycle,waste&bio(growth)usedasfeedstock(olefins),nearzero
CO2emissions
CrudeoilforolefinsandcoalforsteelcombinedwithCCS;scarcebiobasedsynfuelsusedfortransportationandsmall
sectors,nearzeroCO2emissions
Leadingstakeholders
Gasandpetrochemical
industryPowersector(DCgrid)
Gassector(H2grid)
Petrochemicalindustryandothers
Demandprojection
ProductandservicedemandprojectionsarefromthePBLscenariohighgrowth,combinedwithassumedhighenergyefficiencyimprovementsuptoafactor2
Poweredby:TNO&ECN
14
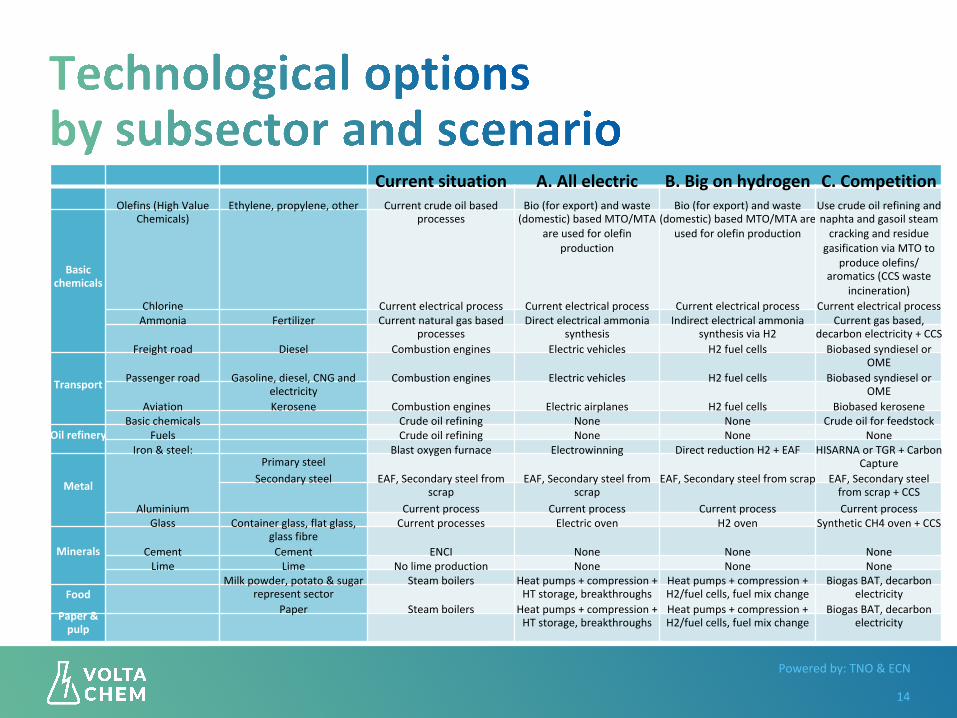
Sector Subsector Product ProcessesCurrentsituation A.Allelectric B.Bigonhydrogen C.Competition
Basicchemicals
Olefins(HighValueChemicals)
Ethylene,propylene,other Currentcrudeoilbasedprocesses
Bio(forexport)andwaste(domestic)basedMTO/MTA
areusedforolefinproduction
Bio(forexport)andwaste(domestic)basedMTO/MTAare
usedforolefinproduction
UsecrudeoilrefiningandnaphtaandgasoilsteamcrackingandresiduegasificationviaMTOto
produceolefins/aromatics(CCSwaste
incineration) Chlorine Currentelectricalprocess Currentelectricalprocess Currentelectricalprocess Currentelectricalprocess Ammonia Fertilizer Currentnaturalgasbased
processes Directelectricalammonia
synthesis Indirectelectricalammonia
synthesisviaH2 Currentgasbased,
decarbonelectricity+CCS
Transport
Freightroad Diesel Combustionengines Electricvehicles H2fuelcells BiobasedsyndieselorOME
Passengerroad Gasoline,diesel,CNGandelectricity
Combustionengines Electricvehicles H2fuelcells BiobasedsyndieselorOME
Aviation Kerosene Combustionengines Electricairplanes H2fuelcells Biobasedkerosene
Oilrefinery Basicchemicals Crudeoilrefining None None Crudeoilforfeedstock
Fuels Crudeoilrefining None None None
Metal
Iron&steel: Primarysteel Blastoxygenfurnace Electrowinning DirectreductionH2+EAF HISARNAorTGR+Carbon
Capture Secondarysteel
EAF,Secondarysteelfrom
scrap EAF,Secondarysteelfrom
scrap EAF,Secondarysteelfromscrap EAF,Secondarysteel
fromscrap+CCS Aluminium Currentprocess Currentprocess Currentprocess Currentprocess
Minerals
Glass Containerglass,flatglass,glassfibre
Currentprocesses Electricoven H2oven SyntheticCH4oven+CCS
Cement Cement ENCI None None None Lime Lime Nolimeproduction None None None
Food Milkpowder,potato&sugar
representsectorSteamboilers Heatpumps+compression+
HTstorage,breakthroughs Heatpumps+compression+H2/fuelcells,fuelmixchange
BiogasBAT,decarbonelectricity
Paper&pulp
Paper Steamboilers Heatpumps+compression+HTstorage,breakthroughs
Heatpumps+compression+H2/fuelcells,fuelmixchange
BiogasBAT,decarbonelectricity

Poweredby:TNO&ECN
15
Poweredby:TNO&ECN
16
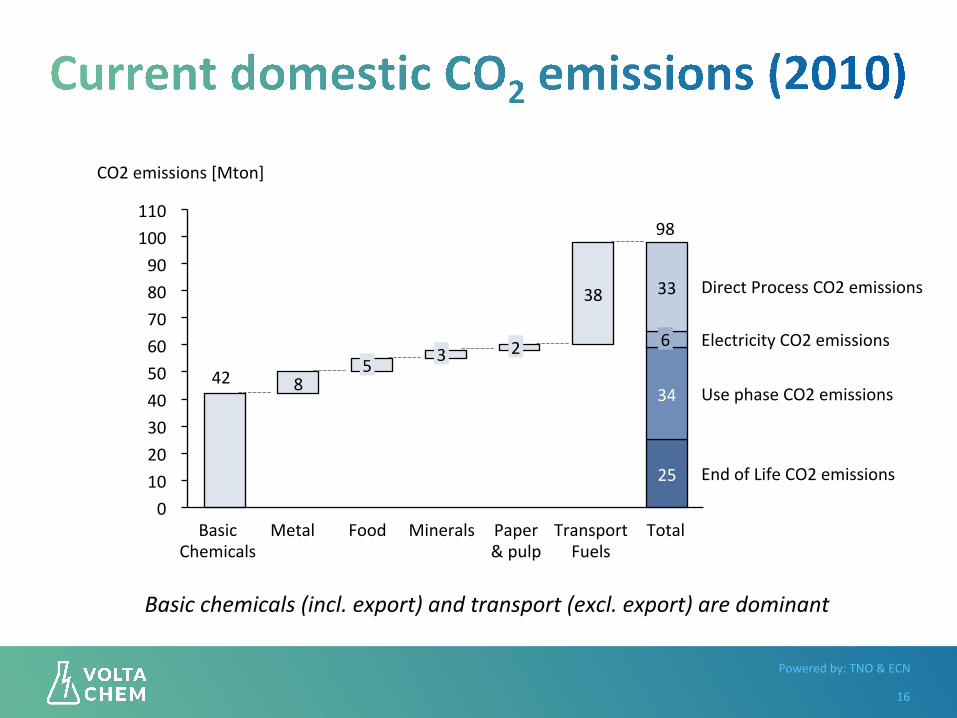
42 8
38
25
34
33
0102030405060708090100110
TransportFuels
EndofLifeCO2emissions
DirectProcessCO2emissions
UsephaseCO2emissions
ElectricityCO2emissions
Total
CO2emissions[Mton]
98
6
MetalBasicChemicals
5 3
MineralsFood Paper&pulp
2
Basicchemicals(incl.export)andtransport(excl.export)aredominant
Poweredby:TNO&ECN
17
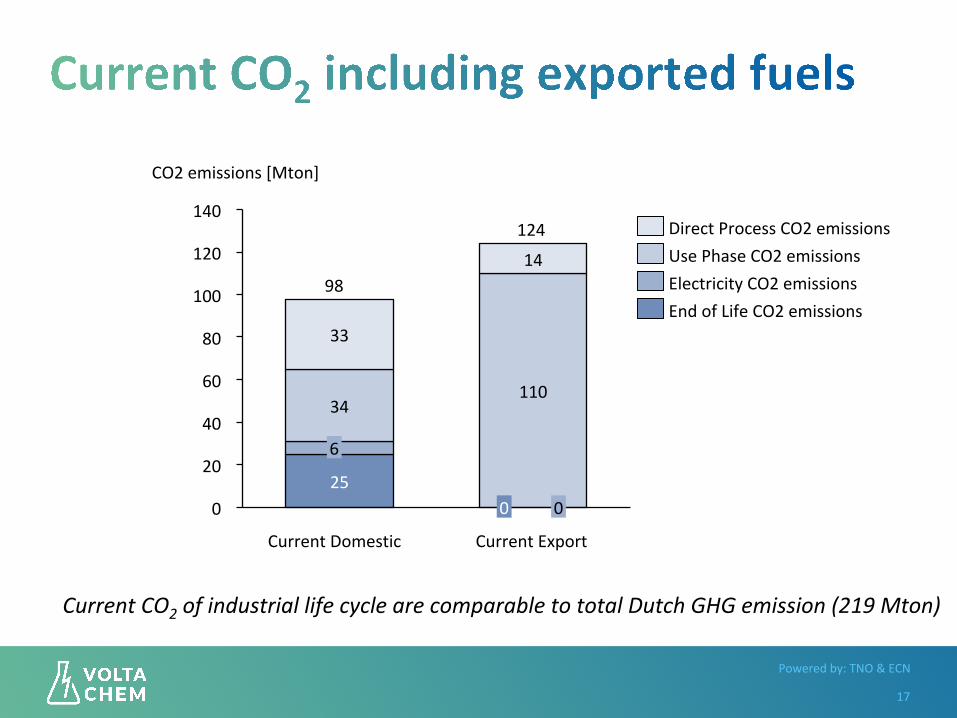
25
34110
33
14
0
20
40
60
80
100
120
140
CO2emissions[Mton]
0 0
124
6
CurrentDomestic CurrentExport
98
UsePhaseCO2emissionsDirectProcessCO2emissions
EndofLifeCO2emissionsElectricityCO2emissions
CurrentCO2ofindustriallifecyclearecomparabletototalDutchGHGemission(219Mton)
Poweredby:TNO&ECN
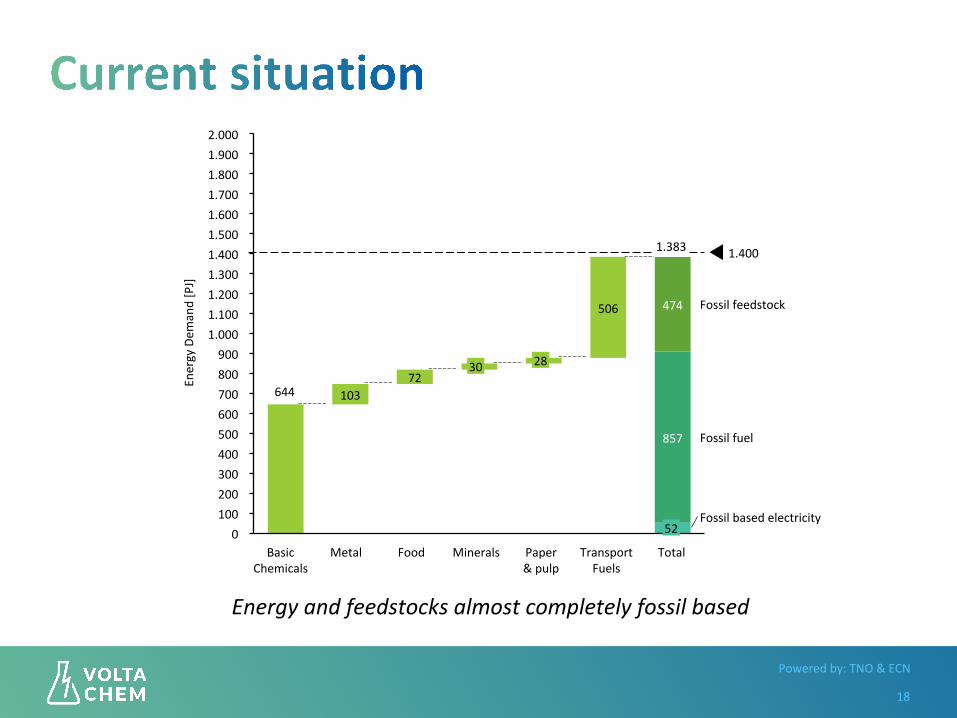
18
644 10372
506
857
474
0100200300400500600700800900
1.0001.1001.2001.3001.4001.5001.6001.7001.8001.9002.000
Metal
30
FoodBasicChemicals
Minerals
28
Paper&pulp
Fossilfuel
Fossilfeedstock
Total
1.383
52
TransportFuels
Fossilbasedelectricity
1.400
EnergyDem
and[PJ]
Energyandfeedstocksalmostcompletelyfossilbased
Poweredby:TNO&ECN
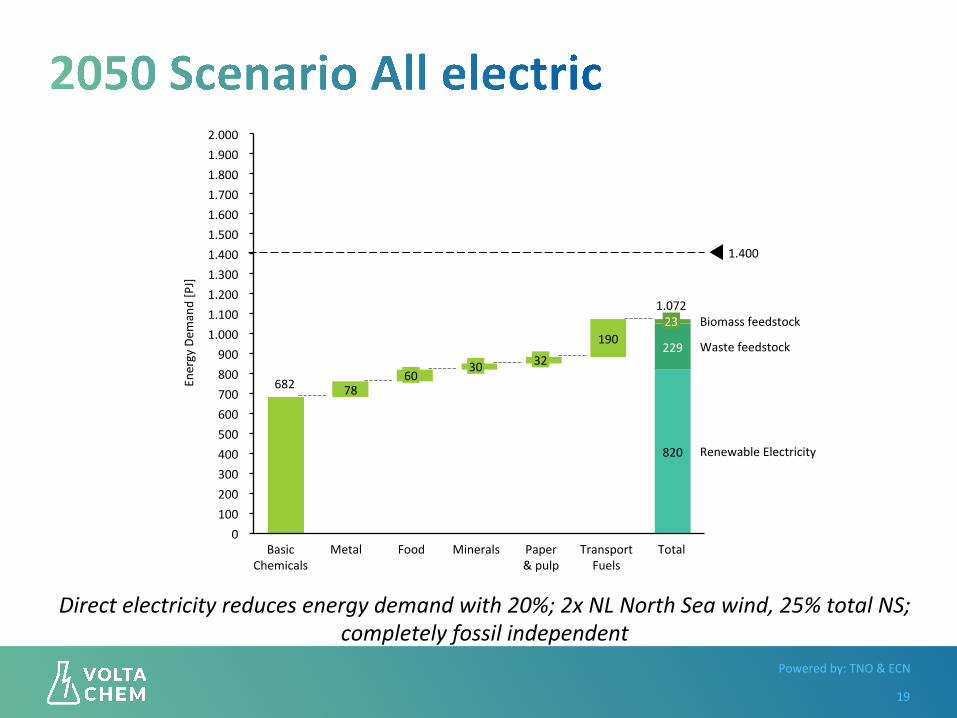
19
682 78
190
820
229
0100200300400500600700800900
1.0001.1001.2001.3001.4001.5001.6001.7001.8001.9002.000
60
BasicChemicals
FoodMetal
RenewableElectricity
32
TotalPaper&pulp
Wastefeedstock
Biomassfeedstock231.072
Minerals
30
EnergyDem
and[PJ]
1.400
TransportFuels
Directelectricityreducesenergydemandwith20%;2xNLNorthSeawind,25%totalNS;completelyfossilindependent
Poweredby:TNO&ECN
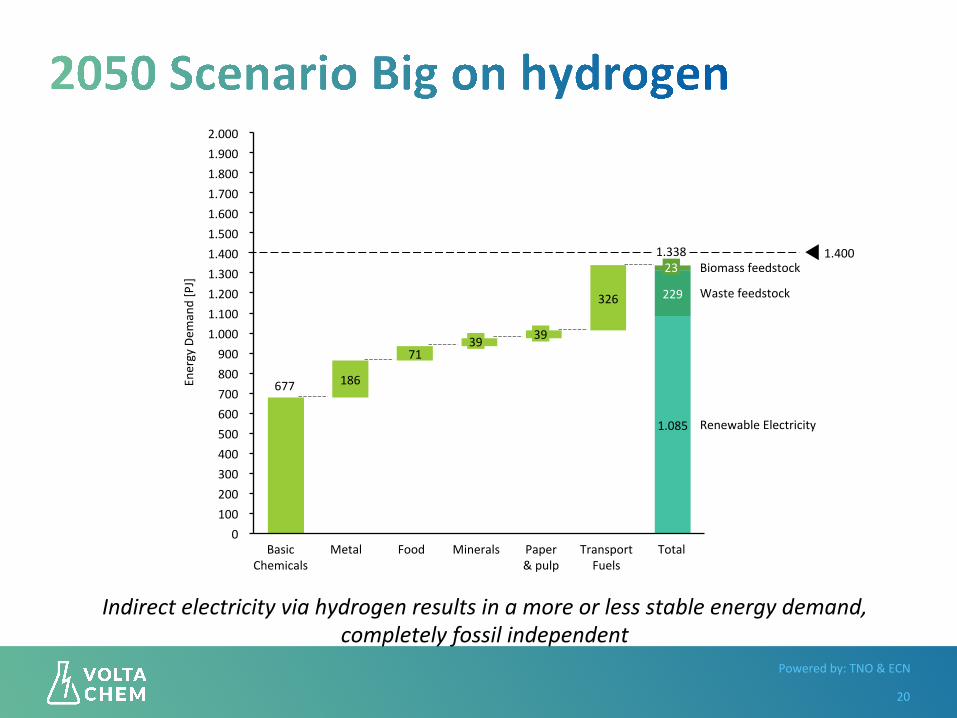
20
677 186
71
326
1.085
229
0100200300400500600700800900
1.0001.1001.2001.3001.4001.5001.6001.7001.8001.9002.000
1.400
TransportFuels
BasicChemicals
EnergyDem
and[PJ]
23
Paper&pulp
39
Minerals
39
Metal Food
Biomassfeedstock
RenewableElectricity
Total
1.338
Wastefeedstock
Indirectelectricityviahydrogenresultsinamoreorlessstableenergydemand,completelyfossilindependent
Poweredby:TNO&ECN
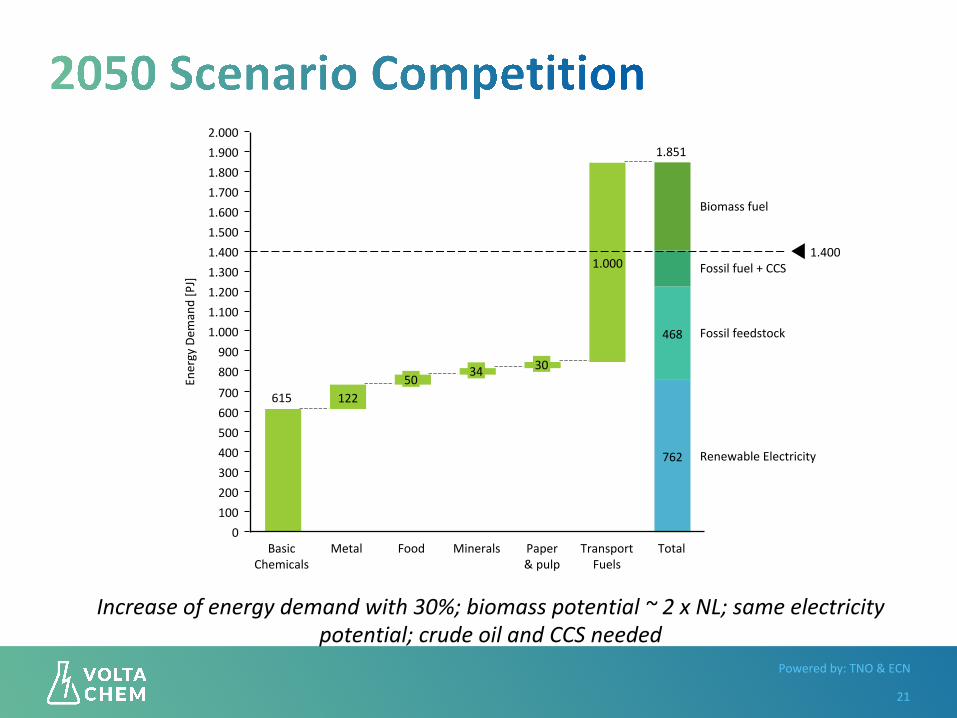
21
615 122
1.000
762
468
1.200
500400300
1.100
200100
0
900
1.900
800700600
1.800
1.300
1.000
1.400
2.000
1.6001.500
1.700
RenewableElectricity
Fossilfeedstock
EnergyDem
and[PJ]
TransportFuels
1.400
Minerals
30
BasicChemicals
1.851
34
Paper&pulp
FoodMetal Total
50
Fossilfuel+CCS
Biomassfuel
Increaseofenergydemandwith30%;biomasspotential~2xNL;sameelectricitypotential;crudeoilandCCSneeded
Poweredby:TNO&ECN
22
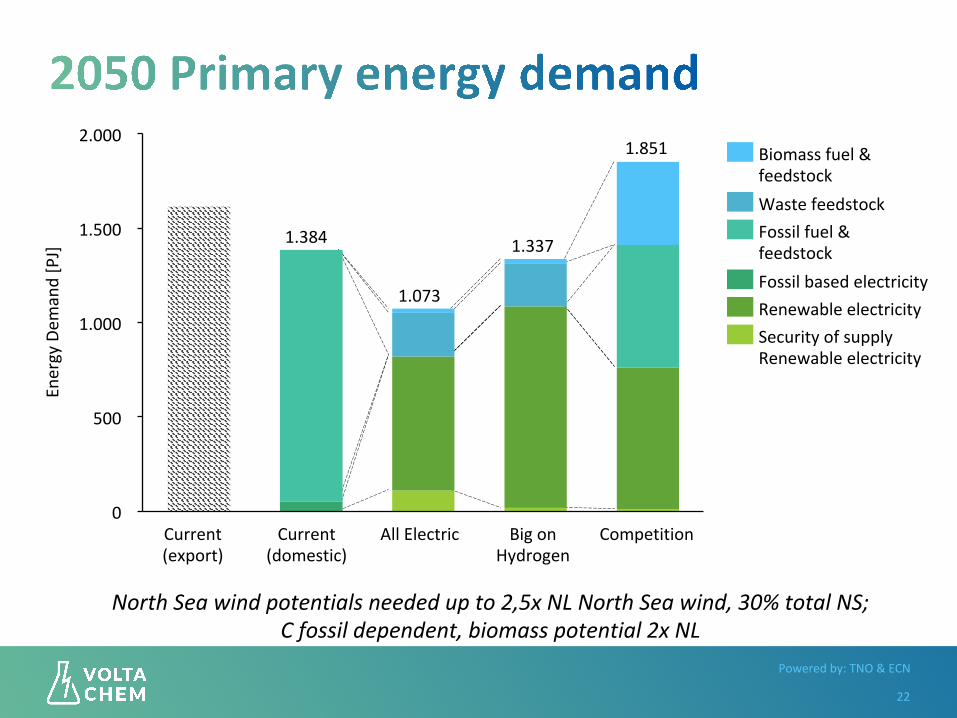
0
500
1.000
1.500
2.000
Competition
1.337
Current(export)
1.073
1.384
1.851
Current(domestic)
BigonHydrogen
AllElectric
EnergyDem
and[PJ]
SecurityofsupplyRenewableelectricity
Wastefeedstock
FossilbasedelectricityRenewableelectricity
Fossilfuel&feedstock
Biomassfuel&feedstock
NorthSeawindpotentialsneededupto2,5xNLNorthSeawind,30%totalNS;Cfossildependent,biomasspotential2xNL
Poweredby:TNO&ECN
23
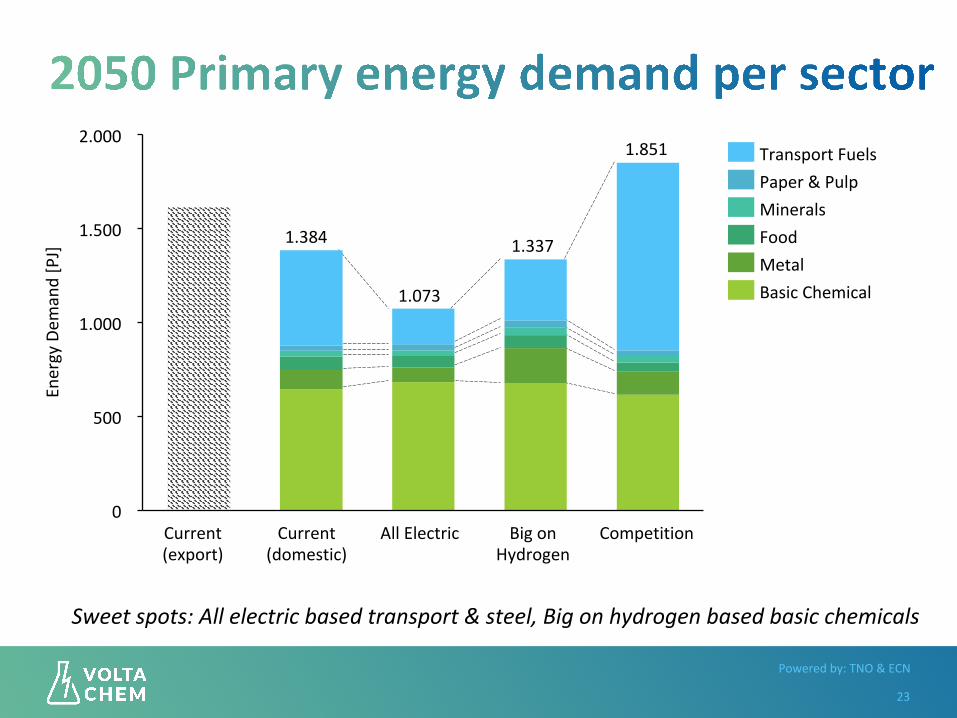
0
500
1.000
1.500
2.000
Current(export)
1.384
AllElectric
1.073
Current(domestic)
1.851
BigonHydrogen
EnergyDem
and[PJ]
Competition
1.337
Minerals
BasicChemicalMetalFood
TransportFuelsPaper&Pulp
Sweetspots:Allelectricbasedtransport&steel,Bigonhydrogenbasedbasicchemicals

Poweredby:TNO&ECN
24
Poweredby:TNO&ECN
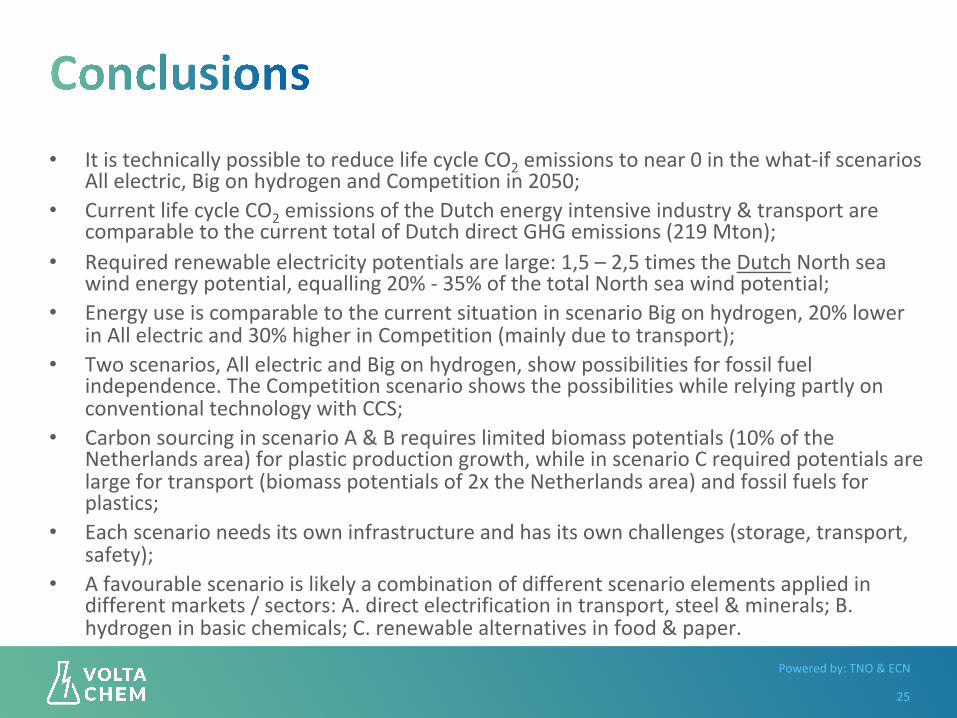
• ItistechnicallypossibletoreducelifecycleCO2emissionstonear0inthewhat-ifscenariosAllelectric,BigonhydrogenandCompetitionin2050;
• CurrentlifecycleCO2emissionsoftheDutchenergyintensiveindustry&transportarecomparabletothecurrenttotalofDutchdirectGHGemissions(219Mton);
• Requiredrenewableelectricitypotentialsarelarge:1,5–2,5timestheDutchNorthseawindenergypotential,equalling20%-35%ofthetotalNorthseawindpotential;
• EnergyuseiscomparabletothecurrentsituationinscenarioBigonhydrogen,20%lowerinAllelectricand30%higherinCompetition(mainlyduetotransport);
• Twoscenarios,AllelectricandBigonhydrogen,showpossibilitiesforfossilfuelindependence.TheCompetitionscenarioshowsthepossibilitieswhilerelyingpartlyonconventionaltechnologywithCCS;
• CarbonsourcinginscenarioA&Brequireslimitedbiomasspotentials(10%oftheNetherlandsarea)forplasticproductiongrowth,whileinscenarioCrequiredpotentialsarelargefortransport(biomasspotentialsof2xtheNetherlandsarea)andfossilfuelsforplastics;
• Eachscenarioneedsitsowninfrastructureandhasitsownchallenges(storage,transport,safety);
• Afavourablescenarioislikelyacombinationofdifferentscenarioelementsappliedindifferentmarkets/sectors:A.directelectrificationintransport,steel&minerals;B.hydrogeninbasicchemicals;C.renewablealternativesinfood&paper.
25
Poweredby:TNO&ECN
Furtherinvestigate:• Howtopreparethenextdecadeforpotentiallongterm
scenarios–identifycritical&no-regrettechnologies,ingeneralandpersector&product;
• Economicimpactsandfeasibility–forvaluechainandDutchsociety;
• Necessarygovernancetosupportdesireddevelopments;• Dutchexportpositiononfuturedecarbonisedenergycarriers
fortransportation(aviationandnavigation)-currently3xthedomesticuse.
26