Embed Size (px)
DESCRIPTION
Electricity Quantity & Quality. Hervé Mougeot. Market Overview. Quantity Quality Safety. - PowerPoint PPT Presentation
Citation preview

1
ElectricityElectricityQuantity & QualityQuantity & Quality
Hervé Mougeot

2
Market OverviewMarket Overview
• QuantityQuantity : Allocate energy usage, detailed detailed cost analysiscost analysis, cut energy costs, negotiate better energy contracts, demand control and demand control and peak savingpeak saving, information for improving information for improving infrastructureinfrastructure, load curtailment and price response, power factor correctionpower factor correction.
• QualityQuality : Availability, troubleshooting, Availability, troubleshooting, productivity, preventive maintenance, productivity, preventive maintenance, quality statistics, information for improving quality statistics, information for improving infrastructureinfrastructure
• SafetySafety : protect people and propertyproperty
QuantityQuantity QualityQuality SafetySafety
SafetySafety
QualityQuality
QuantityQuantity
UU==
Z IZ I

3
Production Transmission Distribution Users
HV MV
LV
Network = Share of the electricity ... and the pollution.
Example : The pollution generated from a disturbing load will be distributed to the neighbors more or less attenuated depending on the network impedance.
Electrical NetworkElectrical Network

4
ElectroMagnetic CompatibilityElectroMagnetic Compatibility
t
Dis
turb
ance
lev
el Immunity secured load
Immunity standard load
Compatibility
Emission on the network
Emission from single load IEC1000-3-x
EN50160

5
ElectroMagnetic CompatibilityElectroMagnetic Compatibility

6
Compatibility Compatibility
Transient
Dip
Swell

7
V3
V1
V2 U12
U31
U23
3VU
3 Phases System3 Phases System

8
• Amplitude
• Wave Shape
• Frequency
• Symmetry
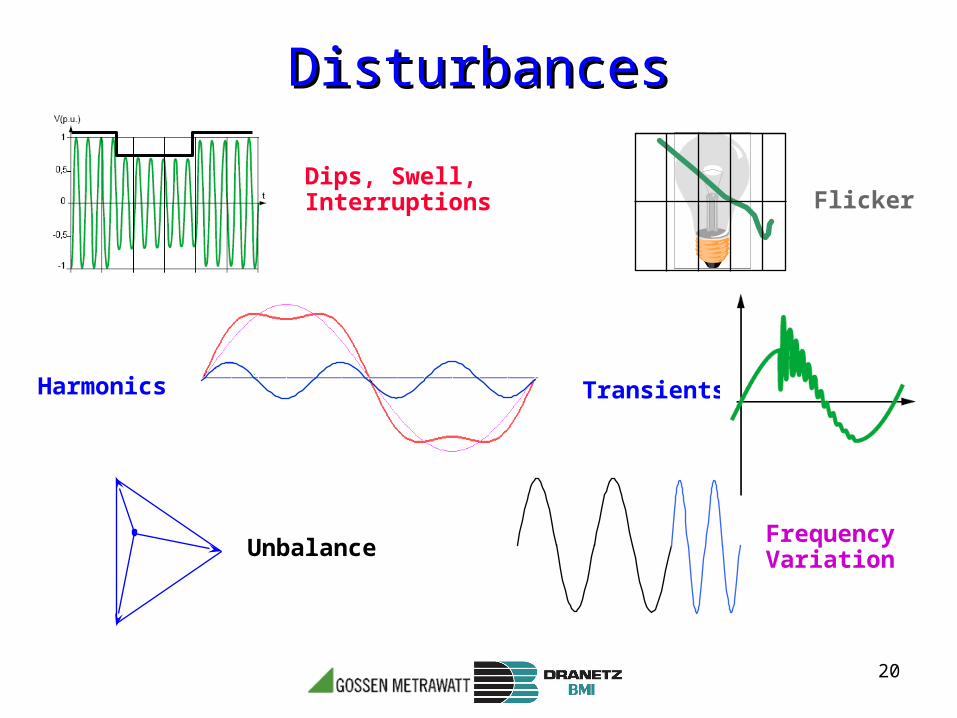
• Voltage variations• Voltage Dips• Interruptions• Voltage Swells• Flicker• Harmonics• Inter harmonics• Transients• Frequency• Unbalance
low frequency, conducted
Electrical DisturbancesElectrical Disturbances

9
Voltage VariationsVoltage Variations

10
Voltage DipsVoltage Dips
0 40 80 120 160 200 240 280
t
u100
0 40 80 120 160 200 240 280
90
70
U(amplitude)
ΔU = 30%(depth)
ΔT = 112ms(durée)
t (ms)
Ueff%Un

11
InterruptionsInterruptions
0 40 80 120 160 200 240 280
t
u100
0 40 80 120 160 200 240 280
1
ΔT = 83ms
(duration)
t (ms)
Ueff%Un

12
Dips, Swells and InterruptionsDips, Swells and Interruptions
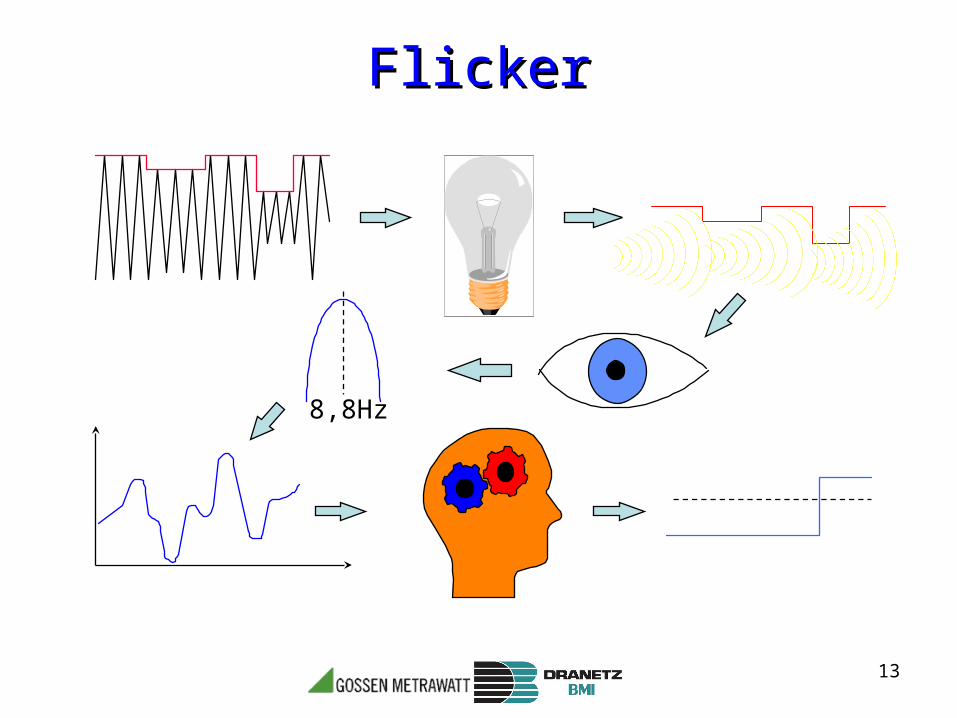
13
8,8Hz
FlickerFlicker

14
Pst = 1 , cas des variations rectangulaires
Nombre de variations par minute
10
1
0,1 1 10 100 1000
0,29% / 1052
3% / 0,757V
V
FlickerFlicker

15
=
+
+=
1 3 5 n
HarmonicsHarmonics

16
HarmonicsHarmonics
17
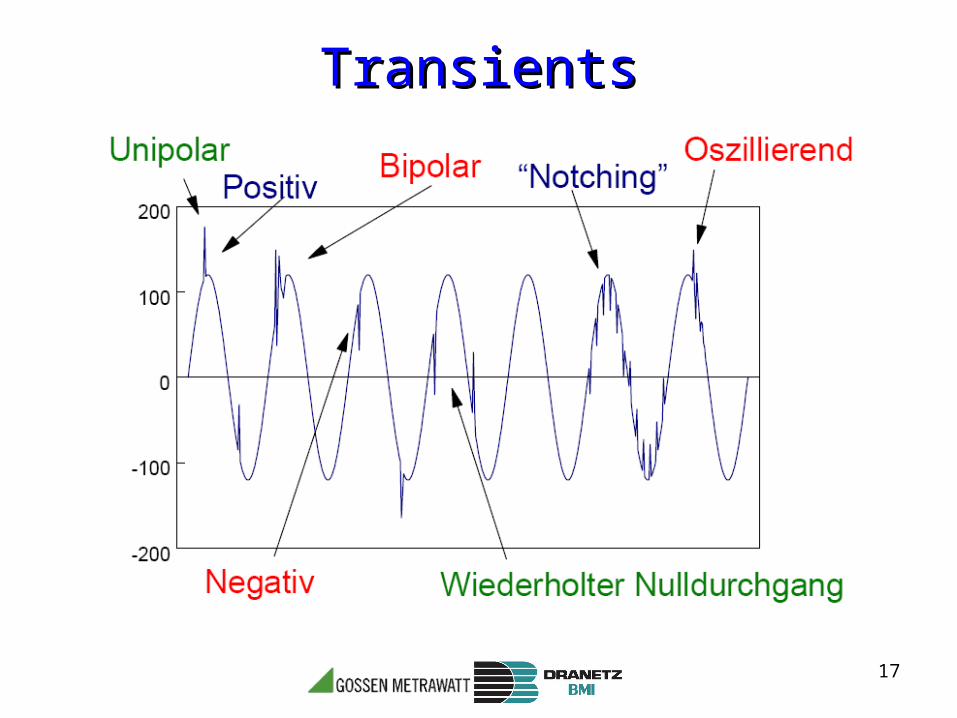
TransientsTransients
18
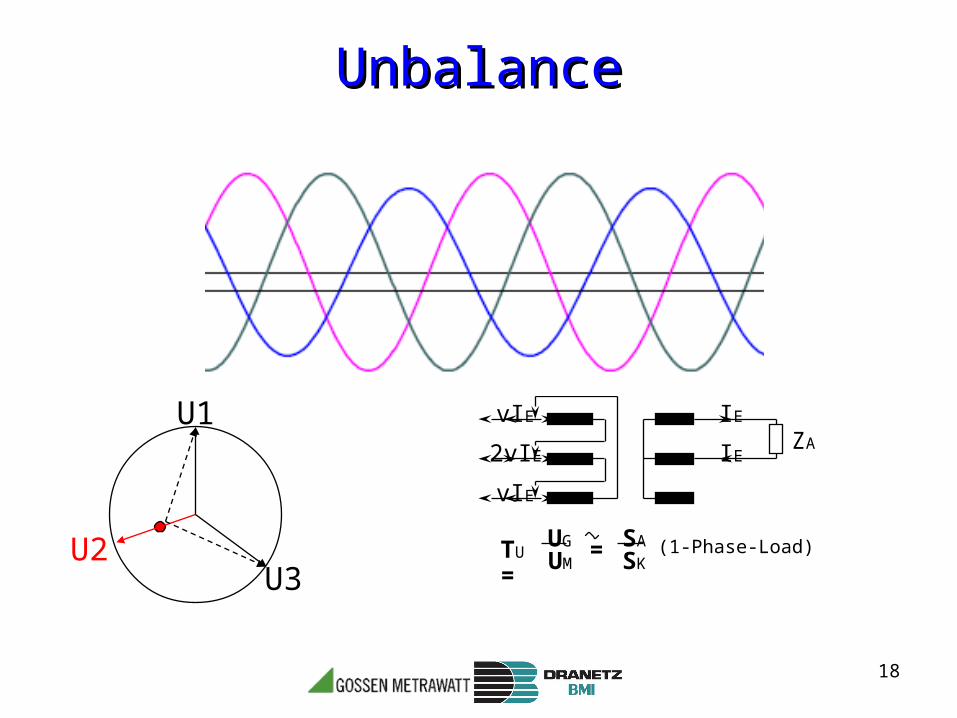
IE
IE
vIE
vIE
2vIE ZA
TU =
UG
UM= SA
SK(1-Phase-Load)
UnbalanceUnbalance
U2
U1
U3

19
Frequency VariationFrequency Variation
20
Dips, Swell, Interruptions
Frequency VariationUnbalance
Transients
Flicker
Harmonics
DisturbancesDisturbances

21
Parameters Value Limits
Urms LV 230V / 400V +10% / -10%
Urms MV 20kV +7% / -7%
Frequency 50 Hz +2% / -2%
Wave shape Sinusoidal THD < 8% en BTA
Symmetry U U1=U2=U3 2%
ParametersParameters

22
What to measureWhat to measure
EN 50160EN 50160Voltage characteristics in public distribution systemsVoltage characteristics in public distribution systems
23
EN 50160 ParametersEN 50160 Parameters
Voltage Variations Flicker Pst/Plt Harmonics order 2 to 25, THD (40) Signalling (ripple control) voltages Frequency Unbalance Voltage dips and swells Interruptions
Measurement over 1 week

24
EN 50 160 - LimitsEN 50 160 - Limits
25
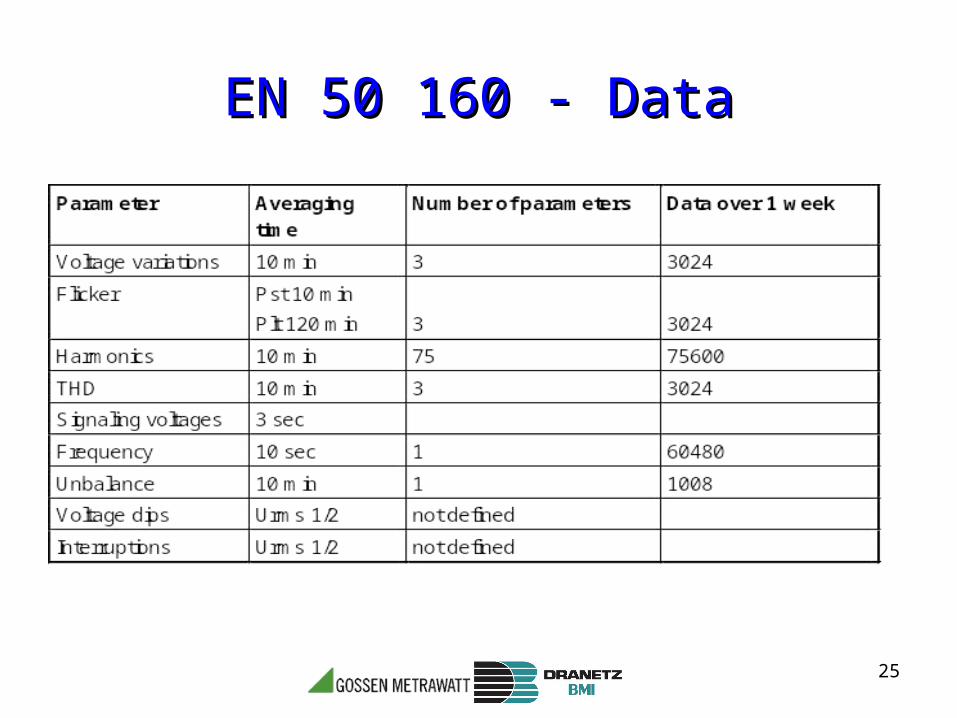
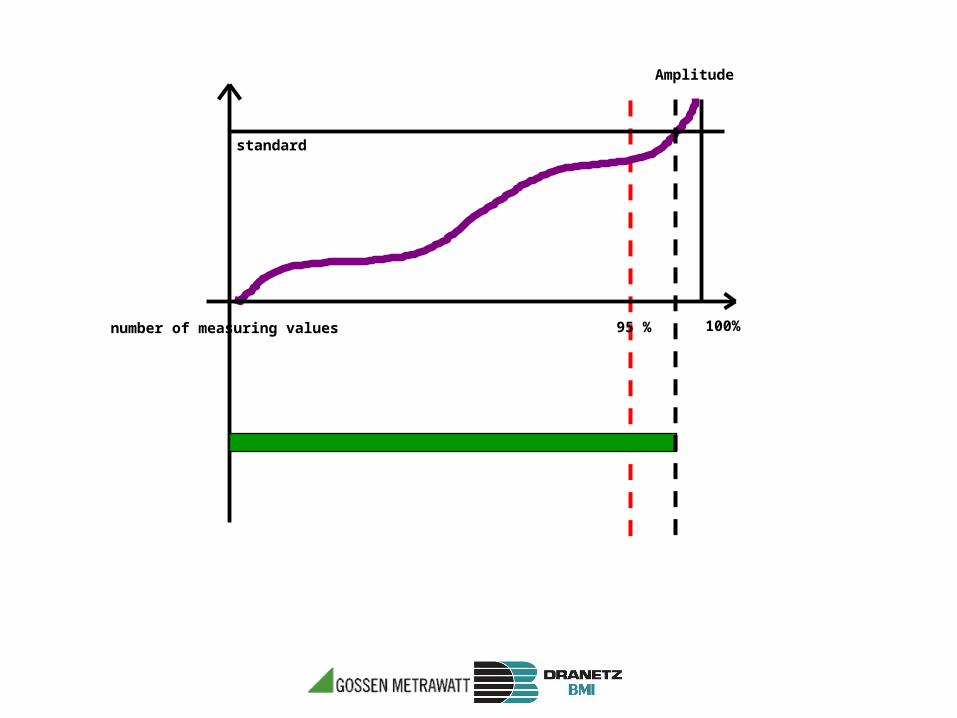
EN 50 160 - DataEN 50 160 - Data

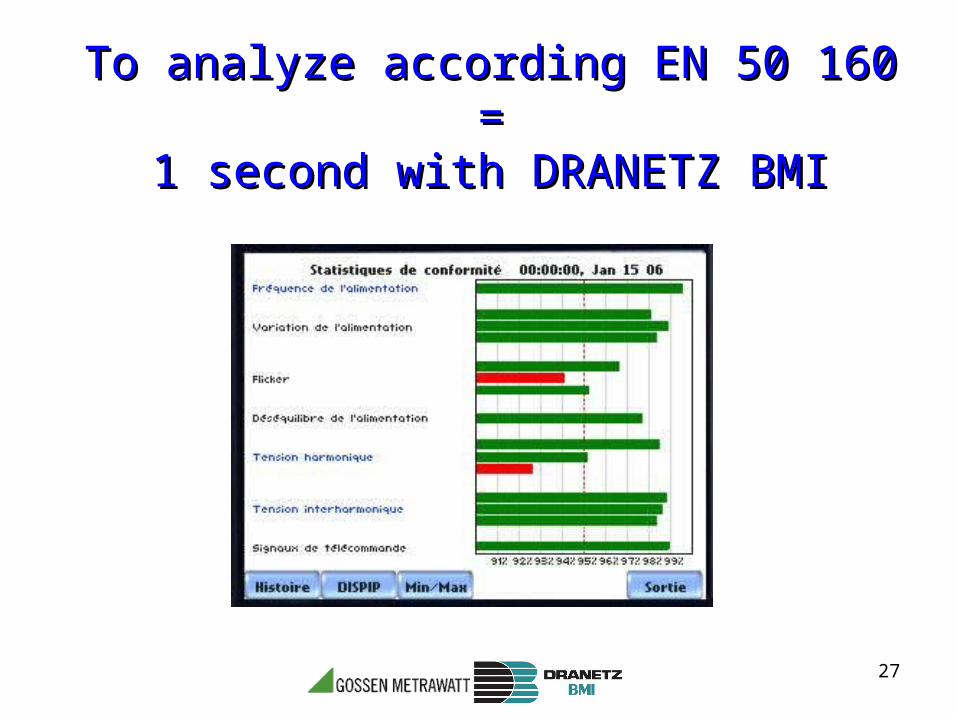
To measure according EN 50 160To measure according EN 50 160 = =
150.000 data to analyze150.000 data to analyze
for 1 week, for 1 point !
27
To analyze according EN 50 160To analyze according EN 50 160 = =
1 second with DRANETZ BMI1 second with DRANETZ BMI
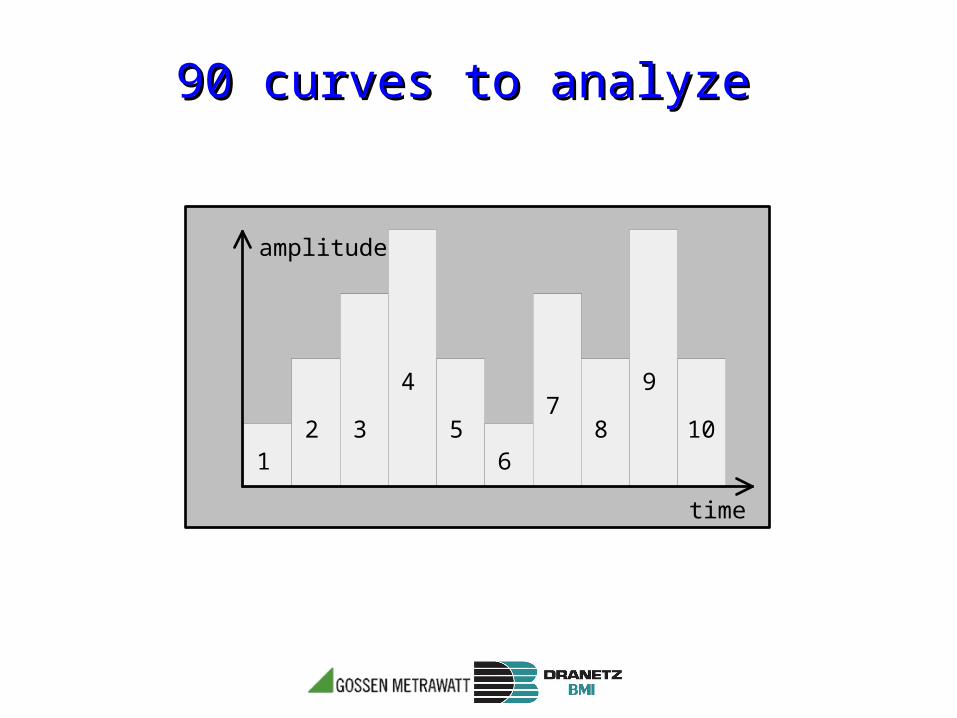
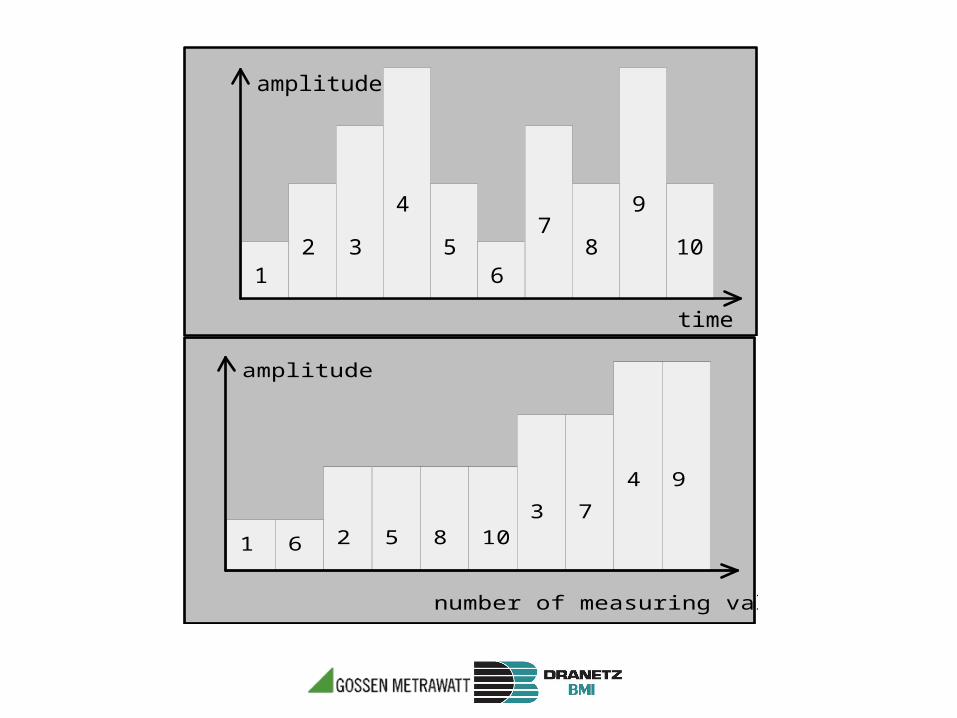
90 curves to analyze90 curves to analyze
12 3
4
56
78
9
10
time
amplitude
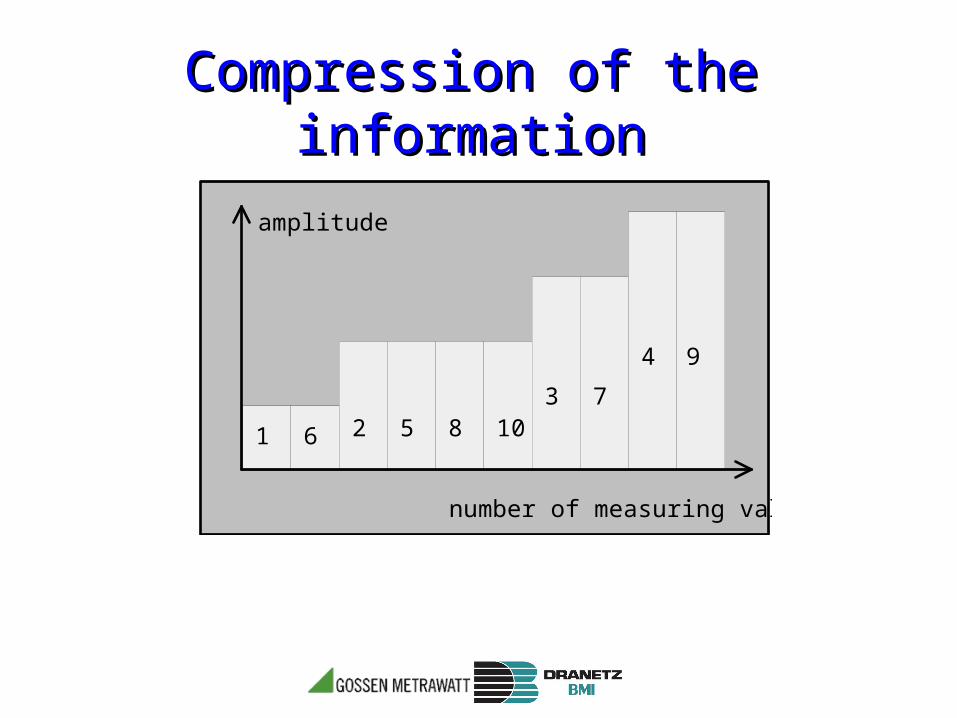
Compression of the informationCompression of the information
1 6 2 5 8 103 7
4 9
amplitude
number of measuring values
12 3
4
56
78
9
10
time
amplitude
1 6 2 5 8 103 7
4 9
amplitude
number of measuring values

1 6 2 5 8 103 7
4 9
amplitude
number of measuring values
95 %
standard
Amplitude
number of measuring values 100%
95 %
standard
Amplitude
number of measuring values 100%

95 %
standard
Amplitude
number of measuring values 100%

95 %
standard
Amplitude
number of measuring values 100%

Overview about the Power QualityOverview about the Power Quality

36
How to measureHow to measureIEC 61000-4-30IEC 61000-4-30
Testing and measurement techniques – Power Quality measurement methodsTesting and measurement techniques – Power Quality measurement methods

Measurement techniquesMeasurement techniques
Continuity / Change

Permanent / TriggerPermanent / Trigger
Permanent average values recording
– Triggered values recording

39
A/D
A/D
FFT
FIFO
Transient
8
(4)
X
X²
256 s/c
16-Bit
1 MHz 12-Bit T
T
Events / TrendEvents / Trend
40
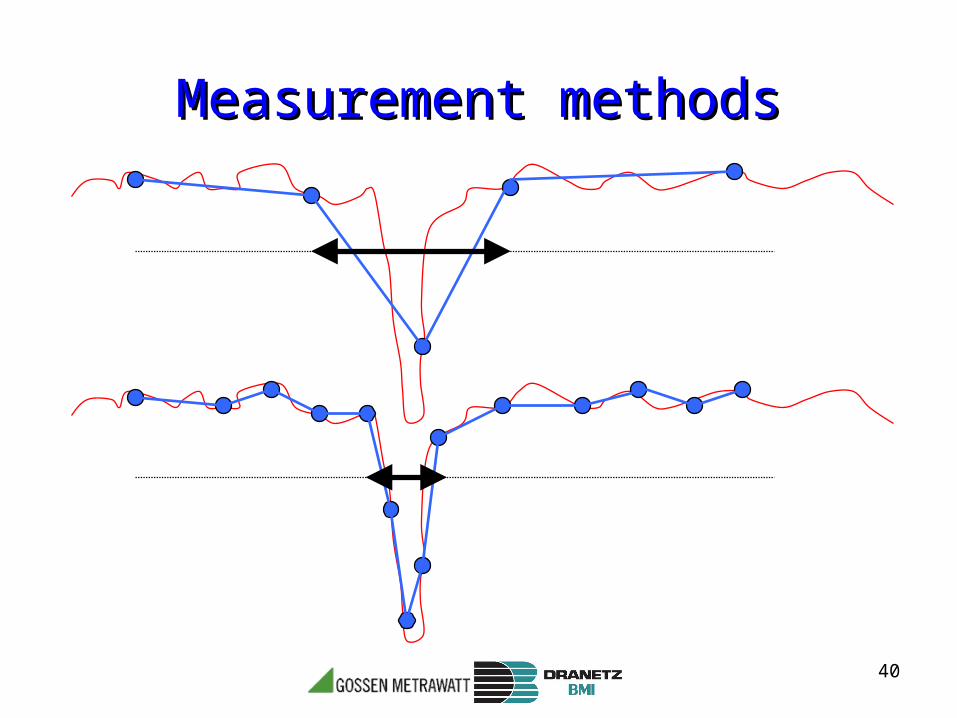
Measurement methodsMeasurement methods

41
Event recordingEvent recording
Acquisition Treatment Characterization
Detection Evaluation Classification
Recording
Measure A
nalyze Archive

42
• Derived from ½ cycles (3.22 1cycle refreshed each 1/2cycle, 20msec)
• Reference is either Udin (LV) or sliding voltage (MV, HV)
• ½ cycles must be synchronised on reference channel
Voltage Dip / Swell (5.4) Voltage Interruption (5.5)

43
Long term recordingLong term recording
Time aggregation •10/12 cycle (200msec) at 50/60Hz, 150/180 cycles (3sec) at 50/60Hz, interval time varies with actual frequency• 10min, 2h interval sync to clock (including defined algorithm from cycle to time aggr.)• Aggregations are performed using the square root of arithmetic mean of squared input• All are non-gapping, 150/180 aggregated out of 15x10/12; 2h out of 12x10min

44
• 10/12 cycle (200msec) at 50/60Hz, interval time varies with actual frequency• 150/180 cycles (3sec) at 50/60Hz, interval time varies with actual frequency• 10min interval sync to clock (including defined algorithm from cycle to time aggr.)• 2h interval sync to clock (including defined algorithm from cycle to time aggr.)• Aggregations are performed using the square root of arithmetic mean of squared input• All are non-gapping, 150/180 aggregated out of 15x10/12; 2h out of 12x10min
Time aggregation (4.4/4.5)

45
Time aggregation (4.4/4.5)
10
150
10min
2h
Zero Crossing of Fundamental (filtered)
Synchronised Clock ±20msec

46
• For Timestamp of Events and • Synchronisation of the 10min and 2h interval
• Accuracy of timestamp: ±20/16,7msec at 50/60Hz (Realisation with e.g.: GPS or DCF 77 sync)
Time Clock Uncertainty (4.6)
47
• Only one event extracted out of different events (dip, swell and interruption influences also frequency, flicker…)
Flagging (4.7)

48
• Obtained every 10sec from the reference channel
• Synchronise the sampling frequency of the system no fix sampling frequency 'possible' (e.g.: PLL)
• Accuracy of power frequency measurement ±0,01Hz
Power Frequency (5.1)
49
• Accuracy without accessory: ± 0,1% of Udin
(Udin declared input voltage)
• (same for current, but today only recommended)
Accuracy for voltage (5.2)

50
Flicker algorithm according to IEC 61000-4-15
Flicker (5.3)
51
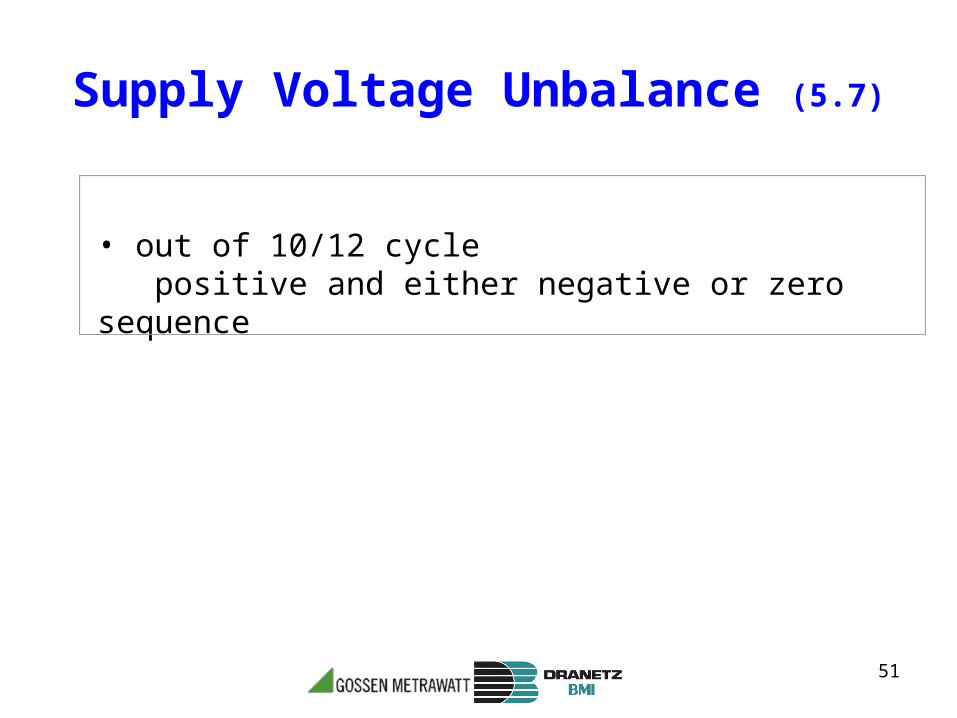
• out of 10/12 cycle positive and either negative or zero sequence
Supply Voltage Unbalance (5.7)
52
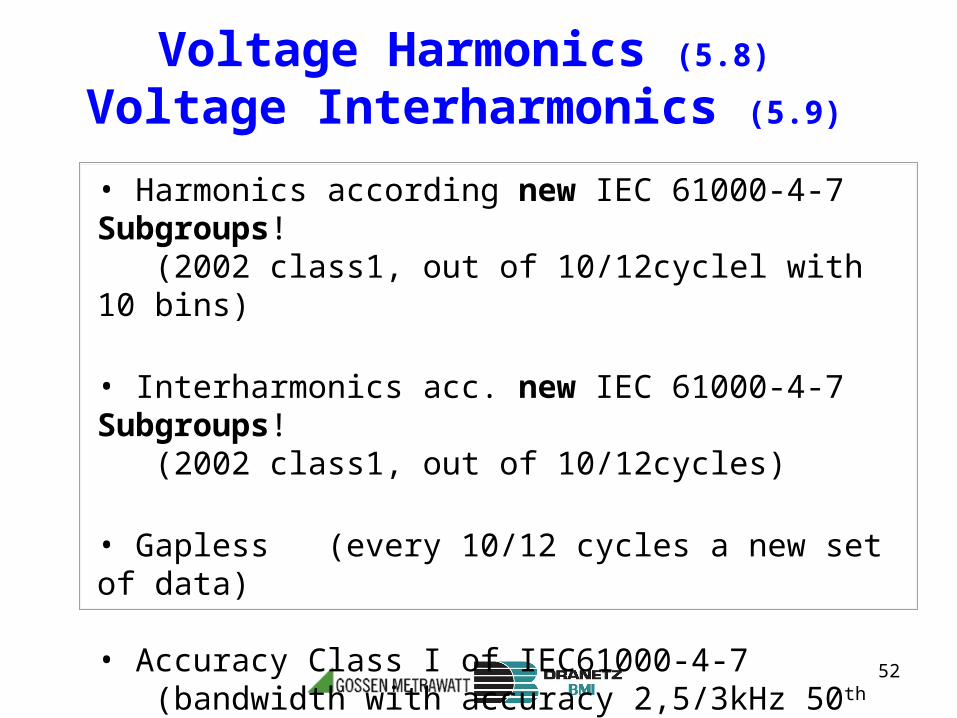
• Harmonics according new IEC 61000-4-7 Subgroups! (2002 class1, out of 10/12cyclel with 10 bins)
• Interharmonics acc. new IEC 61000-4-7 Subgroups! (2002 class1, out of 10/12cycles)
• Gapless (every 10/12 cycles a new set of data)
• Accuracy Class I of IEC61000-4-7 (bandwidth with accuracy 2,5/3kHz 50th harmonic low ripple)
Voltage Harmonics (5.8) Voltage Interharmonics (5.9)

53
harmonic order n n+1 n+2 n+3
harmonic group n+1
interharmonic group n+2,5
DFT output
S
harmonic order n n+1 n+2 n+3
harmonic subgroup n+1
interharmonic subgroup n+2,5
DFT output
YES
NO
Voltage Harmonics (5.8) Voltage Interharmonics (5.9)
54
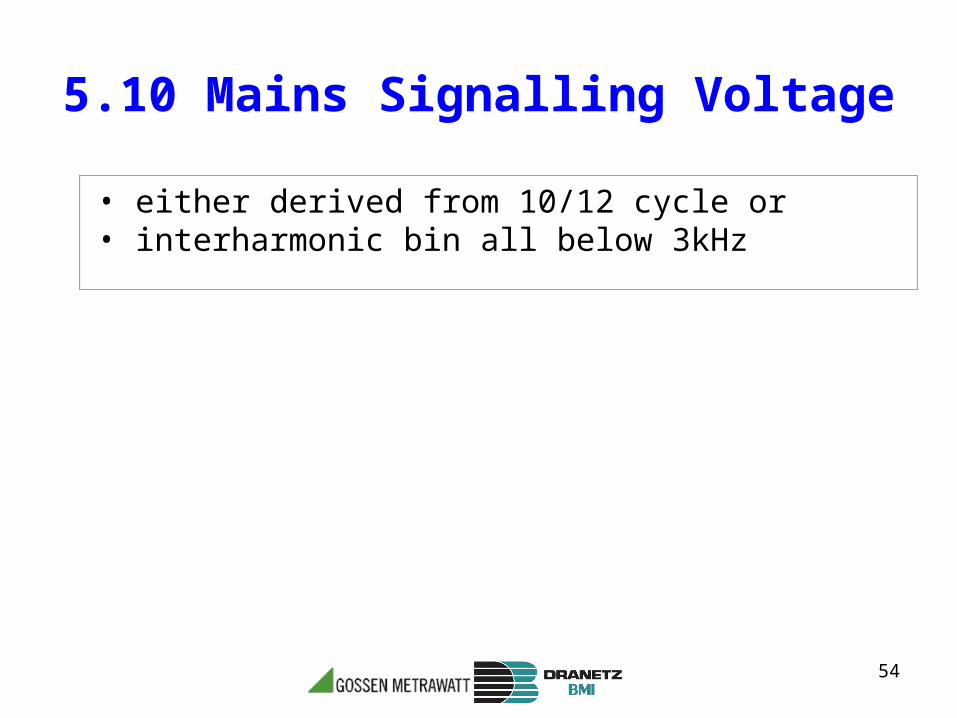
• either derived from 10/12 cycle or • interharmonic bin all below 3kHz
5.10 Mains Signalling Voltage
55
Where to measureWhere to measure
Compliance / Trouble shoutingCompliance / Trouble shouting

56
Am
plit
ud
e
Duration
Network
UserTransient
Swells
DipsMomentary Temporary Long Duration
Interruptions
Flicker
Instantaneous

57
Measuring pointMeasuring point
Statistics / Diagnostic

58
Multi-sites monitoringMulti-sites monitoring

59
Multi-sites monitoringMulti-sites monitoring
A lot of data :
• To transmit
• To analyze

60
AnalysisAnalysis

61
Embedded analysisEmbedded analysis

62
How to analyzeHow to analyze
Overview / DetailsOverview / Details

63
OverviewOverview

64
OverviewOverview

65
TrendsTrends
Evénément #109 le 24/01/2006 18:27:16,080AVrms Creux instantané
Diagramme temporel
26/01/2006Thursday
28/01/2006Saturday
30/01/2006Monday
01/02/2006Wednesday
03/02/2006Friday
05/02/2006Sunday
0
50
100
150
200
250
Volts
A Vrms
0
5
10
15
20
A VPlt
DEMODEMO

66
TrendsTrends

67
OverviewOverview

68
EventsEvents

69
ClassificationClassification

70
DetailsDetails
71
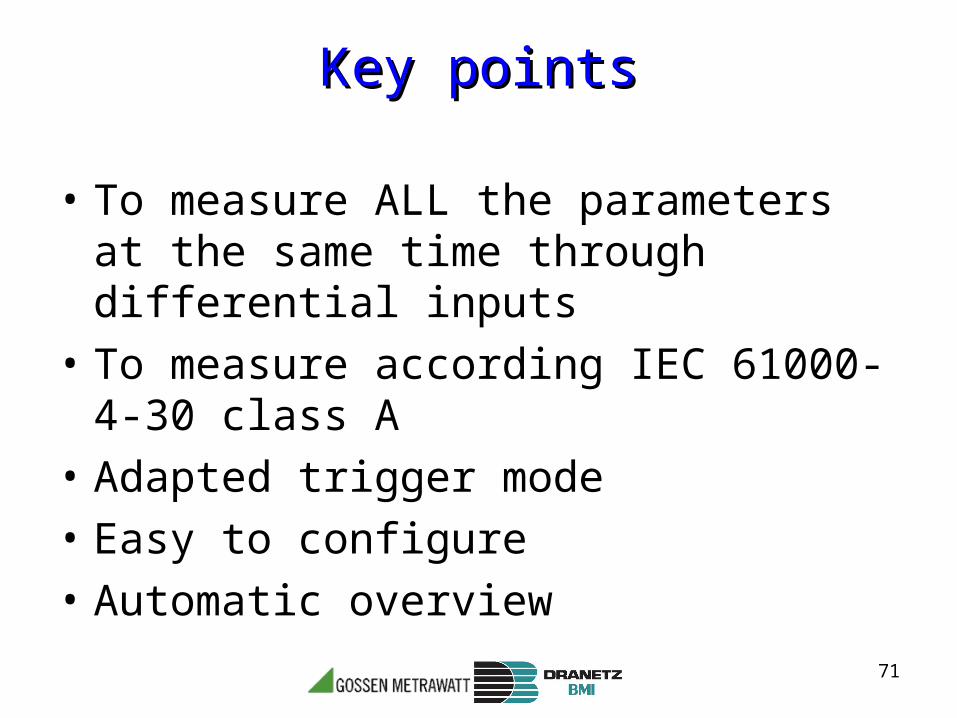
Key pointsKey points
• To measure ALL the parameters at the same time through differential inputs
• To measure according IEC 61000-4-30 class A
• Adapted trigger mode
• Easy to configure
• Automatic overview

72
Complete solutionComplete solution

73
Solution : DRANETZ BMISolution : DRANETZ BMIPower Network Monitoring
FIXED MONITORING MOBILE INSTRUMENTS
Power QualityCompliance
Power QualityAnalysis
Sporadic Disturbance
Permanent Disturbance
Digital Signals
Waveform+ RMS
TransientWaveform
+ RMS
Power Guide 4400
Power Xplorer PX5ENCORE SERIES
Strategic Point
Voltages + Currents
RMSOnly
Voltages Only Long Term Monitoring Short Term Monitoring
Key Account
Power Visa

74
SelectionSelectionPower Network Monitoring
Fix
ed
Ins
talle
d
So
lutio
n
Mo
bile
Ins
trum
en
t
Power QualityCompliance
Power QualityAnalysis
Sporadic Disturbance
Permanent Disturbance
Digital Signals Waveform Transient
Power Guide 4400
Power Xplorer PX5
ENCORE SERIES
Strategic Point
Voltages + Currents
RMS
RMS
Voltages RMS (only)
Long Term Monitoring
Short Term Monitoring
Power Visa
Good Quality ?
PredictiveMaintenance
Permanent Monitoring
Trouble Shooting
Trend recording
Low Speed Eventsrecording
Exchange Point
Analysis / Statistics
Voltages + CurrentsWaveform
High Speed Events recording
EN50160
IEC 61000-4-30 Class A
Multi-points
Statistics
Diagnostic
Dran
View
PreventiveMaintenance
AlarmsReporting
75
Questions?Questions?Electricity - Quantity & QualityElectricity - Quantity & Quality