Embed Size (px)
Citation preview

3 September 2019 1 Investors are advised to refer through important disclosures made at the last page of the Research Report.
Motilal Oswal research is available on www.motilaloswal.com/Institutional-Equities, Bloomberg, Thomson Reuters, Factset and S&P Capital.
Jinesh Gandhi - Research analyst ([email protected]) Vipul Agrawal - Research analyst ([email protected])
Estimate changes
CMP: INR2,605 TP: INR3,200 (+23%) Buy TP change
Rating change Bloomberg EIM IN Equity Shares (m) 273 M.Cap.(INRb)/(USDb) 712.1 / 9.8 52-Week Range (INR) 3036 / 1451 1, 6, 12 Rel. Per (%) 4/-13/12 12M Avg Val (INR M) 4283
Financials & Valuations (INR b) Y/E March FY21 FY22E FY23E Sales 87.2 126.2 149.3 EBITDA 18.3 30.4 38.8 Adj. PAT 13.5 24.6 32.9 EPS (INR) 50.7 90.2 120.4 EPS Gr. (%) -24.3 77.8 33.5 BV/Sh. (INR) 419 489 584 Ratios RoE (%) 12.9 19.6 22.4 RoCE (%) 12.6 19.6 22.4 Payout (%) 34.5 22.2 20.8 Valuations P/E (x) 51.4 28.9 21.6 P/BV (x) 6.2 5.3 4.5 Div. Yield (%) 0.7 0.8 1.0 FCF Yield (%) 1.7 3.6 3.7
Shareholding pattern (%) As On Mar-21 Dec-20 Mar-20 Promoter 49.2 49.2 49.3 DII 9.2 9.5 11.3 FII 29.1 28.9 27.7 Others 12.5 12.4 11.8 FII Includes depository receipts
In-line; upcoming launches critical to delivering strong growth RE plans to launch new model every quarter Eicher Motors (EIM)’s 4QFY21 performance was in-line, supported by good
volume recovery in both RE and VECV. Despite cost inflation, EBITDA margins per unit were stable QoQ. Good response to Meteor, upcoming launches of the new Classic, and normalized production would support RE volume recovery going forward. VECV is also firmly on the recovery path.
We cut FY22E consol. EPS by 7%, accounting for the COVID impact on volumes and commodity inflation, while maintaining FY23E earnings estimates. Maintain Buy, with TP of INR3,200 (Mar’23 SOTP).
REs EBITDA/unit stable despite cost pressures; VECV misses estimates Consol. revenues/EBITDA/PAT grew 33%/58%/85% YoY to
~INR29.4b/INR6.8b/INR5.6b. FY21 consol. revenues/EBITDA/PAT declined 5%/16%/24% YoY.
RE’s 4QFY21 realizations grew 6.7% YoY (+1.7% QoQ) to INR142.8k (v/s est INR146k), driven by price hikes (~9% hike in FY21 and 3–8% across models since Jan’21) and a better mix.
S/A revenues grew 34% YoY to INR29.2b (v/s est INR 29.9b). S/A gross margins declined 322bp YoY to 40.3% (in-line).
S/A adj. EBITDA grew 47.5% YoY to INR6.7b (v/s est INR6.9b). Adj. EBITDA margins grew 210bp YoY (-60bp QoQ) to 22.9% (v/s est.23.2%). EBITDA per unit grew 17% YoY on low base, but was stable QoQ at INR32.7k (v/s INR33k in 3QFY21).
VECV realizations grew 10% YoY (-5% QoQ) to INR1.99m (v/s est INR2.03m). EBITDA margins were 8.9% (+710bps YoY, +30bp QoQ v/s est 10%). PAT stood at INR1.26b (v/s est INR1.73b).
Highlights from management commentary RE demand remains strong on the back of a strong order book, expected
pent-up demand, and a surge in export numbers. It has 2–3 months of order backlog, which would be catered to once the lockdowns are lifted. It expects to achieve 80k units/month in 2HFY22.
RE has a very exciting pipeline of new products, with FY22 having the highest ever number of model launches.
RE has reduced rhodium consumption by 66%; however, the benefit of this would be reflected in the coming quarters.
RE added a total of 535 stores, including main stores (>100 stores) and studio stores (>430 stores), in FY21, taking the total number of outlets to 2,056 across 1,750 cities (from 1200 cities). Network expansion in India is largely complete, except in one state.
Valuation and view We believe the recently launched Meteor and upcoming products would
help expand addressable markets and drive the next phase of growth for RE. The stock trades at 28.9x/21.6x FY22E/FY23E consol. EPS. Maintain Buy.
27 May 2021
4QFY21 Results Update | Sector: Automobile
Eicher Motors

Eicher Motors
27 May 2021 2
Quarterly performance (Consolidated, INR m) FY20 FY21 FY21E Y/E March 1Q 2Q 3Q 4Q 1Q 2Q 3Q 4Q FY20 FY21 4QE Net Operating income 23,819 21,925 23,710 22,082
8,182 21,336 28,283 29,403 91,536 87,204 29,089
Growth (%) -6.5 -9.0 1.3 -11.7 -65.7 -2.7 19.3 33.2 -6.6 -4.7 31.7 EBITDA 6,144 5,414 5,923 4,322
38 4,711 6,720 6,844 21,804 18,313 6,436
EBITDA Margins (%) 25.8 24.7 25.0 19.6
0.5 22.1 23.8 23.3 23.8 21.0 22.1 PAT 4,309 5,644 4,821 3,183
102 3,472 5,012 4,571 17,957 13,158 4,630
Share of JV Loss/(PAT)/ Min. Int. -209 -83 -166 140 654 39 -314 -690 -317.1 -311 -943 Recurring PAT 4,517 5,727 4,987 3,043
-552 3,433 5,326 5,634 18,274 13,841 5,573
Growth (%) -21.6 1.1 -6.4 -44.2 -112.2 -40.0 6.8 85.1 -17.7 -24.3 83.2 Standalone (Royal Enfield) Net operating income 23,526 21,819 23,635 21,795
7,692 21,233 28,041 29,224 90,775 86,190 29,923
Growth (%) -7.6 -9.2 0.8 -12.8 -67.3 -2.7 18.6 34.1 -7.3 -5.1 37.3 EBITDA 6,093 5,460 5,952 4,533
12 4,838 6,580 6,685 22,038 18,115 6,935
EBITDA Margins (%) 25.9 25.0 25.2 20.8
0.2 22.8 23.5 22.9 24.3 21.0 23.2 Recurring PAT 4,982 5,705 4,889 3,462
123 3,609 4,885 4,867 19,038 13,483 5,100
Growth (%) -15.7 15.8 -2.5 -27.9 -97.5 -36.7 -0.1 40.6 -7.8 -29.2 47.3 VECV: Quarterly performance
Net Op. Income 22,550 20,040 21,640 21,010
6,410 17,030 26,800 36,020 85,244 86,760 36,877 Growth (%) -13.6 -32.4 -23.2 -34.5 -71.6 -15.0 23.8 71.4 -26.5 1.8 75.5
EBITDA 1,250 1,050 1,375 370
-720 1,180 2,305 3,200 4,013 5,920 3,682 EBITDA Margins (%) 5.5 5.2 6.4 1.8
-11.2 6.9 8.6 8.9 4.7 6.8 10.0
Recurring PAT 380 150 300 -214
-1,200 -74 580 1,263 583 574 1,730 Growth (%) -67.8 -89.4 -60.6 -115.4 -416.3 -149.3 93.6 -690.1 -87.7 -1.5 -790.4
E: MOFSL Estimates
Key Performance Indicators
FY20 FY20 FY20 FY21 FY21E
Y/E March 1Q 2Q 3Q 4Q 1Q 2Q 3Q 4Q 4QE Standalone Volume ('000 units) 183.6 166.6 182.8 162.9
57.3 150.5 199.7 204.6 695.8 612.1 204.89
Change (%) -18.5 -20.7 -6.0 -17.0
-68.8 -9.6 9.2 25.6 -15.8 -12.0 25.8 Exports (as % of total vols) 5.0 8.3 3.7 5.8 15.5 4.0 3.2 8.5 5.6 6.3 8.5
Net Realn (INR '000/unit) 128.1 131.0 129.3 133.8
134.3 141.1 140.4 142.8 130.5 140.8 146.0 Growth YoY (%) 13.5 14.5 7.2 5.0 4.8 7.7 8.6 6.7 10.0 7.9 9.1 Cost Break-up
RM Cost (% of net op income) 54.1 54.5 54.7 56.5
61.9 57.7 59.1 59.7 54.9 59.2 60.0 Staff Cost (% of net op income) 8.7 8.2 7.5 9.4
22.0 9.3 7.9 7.3 8.4 9.3 7.7
Other Exp (% of net op income) 11.3 12.3 12.6 13.3 16.0 10.2 9.5 10.1 12.4 10.5 9.2 Gross Margins (%) 45.9 45.5 45.3 43.5
38.1 42.3 40.9 40.3 45.1 40.8 40.0
EBITDA Margins (%) 25.9 25.0 25.2 20.8
0.2 22.8 23.5 22.9 24.3 21.0 23.2 EBIT Margins (%) 22.2 20.9 21.2 15.8 -12.5 17.9 19.1 18.7 20.1 15.8 19.1 VECV
Total CV Volumes 13,331 11,370 12,391 11,629
2,173 8,167 12,802 18,126 48,721 41,268 18,170 Growth (%) -18.3 -39.2 -26.8 -44.7 -83.7 -28.2 3.3 55.9 -33.2 -15.3 56.2
Net Realn (INR '000/unit) - VECV 1,692 1,763 1,746 1,807
2,950 2,085 2,093 1,987 1,750 2,102 2030 Growth YoY (%) 5.9 11.1 5.0 18.3 74.4 18.3 19.9 10.0 10.1 20.2 12.3 E:MOFSL Estimates

Eicher Motors
27 May 2021 3
Exhibit 1: RE volume growth trend
Source: Company, MOFSL
Exhibit 2: RE realization trend
Source: Company, MOFSL
Exhibit 3: RE EBITDA margin trend
Source: Company, MOFSL
Exhibit 4: Dealer network expansion to be driven by RE studios in smaller cities
Source: Company, MOFSL
1,73
,838
1,
78,2
28
1,83
,998
2,
02,8
67
2,06
,586
2,
27,0
41
2,25
,361
2,
10,1
02
1,94
,473
1,
96,1
62
1,83
,589
1,
66,5
89
1,82
,791
1,
62,8
70
57,2
69
1,50
,519
1,
99,6
68
2,04
,604
38 20 25 22 19 27 22
4 -6 -14 -19 -21 -6
-17
-69
-10
9
26
3QFY
174Q
FY17
1QFY
182Q
FY18
3QFY
184Q
FY18
1QFY
192Q
FY19
3QFY
194Q
FY19
1QFY
202Q
FY20
3QFY
204Q
FY20
1QFY
212Q
FY21
3QFY
214Q
FY21
Royal Enfield volumes (units) Growth YoY %
1,05
,477
1,
05,7
31
1,08
,691
1,
06,6
51
1,09
,603
1,
11,4
23
1,12
,926
1,
14,4
23
1,20
,630
1,
27,4
25
1,28
,144
1,
30,9
73
1,29
,302
1,
33,8
18
1,34
,315
1,
41,0
63
1,40
,439
1,
42,8
34
3QFY
174Q
FY17
1QFY
182Q
FY18
3QFY
184Q
FY18
1QFY
192Q
FY19
3QFY
194Q
FY19
1QFY
202Q
FY20
3QFY
204Q
FY20
1QFY
212Q
FY21
3QFY
214Q
FY21
Royal Enfield Realizations (INR)
28.3
29.6
30.8
31.3
31.8
31.4
31.4
31.9
31.7
32.3
32.3
30.6
29.5 27.8
25.9
25.0
25.2
20.8
0.2
22.8 23.5 22.9
4QCY
15
5QFY
15
1QFY
17
2QFY
17
3QFY
17
4QFY
17
1QFY
18
2QFY
18
3QFY
18
4QFY
18
1QFY
19
2QFY
19
3QFY
19
4QFY
19
1QFY
20
2QFY
20
3QFY
20
4QFY
20
1QFY
21
2QFY
21
3QFY
21
4QFY
21
Royal Enfield EBITDA margins %
198 249 400 527 675 825 915 921 1023
600
1033
CY11 CY12 FY15 FY16(15m)
FY17 FY18 FY19 FY20 FY21
Large Stores Studio
Eicher Motors
27 May 2021 4
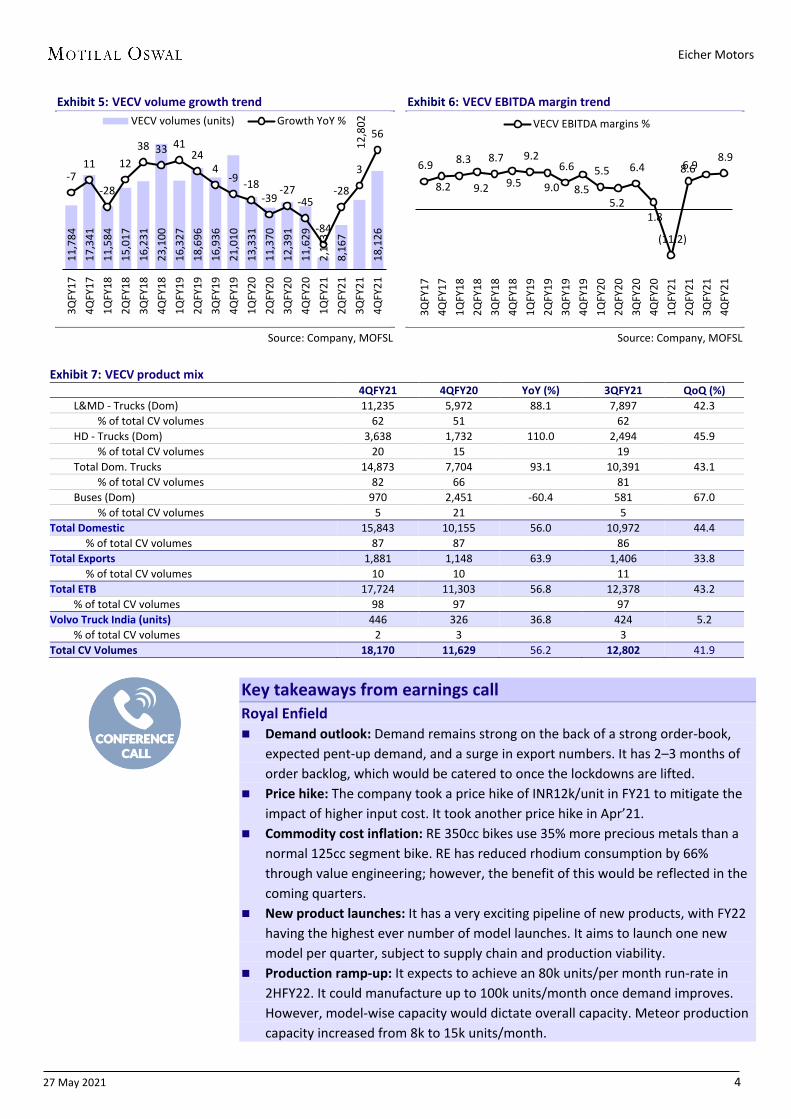
Exhibit 5: VECV volume growth trend
Source: Company, MOFSL
Exhibit 6: VECV EBITDA margin trend
Source: Company, MOFSL
Exhibit 7: VECV product mix
4QFY21 4QFY20 YoY (%) 3QFY21 QoQ (%) L&MD - Trucks (Dom) 11,235 5,972 88.1 7,897 42.3
% of total CV volumes 62 51 62 HD - Trucks (Dom) 3,638 1,732 110.0 2,494 45.9
% of total CV volumes 20 15 19 Total Dom. Trucks 14,873 7,704 93.1 10,391 43.1
% of total CV volumes 82 66 81 Buses (Dom) 970 2,451 -60.4 581 67.0
% of total CV volumes 5 21 5 Total Domestic 15,843 10,155 56.0 10,972 44.4
% of total CV volumes 87 87 86 Total Exports 1,881 1,148 63.9 1,406 33.8
% of total CV volumes 10 10 11 Total ETB 17,724 11,303 56.8 12,378 43.2
% of total CV volumes 98 97 97 Volvo Truck India (units) 446 326 36.8 424 5.2
% of total CV volumes 2 3 3 Total CV Volumes 18,170 11,629 56.2 12,802 41.9
Key takeaways from earnings call Royal Enfield Demand outlook: Demand remains strong on the back of a strong order-book,
expected pent-up demand, and a surge in export numbers. It has 2–3 months of order backlog, which would be catered to once the lockdowns are lifted.
Price hike: The company took a price hike of INR12k/unit in FY21 to mitigate the impact of higher input cost. It took another price hike in Apr’21.
Commodity cost inflation: RE 350cc bikes use 35% more precious metals than a normal 125cc segment bike. RE has reduced rhodium consumption by 66% through value engineering; however, the benefit of this would be reflected in the coming quarters.
New product launches: It has a very exciting pipeline of new products, with FY22 having the highest ever number of model launches. It aims to launch one new model per quarter, subject to supply chain and production viability.
Production ramp-up: It expects to achieve an 80k units/per month run-rate in 2HFY22. It could manufacture up to 100k units/month once demand improves. However, model-wise capacity would dictate overall capacity. Meteor production capacity increased from 8k to 15k units/month.
11,7
84
17,3
41
11,5
84
15,0
17
16,2
31
23,1
00
16,3
27
18,6
96
16,9
36
21,0
10
13,3
31
11,3
70
12,3
91
11,6
29
2,17
3 8,
167
12,8
02
18,1
26
-7 11
-28
12 38 33 41
24 4
-9 -18 -39
-27 -45
-84
-28
3
56
3QFY
174Q
FY17
1QFY
182Q
FY18
3QFY
184Q
FY18
1QFY
192Q
FY19
3QFY
194Q
FY19
1QFY
202Q
FY20
3QFY
204Q
FY20
1QFY
212Q
FY21
3QFY
214Q
FY21
VECV volumes (units) Growth YoY %
6.9
8.2
8.3
9.2
8.7
9.5
9.2
9.0
6.6
8.5 5.5
5.2
6.4
1.8
(11.2)
6.9 8.6 8.9
3QFY
174Q
FY17
1QFY
182Q
FY18
3QFY
184Q
FY18
1QFY
192Q
FY19
3QFY
194Q
FY19
1QFY
202Q
FY20
3QFY
204Q
FY20
1QFY
212Q
FY21
3QFY
214Q
FY21
VECV EBITDA margins %

Eicher Motors
27 May 2021 5
Distribution network: RE added a total of 535 stores, including main stores (>100 stores) and studio stores (>430 stores), in FY21, taking the total number of outlets to 2,056 across 1,750 cities (from 1200 cities). Network expansion in India is largely complete, except in one state.
International markets: Globally, it had over 130 exclusive stores in FY21 and a retail footprint of over 760 stores (in over 60 countries). Last year saw Royal Enfield foray into the new markets of Japan, Cambodia, Costa Rica, and the Dominican Republic. Also, it commenced CKD operations in Argentina.
Response to 650cc in India: The 650cc category saw lower volumes in India due to higher exports (US and EU have seasonal demand during non-winter). India has a huge backlog for 650cc. As per the management, it takes time for the consumers to rise to the bigger capacity bikes as well (as experienced with Himalayan).
Make It Yours (MIY): All 2,000 stores and models are now MIY enabled. The penetration of MIY stands at 80%, driving an increase in the penetration of accessories to 70% (from 30–40% earlier).
VECV VECV outperformed the industry in FY21 as it declined 15% (v/s 30% decline in the
CV industry). Its market share in LMD grew from 29.8% to 30.6% and market share in HD grew from 5.9% to 7.9% in FY21. Market share in the Bus segment grew from 14.1% to 19.1%. Market share gains were driven by the successful launch of BS6 and a focus on aftermarket sales services.
100% of BS6 CVs of VECV are connected vehicles, which has enabled substantial improvement in the uptime of vehicles.
Valuation and view Worst seems to be behind; expect recovery from 2QFY22: RE demand is back at
pre-COVID levels and is expected to improve going forward – on the back of new launches and ongoing expansion in the international markets. After witnessing severe headwinds over the last 18 months, we expect volumes to grow hereafter. The company continues to expand its addressable market through: a) distribution expansion (through smaller format stores), b) price laddering (by offering multiple 'trim' levels), c) new product launches (Meteor and more in the pipeline), and d) mass personalization through the ‘Make it Yours’ platform.
New product launches to drive strong volume growth: With healthy response received for the new Meteor, all the recent RE product launches have seen good success (Himalayan, 650cc Twins, and Meteor). The upcoming new product launch of the new Classic (expected in 1QFY22) on the brand-new platform would not only expand the product portfolio and narrow the gap in product quality vis-à-vis 650cc Twins but also substantially expand the addressable market in India and globally. We expect a 27% volume CAGR (FY21–23E), which would drive margin recovery (by 510bp) to 26.3% by FY23E and an S/A PAT CAGR of ~54%.
Export market presents huge opportunity; to fully play out in next few years: RE is focused on creating an affordable Leisure Biking segment in the 250–650cc range and in the price range of USD3–7k. Globally, the size of the 250–650cc segment is ~1m annually, dominated by the Sports/Street Biking segments. Exports from India for the premium segment (Ex RE, >150cc) are over 0.5m

Eicher Motors
27 May 2021 6
annually. However, RE exports were flat YoY in FY21 to ~39k units (flat YoY in FY20 v/s 19k units in FY19). Exports are expected to grow with new launches such as Meteor with international product quality. EIM has recently started executing its export strategy based on experiential marketing, as the company has done in India, and is opening exclusive stores in markets such as LATAM, Indonesia, London, Paris, Madrid, and ASEAN. The exclusive store count increased to 130 in FY21. However, the ramp-up would be gradual as it would take time for RE to build its brand and replicate its Indian strategy of creating brand pull by building a riding culture.
Consol. EPS to post 54% CAGR over FY21–23E; maintain Buy: We cut FY22E consol. EPS by 7%, accounting for the COVID impact on volumes and commodity inflation, while maintaining FY23E earnings estimates. RE demand is expected to recover post the lockdown – on the back of new launches and ongoing expansion in the international markets. After witnessing severe headwinds over the last 18 months, we expect volumes to grow hereafter. We believe the recent beginning of new launches could be an inflection point for RE as a completely new and improved platform could drive revival. Furthermore, VECV would see cyclical recovery in volumes and profits, in turn driving a consolidated PAT CAGR to 54%. The stock trades at 28.9x/21.6x FY22E/FY23E consol. EPS. Maintain Buy, with TP of ~INR3,200 (Mar’23-based SOTP).
Exhibit 8: Revised forecast (INR M) FY22E FY23E Rev Old Chg (%) Rev Old Chg (%) Standalone (RE) Volumes (units) 8,56,943 8,91,770 (3.9) 9,88,478 9,86,933 0.2 Net Sales 1,26,204 1,30,428 (3.2) 1,49,304 1,49,065 0.2 EBITDA 30,868 33,074 (6.7) 39,295 39,776 (1.2) EBITDA (%) 24.5 25.4 -90bp 26.3 26.7 -40bp Net Profit 23,827 25,580 (6.9) 31,464 31,998 (1.7) EPS (INR) 87 94 (6.9) 115 117 (1.7) VECV Volumes (units) 58,869 58,882 (0.0) 70,646 58,882 20.0 Net Sales 1,22,422 1,19,784 2.2 1,45,615 1,19,784 21.6 EBITDA 10,973 10,942 0.3 13,507 10,942 23.4 EBITDA (%) 9.0 9.1 -20bp 9.3 9.1 10bp EPS (INR) 7.8 7.8 0.6 11.6 7.8 48.2 Consol EPS (INR) 90.2 96.5 (6.6) 120.4 122.3 (1.5)
Source: MOFSL Exhibit 9: SOTP valuations INR M FY22E FY23E Royal Enfield PE (x) 25 25
PAT 23,827 31,464 Equity Value PE @ 25x 5,95,670 7,77,166
VECV (@ 54.4% Economic interest) 12 12 EBITDA 5,969 7,348 EV @ 12x EV/EBITDA 71,633 87,440 Net Debt -5,817 -9,013 Equity Value 77,451 96,453
Total Equity Value 6,73,120 8,73,619 Target Price (INR/sh) 2,466 3,200
Upside (%) (5) 23

Eicher Motors
27 May 2021 7
Source: Company, MOFSL
Exhibit 10: Valuations – PE and PB band
Source: MOFSL
Source: MOFSL
26.8
28.0
41.2
11.2
35.8
20.3
0.0
12.0
24.0
36.0
48.0
May
-11
Aug-
12
Nov
-13
Feb-
15
May
-16
Aug-
17
Nov
-18
Feb-
20
May
-21
P/E (x) Avg (x) Max (x)Min (x) +1SD -1SD
5.1
6.8
13.1
2.2
9.9
3.7
0.0
5.0
10.0
15.0
May
-11
Aug-
12
Nov
-13
Feb-
15
May
-16
Aug-
17
Nov
-18
Feb-
20
May
-21
P/B (x) Avg (x) Max (x)Min (x) +1SD -1SD

Eicher Motors
27 May 2021 8
Exhibit 11: Snapshot of revenue model 000 units FY17 FY18 FY19 FY20 FY21 FY22E FY23E ROYAL ENFIELD (S/A) Total 2W (units) 666 820 826 696 612 857 988
Growth (%) 38.8 23.1 0.7 -15.8 -12.0 40.0 15.3 Net realn (INR'000/unit) 105 109 118 129 140 146 150
Growth (%) 2.4 3.3 8.3 10.1 8.2 4.2 2.5 RE Revenues (INR b) 70 90 98 91 86 126 149
Growth (%) 42.1 27.3 9.3 -7.3 -5.1 46.4 18.3 VECV Dom - LMD 38 44 48 36 27 39 47
Growth (%) 14.1 13.6 11.4 -26.2 -23.3 42.5 20.5 % of CV Vols 66.7 67.1 67.5 75.1 68.3 68.1 68.2
Dom - HCV 11 12 13 7 8 12 14 Growth (%) 14.8 11.4 7.3 -45.2 6.0 50.0 20.0 % of CV Vols 19.3 19.1 18.5 15.3 19.2 20.1 20.1
Total Dom. 49 56 62 43 35 51 61 Growth (%) 14.3 13.1 10.5 -30.3 -18.3 44.1 20.4 % of CV Vols 86.0 86.1 86.0 90.4 87.5 88.2 88.3
Exports 8 9 10 5 5 7 8 Growth (%) 33.7 12.0 11.2 -54.4 10.0 35.0 19.0 % of CV Vols 14.0 13.9 14.0 9.6 12.5 11.8 11.7
Total CV vols 57 65 72 48 40 57 69 Growth (%) 16.7 12.9 10.6 -33.6 -15.6 43.0 20.2
MDEP Vols ('000 Ex captive) 24 32 34 31 22 23 24 Net realn (INR'000/unit) 1,459 1,524 1,590 1,750 2,102 2,080 2,061 Growth (%) 24 4 4 10 20 -1 -1 VECV Revenues (INR b) 86 100 116 85 87 122 146
Growth (%) 15.7 17.5 15.4 -26.5 1.8 41.1 18.9 Net Consol sales (INR b) 70 90 98 92 87 126 149
Growth (%) 42.4 27.5 9.3 -6.6 -4.7 44.7 18.3

Eicher Motors
27 May 2021 9
Story in charts
Exhibit 12: RE volume and growth trends
Source: Company, MOFSL
Exhibit 13: RE EBITDA and EBITDA margin trends
Source: Company, MOFSL
Exhibit 14: VECV volume growth trajectory
Source: Company, MOFSL
Exhibit 15: VECV EBITDA and EBITDA margins
Source: Company, MOFSL
Exhibit 16: Strong FCF generation and liquidity (pro-rata)
Source: Company, MOFSL
Exhibit 17: Return ratios to remain healthy
Source: Company, MOFSL
6,00
,175
6,66
,490
8,20
,492
8,26
,098
6,95
,839
6,12
,060
8,56
,943
9,88
,478
58.7
38.8
23.1
0.7
-15.8 -12.0
40.0
15.3
FY16E(15m)
FY17 FY18 FY19 FY20 FY21 FY22E FY23E
Volumes (units) Growth (%)
17,1
23
22,0
58
28,5
32
29,4
44
22,0
38
18,1
15
30,8
68
39,2
95
27.7 31.3 31.9 30.1
24.3 21.0
24.5 26.3
FY16E(15m)
FY17 FY18 FY19 FY20 FY21 FY22E FY23E
EBITDA EBITDA Margins (%)
61,5
49
57,4
41
64,8
77
71,7
43
47,6
14
40,1
88 57
,465
69,1
02
54.3
16.7 12.9 10.6
(33.6) (15.6)
43.0
20.2
FY16(15m)
FY17 FY18 FY19 FY20 FY21 FY22E FY23E
VECV (units) Growth YoY %
7,7
52
6,7
85
9,0
55
9,7
27
4,0
13
5,9
20
10,
973
13,
507
8.4 7.9 9.0
8.4
4.7
6.8
9.0 9.3
FY16(15m)
FY17 FY18 FY19 FY20 FY21 FY22E FY23E
EBITDA (INR m) EBITDA (%)
14.0 20.8 9.1 11.2 9.2 36.8 34.9
31.4 50.9
62.2 49.4
70.9
106.7
140.8
FY17 FY18 FY19 FY20 FY21 FY22E FY23E
FCFF (INR b) Net Cash (INR b)
38 34
28
19
13
20 22
37 33
26
19
13
20 22
FY17 FY18 FY19 FY20 FY21 FY22E FY23E
RoE RoCE

Eicher Motors
27 May 2021 10
Financials and valuations
Income Statement (Consolidated)
(INR m) Y/E March FY18 FY19 FY20 FY21 FY22E FY23E Net Op. Income 92,193 97,971 91,536 87,204 1,26,204 1,49,304
Change (%) 16.1 6.3 -6.6 -4.7 44.7 18.3 EBITDA 28,076 29,031 21,804 18,313 30,408 38,835
EBITDA Margin (%) 31.5 29.9 24.0 21.1 24.3 26.3 Depreciation 2,233 3,003 3,815 4,507 4,930 5,253 EBIT 25,843 26,028 17,988 13,805 25,478 33,582 Interest cost 53 73 189 165 130 130 Other Income 2,801 4,434 5,433 4,532 4,700 6,200 PBT 28,591 30,389 23,232 18,173 30,048 39,652 Tax 9,359 10,770 5,275 4,515 7,578 9,950 Effective Rate (%) 32.7 35.4 22.7 24.8 25.2 25.1 PAT 19,232 19,619 17,957 13,658 22,470 29,701 Change (%) 26.2 2.0 -8.5 -23.9 64.5 32.2 Less: Minority Interest -2,566 -2,584 -317 -311 -2,143 -3,157 Adj. PAT 21,017 22,203 18,274 13,841 24,612 32,858
Change (%) 22.7 5.6 -17.7 -24.3 77.8 33.5 Note: FY16 onwards IndAS
Balance Sheet (Consolidated)
(INR m) Y/E March FY18 FY19 FY20 FY21 FY22E FY23E Share Capital 273 273 273 273 273 273 Net Worth 70,301 89,187 99,809 1,14,381 1,33,533 1,59,566 Minority Interest 0 0 0 0 -2,143 -5,299 Deferred Tax 1,421 2,739 2,522 2,215 3,471 5,128 Loans 1,508 1,868 1,444 1,574 0 0 Capital Employed 73,230 93,794 1,03,775 1,18,170 1,34,861 1,59,394 Application of Funds
Gross Fixed Assets 21,443 27,673 36,194 41,260 48,406 52,906 Less: Depreciation 6,426 8,927 12,419 16,927 21,857 27,110 Net Fixed Assets 15,017 18,746 23,775 24,333 26,549 25,796 Capital WIP 3,332 4,497 3,122 3,143 250 250 - of which Goodwill 223 223 223 223 223 223 Investments 55,808 49,225 57,488 39,021 40,307 42,201 Curr.Assets, L & Adv. 21,065 41,400 40,113 79,089 95,264 1,23,599 Inventory 3,946 6,334 5,724 8,746 6,224 7,363 Sundry Debtors 680 903 868 1,582 1,037 1,227 Cash & Bank Balances 12,120 29,653 29,506 58,304 81,952 1,07,851 Loans & Advances 7 13 1 4,592 0 0 Others 4,312 4,497 4,014 5,866 6,051 7,158 Current Liab. & Prov. 21,992 20,075 20,722 27,416 27,508 32,452 Sundry Creditors 11,719 12,341 10,277 15,358 15,559 18,407 Other Liabilities 9,511 6,928 9,472 10,930 10,373 12,272 Provisions 763 807 974 1,128 1,576 1,773 Net Current Assets -927 21,325 19,391 51,673 67,755 91,147 Application of Funds 73,230 93,794 1,03,775 1,18,170 1,34,861 1,59,394 E: MOFSL Estimates

Eicher Motors
27 May 2021 11
Financials and valuations
Ratios (Consolidated)
Y/E March FY18 FY19 FY20 FY21 FY22E FY23E Basic (INR) EPS 77.1 81.4 66.9 50.7 90.2 120.4 EPS Growth (%) 23.5 5.6 -17.8 -24.3 77.8 33.5 Cash EPS 85 92 81 67 108 140 Book Value per Share 258 327 366 419 489 584 DPS 11.0 12.5 12.5 17.0 20.0 25.0 Payout (Incl. Div. Tax) % 15.6 17.9 21.7 33.5 22.2 20.8 Valuation (x) P/E 33.8 32.0 38.9 51.4 28.9 21.6 Cash P/E 30.5 28.2 32.2 38.8 24.1 18.7 EV/EBITDA 19.7 18.7 27.3 30.0 16.4 12.2 EV/Sales 4.6 4.0 4.8 4.8 3.1 2.5 Price to Book Value 10.1 8.0 7.1 6.2 5.3 4.5 Dividend Yield (%) 0.4 0.5 0.5 0.7 0.8 1.0 Profitability Ratios (%) RoE 34.0 27.8 19.3 12.9 19.9 22.4 RoCE 32.6 26.4 18.7 12.6 19.6 22.4 RoIC 1,373.6 298.2 117.5 67.7 137.4 256.6 Turnover Ratios Debtors (Days) 3 3 3 7 3 3 Inventory (Days) 16 24 23 37 18 18 Creditors (Days) 48 46 41 64 45 45 Working Capital (Days) -29 -19 -15 -21 -24 -24 Asset Turnover (x) 1.2 1.0 0.9 0.7 0.9 0.9 Leverage Ratio Net Debt/Equity (x) -0.7 -0.6 -0.7 -0.7 -0.8 -0.8
Cash Flow Statement (Consolidated)
(INR m) Y/E March FY18 FY19 FY20 FY21 FY22E FY23E Profit before Tax 28,956 32,798 23,549 17,984 32,190 42,809 Depreciation 2,233 3,003 3,815 4,507 4,930 5,253 Direct Taxes Paid -8,071 -9,085 -6,283 -4,566 -6,322 -8,294 (Inc)/Dec in Working Capital 4,380 -4,557 862 2,578 3,268 1,519 Interest/Div. Received -394 -1,304 -2,207 -3,103 -3,750 -5,250 Other Items -2,282 -5,126 -2,795 -265 -272 -5,082 CF from Oper. Activity 24,823 15,730 16,941 17,136 30,044 30,955 (Inc)/Dec in FA+CWIP -7,460 -7,874 -5,445 -5,375 -4,253 -4,500 Free Cash Flow 17,363 7,855 11,497 11,760 25,791 26,455 (Pur)/Sale of Invest. -13,991 1,301 -9,639 -11,104 2,464 3,356 CF from Inv. Activity -21,450 -6,574 -15,084 -16,479 -1,789 -1,144 Issue of Shares 195 361 289 384 0 0 Inc/(Dec) in Debt 390 247 -709 130 -1,574 0 Interest Paid -34 -50 -75 -91 -130 -130 Dividends Paid -3,171 -3,482 -8,087 0 -5,460 -6,825 CF from Fin. Activity -2,620 -2,923 -8,583 -148 -7,164 -6,955 Inc/(Dec) in Cash 752 6,233 -6,725 509 21,091 22,856 Add: Beginning Balance 172 925 7,158 432 941 22,032 Closing Balance 925 7,158 432 941 22,032 44,888 E: MOFSL Estimates -11,196 -22,495 -29,074 -57,362 -59,919 -62,963

Eicher Motors
27 May 2021 12
N O T E S

Eicher Motors
27 May 2021 13
Explanation of Investment Rating Investment Rating Expected return (over 12-month) BUY >=15% SELL < - 10% NEUTRAL < - 10 % to 15% UNDER REVIEW Rating may undergo a change NOT RATED We have forward looking estimates for the stock but we refrain from assigning recommendation
*In case the recommendation given by the Research Analyst is inconsistent with the investment rating legend for a continuous period of 30 days, the Research Analyst shall within following 30 days take appropriate measures to make the recommendation consistent with the investment rating legend. Disclosures The following Disclosures are being made in compliance with the SEBI Research Analyst Regulations 2014 (herein after referred to as the Regulations). Motilal Oswal Financial Services Ltd. (MOFSL) is a SEBI Registered Research Analyst having registration no. INH000000412. MOFSL, the Research Entity (RE) as defined in the Regulations, is engaged in the business of providing Stock broking services, Investment Advisory Services, Depository participant services & distribution of various financial products. MOFSL is a subsidiary company of Passionate Investment Management Pvt. Ltd.. (PIMPL). MOFSL is a listed public company, the details in respect of which are available on www.motilaloswal.com. MOFSL (erstwhile Motilal Oswal Securities Limited - MOSL) is registered with the Securities & Exchange Board of India (SEBI) and is a registered Trading Member with National Stock Exchange of India Ltd. (NSE) and Bombay Stock Exchange Limited (BSE), Multi Commodity Exchange of India Limited (MCX) and National Commodity & Derivatives Exchange Limited (NCDEX) for its stock broking activities & is Depository participant with Central Depository Services Limited (CDSL) National Securities Depository Limited (NSDL),NERL, COMRIS and CCRL and is member of Association of Mutual Funds of India (AMFI) for distribution of financial products and Insurance Regulatory & Development Authority of India (IRDA) as Corporate Agent for insurance products. Details of associate entities of Motilal Oswal Financial Services Limited are available on the website at http://onlinereports.motilaloswal.com/Dormant/documents/List%20of%20Associate%20companies.pdf MOFSL and its associate company(ies), their directors and Research Analyst and their relatives may; (a) from time to time, have a long or short position in, act as principal in, and buy or sell the securities or derivatives thereof of companies mentioned herein. (b) be engaged in any other transaction involving such securities and earn brokerage or other compensation or act as a market maker in the financial instruments of the company(ies) discussed herein or act as an advisor or lender/borrower to such company(ies) or may have any other potential conflict of interests with respect to any recommendation and other related information and opinions.; however the same shall have no bearing whatsoever on the specific recommendations made by the analyst(s), as the recommendations made by the analyst(s) are completely independent of the views of the associates of MOFSL even though there might exist an inherent conflict of interest in some of the stocks mentioned in the research report MOFSL and / or its affiliates do and seek to do business including investment banking with companies covered in its research reports. As a result, the recipients of this report should be aware that MOFSL may have a potential conflict of interest that may affect the objectivity of this report. Compensation of Research Analysts is not based on any specific merchant banking, investment banking or brokerage service transactions. Details of pending Enquiry Proceedings of Motilal Oswal Financial Services Limited are available on the website at https://galaxy.motilaloswal.com/ResearchAnalyst/PublishViewLitigation.aspx A graph of daily closing prices of securities is available at www.nseindia.com, www.bseindia.com. Research Analyst views on Subject Company may vary based on Fundamental research and Technical Research. Proprietary trading desk of MOFSL or its associates maintains arm’s length distance with Research Team as all the activities are segregated from MOFSL research activity and therefore it can have an independent view with regards to Subject Company for which Research Team have expressed their views. Regional Disclosures (outside India) This report is not directed or intended for distribution to or use by any person or entity resident in a state, country or any jurisdiction, where such distribution, publication, availability or use would be contrary to law, regulation or which would subject MOFSL & its group companies to registration or licensing requirements within such jurisdictions. For Hong Kong: This report is distributed in Hong Kong by Motilal Oswal capital Markets (Hong Kong) Private Limited, a licensed corporation (CE AYY-301) licensed and regulated by the Hong Kong Securities and Futures Commission (SFC) pursuant to the Securities and Futures Ordinance (Chapter 571 of the Laws of Hong Kong) “SFO”. As per SEBI (Research Analyst Regulations) 2014 Motilal Oswal Securities (SEBI Reg No. INH000000412) has an agreement with Motilal Oswal capital Markets (Hong Kong) Private Limited for distribution of research report in Hong Kong. This report is intended for distribution only to “Professional Investors” as defined in Part I of Schedule 1 to SFO. Any investment or investment activity to which this document relates is only available to professional investor and will be engaged only with professional investors.” Nothing here is an offer or solicitation of these securities, products and services in any jurisdiction where their offer or sale is not qualified or exempt from registration. The Indian Analyst(s) who compile this report is/are not located in Hong Kong & are not conducting Research Analysis in Hong Kong. For U.S. Motilal Oswal Financial Services Limited (MOFSL) is not a registered broker - dealer under the U.S. Securities Exchange Act of 1934, as amended (the"1934 act") and under applicable state laws in the United States. In addition MOFSL is not a registered investment adviser under the U.S. Investment Advisers Act of 1940, as amended (the "Advisers Act" and together with the 1934 Act, the "Acts), and under applicable state laws in the United States. Accordingly, in the absence of specific exemption under the Acts, any brokerage and investment services provided by MOFSL , including the products and services described herein are not available to or intended for U.S. persons. This report is intended for distribution only to "Major Institutional Investors" as defined by Rule 15a-6(b)(4) of the Exchange Act and interpretations thereof by SEC (henceforth referred to as "major institutional investors"). This document must not be acted on or relied on by persons who are not major institutional investors. Any investment or investment activity to which this document relates is only available to major institutional investors and will be engaged in only with major institutional investors. In reliance on the exemption from registration provided by Rule 15a-6 of the U.S. Securities Exchange Act of 1934, as amended (the "Exchange Act") and interpretations thereof by the U.S. Securities and Exchange Commission ("SEC") in order to conduct business with Institutional Investors based in the U.S., MOFSL has entered into a chaperoning agreement with a U.S. registered broker-dealer, Motilal Oswal Securities International Private Limited. ("MOSIPL"). Any business interaction pursuant to this report will have to be executed within the provisions of this chaperoning agreement. The Research Analysts contributing to the report may not be registered /qualified as research analyst with FINRA. Such research analyst may not be associated persons of the U.S. registered broker-dealer, MOSIPL, and therefore, may not be subject to NASD rule 2711 and NYSE Rule 472 restrictions on communication with a subject company, public appearances and trading securities held by a research analyst account. For Singapore In Singapore, this report is being distributed by Motilal Oswal Capital Markets Singapore Pte Ltd (“MOCMSPL”) (Co.Reg. NO. 201129401Z) which is a holder of a capital markets services license and an exempt financial adviser in Singapore.As per the approved agreement under Paragraph 9 of Third Schedule of Securities and Futures Act (CAP 289) and Paragraph 11 of First Schedule of Financial Advisors Act (CAP 110) provided to MOCMSPL by Monetary Authority of Singapore. Persons in Singapore should contact MOCMSPL in respect of any matter arising from, or in connection with this report/publication/communication. This report is distributed solely to persons who qualify as “Institutional Investors”, of which some of whom may consist of "accredited" institutional investors as defined in section 4A(1) of the Securities and Futures Act, Chapter 289 of Singapore (“the SFA”). Accordingly, if a Singapore person is not or ceases to be such an institutional investor, such Singapore Person must immediately discontinue any use of this Report and inform MOCMSPL. Specific Disclosures 1 MOFSL, Research Analyst and/or his relatives does not have financial interest in the subject company, as they do not have equity holdings in the subject company. 2 MOFSL, Research Analyst and/or his relatives do not have actual/beneficial ownership of 1% or more securities in the subject company 3 MOFSL, Research Analyst and/or his relatives have not received compensation/other benefits from the subject company in the past 12 months 4 MOFSL, Research Analyst and/or his relatives do not have material conflict of interest in the subject company at the time of publication of research report 5 Research Analyst has not served as director/officer/employee in the subject company 6 MOFSL has not acted as a manager or co-manager of public offering of securities of the subject company in past 12 months 7 MOFSL has not received compensation for investment banking/ merchant banking/brokerage services from the subject company in the past 12 months 8 MOFSL has not received compensation for other than investment banking/merchant banking/brokerage services from the subject company in the past 12 months 9 MOFSL has not received any compensation or other benefits from third party in connection with the research report 10 MOFSL has not engaged in market making activity for the subject company
********************************************************************************************************************************

Eicher Motors
27 May 2021 14
The associates of MOFSL may have: - financial interest in the subject company - actual/beneficial ownership of 1% or more securities in the subject company - received compensation/other benefits from the subject company in the past 12 months - other potential conflict of interests with respect to any recommendation and other related information and opinions.; however the same shall have no bearing whatsoever on the
specific recommendations made by the analyst(s), as the recommendations made by the analyst(s) are completely independent of the views of the associates of MOFSL even though there might exist an inherent conflict of interest in some of the stocks mentioned in the research report.
- acted as a manager or co-manager of public offering of securities of the subject company in past 12 months - be engaged in any other transaction involving such securities and earn brokerage or other compensation or act as a market maker in the financial instruments of the
company(ies) discussed herein or act as an advisor or lender/borrower to such company(ies) - received compensation from the subject company in the past 12 months for investment banking / merchant banking / brokerage services or from other than said services.
The associates of MOFSL has not received any compensation or other benefits from third party in connection with the research report Above disclosures include beneficial holdings lying in demat account of MOFSL which are opened for proprietary investments only. While calculating beneficial holdings, It does not consider demat accounts which are opened in name of MOFSL for other purposes (i.e holding client securities, collaterals, error trades etc.). MOFSL also earns DP income from clients which are not considered in above disclosures. Analyst Certification The views expressed in this research report accurately reflect the personal views of the analyst(s) about the subject securities or issues, and no part of the compensation of the research analyst(s) was, is, or will be directly or indirectly related to the specific recommendations and views expressed by research analyst(s) in this report. Terms & Conditions: This report has been prepared by MOFSL and is meant for sole use by the recipient and not for circulation. The report and information contained herein is strictly confidential and may not be altered in any way, transmitted to, copied or distributed, in part or in whole, to any other person or to the media or reproduced in any form, without prior written consent of MOFSL. The report is based on the facts, figures and information that are considered true, correct, reliable and accurate. The intent of this report is not recommendatory in nature. The information is obtained from publicly available media or other sources believed to be reliable. Such information has not been independently verified and no guaranty, representation of warranty, express or implied, is made as to its accuracy, completeness or correctness. All such information and opinions are subject to change without notice. The report is prepared solely for informational purpose and does not constitute an offer document or solicitation of offer to buy or sell or subscribe for securities or other financial instruments for the clients. Though disseminated to all the customers simultaneously, not all customers may receive this report at the same time. MOFSL will not treat recipients as customers by virtue of their receiving this report. Disclaimer: The report and information contained herein is strictly confidential and meant solely for the selected recipient and may not be altered in any way, transmitted to, copied or distributed, in part or in whole, to any other person or to the media or reproduced in any form, without prior written consent. This report and information herein is solely for informational purpose and may not be used or considered as an offer document or solicitation of offer to buy or sell or subscribe for securities or other financial instruments. Nothing in this report constitutes investment, legal, accounting and tax advice or a representation that any investment or strategy is suitable or appropriate to your specific circumstances. The securities discussed and opinions expressed in this report may not be suitable for all investors, who must make their own investment decisions, based on their own investment objectives, financial positions and needs of specific recipient. This may not be taken in substitution for the exercise of independent judgment by any recipient. Each recipient of this document should make such investigations as it deems necessary to arrive at an independent evaluation of an investment in the securities of companies referred to in this document (including the merits and risks involved), and should consult its own advisors to determine the merits and risks of such an investment. The investment discussed or views expressed may not be suitable for all investors. Certain transactions -including those involving futures, options, another derivative products as well as non-investment grade securities - involve substantial risk and are not suitable for all investors. No representation or warranty, express or implied, is made as to the accuracy, completeness or fairness of the information and opinions contained in this document. The Disclosures of Interest Statement incorporated in this document is provided solely to enhance the transparency and should not be treated as endorsement of the views expressed in the report. This information is subject to change without any prior notice. The Company reserves the right to make modifications and alternations to this statement as may be required from time to time without any prior approval. MOFSL, its associates, their directors and the employees may from time to time, effect or have effected an own account transaction in, or deal as principal or agent in or for the securities mentioned in this document. They may perform or seek to perform investment banking or other services for, or solicit investment banking or other business from, any company referred to in this report. Each of these entities functions as a separate, distinct and independent of each other. The recipient should take this into account before interpreting the document. This report has been prepared on the basis of information that is already available in publicly accessible media or developed through analysis of MOFSL. The views expressed are those of the analyst, and the Company may or may not subscribe to all the views expressed therein. This document is being supplied to you solely for your information and may not be reproduced, redistributed or passed on, directly or indirectly, to any other person or published, copied, in whole or in part, for any purpose. This report is not directed or intended for distribution to, or use by, any person or entity who is a citizen or resident of or located in any locality, state, country or other jurisdiction, where such distribution, publication, availability or use would be contrary to law, regulation or which would subject MOFSL to any registration or licensing requirement within such jurisdiction. The securities described herein may or may not be eligible for sale in all jurisdictions or to certain category of investors. Persons in whose possession this document may come are required to inform themselves of and to observe such restriction. Neither the Firm, not its directors, employees, agents or representatives shall be liable for any damages whether direct or indirect, incidental, special or consequential including lost revenue or lost profits that may arise from or in connection with the use of the information. The person accessing this information specifically agrees to exempt MOFSL or any of its affiliates or employees from, any and all responsibility/liability arising from such misuse and agrees not to hold MOFSL or any of its affiliates or employees responsible for any such misuse and further agrees to hold MOFSL or any of its affiliates or employees free and harmless from all losses, costs, damages, expenses that may be suffered by the person accessing this information due to any errors and delays. Registered Office Address: Motilal Oswal Tower, Rahimtullah Sayani Road, Opposite Parel ST Depot, Prabhadevi, Mumbai-400025; Tel No.: 022 71934200/ 022-71934263; Website www.motilaloswal.com.CIN no.: L67190MH2005PLC153397.Correspondence Office Address: Palm Spring Centre, 2nd Floor, Palm Court Complex, New Link Road, Malad(West), Mumbai- 400 064. Tel No: 022 7188 1000. Registration Nos.: Motilal Oswal Financial Services Limited (MOFSL)*: INZ000158836(BSE/NSE/MCX/NCDEX); CDSL and NSDL: IN-DP-16-2015; Research Analyst: INH000000412. AMFI: ARN - 146822; Investment Adviser: INA000007100; Insurance Corporate Agent: CA0579;PMS:INP000006712. Motilal Oswal Asset Management Company Ltd. (MOAMC): PMS (Registration No.: INP000000670); PMS and Mutual Funds are offered through MOAMC which is group company of MOFSL. Motilal Oswal Wealth Management Ltd. (MOWML): PMS (Registration No.: INP000004409) is offered through MOWML, which is a group company of MOFSL. Motilal Oswal Financial Services Limited is a distributor of Mutual Funds, PMS, Fixed Deposit, Bond, NCDs,Insurance Products and IPOs.Real Estate is offered through Motilal Oswal Real Estate Investment Advisors II Pvt. Ltd. which is a group company of MOFSL. Private Equity is offered through Motilal Oswal Private Equity Investment Advisors Pvt. Ltd which is a group company of MOFSL. Research & Advisory services is backed by proper research. Please read the Risk Disclosure Document prescribed by the Stock Exchanges carefully before investing. There is no assurance or guarantee of the returns. Investment in securities market is subject to market risk, read all the related documents carefully before investing. Details of Compliance Officer: Name: Neeraj Agarwal, Email ID: [email protected], Contact No.:022-71881085. * MOSL has been amalgamated with Motilal Oswal Financial Services Limited (MOFSL) w.e.f August 21, 2018 pursuant to order dated July 30, 2018 issued by Hon'ble National Company Law Tribunal, Mumbai Bench.