Embed Size (px)
Citation preview
STATE HIGHWAY ADMINISTRATION
RESEARCH REPORT
Efficient and Effective Implementation of Alternative Project Delivery Methods
University of Maryland College Park
FINAL REPORT
May 2017
MD‐17‐ SHA/UM/3‐35

The contents of this report reflect the views of the author who is responsible for the facts and the accuracy of the data presented herein. The contents do not necessarily reflect the official views or policies of the Maryland Department of Transportation State Highway Administration. This report does not constitute a standard, specification, or regulation.
i
TECHNICAL REPORT DOCUMENTATION PAGE
1. Report No MDOT SHA/UM/3-35
2. Government Accession No. 3. Recipient Catalog No.
4. Title and Subtitle Efficient and Effective Implementation of Alternative Project Delivery Methods
5. Report Date May 2017
6. Performing Organization Code
7. Authors Qingbin Cui, Josh Ceribelli and Kunqi Zhang
8. Performing Organization Report No.
9. Performing Organization Name and Address National Transportation Center University of Maryland Department of Civil and Environmental Engineering College Park, MD 20742
10. Work Unit No.
11. Contract or Grant No. SP509B4G
12. Sponsoring Agency Name and Address Maryland State Highway Administration Office of Policy & Research 707 North Calvert Street Baltimore, Maryland 21202
13. Type of Report and Period Covered Final Report
14. Sponsoring Agency Code
15. Supplementary Notes
16. Abstract Over the past decade, the Maryland Department of Transportation State Highway Administration (MDOT SHA) has implemented Alternative Project Delivery (APD) methods in a number of transportation projects. While these innovative practices have produced significant schedule and cost improvements, the potential benefits have not been fully achieved. This research identified the barriers and solutions to improve the APD implementation process at MDOT SHA. The study was based on structured interviews and empirical analysis of cost and time performance of DB projects that have been executed over the past 15 years. Among the results include the high correlation between efficient communication and higher project success and satisfaction. Additionally, the data analysis showed that many issues in APD projects stem from a lack of knowledge and a poor mindset regarding the transition from the traditional delivery method of Design Bid Build (DBB) to an APD method. However, the data suggests that overall project satisfaction with APD projects versus DBB projects is higher at 3.8 out of 5 vs. 3.4 out of 5, respectively. While there was a higher satisfaction for APD projects, there was also a much larger variance in the APD satisfaction compared to DBB which suggests that there is room for improvement with APD methods. 17. Key Words Alternative Project Delivery, Design-Build, Governance Structure, Empirical Analysis
18. Distribution Statement This document is available from the Research Division upon request.
19. Security Classification (of this report) Unclassified
20. Security Classification (of this page) Unclassified
21. No of Pages 90
22. Price
Form DOT F 1700.7 (8-72) Reproduction of completed page authorized
ii
ACKNOWLEDGEMENT The authors would like to acknowledge the following individuals from the Maryland Department of Transportation State Highway Administration who provided overall guidance for this project: Jeffrey Folden, David Philips and Sharon Hawkins. The authors would also like to extend special acknowledgement and appreciation to the state transportation officials who responded to the survey and participated in the follow-up interviews. Several students of the University of Maryland assisted in the research project, including Emma Weaver and Hamza Idris. Their hard work is greatly appreciated.
iii
ACRONYMS AND ABBREVIATIONS Unless otherwise specified, wherever the following abbreviations or terms are used in this report, they have the meanings set forth below:
η2 Effect Size Statistic ANOVA Analysis of Variance APD Alternative Project Delivery ATC Alternative Technical Concepts BBO Blind Bid Openings CMAR/CMR Construction Manager at Risk CACG Contract Award Cost Growth CEVP Cost Estimate Validation CM Construction Manager CM/CG Construction Manager General Contractor DB Design Build DBB Design Bid Build DIM Delay in Month EE Engineer’s Estimate ETDM Efficient Transportation Decision Making GMP Guaranteed Maximum Price GS Governance Structure ICC Intercounty Connector ICD Innovative Contracting Division ICE Independent Cost Estimate KW Kruskal-Wallis MDOT SHA Maryland Department of Transportation State Highway
Administration NOB Number of Bidders RFP Request for Proposals ROW Right of Way OHD Office of Highway Development OLS Ordinary Least Square PC Project Complexity PS Project Size QMP Quality Management Plan RFQ Request for Qualifications R2 Coefficient of Determination SM Selection Method SW Shapiro-Wilk TCG Total Cost Growth VIF Variance Inflation Factor
iv
TABLE OF CONTENTS
Technical Report Documentation Page .......................................................................................... i
Acknowledgement ............................................................................................................................ ii
Acronyms and Abbreviations ........................................................................................................ iii
1 Executive Summary ................................................................................................................... 1
2 Introduction ............................................................................................................................... 2 2.1 Objectives ................................................................................................................................ 2 2.2 Research Plan and Process ...................................................................................................... 2
3 Best Practice Review.................................................................................................................. 4 3.1 Introduction .............................................................................................................................. 4 3.2 Definition ................................................................................................................................. 4 3.3 Mapping ................................................................................................................................... 5 3.4 Recommendation ..................................................................................................................... 7
4 Research Methodology and Data Collection ........................................................................... 8 4.1 Data Collection ........................................................................................................................ 8 4.2 Format of Interviews ............................................................................................................... 9 4.3 Questionnaire ......................................................................................................................... 10 4.4 Qualitative Data Analysis ...................................................................................................... 11
5 Analysis Results ....................................................................................................................... 13 5.1 Satisfaction Results ................................................................................................................ 14 5.2 Main Observations from Spearman’s Analysis ..................................................................... 16 APDEXPERIENCEANDRELATEDISSUES ......................................................................... 16 APDKNOWLEDGEOFDETERMINATIONANDISSUES .................................................... 19 RFPSpecificationIssues ...................................................................................................... 20 PlansandReviewIssues ...................................................................................................... 21 CommunicationanditsRole ................................................................................................ 22 LossofControlwithAPDMethod ....................................................................................... 22 5.3. General Observations ........................................................................................................... 23
6: APD Performance and Governance Structure ................................................................................. 26 6.1 Introduction ............................................................................................................................ 26 6.2 Research Design .................................................................................................................... 26 6.3 Hypotheses and Analysis Method ......................................................................................... 28 6.4 Data Collection and Coding Scheme ..................................................................................... 28 6.5 Analysis Results .................................................................................................................... 29 6.6 Summary and Managerial Implications ................................................................................. 35
7 Conclusion and Recommendations ........................................................................................ 37 7.1 Conclusion ............................................................................................................................. 37 7.2 APD Recommendations ........................................................................................................ 38
8 References ................................................................................................................................. 39

v
9 Appendix ................................................................................................................................... 43 Appendix A: List of Best Practices in Alternative Project Delivery ........................................... 44 Appendix B: MDOT SHA APD Questionnaire .......................................................................... 76 Appendix C: Data Analysis and Descriptive Statistics ............................................................... 78 Appendix D: APD Training Program .......................................................................................... 82
Current Training Program ........................................................................................................ 83 Content Mapping ..................................................................................................................... 85 Curriculum Design ................................................................................................................... 86
LIST of FIGURES
Figure 1 Research Framework and Tasks ............................................................................................ 3 Figure 2 Offices Involved in the Interview Process ........................................................................... 10 Figure 3 Stakeholder satisfaction on APD & DBB projects .............................................................. 15 Figure 4 APD Experience and Related Issues .................................................................................... 18 Figure 5 Project Sizes of the Sample (Total 24 Projects)................................................................... 29 Figure 6 Bar Plots of CACG, TCG, and DIM .................................................................................... 30
LIST OF TABLES
Table 1 Correlation Analysis among Factors ..................................................................................... 17 Table 2 Descriptive Statistics of Select Variables ............................................................................. 30 Table 3 ANOVA Test Result for Contract Award Cost Growth ...................................................... 32 Table 4 ANOVA Test Result for Total Cost Growth ......................................................................... 33 Table 5 ANOVA Test Result for Delay in Months ............................................................................ 34
|1
1 EXECUTIVE SUMMARY
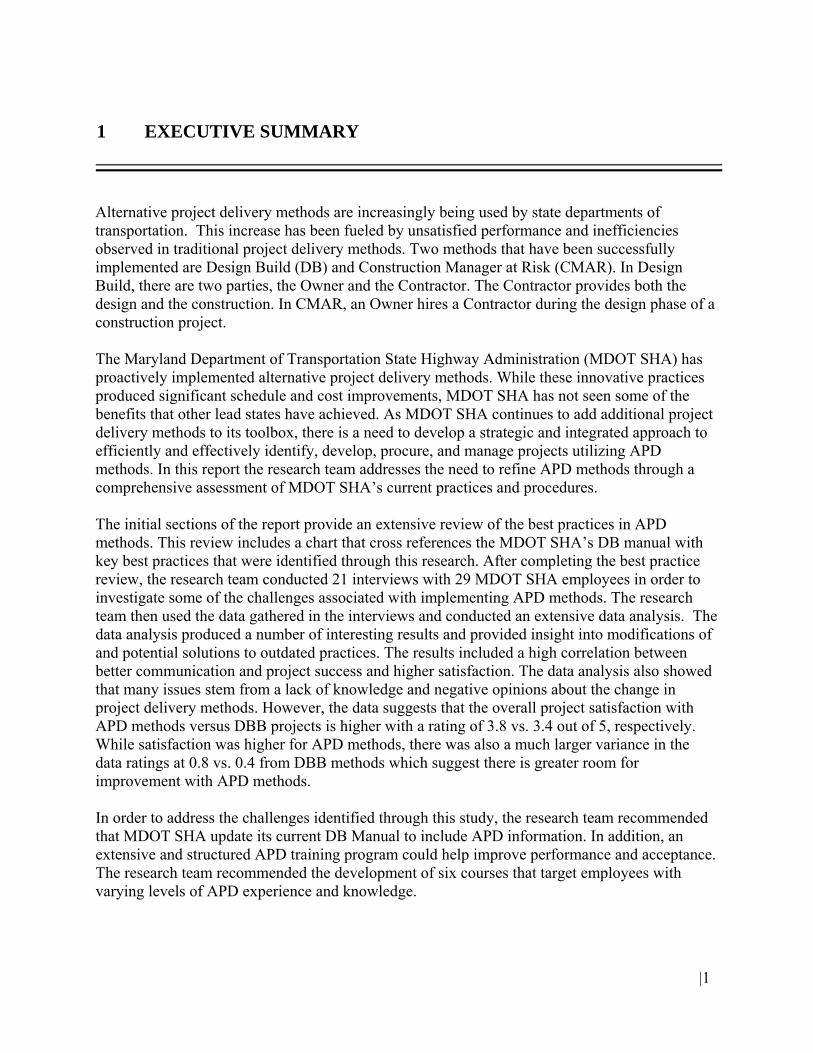
Alternative project delivery methods are increasingly being used by state departments of transportation. This increase has been fueled by unsatisfied performance and inefficiencies observed in traditional project delivery methods. Two methods that have been successfully implemented are Design Build (DB) and Construction Manager at Risk (CMAR). In Design Build, there are two parties, the Owner and the Contractor. The Contractor provides both the design and the construction. In CMAR, an Owner hires a Contractor during the design phase of a construction project.
The Maryland Department of Transportation State Highway Administration (MDOT SHA) has proactively implemented alternative project delivery methods. While these innovative practices produced significant schedule and cost improvements, MDOT SHA has not seen some of the benefits that other lead states have achieved. As MDOT SHA continues to add additional project delivery methods to its toolbox, there is a need to develop a strategic and integrated approach to efficiently and effectively identify, develop, procure, and manage projects utilizing APD methods. In this report the research team addresses the need to refine APD methods through a comprehensive assessment of MDOT SHA’s current practices and procedures.
The initial sections of the report provide an extensive review of the best practices in APD methods. This review includes a chart that cross references the MDOT SHA’s DB manual with key best practices that were identified through this research. After completing the best practice review, the research team conducted 21 interviews with 29 MDOT SHA employees in order to investigate some of the challenges associated with implementing APD methods. The research team then used the data gathered in the interviews and conducted an extensive data analysis. The data analysis produced a number of interesting results and provided insight into modifications of and potential solutions to outdated practices. The results included a high correlation between better communication and project success and higher satisfaction. The data analysis also showed that many issues stem from a lack of knowledge and negative opinions about the change in project delivery methods. However, the data suggests that the overall project satisfaction with APD methods versus DBB projects is higher with a rating of 3.8 vs. 3.4 out of 5, respectively. While satisfaction was higher for APD methods, there was also a much larger variance in the data ratings at 0.8 vs. 0.4 from DBB methods which suggest there is greater room for improvement with APD methods.
In order to address the challenges identified through this study, the research team recommended that MDOT SHA update its current DB Manual to include APD information. In addition, an extensive and structured APD training program could help improve performance and acceptance. The research team recommended the development of six courses that target employees with varying levels of APD experience and knowledge.
|2
2 INTRODUCTION
2.1 OBJECTIVES
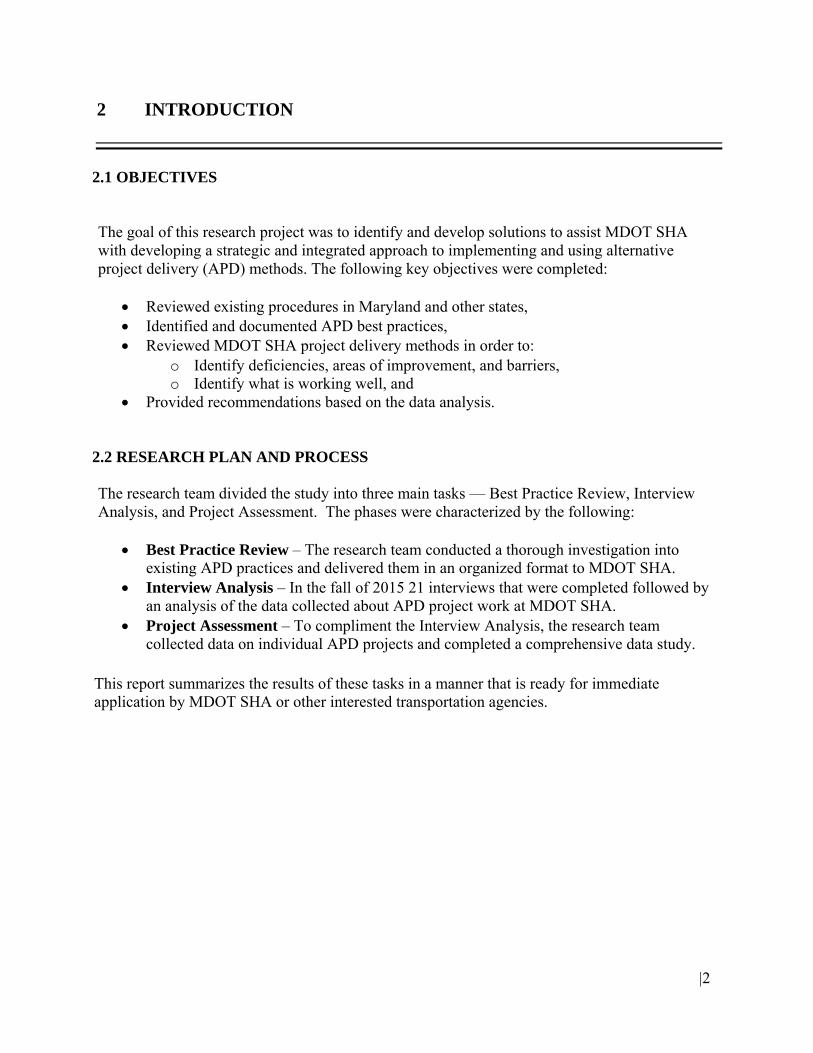
The goal of this research project was to identify and develop solutions to assist MDOT SHA with developing a strategic and integrated approach to implementing and using alternative project delivery (APD) methods. The following key objectives were completed:
Reviewed existing procedures in Maryland and other states, Identified and documented APD best practices, Reviewed MDOT SHA project delivery methods in order to:
o Identify deficiencies, areas of improvement, and barriers, o Identify what is working well, and
Provided recommendations based on the data analysis. 2.2 RESEARCH PLAN AND PROCESS
The research team divided the study into three main tasks — Best Practice Review, Interview Analysis, and Project Assessment. The phases were characterized by the following:
Best Practice Review – The research team conducted a thorough investigation into
existing APD practices and delivered them in an organized format to MDOT SHA. Interview Analysis – In the fall of 2015 21 interviews that were completed followed by
an analysis of the data collected about APD project work at MDOT SHA. Project Assessment – To compliment the Interview Analysis, the research team
collected data on individual APD projects and completed a comprehensive data study. This report summarizes the results of these tasks in a manner that is ready for immediate application by MDOT SHA or other interested transportation agencies.
|3
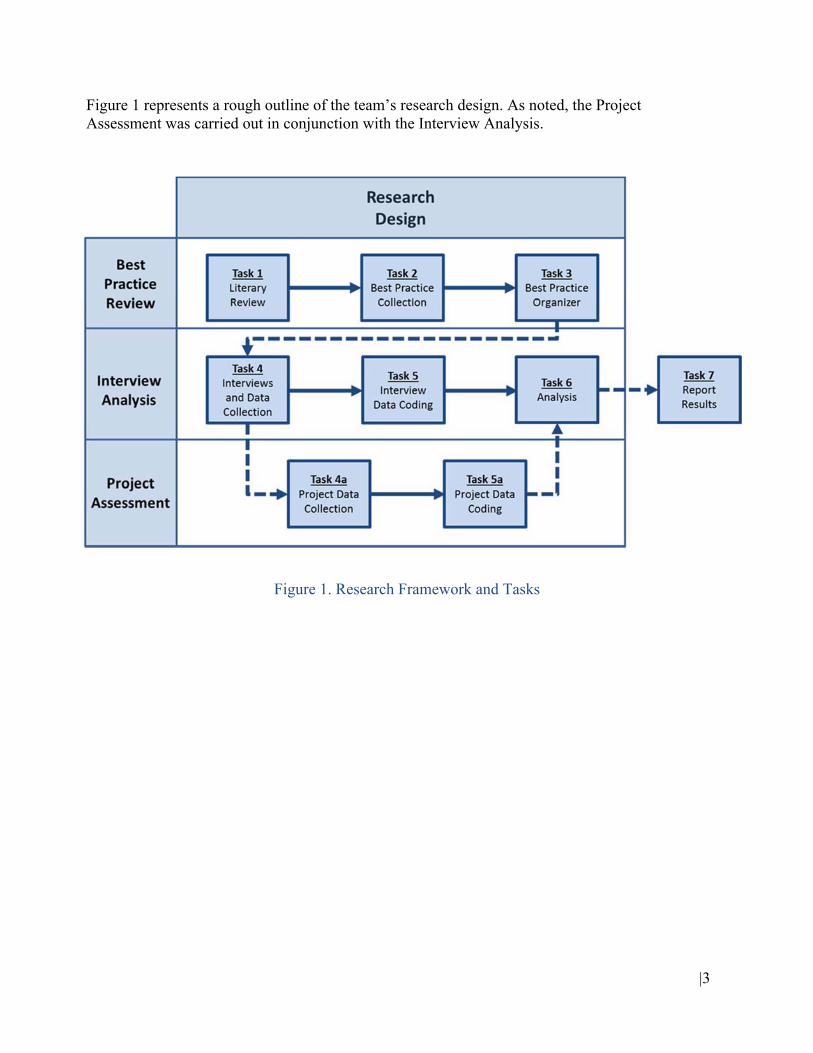
Figure 1 represents a rough outline of the team’s research design. As noted, the Project Assessment was carried out in conjunction with the Interview Analysis.
Figure 1. Research Framework and Tasks
|4
3 BEST PRACTICE REVIEW
3.1 INTRODUCTION
Each project delivery method has its own advantages and disadvantages. Some procedures within the various methods have also been proven to be effective when applied to most project formats, specifically transportation projects. In order to improve the effectiveness of a transportation agency, it is advantageous to seek out effective procedures and refine existing practices. The research team has identified a set of best practices from the transportation construction industry and compiled them in an easy-to-review format. This was achieved through a comprehensive literature review of project delivery methods currently used by other state departments of transportation (DOTs). This part of the report describes the methodology for the review of best practices. Broken down into objectives - the first was to describe in detail what was meant by the term ‘best practice’ and other related terminology; the second was to describe what was found in other states and how project delivery methods were implemented; and the third was to determine how MDOT SHA can employ these techniques to improve effectiveness and project delivery abilities.
3.2 DEFINITION
For this research, best practices are defined as effective strategies, techniques, and procedures that are employed to most efficiently handle a particular task or process. Based on what was learned during this study, best practices were grouped into three categories: validated best practices, model practices, & recommended/suggested practices.
Validated best practices are those that have been used by state DOTs and have proven to yield good results on a regular basis. An example of a validated best practice is “training is needed in order for an agency to implement a new project delivery method.” This practice was determined to be validated because most states that use construction manager-at-risk (CMAR) as a project delivery method employed the practice, and multiple sources in the literature agreed that the practice was effective and its application consistently yielded solid results.
Model practices are those that have been identified to work effectively by certain states but have not been uniformly applied by every state using that particular project delivery method. An example of a model practice used in CMAR included a heavy emphasis on community involvement. This is a model practice because there are only a few states who stressed this as being integral to the effective delivery of a CMAR project.
Recommended/suggested practices were recommended by professionals based on their observation, but had no real-world example to justify their effectiveness. The research team suggests that these practices may be feasible but does not have enough information to demonstrate their effectiveness or determine efficiency. An example of a recommended/suggested practice was to minimize schedule driven design. This practice falls under this category because it has not been
|5
adequately applied in any state but it has been recognized by some as a potential area of improvement for the CMAR project delivery method.
3.3 MAPPING
After defining each best practice, the research team further organized each practice into two categories: institutional/political and technical. These categories were further divided into subcategories. The institutional/political category was divided into stakeholders and public engagement, internal affairs, and program management. The technical category was divided into project identification procedures, project procurement/development, project management, project design, risk management, project communications, and construction procedures. The complete list of APD best practices is included in Appendix A.
Institutional best practices mainly apply to the overarching forces which lie outside of a specific ongoing project but influence the capabilities of an agency to efficiently perform a project. In this category are stakeholder and public engagement best practices which focus on managing the people that are not directly involved in the construction of a project but who still play an important role in its success. An example of this type of practice is “placing a heavy emphasis on community involvement.” This model practice was used by Arizona and Missouri in a number of interesting ways. In the city of Phoenix, the Arizona DOT created project specific social media accounts to share information about current projects and how they were going to affect the public. Through this communication the DOT was able to respond to comments and concerns from those who would ultimately benefit from the work being done.
The second subcategory under institutional best practices is internal affairs which, specifically relates to processes employed to enhance effectiveness when carrying out a project or internal operation. An example of a model practice in this category is “putting the best people on the job and teaming with the best.” This practice was emphasized by Florida and Utah. Utah stated that they would felt comfortable reducing the size of their staff if they had the right people working on the project at that time. Reducing the amount of staff would also reduce the budget that the agency has to manage. The final subcategory in the institutional category is program management which, focuses on best practices associated with the agency’s process for organizing and choosing a project delivery method. An example is the recommended practice of “having a DB champion and a DB policy committee within the agency.” A number of states are exploring this practice but it has yet to be widely implemented. This practice allows the champion to serve as the single point of contact for the DB program and to be an advocate for DB. The committee would discuss DB issues affecting policies and procedures. This process would help with the transition from a project delivery method like design bid build (DBB), into an alternative delivery method like DB. The second category, technical best practices, are those practices which are essential to the process of a specific project. This category includes the subcategory project identification procedures which, determines if a project is eligible to use a specific delivery method. Another subcategory, project procurement/development, deals with contracting and developing a scope of work. One best practice identified is “CMAR to procure early work packages.” Both the Utah and Tennessee’s DOTs used this practice in order to “mitigate cost risk by locking in the cost of the materials and services associated with those packages” (Gransberg & Shane, 2010, p. 3). There
|6
was consensus among DOTs and experts in the field that the earlier this action is executed, the more likely it is to achieve potential benefits.
The second subcategory under technical best practices is project management which, deals with management practices used in any of the alternative project delivery methods. An example of a best practice is “the subcontractors who ultimately perform the work of the project should be selected by the CM/GC.” This model practice was utilized by a number of states and was effective because, among many things, it allowed the agency “to get real-time pricing information, [because] the CMAR is able to communicate with subcontractors during preconstruction” (Gransberg & Shane, 2012, p. 68). The third subcategory is project design which, is related to the work completed during the design phase of a project. A specific example is that the project team should “correlate directly the design packages with the subcontractor bid packages.” This model practice was used by a number of states including Utah, Oregon and Texas, all of which praised its effectiveness and stated that this needs to happen in order to mitigate risk and fast-track the project. It can also greatly improve savings during the preconstruction process.
The fourth subcategory is risk management. Best practices in this subcategory deal with the assessment and engagement of risk. An example that was used extensively by the Utah DOT was “develop a quality management plan.” “The Quality Management Plan (QMP) is the document detailing all quality program procedures adopted by design-builders” (Minchin, et. al., 2014, p.121) and Utah required the DB to use this in order to ensure design package quality.
The fifth subcategory is project communications. The best practices centered around how project participants are interconnected and how they transfer ideas, documents, and commands between each other. An example is “collaboration of CMAR and designer” should be ensured. The Tennessee DOT specifically focused on this model practice because they stated that “doing this makes preconstruction collaboration enforceable and gives the designer the opportunity to set appropriate prices for the activities that do not occur in a DBB design project” (Shane & Gransberg, 2010).
The final subcategory under technical best practices is project construction. These best practices deal with the characteristics of construction in a given alternative project delivery method. One best practice is “use monthly reports along with invoices to ensure construction cost control.” This practice was used by the Florida DOT for a project in Osceola County. The Florida DOT stated that it helped ensure that construction costs stayed on budget. This practice provided detailed information on all costs to date and were compared to the schedule of values that had been approved for the project (Minchin, et. al., 2014, p. 178). It essentially worked by expediting the speed in which bids arrived with regard to the engineer’s designs on the project.
It should be noted that while a few examples of best practices are provided in this section, additional best practices and more detailed information is provided in Appendix A. This includes information taken directly the literature that was reviewed.
|7
3.4 RECOMMENDATION
In order for MDOT SHA to implement and use the identified best practices, several Maryland specific factors need to be considered. This includes legislation, organizational structure, past experience, and contractor characteristics in each of MDOT SHA’s seven districts. The MDOT SHA should examine these factors and then evaluate if the organization can accommodate the implementation requirements of each best practice. Special care should be taken when implementing the recommended practices, as the research team found no validated results. Each best practice has specific methods of implementation that should be understood in order to most appropriately employ the practice. If implementation is done properly, there are a range of immediate benefits that can be achieved including decreasing costs, reducing project schedules, and improving the agency’s public image.
|8
4 RESEARCH METHODOLOGY AND DATA COLLECTION
4.1 DATA COLLECTION
A review of MDOT SHA’s procedures and manuals, e.g. the DB Manual, was completed. Current procedures were compared to the best practices identified through the literature review. The team also reviewed the current organizational structure, operating environment, and other factors in the existing alternative project delivery APD process. By establishing where the organization is in terms of APD policies and procedures, the team was able to compare MDOT SHA with other state DOTs.
Interviewing employees was a key part of the research effort. Their views provided insight into the perceived pros and cons of individual practices conducted by MDOT SHA. At the onset of the study the research team anticipated a lot of opinions about current practices, but that those opinions may not be properly heard, categorized, or put to use. Interviewing employees and managers allowed the team was to base its recommendations, on the feedback received. The research team shared the interview schedule with MDOT SHA executives for approval and support prior to meeting with individual offices.
All offices involved in project delivery were surveyed to determine if and how DB and CMAR has been integrated into their practices, what the differences are from traditional DBB delivery, and how they foresee the challenges and possible solutions. These offices include but are not limited to the following: Office of Construction, Office of Environmental Design (Landscape Architecture Division, Landscape Operations Division, and Environmental Programs Division), Office of Highway Development (Innovative Contracting Division, Highway Hydraulics, Division, Community Design Division and & Highway Design Division), Office of Materials Technology (Engineering Geology Division, Pavement and Geotechnical Division), Office of Planning and Preliminary Engineering (Environmental Planning Division), Office of Real Estate, Office of Structures, Office of Traffic and Safety (Transportation Engineering Design Division), and all District Offices (Construction, Traffic, Utilities, and Right‐of‐Way teams).
|9
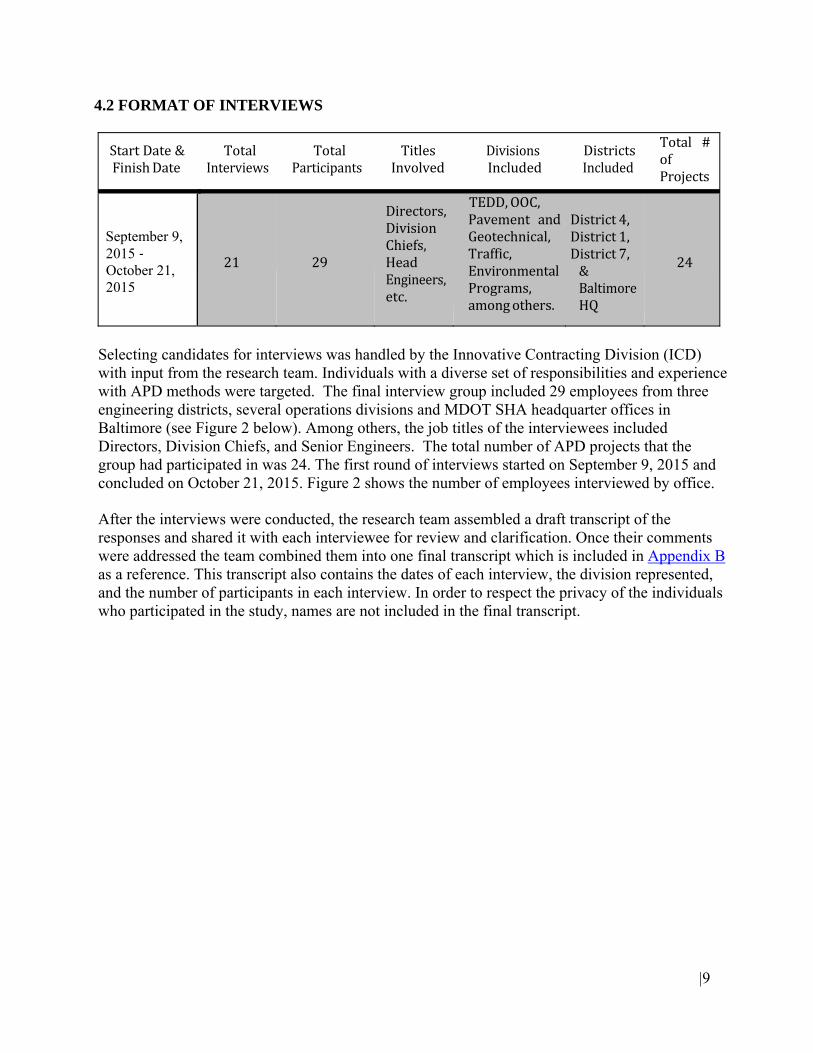
4.2 FORMAT OF INTERVIEWS
StartDate&FinishDate
TotalInterviews
TotalParticipants
TitlesInvolved
DivisionsIncluded
DistrictsIncluded
Total #ofProjects
September 9, 2015 ‐ October 21, 2015
21
29
Directors,DivisionChiefs,HeadEngineers,etc.
TEDD,OOC,PavementandGeotechnical,Traffic,EnvironmentalPrograms,amongothers.
District4,District1,District7,&BaltimoreHQ
24
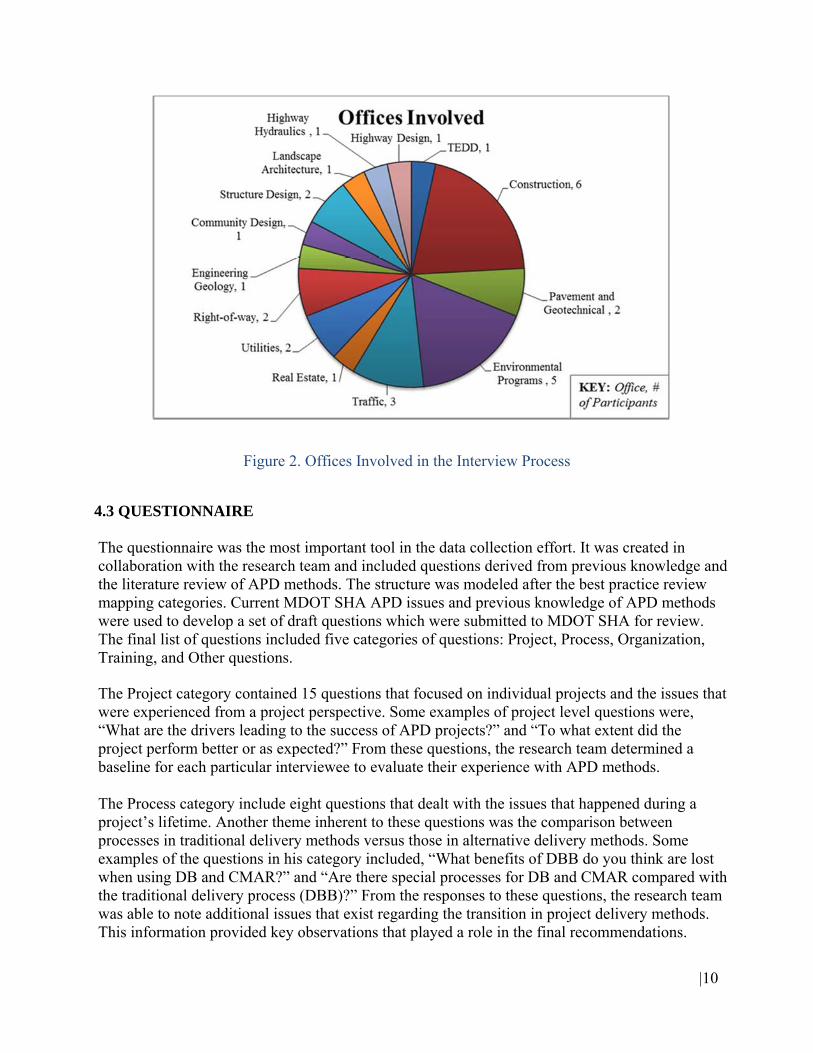
Selecting candidates for interviews was handled by the Innovative Contracting Division (ICD) with input from the research team. Individuals with a diverse set of responsibilities and experience with APD methods were targeted. The final interview group included 29 employees from three engineering districts, several operations divisions and MDOT SHA headquarter offices in Baltimore (see Figure 2 below). Among others, the job titles of the interviewees included Directors, Division Chiefs, and Senior Engineers. The total number of APD projects that the group had participated in was 24. The first round of interviews started on September 9, 2015 and concluded on October 21, 2015. Figure 2 shows the number of employees interviewed by office.
After the interviews were conducted, the research team assembled a draft transcript of the responses and shared it with each interviewee for review and clarification. Once their comments were addressed the team combined them into one final transcript which is included in Appendix B as a reference. This transcript also contains the dates of each interview, the division represented, and the number of participants in each interview. In order to respect the privacy of the individuals who participated in the study, names are not included in the final transcript.
|10
Figure 2. Offices Involved in the Interview Process
4.3 QUESTIONNAIRE
The questionnaire was the most important tool in the data collection effort. It was created in collaboration with the research team and included questions derived from previous knowledge and the literature review of APD methods. The structure was modeled after the best practice review mapping categories. Current MDOT SHA APD issues and previous knowledge of APD methods were used to develop a set of draft questions which were submitted to MDOT SHA for review. The final list of questions included five categories of questions: Project, Process, Organization, Training, and Other questions. The Project category contained 15 questions that focused on individual projects and the issues that were experienced from a project perspective. Some examples of project level questions were, “What are the drivers leading to the success of APD projects?” and “To what extent did the project perform better or as expected?” From these questions, the research team determined a baseline for each particular interviewee to evaluate their experience with APD methods. The Process category include eight questions that dealt with the issues that happened during a project’s lifetime. Another theme inherent to these questions was the comparison between processes in traditional delivery methods versus those in alternative delivery methods. Some examples of the questions in his category included, “What benefits of DBB do you think are lost when using DB and CMAR?” and “Are there special processes for DB and CMAR compared with the traditional delivery process (DBB)?” From the responses to these questions, the research team was able to note additional issues that exist regarding the transition in project delivery methods. This information provided key observations that played a role in the final recommendations.
|11
The Organization category included seven questions which focused on organizational acceptance and challenges/barriers to project delivery methods. While some of the questions asked about the views within the organization toward APD methods, others asked about issues which could be viewed from an institutional perspective. A few examples of these questions included, “Did you run into any conflicts with other offices on a DB/CMAR project?” and “How accepting do you feel the agency’s internal culture / mindset is to adopting DB and CMAR processes?”
The Training category included 6 questions related to approaches needed to implement an effective training program. Some examples of these questions included, “What are the barriers to implement each training option?” and, “What changes are needed to make the training more useful and accessible to MDOT SHA engineers and other stakeholders?” Since one of the research team’s objectives was to update the training methods currently used by MDOT SHA, the team asked these questions to gain a deeper sense of the underlying issues related to training. The Others category included only three questions which were intended to conclude the interview and gather any other data that could be pertinent to the research. One example of these questions was, “What are the most critical aspects that MDOT SHA should focus on to improve APD project performance?” These questions helped the research team gather other information that the interviewee wanted to disclose about APD methods at MDOT SHA. The questionnaire is included in Appendix B of this report. 4.4 QUALITATIVE DATA ANALYSIS
Because this study featured qualitative data (i.e. opinions, processes, lessons learned, etc.), a qualitative analysis approach was used to evaluate the empirical data, or transcripts, which were gathered. The analysis followed the team’s evidence-based investigation which ensured data quality, data source variety, and helped to address all rival explanations. The team used SPSS, a predictive analytic software package, to document and analyze the data.
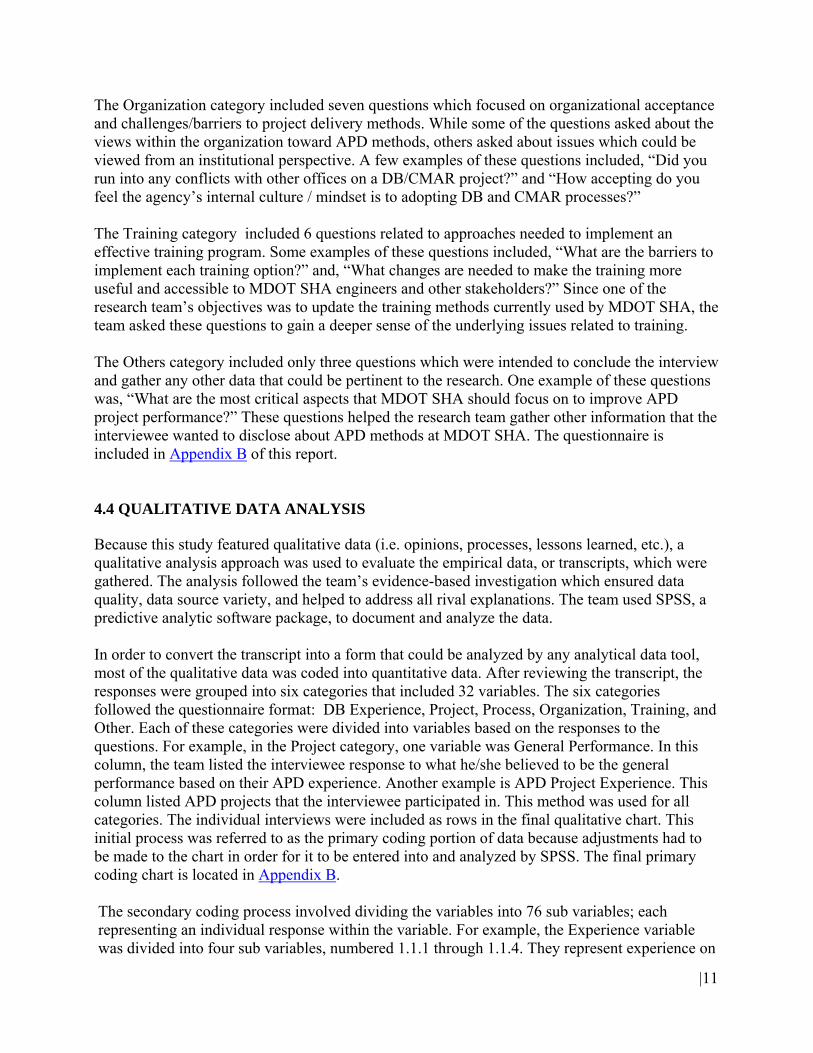
In order to convert the transcript into a form that could be analyzed by any analytical data tool, most of the qualitative data was coded into quantitative data. After reviewing the transcript, the responses were grouped into six categories that included 32 variables. The six categories followed the questionnaire format: DB Experience, Project, Process, Organization, Training, and Other. Each of these categories were divided into variables based on the responses to the questions. For example, in the Project category, one variable was General Performance. In this column, the team listed the interviewee response to what he/she believed to be the general performance based on their APD experience. Another example is APD Project Experience. This column listed APD projects that the interviewee participated in. This method was used for all categories. The individual interviews were included as rows in the final qualitative chart. This initial process was referred to as the primary coding portion of data because adjustments had to be made to the chart in order for it to be entered into and analyzed by SPSS. The final primary coding chart is located in Appendix B. The secondary coding process involved dividing the variables into 76 sub variables; each representing an individual response within the variable. For example, the Experience variable was divided into four sub variables, numbered 1.1.1 through 1.1.4. They represent experience on
|12
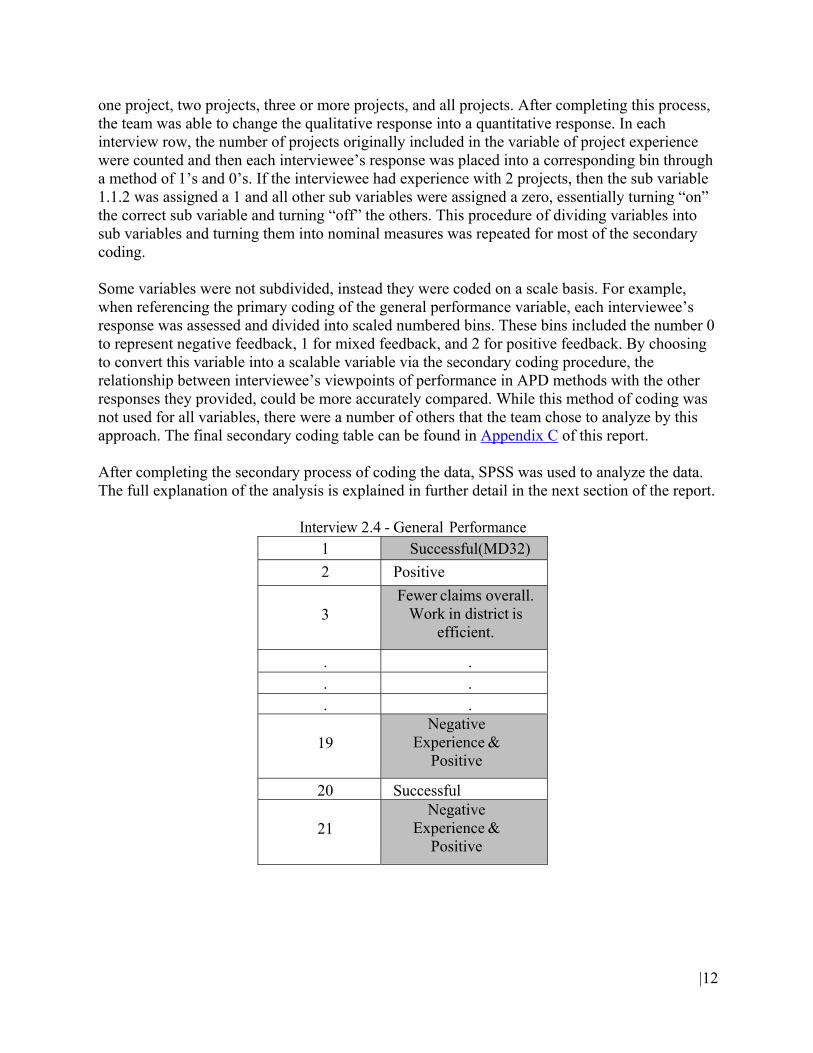
one project, two projects, three or more projects, and all projects. After completing this process, the team was able to change the qualitative response into a quantitative response. In each interview row, the number of projects originally included in the variable of project experience were counted and then each interviewee’s response was placed into a corresponding bin through a method of 1’s and 0’s. If the interviewee had experience with 2 projects, then the sub variable 1.1.2 was assigned a 1 and all other sub variables were assigned a zero, essentially turning “on” the correct sub variable and turning “off” the others. This procedure of dividing variables into sub variables and turning them into nominal measures was repeated for most of the secondary coding. Some variables were not subdivided, instead they were coded on a scale basis. For example, when referencing the primary coding of the general performance variable, each interviewee’s response was assessed and divided into scaled numbered bins. These bins included the number 0 to represent negative feedback, 1 for mixed feedback, and 2 for positive feedback. By choosing to convert this variable into a scalable variable via the secondary coding procedure, the relationship between interviewee’s viewpoints of performance in APD methods with the other responses they provided, could be more accurately compared. While this method of coding was not used for all variables, there were a number of others that the team chose to analyze by this approach. The final secondary coding table can be found in Appendix C of this report. After completing the secondary process of coding the data, SPSS was used to analyze the data. The full explanation of the analysis is explained in further detail in the next section of the report.
Interview 2.4 - General Performance 1 Successful(MD32)
2 Positive
3
Fewer claims overall. Work in district is
efficient.
. .
. .
. .
19 Negative
Experience & Positive
20 Successful
21 Negative
Experience & Positive

|13
5 ANALYSIS RESULTS
After all data was coded, an extensive data analysis was completed using a number of tests including, Spearman’s Rho, Kruskal- Wallis, Shapiro-Wilk, various qualitative and descriptive statistics, and linear regression. These analyses all serve a unique purpose for interpreting the raw data which in turn, enables the research team to explain and support various responses.
Spearman’s test, also known as the Rank-Order Correlation test, is a nonparametric measure of the strength and direction of connection between two variables. This test produces a p-value, which is the measure of strength of connection between two variables and also a direction of positive or negative. If the result proved to be negative, then as one variable increases in likelihood of occurrence or value then its associated variable decreases in likelihood or occurrence or value. In the opposite sense, if two variables are positively correlated then as one variable increases in value, its compliment also increases in value and the opposite occurs if one variable decreases in value. The research team applied this test to analyze each variable after coding the data transcript to better grasp various causalities in the data. The result is a table of over 131 unique significant correlations and is provided in Appendix C. This was the central test and it served to emphasize the main observations which are discussed later in this report.
The Kruskal-Wallis (KW) and the Shapiro-Wilk (SW) test were both used in the analysis of the overall satisfaction responses. The SW is used to test if two sets of data are normally distributed. Testing whether data is normally distributed is essential because normality is an underlying assumption of parametric testing. This test was applied to determine whether a parametric or non-parametric test would need to be used to analyze the variances of the two project delivery types. After discovering a non-normal distribution of the results, the KW test was applied. This test is a ranking based non-parametric test used to determine if two groups of data are statistically different from one another. Therefore, this test was used to assess whether the variances of the two project delivery types were statistically different or similar. From the KW test it was determined that the variances of the satisfaction datasets were radically different which allowed the team to make the conclusions found in Section 5.1 of this report.
Some of the qualitative and descriptive analyses included graphs of the satisfaction analysis and various figures related to each of the main observations. Within the data analyses, the team also performed a specific descriptive statistics test to highlight any interesting results from the dataset. Finally, a few varieties of linear regression were used to analyze the project performance under different governance structures. The details are included in Section 6.
|14
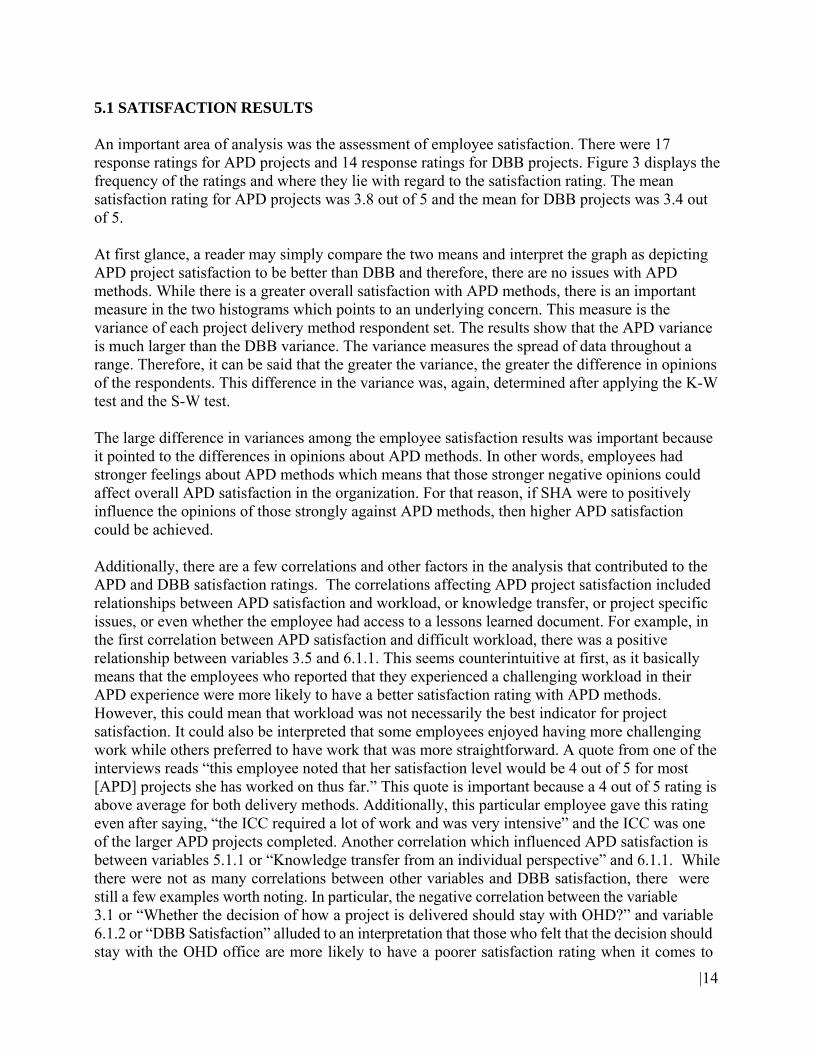
5.1 SATISFACTION RESULTS An important area of analysis was the assessment of employee satisfaction. There were 17 response ratings for APD projects and 14 response ratings for DBB projects. Figure 3 displays the frequency of the ratings and where they lie with regard to the satisfaction rating. The mean satisfaction rating for APD projects was 3.8 out of 5 and the mean for DBB projects was 3.4 out of 5.
At first glance, a reader may simply compare the two means and interpret the graph as depicting APD project satisfaction to be better than DBB and therefore, there are no issues with APD methods. While there is a greater overall satisfaction with APD methods, there is an important measure in the two histograms which points to an underlying concern. This measure is the variance of each project delivery method respondent set. The results show that the APD variance is much larger than the DBB variance. The variance measures the spread of data throughout a range. Therefore, it can be said that the greater the variance, the greater the difference in opinions of the respondents. This difference in the variance was, again, determined after applying the K-W test and the S-W test.
The large difference in variances among the employee satisfaction results was important because it pointed to the differences in opinions about APD methods. In other words, employees had stronger feelings about APD methods which means that those stronger negative opinions could affect overall APD satisfaction in the organization. For that reason, if SHA were to positively influence the opinions of those strongly against APD methods, then higher APD satisfaction could be achieved.
Additionally, there are a few correlations and other factors in the analysis that contributed to the APD and DBB satisfaction ratings. The correlations affecting APD project satisfaction included relationships between APD satisfaction and workload, or knowledge transfer, or project specific issues, or even whether the employee had access to a lessons learned document. For example, in the first correlation between APD satisfaction and difficult workload, there was a positive relationship between variables 3.5 and 6.1.1. This seems counterintuitive at first, as it basically means that the employees who reported that they experienced a challenging workload in their APD experience were more likely to have a better satisfaction rating with APD methods. However, this could mean that workload was not necessarily the best indicator for project satisfaction. It could also be interpreted that some employees enjoyed having more challenging work while others preferred to have work that was more straightforward. A quote from one of the interviews reads “this employee noted that her satisfaction level would be 4 out of 5 for most [APD] projects she has worked on thus far.” This quote is important because a 4 out of 5 rating is above average for both delivery methods. Additionally, this particular employee gave this rating even after saying, “the ICC required a lot of work and was very intensive” and the ICC was one of the larger APD projects completed. Another correlation which influenced APD satisfaction is between variables 5.1.1 or “Knowledge transfer from an individual perspective” and 6.1.1. While there were not as many correlations between other variables and DBB satisfaction, there were still a few examples worth noting. In particular, the negative correlation between the variable 3.1 or “Whether the decision of how a project is delivered should stay with OHD?” and variable 6.1.2 or “DBB Satisfaction” alluded to an interpretation that those who felt that the decision should stay with the OHD office are more likely to have a poorer satisfaction rating when it comes to
|15
DBB methods. An example that supported this relationship between the two variables was in interview 1 section 12. The quote stated, “The decision process of determining whether or not a project goes to DB should stay with OHD, unless, the design principles for a particular office within MDOT SHA would play a key role in the decision making process.” This interviewee also had a satisfaction rating of 3.25 out of 5 which is less than the average DBB satisfaction rating. This statement may imply that those who believed that particular offices had more control or influences on the use of APD decision-making process would be more satisfied with a larger role in the decision making process.
Figure 3. Stakeholder satisfaction on APD & DBB projects
|16
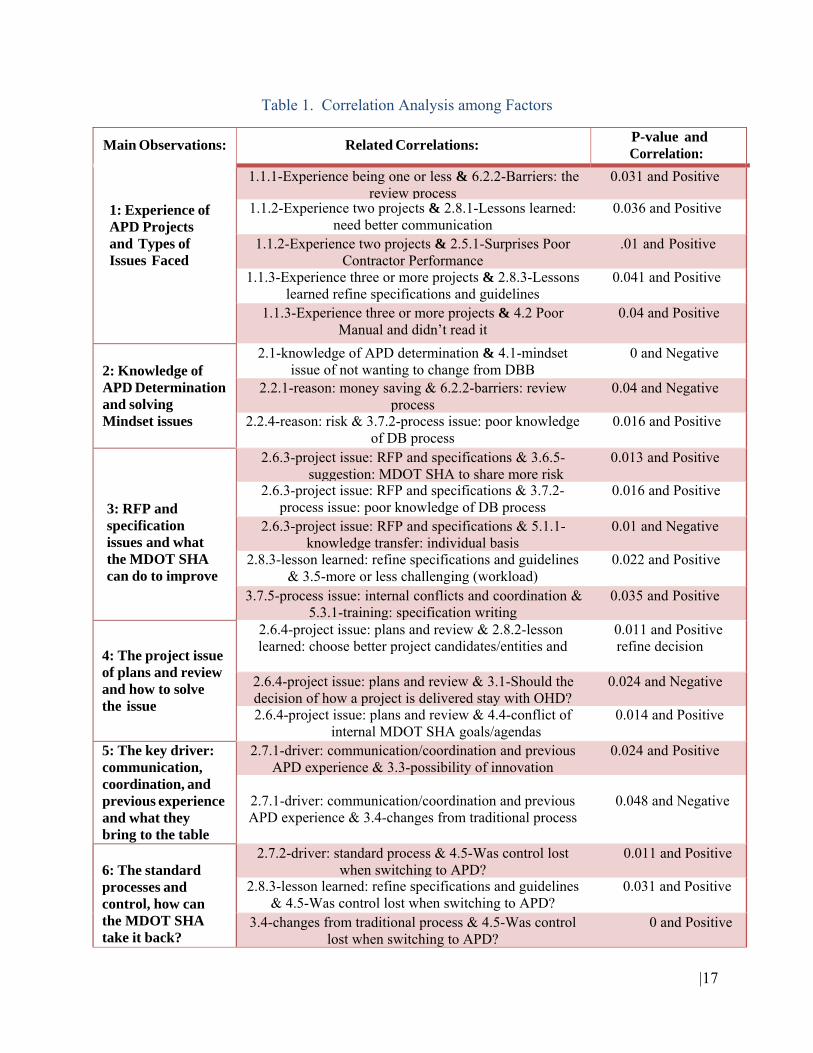
5.2 MAIN OBSERVATIONS FROM SPEARMAN’S ANALYSIS Provided below are the observations made after analyzing the data using the Spearman’s Correlation test. Each observation has an associated number of related correlations that indicated a significance level of 5% or less. The correlations between the variables related to each observation are either positive or negative. A positive correlation indicates that as one variable increases in likelihood, the correlated variable is equally likely to increase. In the opposite sense, two variables that are negatively correlated share a contradicting relationship (see Table 1). With a negative correlation, as one variable increases in likelihood the other variable is more likely to decrease. With the P-value and type of correlation between each variable, the team was able to interpret the variable’s significance. Following the data summary in Table 1, there is a more detailed analysis of the significant observations.
APDEXPERIENCEANDRELATEDISSUES
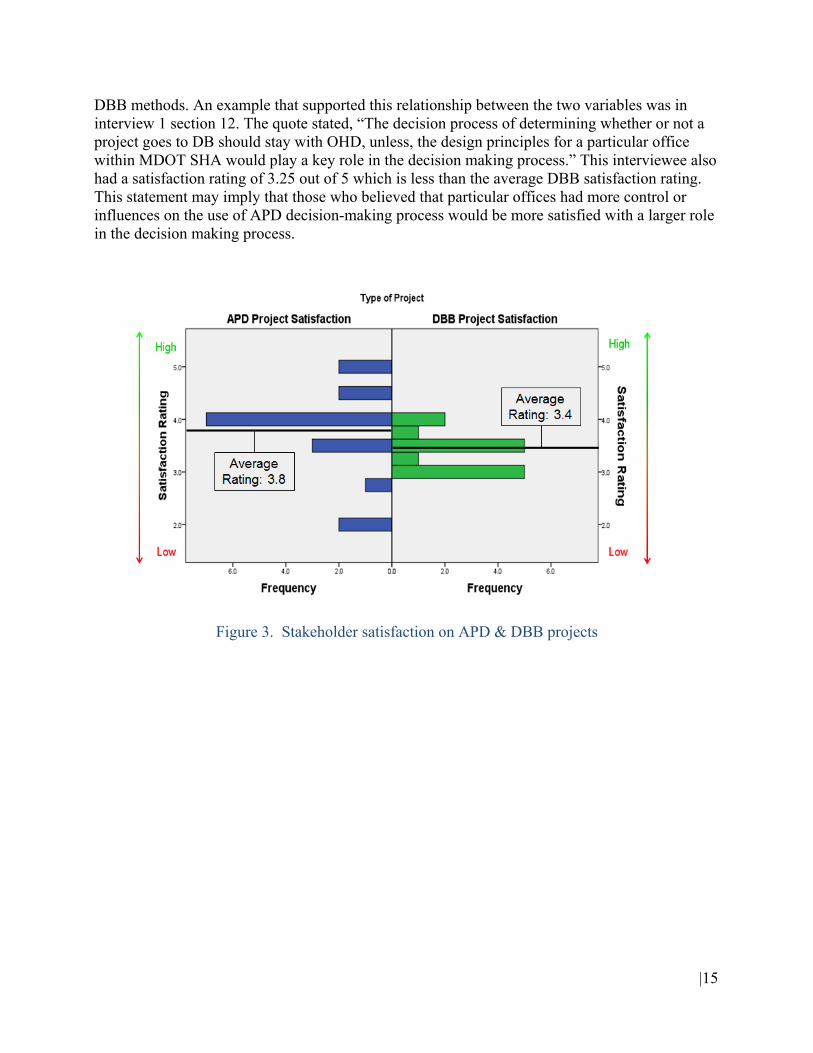
Observation 1: The experience that each employee had, in terms of the amount of APD projects they participated in, affected the types of issues and barriers that each employee faced.
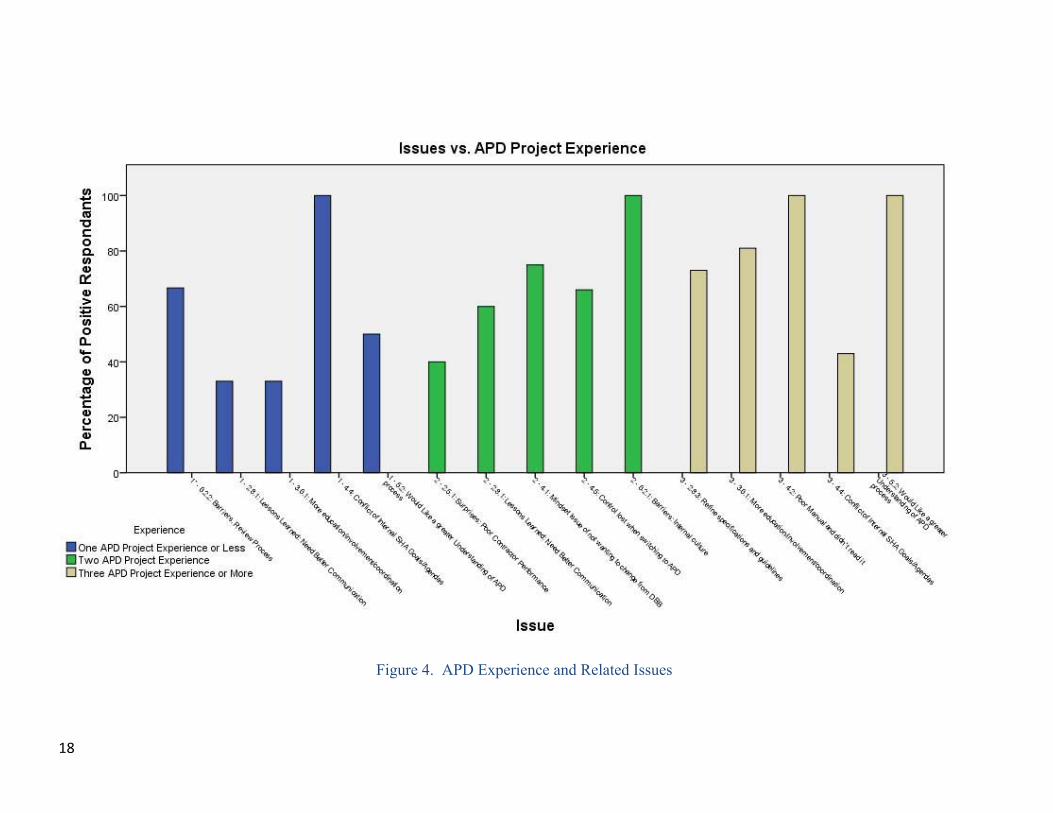
The employees who had less experience with APD projects (Interviews 9, 10 & 16) tended to face barriers in the review process. Specifically, the two variables, 1.1.1 & 6.2.2 had the statistical correlation of 0.031 which proves that they are significantly correlated. MDOT SHA employees who had experience with two projects (Interviews 2, 5, 7, 13 & 19) tended to have issues with communication and poor contractor performance. Specifically, the variables 1.1.2 & 2.5.1 and 1.1.2 & 2.8.1 had the statistical significance of 0.01 and 0.036 respectively. When SHA employees had experience with three or more APD projects (Interviews 1, 3, 4, 8, 11, 12, 14, 15, 17, 18 & 20), they tended to realize the importance of a sound RFP and specifications system. These employees usually stated that the DB manual needed to be improved. Specifically, the variables 1.1.3 & 2.8.3 and 1.1.3 & 4.2 had the statistical significance of 0.041 and 0.04 respectively. Figure 4 shows the relationship between APD experience and related issues identified by the respondents.
There are also multiple examples taken directly from the original interview transcript. One such example included a passage from Interview number 5, response 14 where the interviewee noted, “Since the contractor wasn’t familiar with the DB process, MDOT SHA’s Office of Construction had meetings with the contractor and sometimes they had to educate the contractor on particular issues…The contractor really needed to understand the ultimate goal of the MDOT SHA.” Another occurrence which supports this first observation came from an employee who had experience with three or more APD projects. In interview 1, response 11 the employee noted, “One critical lesson that was learned from the I-270 project is to make sure that things that are definitely NOT acceptable are included in the specifications book.” This reference can help to further support the idea that as employees’ experience with APD increases, they tend to have different issues and in particular, more issues with the RFP and specifications.
|17
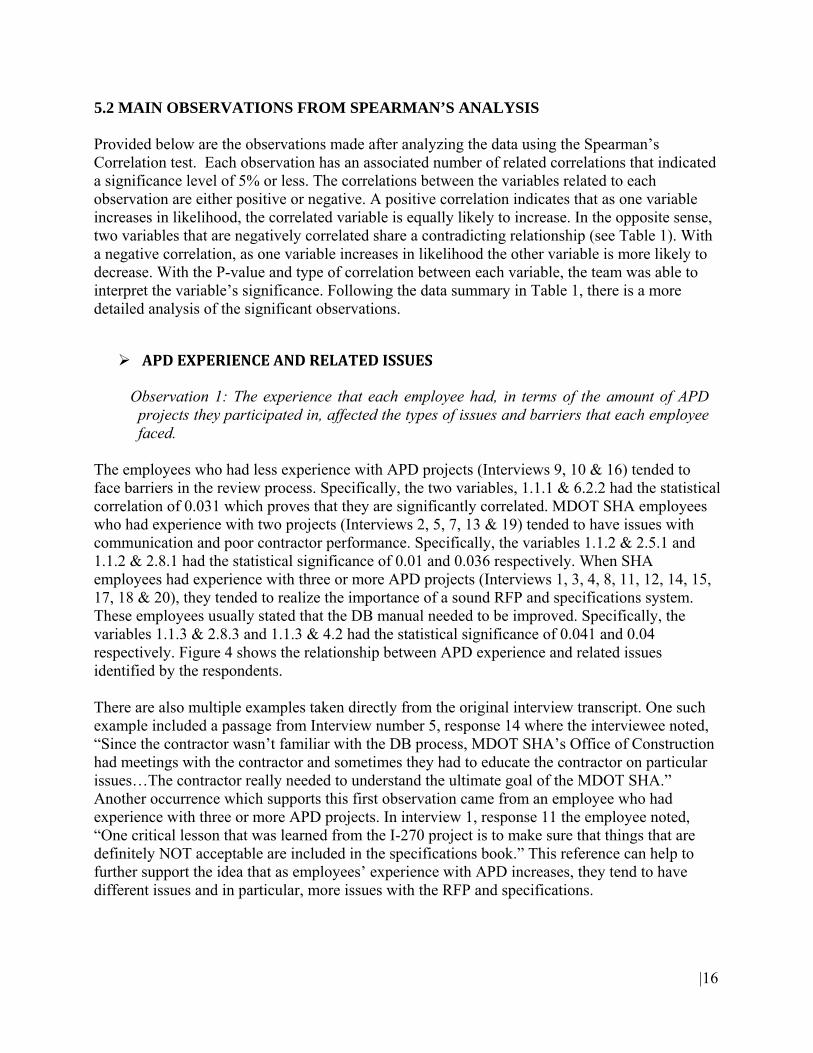
Table 1. Correlation Analysis among Factors
Main Observations: Related Correlations: P-value and Correlation:
1: Experience of APD Projects and Types of Issues Faced
1.1.1-Experience being one or less & 6.2.2-Barriers: the 0.031 and Positive review process
1.1.2-Experience two projects & 2.8.1-Lessons learned: 0.036 and Positiveneed better communication
1.1.2-Experience two projects & 2.5.1-Surprises Poor .01 and Positive Contractor Performance
1.1.3-Experience three or more projects & 2.8.3-Lessons 0.041 and Positivelearned refine specifications and guidelines
1.1.3-Experience three or more projects & 4.2 Poor 0.04 and PositiveManual and didn’t read it
2: Knowledge of APD Determination and solving Mindset issues
2.1-knowledge of APD determination & 4.1-mindset 0 and Negativeissue of not wanting to change from DBB
2.2.1-reason: money saving & 6.2.2-barriers: review 0.04 and Negative process
2.2.4-reason: risk & 3.7.2-process issue: poor knowledge 0.016 and Positiveof DB process
3: RFP and specification issues and what the MDOT SHA can do to improve
2.6.3-project issue: RFP and specifications & 3.6.5- 0.013 and Positive suggestion: MDOT SHA to share more risk
2.6.3-project issue: RFP and specifications & 3.7.2- 0.016 and Positiveprocess issue: poor knowledge of DB process
2.6.3-project issue: RFP and specifications & 5.1.1- 0.01 and Negative knowledge transfer: individual basis
2.8.3-lesson learned: refine specifications and guidelines 0.022 and Positive& 3.5-more or less challenging (workload)
3.7.5-process issue: internal conflicts and coordination & 0.035 and Positive 5.3.1-training: specification writing
4: The project issue of plans and review and how to solve the issue
2.6.4-project issue: plans and review & 2.8.2-lesson 0.011 and Positivelearned: choose better project candidates/entities and refine decision
2.6.4-project issue: plans and review & 3.1-Should the 0.024 and Negative decision of how a project is delivered stay with OHD? 2.6.4-project issue: plans and review & 4.4-conflict of 0.014 and Positive
internal MDOT SHA goals/agendas 5: The key driver: communication, coordination, and previous experience and what they bring to the table
2.7.1-driver: communication/coordination and previous 0.024 and Positive APD experience & 3.3-possibility of innovation
2.7.1-driver: communication/coordination and previous 0.048 and Negative APD experience & 3.4-changes from traditional process
6: The standard processes and control, how can the MDOT SHA take it back?
2.7.2-driver: standard process & 4.5-Was control lost 0.011 and Positivewhen switching to APD?
2.8.3-lesson learned: refine specifications and guidelines 0.031 and Positive& 4.5-Was control lost when switching to APD?
3.4-changes from traditional process & 4.5-Was control 0 and Positivelost when switching to APD?
18
Figure 4. APD Experience and Related Issues
|19
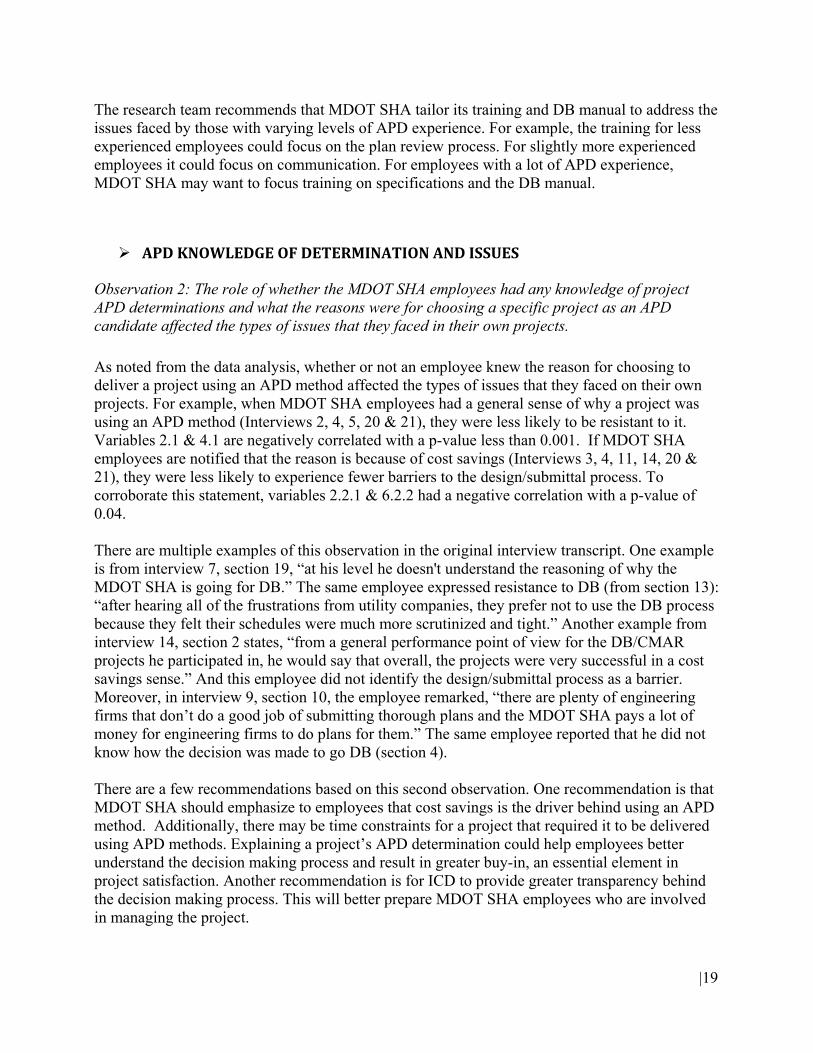
The research team recommends that MDOT SHA tailor its training and DB manual to address the issues faced by those with varying levels of APD experience. For example, the training for less experienced employees could focus on the plan review process. For slightly more experienced employees it could focus on communication. For employees with a lot of APD experience, MDOT SHA may want to focus training on specifications and the DB manual.
APDKNOWLEDGEOFDETERMINATIONANDISSUESObservation 2: The role of whether the MDOT SHA employees had any knowledge of project APD determinations and what the reasons were for choosing a specific project as an APD candidate affected the types of issues that they faced in their own projects.
As noted from the data analysis, whether or not an employee knew the reason for choosing to deliver a project using an APD method affected the types of issues that they faced on their own projects. For example, when MDOT SHA employees had a general sense of why a project was using an APD method (Interviews 2, 4, 5, 20 & 21), they were less likely to be resistant to it. Variables 2.1 & 4.1 are negatively correlated with a p-value less than 0.001. If MDOT SHA employees are notified that the reason is because of cost savings (Interviews 3, 4, 11, 14, 20 & 21), they were less likely to experience fewer barriers to the design/submittal process. To corroborate this statement, variables 2.2.1 & 6.2.2 had a negative correlation with a p-value of 0.04.
There are multiple examples of this observation in the original interview transcript. One example is from interview 7, section 19, “at his level he doesn't understand the reasoning of why the MDOT SHA is going for DB.” The same employee expressed resistance to DB (from section 13): “after hearing all of the frustrations from utility companies, they prefer not to use the DB process because they felt their schedules were much more scrutinized and tight.” Another example from interview 14, section 2 states, “from a general performance point of view for the DB/CMAR projects he participated in, he would say that overall, the projects were very successful in a cost savings sense.” And this employee did not identify the design/submittal process as a barrier. Moreover, in interview 9, section 10, the employee remarked, “there are plenty of engineering firms that don’t do a good job of submitting thorough plans and the MDOT SHA pays a lot of money for engineering firms to do plans for them.” The same employee reported that he did not know how the decision was made to go DB (section 4). There are a few recommendations based on this second observation. One recommendation is that MDOT SHA should emphasize to employees that cost savings is the driver behind using an APD method. Additionally, there may be time constraints for a project that required it to be delivered using APD methods. Explaining a project’s APD determination could help employees better understand the decision making process and result in greater buy-in, an essential element in project satisfaction. Another recommendation is for ICD to provide greater transparency behind the decision making process. This will better prepare MDOT SHA employees who are involved in managing the project.
|20
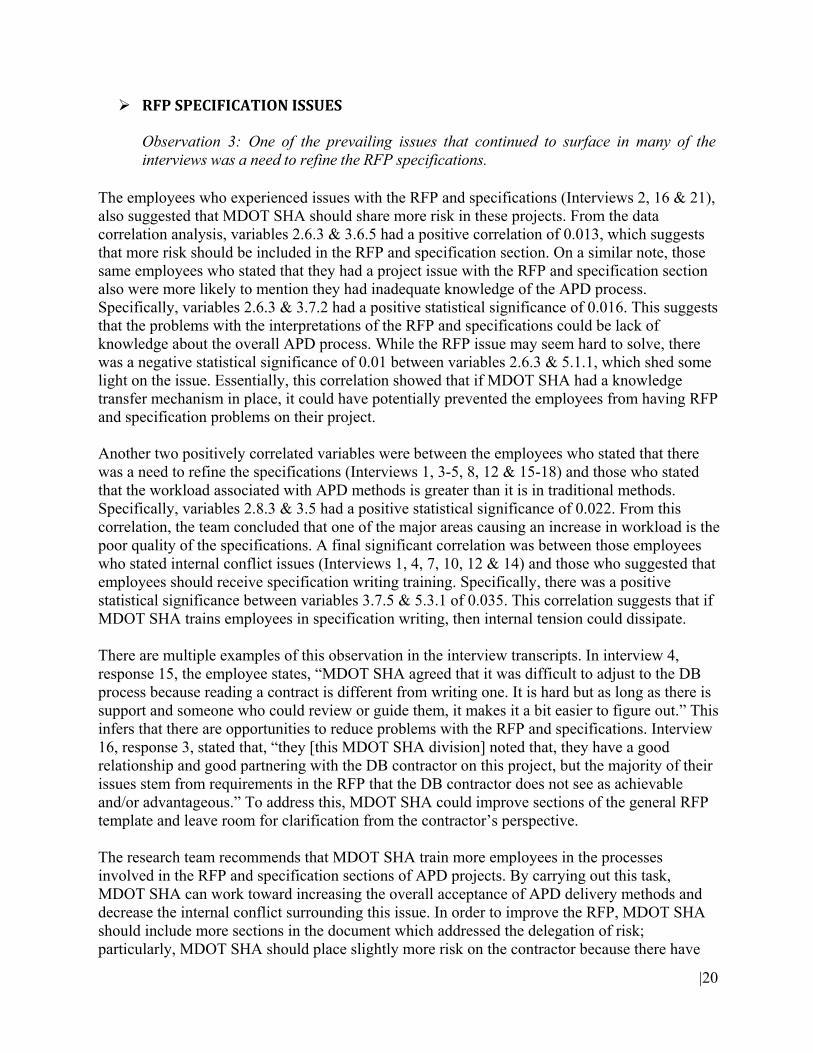
RFPSPECIFICATIONISSUES
Observation 3: One of the prevailing issues that continued to surface in many of the interviews was a need to refine the RFP specifications.
The employees who experienced issues with the RFP and specifications (Interviews 2, 16 & 21), also suggested that MDOT SHA should share more risk in these projects. From the data correlation analysis, variables 2.6.3 & 3.6.5 had a positive correlation of 0.013, which suggests that more risk should be included in the RFP and specification section. On a similar note, those same employees who stated that they had a project issue with the RFP and specification section also were more likely to mention they had inadequate knowledge of the APD process. Specifically, variables 2.6.3 & 3.7.2 had a positive statistical significance of 0.016. This suggests that the problems with the interpretations of the RFP and specifications could be lack of knowledge about the overall APD process. While the RFP issue may seem hard to solve, there was a negative statistical significance of 0.01 between variables 2.6.3 & 5.1.1, which shed some light on the issue. Essentially, this correlation showed that if MDOT SHA had a knowledge transfer mechanism in place, it could have potentially prevented the employees from having RFP and specification problems on their project. Another two positively correlated variables were between the employees who stated that there was a need to refine the specifications (Interviews 1, 3-5, 8, 12 & 15-18) and those who stated that the workload associated with APD methods is greater than it is in traditional methods. Specifically, variables 2.8.3 & 3.5 had a positive statistical significance of 0.022. From this correlation, the team concluded that one of the major areas causing an increase in workload is the poor quality of the specifications. A final significant correlation was between those employees who stated internal conflict issues (Interviews 1, 4, 7, 10, 12 & 14) and those who suggested that employees should receive specification writing training. Specifically, there was a positive statistical significance between variables 3.7.5 & 5.3.1 of 0.035. This correlation suggests that if MDOT SHA trains employees in specification writing, then internal tension could dissipate. There are multiple examples of this observation in the interview transcripts. In interview 4, response 15, the employee states, “MDOT SHA agreed that it was difficult to adjust to the DB process because reading a contract is different from writing one. It is hard but as long as there is support and someone who could review or guide them, it makes it a bit easier to figure out.” This infers that there are opportunities to reduce problems with the RFP and specifications. Interview 16, response 3, stated that, “they [this MDOT SHA division] noted that, they have a good relationship and good partnering with the DB contractor on this project, but the majority of their issues stem from requirements in the RFP that the DB contractor does not see as achievable and/or advantageous.” To address this, MDOT SHA could improve sections of the general RFP template and leave room for clarification from the contractor’s perspective. The research team recommends that MDOT SHA train more employees in the processes involved in the RFP and specification sections of APD projects. By carrying out this task, MDOT SHA can work toward increasing the overall acceptance of APD delivery methods and decrease the internal conflict surrounding this issue. In order to improve the RFP, MDOT SHA should include more sections in the document which addressed the delegation of risk; particularly, MDOT SHA should place slightly more risk on the contractor because there have
|21
been instances where MDOT SHA has experienced unnecessary financial losses. Finally, MDOT SHA should identify ways to transfer knowledge from experienced employees on how to properly develop a RFP. To achieve this goal, MDOT SHA should establish a peer exchange knowledge database that every employee could have access and share lessons learned.
PLANSANDREVIEWISSUES
Observation 4: The second issue experienced by a majority of the interviewed employees stemmed from the plans and the review of them during APD projects.
There were a few significant correlations between the variable which represents the employees who had an issue with the plans, 2.6.4. Those employees who had issues with the plans and the review process (Interviews 2, 3, 4, 8, 10, 14, 17 & 19), were more likely to suggest that SHA needs to choose better project candidates for APD methods. There was a positive statistical significance of 0.011 between variables 2.6.4 & 2.8.2. This suggests that that there should be more scrutiny when selecting APD project candidates otherwise there could be issues with the plans and the review process during design. Additionally, the employees who had issues with the plans were less likely to feel that the process for deciding how a project is delivered should stay with OHD. Variables 2.6.4 and 3.1 had a negative statistical significance of 0.024. This implies that, OHD being the only office that decides how a project is delivered, is leading to more problems with the plans and reviews than the administration realizes. It can also imply that more input from other divisions, may result in fewer issues with plans and their review. Finally, in order to demonstrate the significance of the plan review issue, the employees who listed it as an issue were also more likely to suggest that there was internal conflict about MDOT SHA goals and agendas. There was a positive statistical significance of 0.14 between variables 2.6.4 and 4.4. This means that the plans and the plan review process is a serious area of concern and if not addressed, it will continue to create tension within MDOT SHA. There are a few examples of observation 4 in the transcript including an excerpt from interview 14, response 4, where the employee states, “there was a lot of backing for review and comments.” The same employee also says (in response 3), “during the project selection phase, the MDOT SHA needs to do a better job at selecting good candidates for DB projects and exclude ones that aren’t good.” With regards to internal conflicts, the employee says, “for example, the ICD office is all about keeping a project on schedule and on budget and they prefer less change orders and fewer claims; for the geotechnical division, their main concern is centered on quality and safety.” In interview 1, response 8, the employee says, “[they spend] more time reviewing back and forth with the DB contractor than just designing it themselves.” The same employee believed a particular office should be involved in the APD selection process if the office plays a key role in the project; and stated: “For example, on the I-270 project, OOTS should have been involved in the decision-making process for the projects, but was not, which resulted in heavy traffic.” Based on observation 4, the team recommends that MDOT SHA do a better job of informing employees about the decision making process. It is very important that there a greater sense of alignment among MDOT SHA Divisions with regards to project delivery decisions. Finally, MDOT SHA needs to establish a new set of guidelines for the plan review process and update the format of the current DB manual.
|22
COMMUNICATIONANDITSROLE
Observation 5: After analyzing the data, the findings indicated that the role of communication, coordination, and previous APD experience plays a powerful part in the viewpoints of the interviewed employees with regard to APD methods.
Those employees who concluded that a major driver for success on their project was communication and APD experience (Interviews 1, 2, 5, 7, 10, 11, 13-16, 18, & 20) were more likely to reveal that APD methods can lead to innovation. The correlation between these two variables, 2.7.1 and 3.3 had a positive correlation with a p-value of 0.024. This indicates that if a greater emphasis is placed on communication, there is a greater likelihood that the project would be more innovative than a project delivered using traditional methods. On the other hand, there is a negative correlation between the two variables 2.7.1 and 3.4 with a p-value of 0.048. This means having better communication on the project and previous APD experience can lead to a smoother and more familiar transition between project delivery methods. There are examples of the importance of communication from the original interview transcript including interview 13, response 7, where the employee states, “on my particular project there was good communication between the consultants who were working on the design and I worked with them at every phase of the design. Also the continual meetings to monitor the project team’s progress, etc., were keys to success.” There are occasions where quality communication has produced a remarkable effect on the overall sense of the project’s efficiency or success. From this observation, the research team has developed a few recommendations. One recommendation is to incorporate communication into the DB manual and training program. This can be achieved by setting stricter communication standards. The proposed APD training program is included in Appendix D and includes an approach to communicating the benefits and practices of APD methods.
LOSSOFCONTROLWITHAPDMETHOD
Observation 6: Fearing the loss of project control is a major barrier to switching to APD methods for the MDOT SHA staff who were interviewed. This issue should be addressed through training and APD guidelines.
There were a few correlations in the data with employees who felt control was lost and other factors that explain why some employees felt this way. Those employees who believed that the standard process was key to the success of a project (Interviews 4, 8, 10, 12, 17, 19 & 21) were more likely to say that when using an APD method, MDOT SHA lost some degree of control. These two variables 2.7.2 & 4.5 had a positive statistical significance of 0.011. This finding indicates that the standard APD process needs to be refined in order to better suit the needs of employees and ensure that it doesn’t make them feel as if they are losing control over the project. Another positive correlation was between the employees who indicated that MDOT SHA engineers needed to refine the specifications and guidelines for APD projects (Interviews 1, 3-5, 8, 12 & 15-18) and those who felt control was lost. Variables 2.8.3 and 4.5 had a statistical significance of 0.031 which indicates that one issue leading to feeling of loss of control was the
|23
poor specifications and guidelines that accompany this type of project. Therefore, MDOT SHA should focus on refining the specifications and guidelines. A final area that affected control was changing from the traditional process (Interviews 3-5, 7, 8, 12, & 16-20). Variables 3.4 and 4.5 show a strong significance level with a p-value of 0. This linkage indicated that if employees felt that there were significant changes from the traditional delivery methods on an APD project, they would be more likely to feel that some degree of control was lost on the project. There are also examples of this observation in the original interview transcript. The 20th response from interview 5 states, “so if SHA wanted to add in anything at all, they would get a claim from the contractor. And in the end, the DB contractor has the control of the claim, which means SHA could lose the negotiation in that regard.” This reflects just one of the many examples in which MDOT SHA employees identified cases in which they felt they lost some portion of project control. There are several recommendations based on this sixth observation including training being critical to resolving the issue, if, the loss of project control is more of a mindset issue. However, if the problem isn’t a mindset issue, then there may be underlying issues with current manuals and standard practices. MDOT SHA should continue to improve these practices. Finally, MDOT SHA needs to ease the transition from a DBB project to an APD project to ensure that employees feel better prepared to work on an APD project. 5.3. GENERAL OBSERVATIONS
The previous section described six observations from the Spearman’s Rho test. However, there were other observations which deserve to be mentioned. They include performance, communication, employee mindset, satisfaction, and payment methods.
The first observation is “the performance of APD projects decreases when the amount of change orders increases.” After applying the Spearman’s Rho test, the results yielded that the variables 2.4 and 2.10 had a p-value of 0 and overall a negative correlation. These individual variables represented both the general performance of an individual’s APD project experience and the amount of change orders APD methods have compared to traditional methods. If an employee was more likely to respond in a positive manner when referring to the performance of their APD projects, they were less likely to say that they experienced more change orders on their APD projects as compared to their traditional projects. Conversely, if an employee was more likely to admit that they experienced more change orders using APD methods then they were less likely to say that the performance of their APD project experience was positive. For example, in interview 13, section 12 the interviewee notes, “I think that there should be less change orders with a DB project because of the early involvement with the designer.” This quote was interpreted as the employee has been informed that APD methods should lead to less change orders. However, if most employees assume that this to be the case in all APD projects, when they do end up experience more change orders, they will dislike the APD method to a greater extent because it failed to meet their expectations. A simple recommendation, to increase the appeal of performance in APD projects, was to try and limit the amount of change orders that occur on these projects. If MDOT SHA works to reduce the amount of change orders, then employees’ expectations will be met and they will have a better opinion of APD methods.
|24
The second observation can be summarized as, “The more fluid the communication on an APD project, the less employees feel the need for training.” The two variables which negatively correlate and have a p-value of 0.011 are 2.7.1 and 5.3.3. They show that if an employee stated that communication/coordination/previous APD experience was a key driver with their APD projects and whether they feel the need for APD process training. Therefore, if the employees conclude that a major driver for success on their project was communication and APD experience, then they are less likely to say that they would like training that covered an overview of the process. If employees have communication upfront and the ability to work with other experienced employees, then MDOT SHA would not have to use resources to provide training. One quote from an interview that sheds light on the communication observation is “…because of this enhanced communication with the Contractor in a DB project, the whole administration is thinking more efficiently when they are working with ROW.” The employee who was quoted also remarked that they didn’t feel a strong need for an overview training of the APD process. If an MDOT SHA employee experiences good communication on their APD project, then they also tend to have a more positive experience on other important areas of the APD process. The third observation is, “A lessons learned document can decrease the mindset of not wanting to change from the DBB process to the DB process.” The two variables that make up this negative correlation with a p-value of 0 are 4.1 and 5.6. The first variable represents whether the employee had a mindset of not wanting to change from DBB and the second variable represents whether that employee’s team or project group had access to a lessons learned document. From this correlation it was concluded that a lessons learned document was important to the employees who were more likely to admit that in their office or division there was a resistance to changing from the traditional process. For example, in interview 1, section 16 the interviewee states, “generally it is a little tough asking people to change their mindset about the current project delivery process because they’ve been doing DBB for over 20 years.” This quote is important because the same employee’s division also did not have access to a lessons learned document or database. While this is likely not the only reason that employees are resisting changing over from the DBB delivery method, accessibility to a lessons learned document plays a role in the issue. The recommendations for SHA is to implement a lessons learned document or database. This will presumably not only help to ease the transition of employees who are new to the concept but also help to decrease the resistance to change.
The fourth observation is, “learning on an individual basis can increase APD satisfaction.” The two variables that represent this observation are 5.1.1 and 6.1.1 and they are positively correlated with a p-value of 0.046. Respectively, they represent whether an employee received their knowledge of APD methods via an individual basis and the overall satisfaction that the employee has in regards to their APD project experience. This correlation is important because it demonstrated that the most effective means of training or teaching employees about APD methods is through an individualized, personal session. For example, in interview 4, section 28 an employees stated that “it was also very helpful being in touch with Dave Phillips and it could be even better if there were other people who were involved with other environmental DB projects that they could talk to.” It is important to point out that this employee had a satisfaction of 4 for their APD project experience, which is above the average of 3.8. From this comment it can be inferred that the employee is saying if there was more of an opportunity to learn from other experienced employees, they would be even more satisfied. A recommendation for
|25
MDOT SHA is to ensure that employees learn about APD through face to face interaction. Providing the capability to spread knowledge of APD methods on an individual basis would be not only satisfying that need, but employees could provide each other with personalized feedback.
A fifth observation is, “MDOT SHA should update its payment methods in APD by incorporating a material tracking system.” The two variables that represent this observation were 3.6.4 and 5.3.5 and were positively correlated with a p-value of 0.001. The first variable represents whether an employee suggested that SHA update its payment methods in APD projects and the second variable signifies if the employee also suggested that MDOT SHA needs some material submission and tracking training. Employees who were more likely to suggest that MDOT SHA needs to update their payment method for APD projects were more likely to conclude that MDOT SHA should include topics related to material submissions and tracking in APD training. In interview 8, section 23 the employee stated, “the topics that should be included in the training should be material submissions, plan reading and scheduling, labor loading and resource loading, the submittal process, and finally, community involvement.” The same employee also suggested that MDOT SHA update its payment method. As noted by several others, material submission and tracking with APD methods differs enough from traditional methods to warrant its own payment method. Moreover, material submission and tracking in APD methods is sometimes more hectic and less straightforward than traditional methods. The research team recommends that MDOT SHA incorporate an updated payment method or material submission and tracking training. These changes could reduce employee concerns and increase the efficiency of the payment method, potentially reducing financial errors.
|26
6: APD PERFORMANCE AND GOVERNANCE STRUCTURE
6.1 INTRODUCTION
Project performance is an important factor for justifying future use of APD. This chapter shows the impact of governance structure on project performance based on an analysis of 24 APD projects implemented at MDOT SHA. Most of the APD projects were DB, with only one CMAR project. Governance is different from management in that governance is about the overall framework of management decisions. When dealing with construction projects, governance contributes to the institutional arrangement, strategic direction, and long-term goals of a project whereas project management is focused on the successful execution of a project. Project governance is governance at the project level and it defines project objectives, provides the means to attain those objectives, and monitors and controls progress. Turner added that the role of project governance should include affording technical expertise through center of excellence, providing an audit function, and controlling risk exposure. Governance structures are different sets of decision-making and coordination mechanisms and incentives. Chang stated that the central role of governance structures is to maintain the order of transactions. Central to decision-making and maintaining the order of transactions is the degree of centralization in terms of project control. In this view, Müller recognized governance as a control function that aims to balance the organization’s economic and social objectives. The Organization for Economic Co-operation and Development (OECD) defined governance as both a control function and a relationship between the managers and the shareholders. For the purposes of this study, a measure of control/governance structure was identified – decision-making mode. The governance structure of projects was divided into two groups, centralized and decentralized, based on the decision-making process. A centralized governance structure means the decision-making power is the responsibility of one office; a decentralized governance structure means the decision-making power is shared among different offices. Two project governance factors – human asset specificity and information flow – could potentially affect APD project performance. Human asset specificity refers to the extent to which people with strong expertise in a particular area are demanded in a project. 6.2 RESEARCH DESIGN The goal of the analysis was to determine how different governance structures on APD projects affect project performance in time and cost. Over the past ten years, ICD has delivered more than 20 APD projects, in which two types of governance structure were used. One scenario corresponds to the centralized governance structure where ICD led the project in terms of deciding which delivery method to use, coordination of the procurement process, and had primary responsibility for project management. The other scenario, decentralized governance structure, were projects that another design division or district office led the procurement
|27
process and managed the project, and ICD was in more of a support/advisory role. Before the team started the research, two questions were asked about APD project performance. The first question was, “What aspects of project performance are of interest?” Aspects that are important to transportation agencies were the focus. They are as follows:
1. The amount of the contract award price versus the engineer’s estimate 2. The actual cost versus the contract award price 3. Delay from the original schedule, which was named as contract award cost growth, total
cost growth and schedule delay. The second question was, “What factors are to be considered in the research”. Some studies supported governance structure as a factor. Lin and Ho, through an empirical study, found that governance structure fit is critical for a construction joint venture to perform well. The research team thought that decision-making mode is a proper measure of governance structure. This idea was confirmed in the literature by Too and Weaver who stated that decision-making is one of the two key functions of project governance (the other one being oversight and assurance). Decision-making, in their opinion, included the selection procedure which determined whether a project was the “right” one to execute and the authorization of the start date and changes to the project. Also supported by the literature, Garland treated project governance as a structure of decision-making for the enablement of the decisions. Because better alignment of governance structure elements corresponds to better project performance, the team surmised that the centralized governance structure corresponds to better APD project performance, assuming that the centralized governance structure shows better alignment of governance structure elements. Other factors that the team considered relevant are selection method, project complexity, project size and competition. For this research project, there are two types of selection methods – low bid and best value. While both types require a technical proposal and a price proposal, the low bid method awards the contract to the lowest bidder, whereas the best value method makes a selection based on the combined score of the technical proposal and the price. Alleman et al. examined the effect of low bid vs. best value selection methods and concluded that Design-Build-Best-Value projects have lower total cost growth (percentage of final cost increase from the contract award price) and a faster delivery speed than Design-Build-Low-Bid projects. Based on this reasoning the research team believed that best value suggests better APD project performance.
|28
6.3 HYPOTHESES AND ANALYSIS METHOD
The following hypotheses were conceived. Hypothesis 1: Projects with the centralized governance structure have lower contract award cost growth than projects with the decentralized governance structure; the effect is larger for the best value selection method compared to the low-bid selection method, and is positive to project complexity, project size and competition. Hypothesis 2: Projects with the centralized governance structure have lower total cost growth than projects with the decentralized governance structure; the effect is larger for the best value selection method compared to the low-bid selection method, and becomes even larger as project complexity and project size increase. Hypothesis 3: Projects with the centralized governance structure have lower schedule delay than projects with the decentralized governance structure; the effect is larger for the best value selection method compared to the low-bid selection method, and becomes even large as project complexity and project size increase. Note that competition was precluded in Hypothesis 2 and 3 because the pre-award attribute obviously does not affect after-award performances, whereas governance structure, selection method, project complexity and project size are relevant factors both before and after the award of the contract. There were two steps in this analysis. The first step was to find out if there was a significant mean difference in each of the three performances based on a selection of the factors through ANOVA. If significant, those factors can be used in the second step, which was to build ordinary least square (OLS) regression models on the three performances. The second step requires defining new variables based on those significant factors in order to come up with robust models. The regressions, however, do not exclude the variables that are not significant in the first step or their related variables, all of which are entered into the models. There were also no assurances that the significant effect variables in the first step, or their related variables, would be significant in the regression models.
6.4 DATA COLLECTION AND CODING SCHEME
Data were collected through ICD, and were cross-referenced with the public records from MDOT SHA’s website. A total of 24 APD projects, with a total value of $461 million, were sampled. The projects were completed from 2006 to October 2015 and included various project types such as bridge replacements, intersection improvements, roadway/interchanges, storm water management facilities and stream restorations. The project sizes ranged from $605 thousand to $74 million (Figure 5). Contract award price ranged from $894 thousand to $82 million. As for governance structure, 21 projects were centralized and three were decentralized. Fourteen projects used the low bid selection method and 10 projects used the best value.
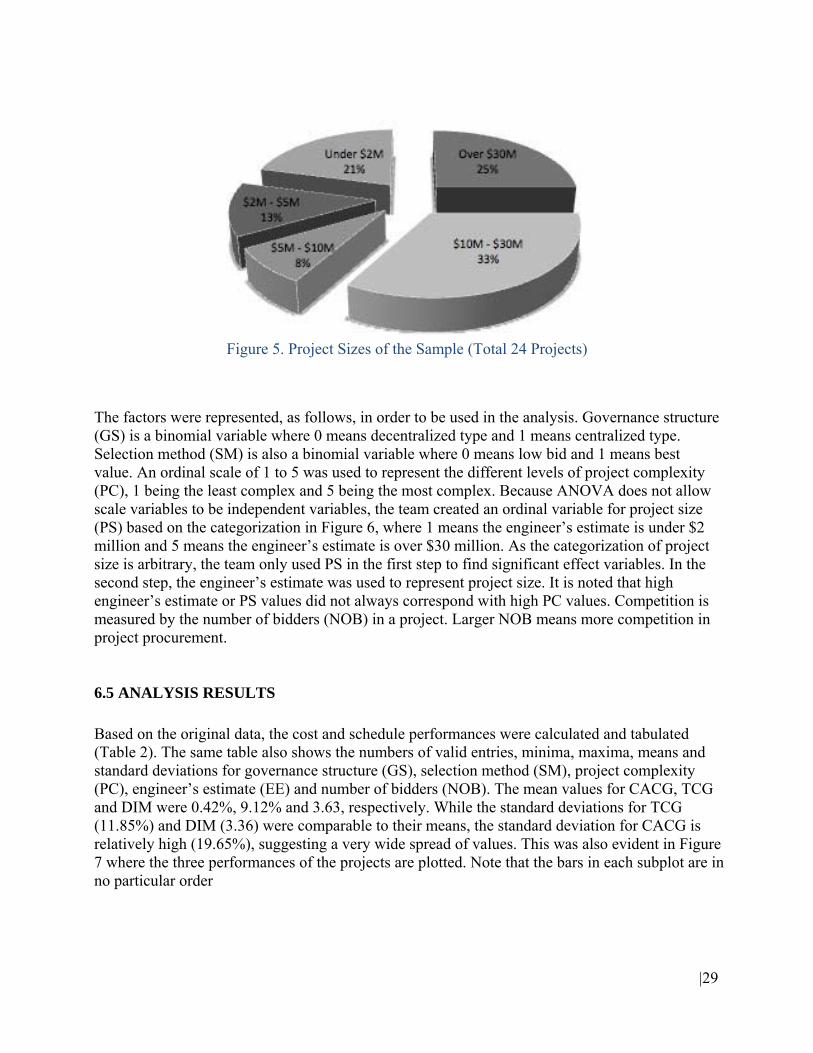
|29
Figure 5. Project Sizes of the Sample (Total 24 Projects)
The factors were represented, as follows, in order to be used in the analysis. Governance structure (GS) is a binomial variable where 0 means decentralized type and 1 means centralized type. Selection method (SM) is also a binomial variable where 0 means low bid and 1 means best value. An ordinal scale of 1 to 5 was used to represent the different levels of project complexity (PC), 1 being the least complex and 5 being the most complex. Because ANOVA does not allow scale variables to be independent variables, the team created an ordinal variable for project size (PS) based on the categorization in Figure 6, where 1 means the engineer’s estimate is under $2 million and 5 means the engineer’s estimate is over $30 million. As the categorization of project size is arbitrary, the team only used PS in the first step to find significant effect variables. In the second step, the engineer’s estimate was used to represent project size. It is noted that high engineer’s estimate or PS values did not always correspond with high PC values. Competition is measured by the number of bidders (NOB) in a project. Larger NOB means more competition in project procurement.
6.5 ANALYSIS RESULTS
Based on the original data, the cost and schedule performances were calculated and tabulated (Table 2). The same table also shows the numbers of valid entries, minima, maxima, means and standard deviations for governance structure (GS), selection method (SM), project complexity (PC), engineer’s estimate (EE) and number of bidders (NOB). The mean values for CACG, TCG and DIM were 0.42%, 9.12% and 3.63, respectively. While the standard deviations for TCG (11.85%) and DIM (3.36) were comparable to their means, the standard deviation for CACG is relatively high (19.65%), suggesting a very wide spread of values. This was also evident in Figure 7 where the three performances of the projects are plotted. Note that the bars in each subplot are in no particular order

|30
Table 2. Descriptive Statistics of Select Variables
Variable n Minimum Maximum Mean SD Governance Structure (GS) 24 0 1 0.87 0.34 Selection Method (SM) 24 0 1 0.42 0.50 Complexity 24 1 5 2.96 1.27 Engineer's Estimate (EE) 24 0.61 74 19.19 18.45 Number of Bidders (NOB) 24 1 7 3.42 1.501 Contract Award Cost Growth (CACG)
24 -32% 48% 0.42% 19.65%
Total Cost Growth (TCG) 14a 0 38% 9.12% 11.85%
Delay in Months (DIM) 13b -0.6 10.57 3.63 3.36
Notes: EE is measured in million dollars. The column headed by “n” shows the number of projects used in the analysis. SD means the standard deviation. aTen projects have not finished as of October 2015. bTen projects were not finished as of October 2015; missed the original completion date for another project.
Figure 6. Bar Plots of CACG, TCG, and DIM
Figure 7. Bar Plots of CACG, TCG and DIM
|31
Next, ANOVA (Analysis of Variance) tests were performed on the three performance metrics. The research team tried different combinations of the GS, SM, PC, PS and NOB to arrive at three sets of optimal result. The research team made sure that these sets of results have the following characteristics: the homoscedasticity (the within-group standard deviations are the same) and the normality (the errors follow a normal distribution) assumptions are satisfied and the model p- values (the probability of finding the observed or more extreme results if the null hypothesis is true) are less than < 0.05 for the corrected model. Further, the test results achieved a balance of the following: a relatively high adjusted R2 2 value, including as many variables as possible, especially GS, and showing as many significant variables as possible. The team also tested the cases where PC and/or PS were covariates. Levene’s tests were performed to check the homoscedasticity assumption. The p- values are 0.476, 0.742 and 0.053 for CACG, TCG and DIM, respectively, suggested evidence of homoscedasticity for all cases. As for the normality assumption, the team examined the Q-Q (Quantile-Quantile) plot of the unstandardized residuals (errors) for each case and found that the values are close to the diagonal line, which suggests evidence of normality. Other evidence of normality includes: the skewness and kurtosis values of the unstandardized residuals for TCG are within -2 to 2, and the Shapiro-Wilke statistic (SW = 0.891, p = 0.101) of the unstandardized residuals for DIM is not significant. The three ANOVA models with the team explored answered the following questions (Table 3).
Is there a mean difference in contract award cost growth based on governance structure,
selection method and number of bidders, controlling for project complexity and project size?
Is there a mean difference in total cost growth based on governance structure, selection method and project complexity, controlling for project size?
Is there a mean difference in delay in month based on governance structure and project size?
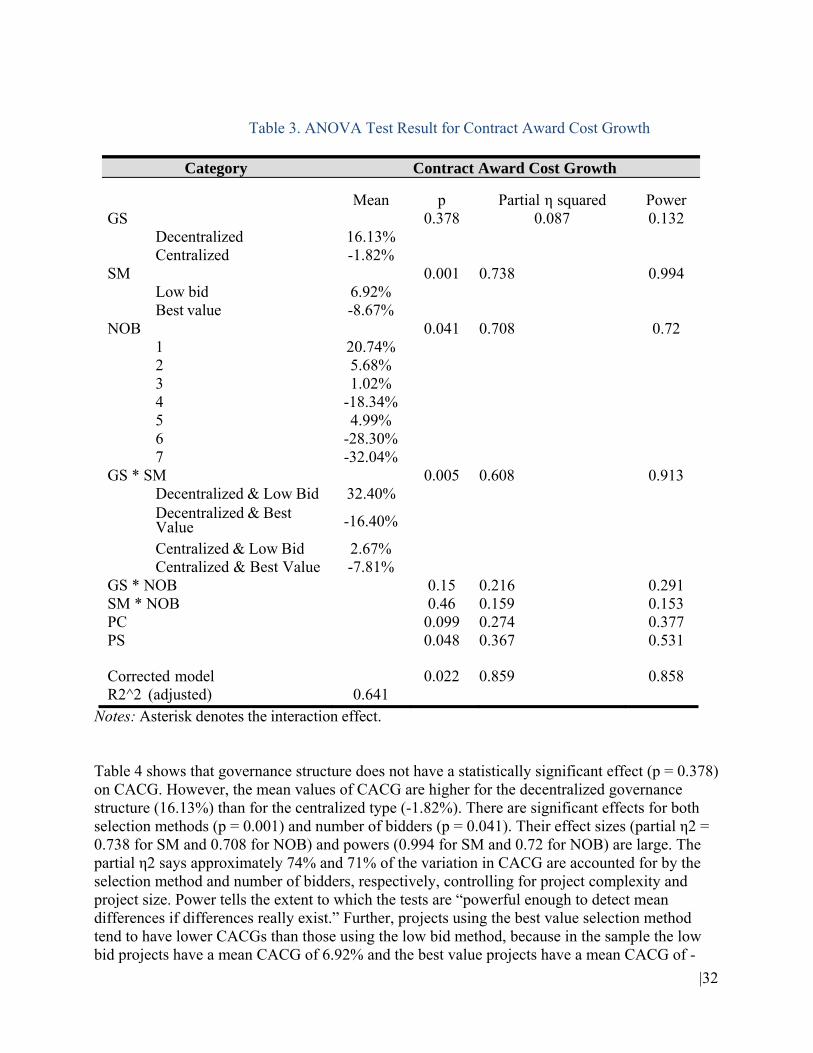
|32
Category Contract Award Cost Growth
Table 3. ANOVA Test Result for Contract Award Cost Growth
GS Mean p
0.378Partial η squared
0.087Power 0.132
Decentralized 16.13%
Centralized SM
-1.82% 0.001
0.738
0.994
Low bid 6.92%
Best value NOB
-8.67% 0.041
0.708
0.72
1 20.74%
2 5.68%
3 1.02%
4 -18.34%
5 4.99%
6 -28.30%
7 GS * SM
-32.04% 0.005
0.608
0.913
Decentralized & Low Bid 32.40%
Decentralized & Best Value -16.40%
Centralized & Low Bid 2.67%
Centralized & Best Value GS * NOB
-7.81% 0.15
0.216
0.291
SM * NOB 0.46 0.159 0.153PC 0.099 0.274 0.377PS 0.048 0.367 0.531
Corrected model R2^2 (adjusted)
0.641
0.022 0.859 0.858
Notes: Asterisk denotes the interaction effect. Table 4 shows that governance structure does not have a statistically significant effect (p = 0.378) on CACG. However, the mean values of CACG are higher for the decentralized governance structure (16.13%) than for the centralized type (-1.82%). There are significant effects for both selection methods (p = 0.001) and number of bidders (p = 0.041). Their effect sizes (partial η2 = 0.738 for SM and 0.708 for NOB) and powers (0.994 for SM and 0.72 for NOB) are large. The partial η2 says approximately 74% and 71% of the variation in CACG are accounted for by the selection method and number of bidders, respectively, controlling for project complexity and project size. Power tells the extent to which the tests are “powerful enough to detect mean differences if differences really exist.” Further, projects using the best value selection method tend to have lower CACGs than those using the low bid method, because in the sample the low bid projects have a mean CACG of 6.92% and the best value projects have a mean CACG of -
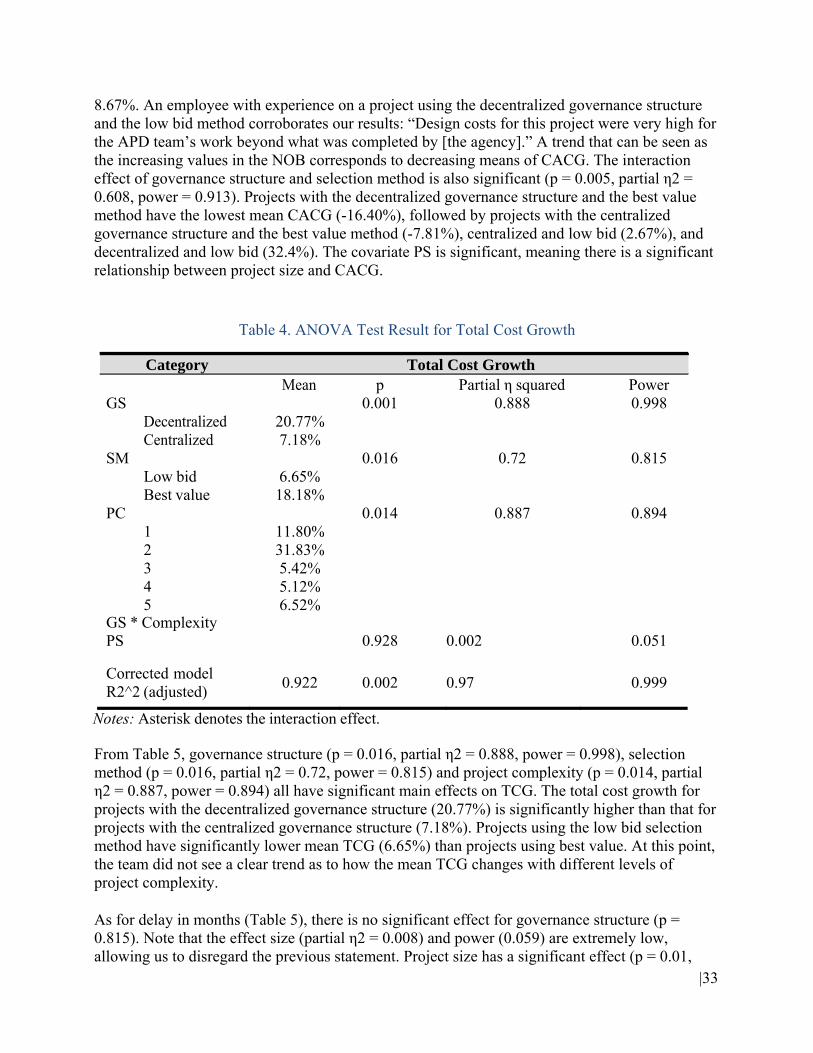
|33
8.67%. An employee with experience on a project using the decentralized governance structure and the low bid method corroborates our results: “Design costs for this project were very high for the APD team’s work beyond what was completed by [the agency].” A trend that can be seen as the increasing values in the NOB corresponds to decreasing means of CACG. The interaction effect of governance structure and selection method is also significant (p = 0.005, partial η2 = 0.608, power = 0.913). Projects with the decentralized governance structure and the best value method have the lowest mean CACG (-16.40%), followed by projects with the centralized governance structure and the best value method (-7.81%), centralized and low bid (2.67%), and decentralized and low bid (32.4%). The covariate PS is significant, meaning there is a significant relationship between project size and CACG.
Table 4. ANOVA Test Result for Total Cost Growth
Mean p Partial η squared Power
GS 0.001 0.888 0.998 Decentralized 20.77% Centralized 7.18%
SM 0.016 0.72 0.815 Low bid 6.65% Best value 18.18%
PC 0.014 0.887 0.894 1 11.80% 2 31.83% 3 5.42% 4 5.12% 5 6.52%
GS * Complexity PS
0.928
0.002
0.051
Corrected model R2^2 (adjusted)
0.922 0.002 0.97 0.999
Notes: Asterisk denotes the interaction effect. From Table 5, governance structure (p = 0.016, partial η2 = 0.888, power = 0.998), selection method (p = 0.016, partial η2 = 0.72, power = 0.815) and project complexity (p = 0.014, partial η2 = 0.887, power = 0.894) all have significant main effects on TCG. The total cost growth for projects with the decentralized governance structure (20.77%) is significantly higher than that for projects with the centralized governance structure (7.18%). Projects using the low bid selection method have significantly lower mean TCG (6.65%) than projects using best value. At this point, the team did not see a clear trend as to how the mean TCG changes with different levels of project complexity.
As for delay in months (Table 5), there is no significant effect for governance structure (p = 0.815). Note that the effect size (partial η2 = 0.008) and power (0.059) are extremely low, allowing us to disregard the previous statement. Project size has a significant effect (p = 0.01,
Category Total Cost Growth
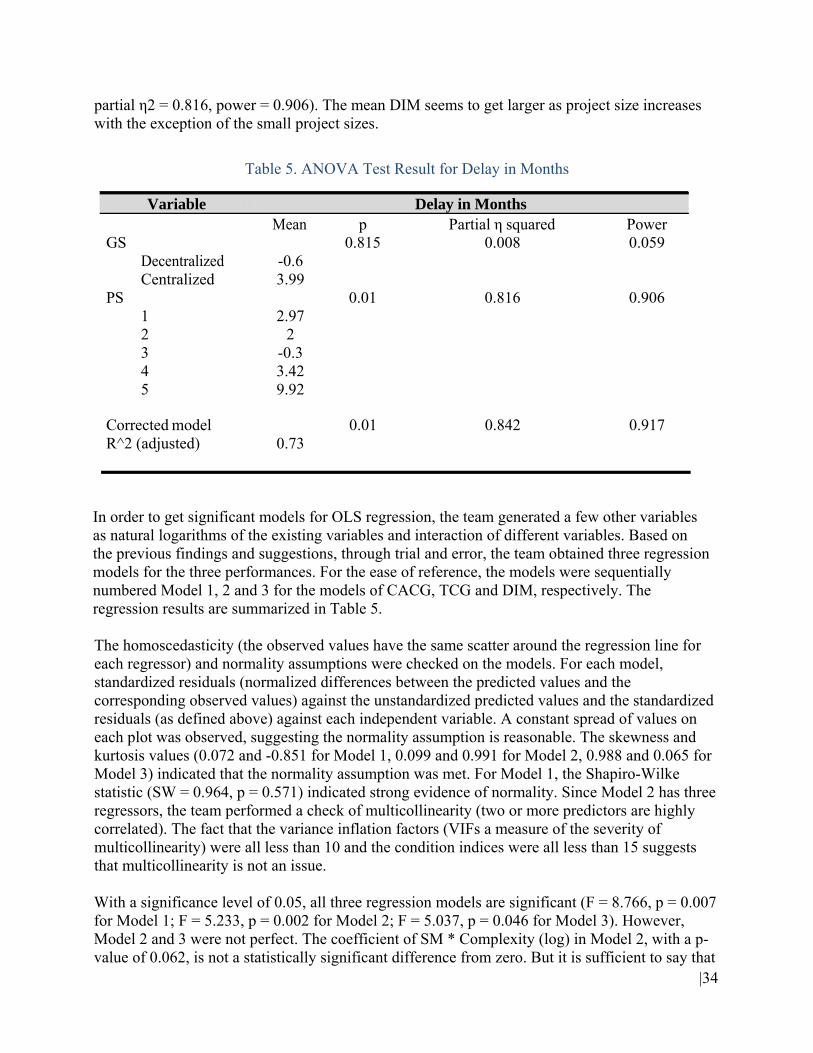
|34
partial η2 = 0.816, power = 0.906). The mean DIM seems to get larger as project size increases with the exception of the small project sizes.
Table 5. ANOVA Test Result for Delay in Months
Mean p Partial η squared Power
GS 0.815 0.008 0.059 Decentralized -0.6 Centralized 3.99
PS 0.01 0.816 0.906 1 2.97 2 2 3 -0.3 4 3.42 5 9.92
Corrected model 0.01 0.842 0.917 R^2 (adjusted) 0.73
In order to get significant models for OLS regression, the team generated a few other variables as natural logarithms of the existing variables and interaction of different variables. Based on the previous findings and suggestions, through trial and error, the team obtained three regression models for the three performances. For the ease of reference, the models were sequentially numbered Model 1, 2 and 3 for the models of CACG, TCG and DIM, respectively. The regression results are summarized in Table 5.
The homoscedasticity (the observed values have the same scatter around the regression line for each regressor) and normality assumptions were checked on the models. For each model, standardized residuals (normalized differences between the predicted values and the corresponding observed values) against the unstandardized predicted values and the standardized residuals (as defined above) against each independent variable. A constant spread of values on each plot was observed, suggesting the normality assumption is reasonable. The skewness and kurtosis values (0.072 and -0.851 for Model 1, 0.099 and 0.991 for Model 2, 0.988 and 0.065 for Model 3) indicated that the normality assumption was met. For Model 1, the Shapiro-Wilke statistic (SW = 0.964, p = 0.571) indicated strong evidence of normality. Since Model 2 has three regressors, the team performed a check of multicollinearity (two or more predictors are highly correlated). The fact that the variance inflation factors (VIFs a measure of the severity of multicollinearity) were all less than 10 and the condition indices were all less than 15 suggests that multicollinearity is not an issue.
With a significance level of 0.05, all three regression models are significant (F = 8.766, p = 0.007 for Model 1; F = 5.233, p = 0.002 for Model 2; F = 5.037, p = 0.046 for Model 3). However, Model 2 and 3 were not perfect. The coefficient of SM * Complexity (log) in Model 2, with a p-value of 0.062, is not a statistically significant difference from zero. But it is sufficient to say that
Variable Delay in Months

|35
there is a negative relationship between this variable and CACG. The constant (p = 0.468) in Model 3 is not significantly different from zero. This is not a problem as the goal of this research was not to predict the value of DIM, but to observe how DIM changes with the regressor which is EE (log) * GS. The regression equations are:
CACG=0.144‐0.053∗EE(log)∗NOB(log) (1)
TCG=0.208‐0.173∗GS+0.455∗SM‐0.272∗SM∗Complexity(log) (2)
DIM=1.055+1.291∗ EE(log)∗GS (3)
Equation 1 indicated that the contract award cost growth is affected by the engineer’s estimate and number of bidders, which agreed with the ANOVA result. As the engineer’s estimate and the number of bidders increased, the contract award cost growth decreased. Although selection method was determined to act as a significant influence on CACG in the ANOVA tests, the team could not find a linear regression model that included the selection method. Governance structure was also not in the equation. Hence, the equation does not show the interaction effect of governance structure and selection method.
Equation 2 showed a logical extension of the ANOVA result in that governance structure, selection method and complexity were all represented in the equation. The centralized governance structure helped to reduce TCG, which matched the ANOVA result. An employee’s comment on an APD project using the centralized governance structure supports this result: “If I needed anything, in terms of changes, [ICD] knew how to make the change without costing the state too much”. The low bid method corresponds to better TCG performance because no matter how the complexity of the project, TCG always takes a lower value for SM = 0 than for SM = 1. Moreover, in the best value selection method, as the project becomes more complex, the total cost growth decreased. The selection method portions of the result contradicted Hypothesis 2. In the absence of a good explanation, the team had reservations about the effect of selection method on total cost growth.
Equation 3 revealed that the centralized governance structure and bigger projects tend to have more delay, which negated Hypothesis 3. However, considering there was only one case for the decentralized governance structure with a valid entry of DIM, the team disregarded the regression result on DIM. An employee with APD experience suggested that different offices have different sets of agenda. “The ICD office is all about keeping a project on schedule and on budget … For the geotechnical division, the main concern is centered on quality and safety”. The team contended that projects with the centralized governance structure prioritized schedule control, therefore, was likely to have less delay. Further research is required to validate this effect.
6.6 SUMMARY AND MANAGERIAL IMPLICATIONS
The analysis presented empirical evidence on how project governance structure affects DB project performances. The research team used the variable, decision-making mode, as a measure for governance structure. From this method, the effect of governance structure on three performances – contract award cost growth, total cost growth and schedule delay, was analyzed.
|36
As for contract award cost growth, the team observed that the mean contract award cost growth for the centralized governance structure was lower than that for the decentralized governance structure, although the difference is not significant. There was a significant interaction effect of governance structure and selection method; however, it is not represented in the linear regression model. The existence of the interaction effect warranted further investigation because the reason and method in which a decision is made regarding the contract winner, based on the best value method, determines the contract award price. Regarding total cost growth, there is a significant main effect for governance structure from the results of the ANOVA test. From the linear regression model, the team found that the centralized governance structure reduced the total cost growth. As for schedule delay, the team does not hold the results from the ANOVA test and the linear regression to be true because of the extremely unbalanced data for the centralized and decentralized governance structures From the operational point of view, an agency should recognize the importance of governance structure for influencing APD project performance. This research proved that at least in controlling the contract award cost growth and the total cost growth, the centralized governance structure displayed better performance. The research also showed the benefit for the agency to set up and use a centralized office, similar to the Innovative Contracting Division, for implementing the various APD processes, from procurement to closeout. The office should be at a project governance level instead of a project management level. The difference is that the former entails being held accountable for aligning the project objectives with the agency’s overarching objectives, whereas the latter only concerns meeting the project objectives. The office should have more decision- making power than a regular project management office whose primary role is coordination.
|37
7 CONCLUSION AND RECOMMENDATIONS
7.1 CONCLUSION
This study was initiated based on MDOT SHA’s desire to develop a strategic and integrated approach for efficiently and effectively identifying, developing, procuring, and managing projects using APD methods. While the traditional form of delivering projects through design-bid-build has worked, it has not excelled in all cases. The flaws of traditional project delivery methods have led states such as Maryland, Utah, and Arizona, to investigate other promising means of delivering projects such as Design Build (DB) and Construction Manager at Risk (CMAR).
Although these methods have their advantages, they are still being refined by transportation agencies to achieve optimal results. The MDOT SHA has recognized the potential benefits that come with APD methods, most specifically in DB, but has also experienced a few setbacks with these methods. In order to effectively implement APD methods at MDOT SHA, the research team was asked to investigate the Administration’s current practices and employees’ views towards APD.
The team designed a research plan that consisted of three main tasks. The first task was a review literature of existing best practices from transportation agencies in the United States. The second task developed a questionnaire which was used in interviews with MDOT SHA employees. The third task was to analyze project and other data collected from the interviews.
From the literature review the team identified key findings about the current state of APD methods. The team developed an easy-to-use best practices table that MDOT SHA can use to evaluate which practices to implement. Some of the most important observations from the literature review are noted below:
Public agencies should ‘use monthly reports along with invoices to ensure construction cost’ (Minchin et al., 2014).
Transportation agencies should ‘develop a quality management plan’ (Minchin et al., 2014).
And finally that agencies should ‘Correlate directly the design packages with the subcontractor bid packages’ (Minchin et al., 2014).
In addition to these observations are many more insightful practices that have been used by other state DOTs. They are included in the best practice table in Appendix A. These practices were crosses referenced with MDOT SHA’s current DB manual in order to emphasize areas that were effective and other areas that needed some enhancement.
|38
During task two of the research plan, the team identified 29 employees from 3 districts (including headquarters employees) and completed 21 interviews. Valuable data on current APD practices and employee views was collected from the interviews. The team analyzed this data and identified correlations and causations between various issues, current practices and project results. From the analysis of the respondent’s answers to the questionnaire, the team identified six observations including the following:
‘The role of communication, coordination, and previous APD experience plays a powerful
role in the viewpoints of the employees in regards to APD methods” “The experience that each employee had, in terms of the amount of APD projects they
participated in, affected the types of issues and barriers that each employee faced.”
Based on the observations, the research team proposed solutions to the issues that were raised and reinforced the actions that were contributing to the projects in an effective manner.
7.2 APD RECOMMENDATIONS In addition to identifying industry best practices for APD methods, the team was also tasked with providing recommendations about how to implement these practices into MDOT SHA’s current delivery system. The best practices table is the primary tool that was created to help facilitate implementation. It includes the APD best practices determined to be the most important and suggestions on how the practice could be incorporated into a new delivery system and where the practice could be placed in terms of the project timeline. The research team noted that in order to employ the best practices, MDOT SHA needed to consider its factors such as organizational structure, past experience, and contractor characteristics in each engineering district. The MDOT SHA should first examine these factors and evaluate if the requirements for each practice can be accommodated. Based on the employee interviews, the team made a few recommendations. Each recommendation was tied to the subsequent observations from the interview data analysis. For example, for the observation that stated communication played an essential role in the success of a project, the team recommended that MDOT SHA incorporate communication into the DB manual and set stricter communication standards throughout the organization. For the observation that stressed that employees with different levels of APD experience face different types of issues, the team recommended that MDOT SHA cater its training and manual in a specific way to address the issues faced by each type of experience group. These recommendations can be referred to under each observation listed in Section 5. In order to supplement the training that the Office of Highway Development has used since implementing APD methods, the research team developed a modified training program that incorporates all of the critical information that was gathered through this project. The training program was designed to meet the needs that employees stressed during the interviews and includes information on existing practices and programs. This program was built off of the existing MDOT SHA training materials to help facilitate its implementation and use. The training program is located in Appendix D of this report.
|39
8 REFERENCES
ADOT Intermodal Transportation Division. (2014). Construction Manager at Risk (CMAR) Process Guide. Phoenix: ADOT Construction Group. Retrieved from http://azdot.gov/docs/default-source/construction-group/cmar_manual_100510.pdf?sfvrsn=0
AECOM (2006). “Design-Build Effectiveness Study: As Required by TEA-21 Section 1307(f).” AECOM Consult, January 2006. https://trid.trb.org/view.aspx?id=1212643.
AGC/ACEC/SCDOT Design‐build Subcommittee. (2012). SCDOT Design‐Build Project Development and Procurement Best Practices Memorandum. South Carolina Department of Transportation. Retrieved from http://www.scdot.org/doing/doingpdfs/designbuild_bestpractices.pdf
Alleman, Douglas, Arthur Antoine, Mia Schrilla, and Keith Molenaar. “The Use and Performance of Alternative Contracting Methods on Small Highway Construction Projects.” Procedia Engineering 145 (2016): 908–15. doi:10.1016/j.proeng.2016.04.118.
Ashuri, B., & Kashani, H. (2015). Recommended Guide for Next Generation of Transportation Design Build Procurement and Contracting in the State of Georgia. Atlanta: Georgia Tech Research Corporation. Retrieved from http://www.dot.ga.gov/BuildSmart/research/Documents/10-23.pdf
Associated General Contractors of America and the National Association of State Facilities Administrators,. (2007). CM/GC Guidelines for Public Owners. Author. Retrieved from https://www.agc.org/sites/default/files/Files/Construction%20Markets/CM_GC_Guidelines.pdf
Badewi, Amgad. “The Impact of Project Management (PM) and Benefits Management (BM) Practices on Project Success: Towards Developing a Project Benefits Governance Framework.” International Journal of Project Management 34, no. 4 (May 2016): 761–78. doi:10.1016/j.ijproman.2015.05.005.
Caniëls, Marjolein C.J., Cees J. Gelderman, and Nicole P. Vermeulen. “The Interplay of Governance Mechanisms in Complex Procurement Projects.” Journal of Purchasing and Supply Management 18, no. 2 (June 2012): 113–21. doi:10.1016/j.pursup.2012.04.007.
Chang, Chen-Yu. “Risk-Bearing Capacity as a New Dimension to the Analysis of Project Governance.” International Journal of Project Management 33, no. 6 (August 2015): 1195– 1205. doi:10.1016/j.ijproman.2015.02.003.
Chen, Qing, Zhigang Jin, Bo Xia, Peng Wu, and Martin Skitmore. “Time and Cost Performance of Design–Build Projects.” Journal of Construction Engineering and Management 142, no. 2 (2015): 04015074.
Construction Management Association of America (CMAA),. (2015). Owner’s Guide to Project Delivery Methods. Author. Retrieved from https://cmaanet.org/files/Owners%20Guide%20to%20Project%20Delivery%20Methods%20 Final.pdf
CTC & Associates,. (2014). Best Practices in Pavement Design for Design-Build Projects. Minnesota Department of Transportation. Retrieved from http://www.lrrb.org/media/reports/TRS1402.pdf
Ernstrom, J., & Loulakis, M. (2012). Navigating the Design-Build World on Public Projects. Presentation, Orlando, FL.
Florida Department of Transportation (2002). State of the Practice Review in Design-Build.
|40
FDOT. Retrieved from http://www.dot.state.fl.us/construction/designbuild/DBGeneral/State%20of%20Practice%20 D-B.doc
Garland, Ross. Project Governance: A practical guide to effective project decision making. Kogan Page Publishers, 2009.
Ghavamifar, K. (2009). A decision support system for project delivery method selection in the transit industry. Civil Engineering Dissertations, 7.
Gransberg, D. D., & MDOT SHAne, J. S. (2010). Construction manager-at-risk project delivery for highway programs (Vol. 402). Transportation Research Board.
Heide, Jan B. "Plural governance in industrial purchasing." Journal of Marketing 67, no. 4 (2003): 18-29.
Jia, Guangshe, Lingling Chen, Xiaodi Ding, and Johnny Wong. “Project Governance Framework for Mega Construction Projects (mcps) in China: Lessons from Shith and Shcbd Projects.” In Organization and Management of Construction. CIB International Council for Research and Innovation in Building and Construction, 2013.
Jordan, S. (2005) “Design Build Contracting for Highway Projects: A Performance Assessment.” UT: Tom Warne & Associates LLC.
Lin, Yi-Hsin, and S. Ping Ho. “Impacts of Governance Structure Strategies on the Performance of Construction Joint Ventures.” Journal of Construction Engineering and Management 139, no. 3 (March 2013): 304–11. doi:10.1061/(ASCE)CO.1943-7862.0000619.
Lomax, Richard G., and Debbie L. Hahs-Vaughn. An introduction to statistical concepts. Routledge, 2013.
Loulakis, M., & Hoag, D. (2013). Design-Build Done Right, Best Design-Build Practices. Design-Build Institute of America Publication. Retrieved from https://www.dbia.org/resource-center/Documents/bestpractices130819.pdf
Lu, Ping, Shuping Guo, Lamei Qian, Ping He, and Xiaoyan Xu. “The Effectiveness of Contractual and Relational Governances in Construction Projects in China.” International Journal of Project Management 33, no. 1 (January 2015): 212–22. doi:10.1016/j.ijproman.2014.03.004.
MASSDOT,. (2006). Design Build Procurement Guide. The Massachusetts Department of Transportation. Retrieved from http://www.mhd.state.ma.us/downloads/manuals/designbuildguidelines.pdf
McMinimee, J. C., Schaftlein, S., Warne, T. R., Detmer, S. S., Lester, M. C., Mroczka, G. F., ... & Yew, C. (2009). Best practices in project delivery management (No. NCHRP Project 20- 68A).
Minchin, R. Edward, Xiaoxiao Li, Raja R. Issa, and Gary G. Vargas. “Comparison of Cost and Time Performance of Design-Build and Design-Bid-Build Delivery Systems in Florida.” Journal of Construction Engineering and Management 139, no. 10 (October 2013): 04013007. doi:10.1061/(ASCE)CO.1943-7862.0000746.
Minchin, E., Ptschelinzew, L., Migliaccio, G. C., Gatti, U., Atkins, K., Warn, T., Hostetler, G. and Asiamah, S. (2014). Guide for design management on design-build and construction manager/general contractor projects.
Molenaar, Keith R., Anthony D. Songer, and Mouji Barash. “Public-Sector Design/Build Evolution and Performance.” Journal of Management in Engineering 15, no. 2 (1999): 54–62. doi:10.1061/(ASCE)0742-597X(1999)15:2(54).
Molenaar, K., Gransberg, D., Scott, S., Downs, D., & Ellis, R. (2005). Recommended AASHTO Design-Build Procurement Guide. National Cooperative Highway Research Program
|41
Transportation Research Board National Research Council. Retrieved from http://onlinepubs.trb.org/onlinepubs/archive/NotesDocs/NCHRP20-07(172)_FR.pdf
Müller, Ralf, Li Zhai, Anyu Wang, and Jingting MDOT SHAo. “A Framework for Governance of Projects: Governmentality, Governance Structure and Projectification.” International Journal of Project Management 34, no. 6 (August 2016): 957–69. doi:10.1016/j.ijproman.2016.05.002.
Naderpajouh, Nader, and Makarand Hastak. “Quantitative Analysis of Policies for Governance of Emergent Dynamics in Complex Construction Projects.” Construction Management and Economics 32, no. 12 (December 2, 2014): 1222–37. doi:10.1080/01446193.2014.980835.
Nielsen, Kris R. “Governance of the Megaproject.” Advice from Those Who’ve Been There, Done That, 2013, 5.
OECD Principles of Corporate Governance. Paris, France: OECD, 2004. https://www.oecd.org/corporate/ca/corporategovernanceprinciples/31557724.pdf.
Park, R. (2014). CMGC Experience & Lessons Learned. Presentation, Montpelier, VT. Samset, Knut, and Gro Holst Volden. “Front-End Definition of Projects: Ten Paradoxes and
Some Reflections Regarding Project Management and Project Governance.” International Journal of Project Management 34, no. 2 (February 2016): 297–313. doi:10.1016/j.ijproman.2015.01.014.
Sanderson, Joe. “Risk, Uncertainty and Governance in Megaprojects: A Critical Discussion of Alternative Explanations.” International Journal of Project Management 30, no. 4 (May 2012): 432–43. doi:10.1016/j.ijproman.2011.11.002.
Schierholz, Jeanna. (2012). Evaluating the preconstruction phase in a Construction Manager/General Contractor project. Digital Repository @ Iowa State University.
Scott, William G., Terence R. Mitchell, and Newman S. Peery. "Organizational governance." Handbook of organizational design 2 (1981): 135-151.
MDOT SHAne, J. S., & Gransberg, D. D. (2010). Coordination of Design Contract with Construction Manager-at-Risk Preconstruction Service Contract. Transportation Research Record: Journal of the Transportation Research Board, 2151(1), 55-59.
MDOT SHAne, J. S., & Gransberg, D. D. (2012). Construction Manager/General Contractor Issue Identification (No. MN/RC 2012-25). Minnesota Department of Transportation, Research Services.
Shenhar, Aaron J., Dov Dvir, Thomas Lechler, and Michael Poli. "One size does not fit all: True for projects, true for frameworks." In Proceedings of PMI Research Conference, pp. 14-17. Project Management Institute, 2002.
Shrestha, Pramen P., James T. O’Connor, and G. Edward Gibson. “Performance Comparison of Large Design-Build and Design-Bid-Build Highway Projects.” Journal of Construction Engineering and Management 138, no. 1 (January 2012): 1–13. doi:10.1061/(ASCE)CO.1943-7862.0000390.
The Construction Management Association of America (CMAA),. (2015). Owner’s Guide to Project Delivery Methods. Author. Retrieved from https://cmaanet.org/files/Owners%20Guide%20to%20Project%20Delivery%20Methods%20Final.pdf
Too, Eric G., and Patrick Weaver. “The Management of Project Management: A Conceptual Framework for Project Governance.” International Journal of Project Management 32, no. 8 (November 2014): 1382–94. doi:10.1016/j.ijproman.2013.07.006.
Touran, A., Gransberg, D. D., Molenaar, K. R., Ghavamifar, K., Mason, D. J., & Fithian, L. A. (2009). A guidebook for the evaluation of project delivery methods (No. Project G-8).

|42
Tran, Dai, J. Cameron Lampe, Sai Bypaneni, and Keith Molenaar. “An Empirical Comparison of Cost Growth between Highway Design-Bid-Build and Design-Build Projects by Project Size.” In Construction Research Congress 2016, 2029–38. Accessed July 15, 2016. http://ascelibrary.org/doi/abs/10.1061/9780784479827.202
Turner, J. Rodney. "Towards a theory of project management: The nature of the project governance and project management." International Journal of project management 24, no. 2 (2006): 93-95.
Turner, J. Rodney, and Anne Keegan. "The versatile project-based organization: governance and operational control." European management journal 17, no. 3 (1999): 296-309.
van den Hurk, Martijn, and Koen Verhoest. “The Governance of Public–Private Partnerships in Sports Infrastructure: Interfering Complexities in Belgium.” International Journal of Project Management 33, no. 1 (January 2015): 201–11.
Williamson, Oliver E. The mechanisms of governance. Oxford University Press, 1996. Yin, Xiaoli, and Edward J. Zajac. "The strategy/governance structure fit relationship: Theory and
evidence in franchising arrangements." Strategic management journal 25, no. 4 (2004): 365- 383.
Zerjav, Vedran, Timo Hartmann, and Amy Javernick-Will. “Internal Governance of Design and Engineering: The Case of the Multinational Firm.” Journal of Construction Engineering and Management 138, no. 1 (2012): 135–43. doi:10.1061/(ASCE)CO.1943-7862.0000417.
|43
9 APPENDIX
A. List of Best Practices in Alternative Project Delivery:
B. MDOT SHA APD Questionnaire
C. Data Analysis and Descriptive Statistics
D. APD Training Program
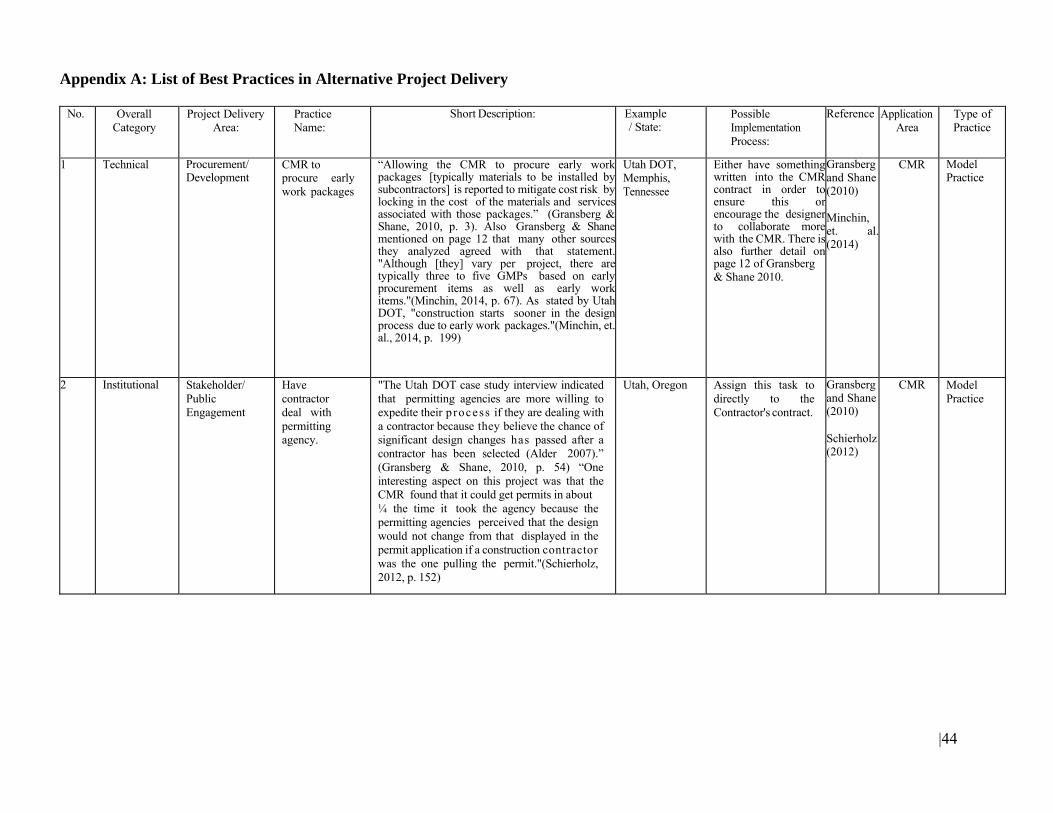
|44
Appendix A: List of Best Practices in Alternative Project Delivery
No. Overall Category
Project Delivery Area:
Practice Name:
Short Description: Example/ State:
Possible Implementation Process:
Reference Application Area
Type of Practice
1 Technical Procurement/ Development
CMR to procure early work packages
“Allowing the CMR to procure early work packages [typically materials to be installed bysubcontractors] is reported to mitigate cost risk bylocking in the cost of the materials and servicesassociated with those packages.” (Gransberg &Shane, 2010, p. 3). Also Gransberg & Shanementioned on page 12 that many other sourcesthey analyzed agreed with that statement."Although [they] vary per project, there aretypically three to five GMPs based on earlyprocurement items as well as early workitems."(Minchin, 2014, p. 67). As stated by UtahDOT, "construction starts sooner in the designprocess due to early work packages."(Minchin, et. al., 2014, p. 199)
Utah DOT,Memphis, Tennessee
Either have somethingwritten into the CMRcontract in order toensure this orencourage the designerto collaborate morewith the CMR. There isalso further detail onpage 12 of Gransberg & Shane 2010.
Gransbergand Shane(2010) Minchin, et. al.(2014)
CMR ModelPractice
2 Institutional Stakeholder/ Public Engagement
Have contractor deal with permitting agency.
"The Utah DOT case study interview indicated that permitting agencies are more willing to expedite their p rocess if they are dealing with a contractor because they believe the chance of significant design changes has passed after a contractor has been selected (Alder 2007).” (Gransberg & Shane, 2010, p. 54) “One interesting aspect on this project was that the CMR found that it could get permits in about ¼ the time it took the agency because the permitting agencies perceived that the design would not change from that displayed in the permit application if a construction contractor was the one pulling the permit."(Schierholz, 2012, p. 152)
Utah, Oregon Assign this task to directly to the Contractor's contract.
Gransbergand Shane(2010) Schierholz(2012)
CMR Model Practice
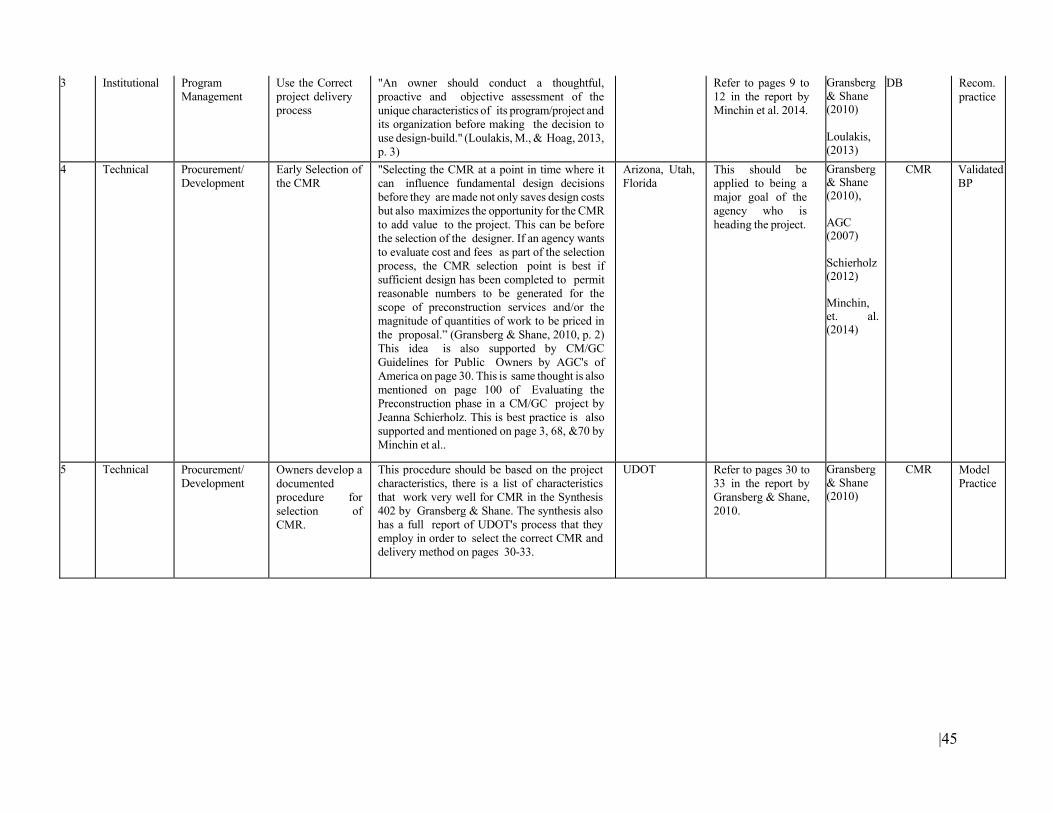
|45
3 Institutional Program Management
Use the Correct project delivery process
"An owner should conduct a thoughtful, proactive and objective assessment of the unique characteristics of its program/project and its organization before making the decision to use design-build." (Loulakis, M., & Hoag, 2013, p. 3)
Refer to pages 9 to 12 in the report by Minchin et al. 2014.
Gransberg& Shane (2010) Loulakis, (2013)
DB Recom. practice
4 Technical Procurement/ Development
Early Selection of the CMR
"Selecting the CMR at a point in time where it can influence fundamental design decisions before they are made not only saves design costs but also maximizes the opportunity for the CMR to add value to the project. This can be before the selection of the designer. If an agency wants to evaluate cost and fees as part of the selection process, the CMR selection point is best if sufficient design has been completed to permit reasonable numbers to be generated for the scope of preconstruction services and/or the magnitude of quantities of work to be priced in the proposal.” (Gransberg & Shane, 2010, p. 2) This idea is also supported by CM/GC Guidelines for Public Owners by AGC's of America on page 30. This is same thought is also mentioned on page 100 of Evaluating the Preconstruction phase in a CM/GC project by Jeanna Schierholz. This is best practice is also supported and mentioned on page 3, 68, &70 by Minchin et al..
Arizona, Utah, Florida
This should be applied to being a major goal of the agency who is heading the project.
Gransberg& Shane (2010), AGC (2007) Schierholz (2012) Minchin, et. al. (2014)
CMR Validated BP
5 Technical Procurement/ Development
Owners develop a documented procedure for selection of CMR.
This procedure should be based on the project characteristics, there is a list of characteristics that work very well for CMR in the Synthesis 402 by Gransberg & Shane. The synthesis also has a full report of UDOT's process that they employ in order to select the correct CMR and delivery method on pages 30-33.
UDOT Refer to pages 30 to 33 in the report by Gransberg & Shane, 2010.
Gransberg& Shane (2010)
CMR Model Practice
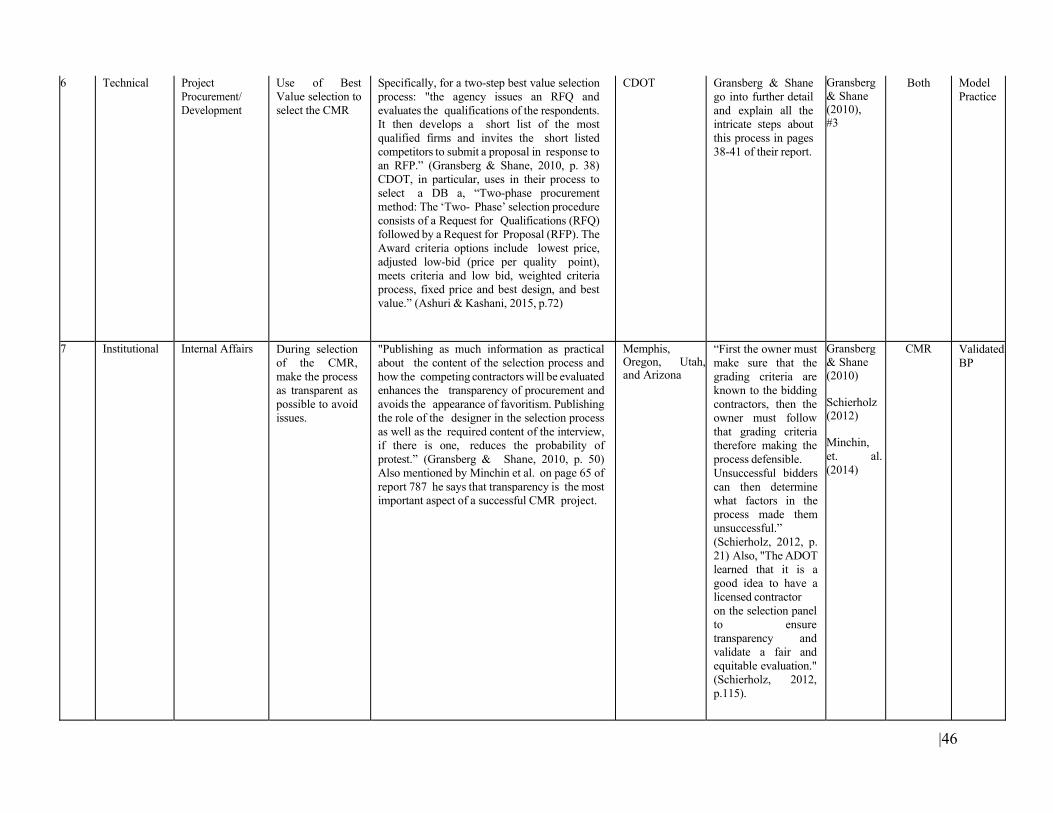
|46
6 Technical Project Procurement/ Development
Use of Best Value selection to select the CMR
Specifically, for a two-step best value selection process: "the agency issues an RFQ and evaluates the qualifications of the respondents. It then develops a short list of the most qualified firms and invites the short listed competitors to submit a proposal in response to an RFP.” (Gransberg & Shane, 2010, p. 38) CDOT, in particular, uses in their process to select a DB a, “Two-phase procurement method: The ‘Two- Phase’ selection procedure consists of a Request for Qualifications (RFQ) followed by a Request for Proposal (RFP). The Award criteria options include lowest price, adjusted low-bid (price per quality point), meets criteria and low bid, weighted criteria process, fixed price and best design, and best value.” (Ashuri & Kashani, 2015, p.72)
CDOT Gransberg & Shane go into further detail and explain all the intricate steps about this process in pages 38-41 of their report.
Gransberg& Shane (2010), #3
Both Model Practice
7 Institutional Internal Affairs During selection of the CMR, make the process as transparent as possible to avoid issues.
"Publishing as much information as practical about the content of the selection process and how the competing contractors will be evaluated enhances the transparency of procurement and avoids the appearance of favoritism. Publishing the role of the designer in the selection process as well as the required content of the interview, if there is one, reduces the probability of protest.” (Gransberg & Shane, 2010, p. 50) Also mentioned by Minchin et al. on page 65 of report 787 he says that transparency is the most important aspect of a successful CMR project.
Memphis,Oregon, Utah,and Arizona
“First the owner must make sure that the grading criteria are known to the bidding contractors, then the owner must follow that grading criteria therefore making the process defensible. Unsuccessful bidders can then determine what factors in the process made them unsuccessful.” (Schierholz, 2012, p. 21) Also, "The ADOT learned that it is a good idea to have a licensed contractor on the selection panel to ensure transparency and validate a fair and equitable evaluation." (Schierholz, 2012, p.115).
Gransberg& Shane (2010) Schierholz (2012) Minchin, et. al. (2014)
CMR Validated BP
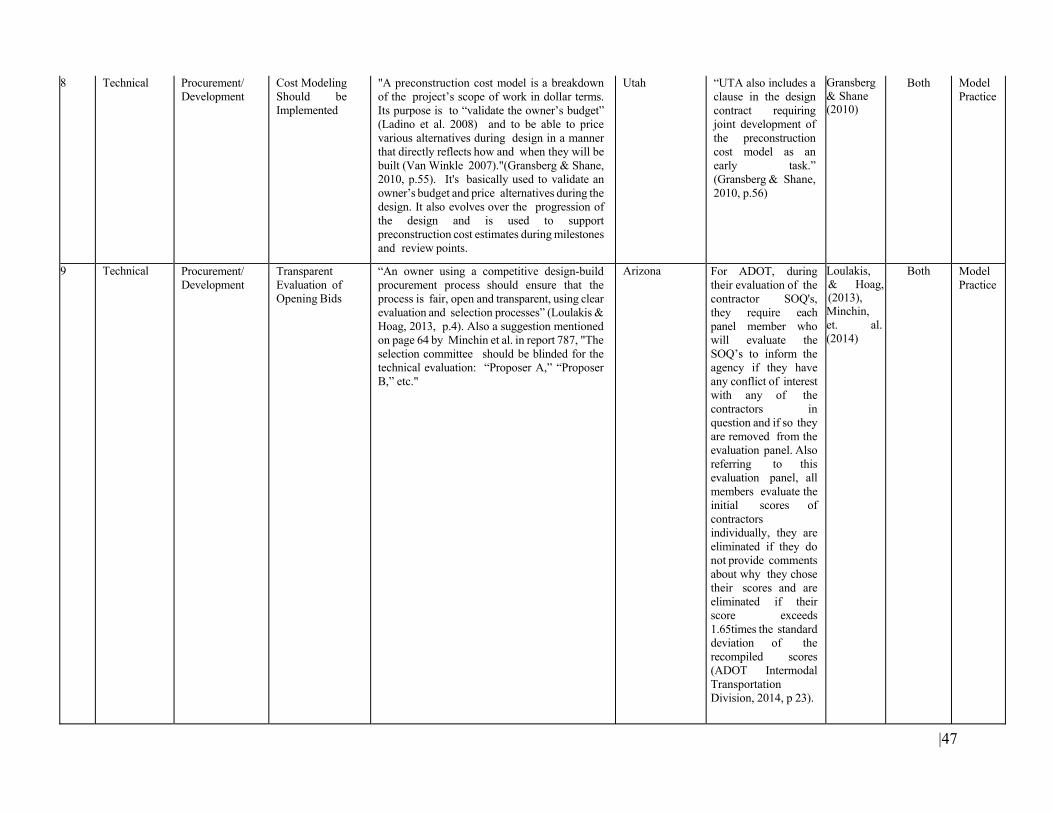
|47
8 Technical Procurement/ Development
Cost Modeling Should be Implemented
"A preconstruction cost model is a breakdown of the project’s scope of work in dollar terms. Its purpose is to “validate the owner’s budget” (Ladino et al. 2008) and to be able to price various alternatives during design in a manner that directly reflects how and when they will be built (Van Winkle 2007)."(Gransberg & Shane, 2010, p.55). It's basically used to validate an owner’s budget and price alternatives during the design. It also evolves over the progression of the design and is used to support preconstruction cost estimates during milestones and review points.
Utah “UTA also includes a clause in the design contract requiring joint development of the preconstruction cost model as an early task.” (Gransberg & Shane, 2010, p.56)
Gransberg& Shane (2010)
Both Model Practice
9 Technical Procurement/ Development
Transparent Evaluation of Opening Bids
“An owner using a competitive design-build procurement process should ensure that the process is fair, open and transparent, using clear evaluation and selection processes” (Loulakis & Hoag, 2013, p.4). Also a suggestion mentioned on page 64 by Minchin et al. in report 787, "The selection committee should be blinded for the technical evaluation: “Proposer A,” “Proposer B,” etc."
Arizona For ADOT, during their evaluation of the contractor SOQ's, they require each panel member who will evaluate the SOQ’s to inform the agency if they have any conflict of interest with any of the contractors in question and if so they are removed from the evaluation panel. Also referring to this evaluation panel, all members evaluate the initial scores of contractors individually, they are eliminated if they do not provide comments about why they chose their scores and are eliminated if their score exceeds 1.65times the standard deviation of the recompiled scores (ADOT Intermodal Transportation Division, 2014, p 23).
Loulakis,& Hoag,(2013), Minchin, et. al. (2014)
Both Model Practice
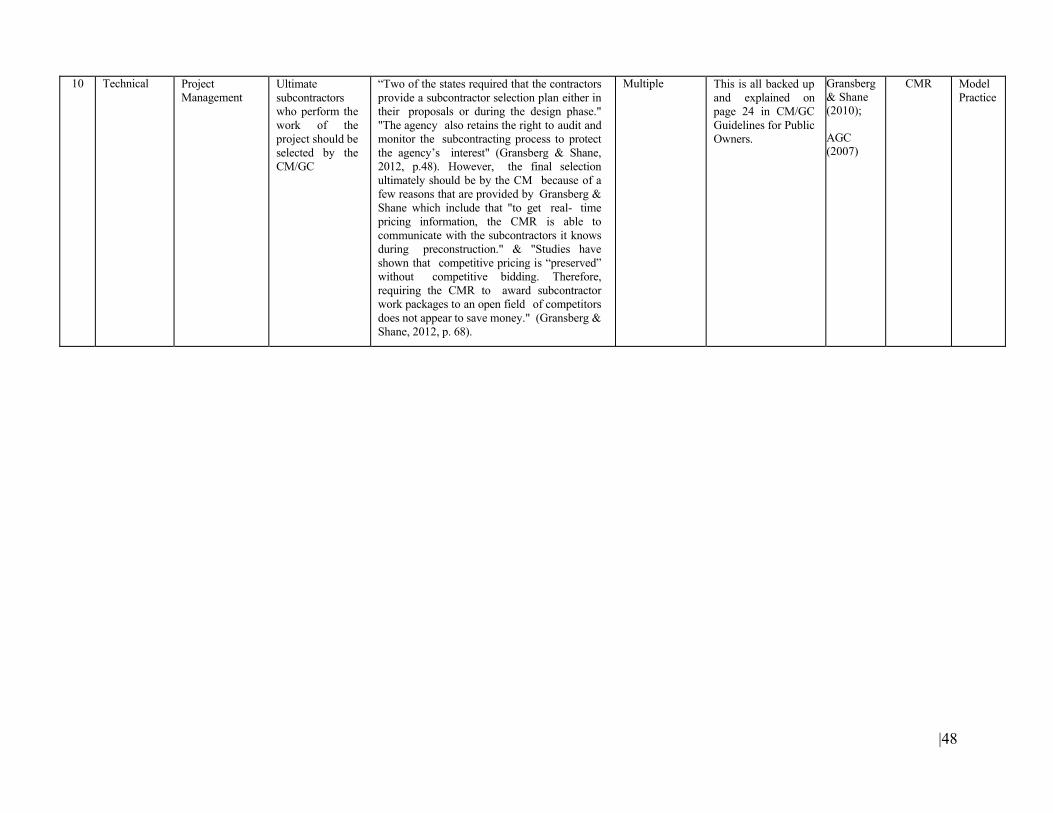
|48
10 Technical Project Management
Ultimate subcontractors who perform the work of the project should be selected by the CM/GC
“Two of the states required that the contractors provide a subcontractor selection plan either in their proposals or during the design phase." "The agency also retains the right to audit and monitor the subcontracting process to protect the agency’s interest" (Gransberg & Shane, 2012, p.48). However, the final selection ultimately should be by the CM because of a few reasons that are provided by Gransberg & Shane which include that "to get real- time pricing information, the CMR is able to communicate with the subcontractors it knows during preconstruction." & "Studies have shown that competitive pricing is “preserved” without competitive bidding. Therefore, requiring the CMR to award subcontractor work packages to an open field of competitors does not appear to save money." (Gransberg & Shane, 2012, p. 68).
Multiple This is all backed up and explained on page 24 in CM/GC Guidelines for Public Owners.
Gransberg& Shane (2010); AGC (2007)
CMR Model Practice
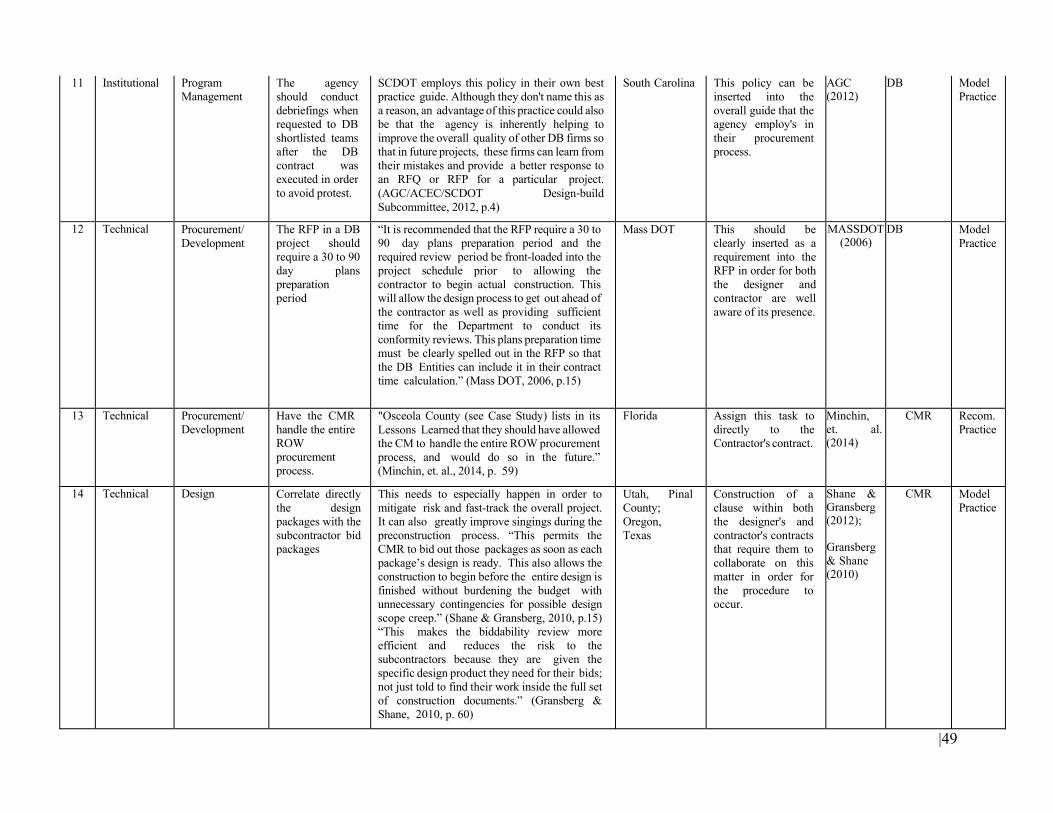
|49
11 Institutional Program Management
The agency should conduct debriefings when requested to DB shortlisted teams after the DB contract was executed in order to avoid protest.
SCDOT employs this policy in their own best practice guide. Although they don't name this as a reason, an advantage of this practice could also be that the agency is inherently helping to improve the overall quality of other DB firms so that in future projects, these firms can learn from their mistakes and provide a better response to an RFQ or RFP for a particular project. (AGC/ACEC/SCDOT Design‐build Subcommittee, 2012, p.4)
South Carolina This policy can be inserted into the overall guide that the agency employ's in their procurement process.
AGC (2012)
DB Model Practice
12 Technical Procurement/ Development
The RFP in a DB project should require a 30 to 90 day plans preparation period
“It is recommended that the RFP require a 30 to 90 day plans preparation period and the required review period be front-loaded into the project schedule prior to allowing the contractor to begin actual construction. This will allow the design process to get out ahead of the contractor as well as providing sufficient time for the Department to conduct its conformity reviews. This plans preparation time must be clearly spelled out in the RFP so that the DB Entities can include it in their contract time calculation.” (Mass DOT, 2006, p.15)
Mass DOT This should be clearly inserted as a requirement into the RFP in order for both the designer and contractor are well aware of its presence.
MASSDOT(2006)
DB Model Practice
13 Technical Procurement/ Development
Have the CMR handle the entire ROW procurement process.
"Osceola County (see Case Study) lists in its Lessons Learned that they should have allowed the CM to handle the entire ROW procurement process, and would do so in the future.” (Minchin, et. al., 2014, p. 59)
Florida Assign this task to directly to the Contractor's contract.
Minchin, et. al. (2014)
CMR Recom. Practice
14 Technical Design Correlate directly the design packages with the subcontractor bid packages
This needs to especially happen in order to mitigate risk and fast-track the overall project. It can also greatly improve singings during the preconstruction process. “This permits the CMR to bid out those packages as soon as each package’s design is ready. This also allows the construction to begin before the entire design is finished without burdening the budget with unnecessary contingencies for possible design scope creep.” (Shane & Gransberg, 2010, p.15) “This makes the biddability review more efficient and reduces the risk to the subcontractors because they are given the specific design product they need for their bids; not just told to find their work inside the full set of construction documents.” (Gransberg & Shane, 2010, p. 60)
Utah, Pinal County; Oregon, Texas
Construction of a clause within both the designer's and contractor's contracts that require them to collaborate on this matter in order for the procedure to occur.
Shane &Gransberg (2012); Gransberg & Shane (2010)
CMR Model Practice
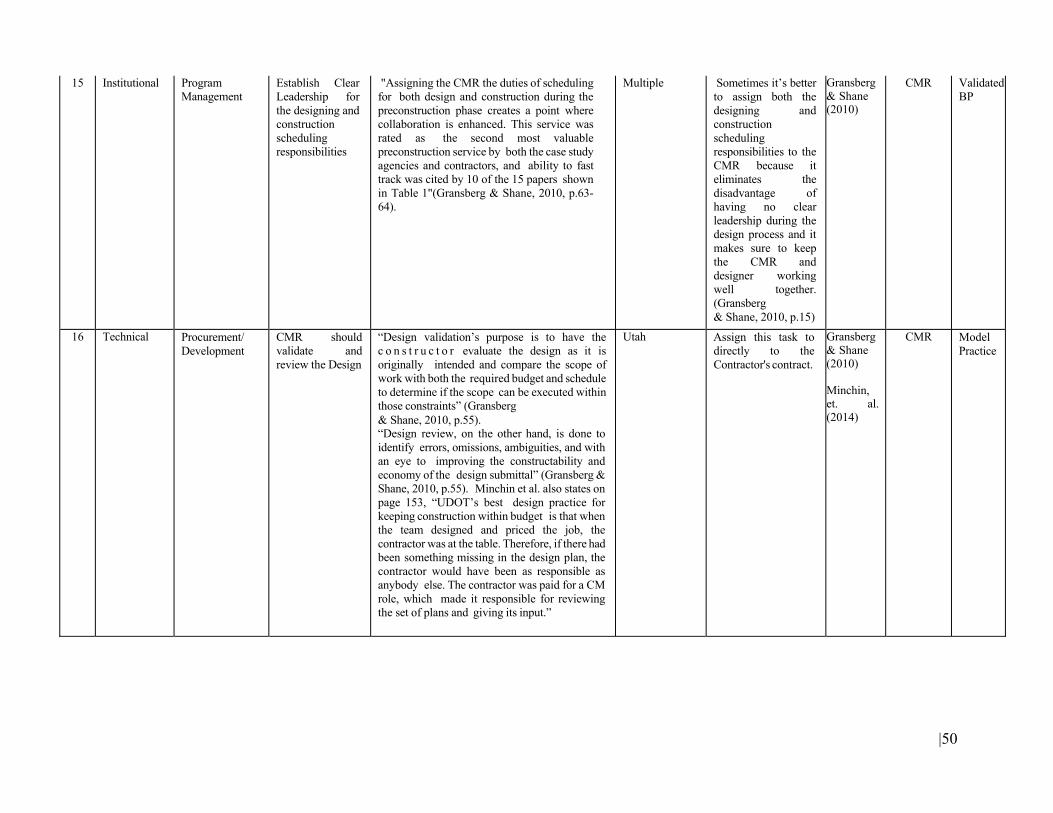
|50
15 Institutional Program Management
Establish Clear Leadership for the designing and construction scheduling responsibilities
"Assigning the CMR the duties of scheduling for both design and construction during the preconstruction phase creates a point where collaboration is enhanced. This service was rated as the second most valuable preconstruction service by both the case study agencies and contractors, and ability to fast track was cited by 10 of the 15 papers shown in Table 1"(Gransberg & Shane, 2010, p.63- 64).
Multiple Sometimes it’s better to assign both the designing and construction scheduling responsibilities to the CMR because it eliminates the disadvantage of having no clear leadership during the design process and it makes sure to keep the CMR and designer working well together. (Gransberg & Shane, 2010, p.15)
Gransberg& Shane (2010)
CMR Validated BP
16 Technical Procurement/ Development
CMR should validate and review the Design
“Design validation’s purpose is to have the c o n s t r u c t o r evaluate the design as it is originally intended and compare the scope of work with both the required budget and schedule to determine if the scope can be executed within those constraints” (Gransberg & Shane, 2010, p.55). “Design review, on the other hand, is done to identify errors, omissions, ambiguities, and with an eye to improving the constructability and economy of the design submittal” (Gransberg & Shane, 2010, p.55). Minchin et al. also states on page 153, “UDOT’s best design practice for keeping construction within budget is that when the team designed and priced the job, the contractor was at the table. Therefore, if there had been something missing in the design plan, the contractor would have been as responsible as anybody else. The contractor was paid for a CM role, which made it responsible for reviewing the set of plans and giving its input.”
Utah Assign this task to directly to the Contractor's contract.
Gransberg& Shane (2010) Minchin, et. al. (2014)
CMR Model Practice
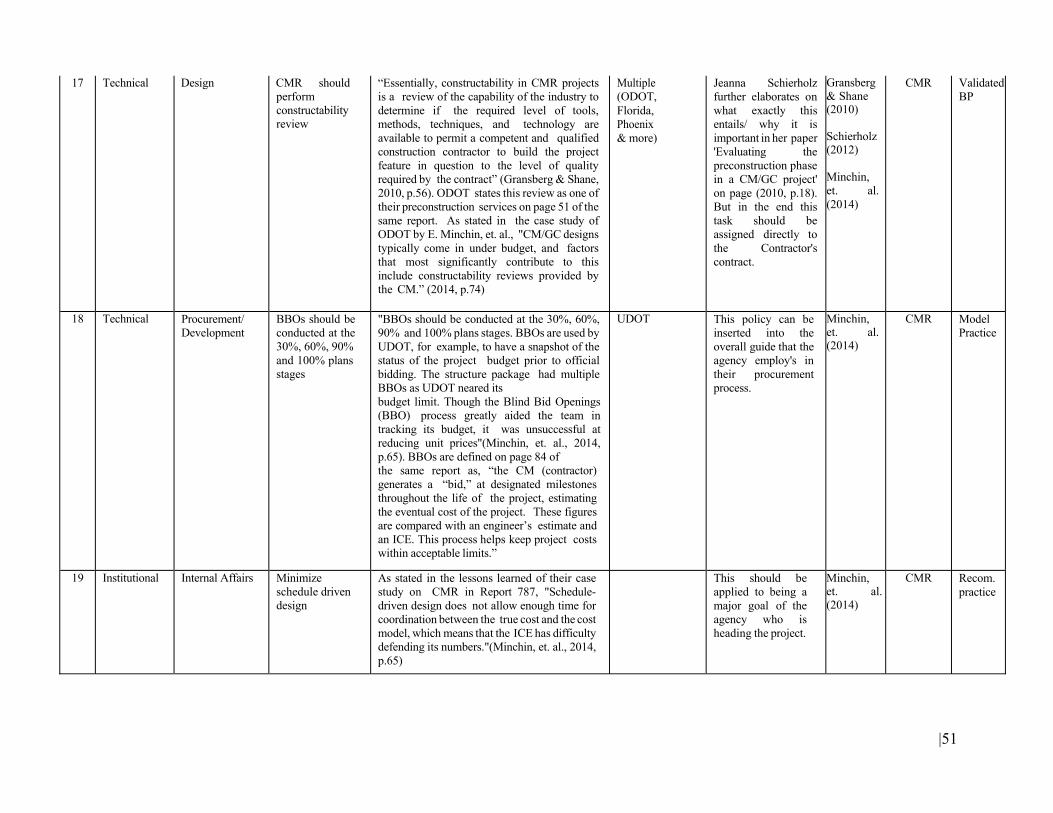
|51
17 Technical Design CMR should perform constructability review
“Essentially, constructability in CMR projects is a review of the capability of the industry to determine if the required level of tools, methods, techniques, and technology are available to permit a competent and qualified construction contractor to build the project feature in question to the level of quality required by the contract” (Gransberg & Shane, 2010, p.56). ODOT states this review as one of their preconstruction services on page 51 of the same report. As stated in the case study of ODOT by E. Minchin, et. al., "CM/GC designs typically come in under budget, and factors that most significantly contribute to this include constructability reviews provided by the CM.” (2014, p.74)
Multiple (ODOT, Florida, Phoenix & more)
Jeanna Schierholz further elaborates on what exactly this entails/ why it is important in her paper 'Evaluating the preconstruction phase in a CM/GC project' on page (2010, p.18). But in the end this task should be assigned directly to the Contractor's contract.
Gransberg& Shane (2010) Schierholz (2012) Minchin, et. al. (2014)
CMR Validated BP
18 Technical Procurement/ Development
BBOs should be conducted at the 30%, 60%, 90% and 100% plans stages
"BBOs should be conducted at the 30%, 60%, 90% and 100% plans stages. BBOs are used by UDOT, for example, to have a snapshot of the status of the project budget prior to official bidding. The structure package had multiple BBOs as UDOT neared its budget limit. Though the Blind Bid Openings (BBO) process greatly aided the team in tracking its budget, it was unsuccessful at reducing unit prices"(Minchin, et. al., 2014, p.65). BBOs are defined on page 84 of the same report as, “the CM (contractor) generates a “bid,” at designated milestones throughout the life of the project, estimating the eventual cost of the project. These figures are compared with an engineer’s estimate and an ICE. This process helps keep project costs within acceptable limits.”
UDOT This policy can be inserted into the overall guide that the agency employ's in their procurement process.
Minchin,et. al. (2014)
CMR Model Practice
19 Institutional Internal Affairs Minimize schedule driven design
As stated in the lessons learned of their case study on CMR in Report 787, "Schedule-driven design does not allow enough time for coordination between the true cost and the cost model, which means that the ICE has difficulty defending its numbers."(Minchin, et. al., 2014, p.65)
This should be applied to being a major goal of the agency who is heading the project.
Minchin, et. al. (2014)
CMR Recom. practice
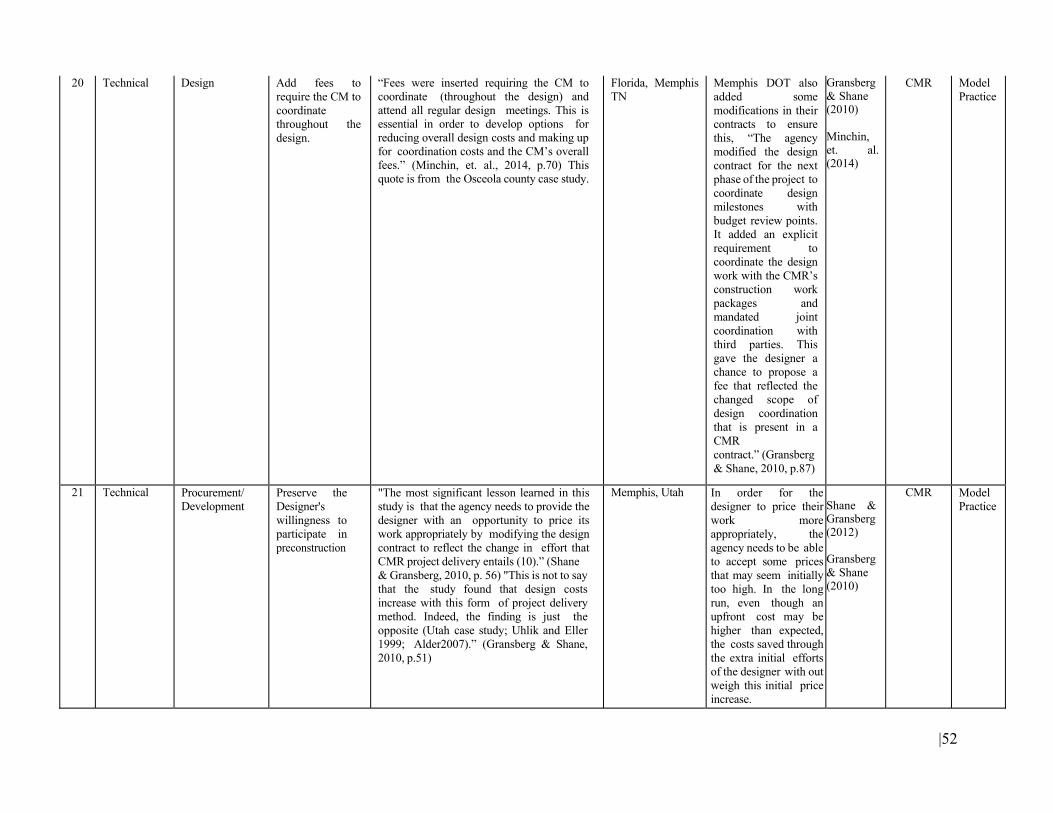
|52
20 Technical Design Add fees to require the CM to coordinate throughout the design.
“Fees were inserted requiring the CM to coordinate (throughout the design) and attend all regular design meetings. This is essential in order to develop options for reducing overall design costs and making up for coordination costs and the CM’s overall fees.” (Minchin, et. al., 2014, p.70) This quote is from the Osceola county case study.
Florida, Memphis TN
Memphis DOT also added some modifications in their contracts to ensure this, “The agency modified the design contract for the next phase of the project to coordinate design milestones with budget review points. It added an explicit requirement to coordinate the design work with the CMR’s construction work packages and mandated joint coordination with third parties. This gave the designer a chance to propose a fee that reflected the changed scope of design coordination that is present in a CMR contract.” (Gransberg & Shane, 2010, p.87)
Gransberg& Shane (2010) Minchin, et. al. (2014)
CMR Model Practice
21 Technical Procurement/ Development
Preserve the Designer's willingness to participate in preconstruction
"The most significant lesson learned in this study is that the agency needs to provide the designer with an opportunity to price its work appropriately by modifying the design contract to reflect the change in effort that CMR project delivery entails (10).” (Shane & Gransberg, 2010, p. 56) "This is not to say that the study found that design costs increase with this form of project delivery method. Indeed, the finding is just the opposite (Utah case study; Uhlik and Eller 1999; Alder2007).” (Gransberg & Shane, 2010, p.51)
Memphis, Utah In order for thedesigner to price theirwork moreappropriately, theagency needs to be ableto accept some pricesthat may seem initiallytoo high. In the longrun, even though anupfront cost may behigher than expected,the costs saved throughthe extra initial effortsof the designer with out weigh this initial priceincrease.
Shane & Gransberg (2012) Gransberg & Shane (2010)
CMR Model Practice
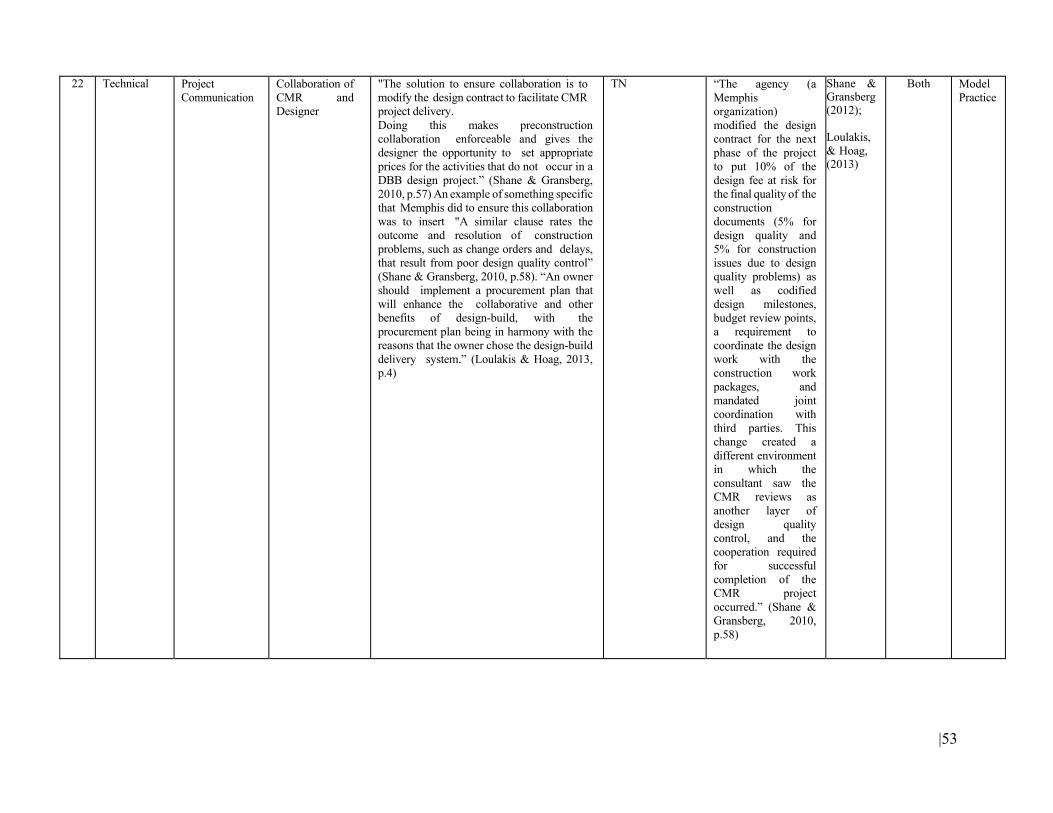
|53
22 Technical Project Communication
Collaboration of CMR and Designer
"The solution to ensure collaboration is to modify the design contract to facilitate CMR project delivery. Doing this makes preconstruction collaboration enforceable and gives the designer the opportunity to set appropriate prices for the activities that do not occur in a DBB design project.” (Shane & Gransberg, 2010, p.57) An example of something specific that Memphis did to ensure this collaboration was to insert "A similar clause rates the outcome and resolution of construction problems, such as change orders and delays, that result from poor design quality control” (Shane & Gransberg, 2010, p.58). “An owner should implement a procurement plan that will enhance the collaborative and other benefits of design-build, with the procurement plan being in harmony with the reasons that the owner chose the design-build delivery system.” (Loulakis & Hoag, 2013, p.4)
TN “The agency (a Memphis organization) modified the design contract for the next phase of the project to put 10% of the design fee at risk for the final quality of the construction documents (5% for design quality and 5% for construction issues due to design quality problems) as well as codified design milestones, budget review points, a requirement to coordinate the design work with the construction work packages, and mandated joint coordination with third parties. This change created a different environment in which the consultant saw the CMR reviews as another layer of design quality control, and the cooperation required for successful completion of the CMR project occurred.” (Shane & Gransberg, 2010, p.58)
Shane &Gransberg (2012); Loulakis, & Hoag, (2013)
Both Model Practice
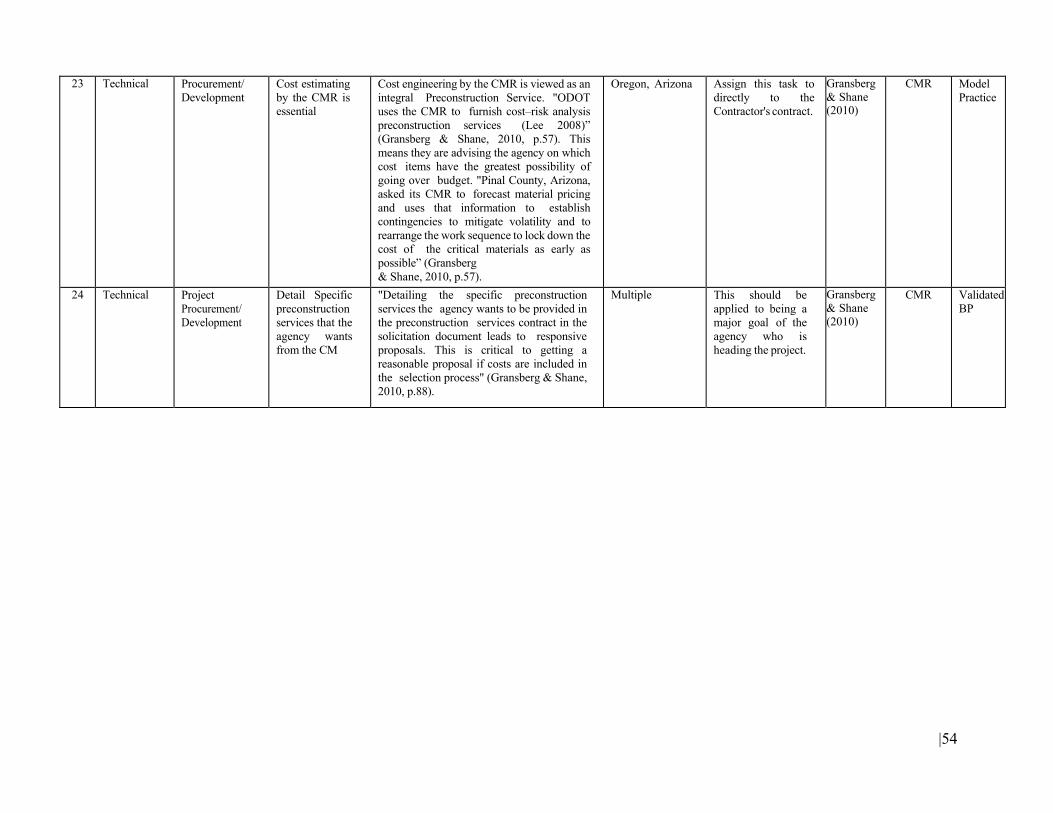
|54
23 Technical Procurement/ Development
Cost estimating by the CMR is essential
Cost engineering by the CMR is viewed as an integral Preconstruction Service. "ODOT uses the CMR to furnish cost–risk analysis preconstruction services (Lee 2008)” (Gransberg & Shane, 2010, p.57). This means they are advising the agency on which cost items have the greatest possibility of going over budget. "Pinal County, Arizona, asked its CMR to forecast material pricing and uses that information to establish contingencies to mitigate volatility and to rearrange the work sequence to lock down the cost of the critical materials as early as possible” (Gransberg & Shane, 2010, p.57).
Oregon, Arizona Assign this task to directly to the Contractor's contract.
Gransberg& Shane (2010)
CMR Model Practice
24 Technical Project Procurement/ Development
Detail Specific preconstruction services that the agency wants from the CM
"Detailing the specific preconstruction services the agency wants to be provided in the preconstruction services contract in the solicitation document leads to responsive proposals. This is critical to getting a reasonable proposal if costs are included in the selection process" (Gransberg & Shane, 2010, p.88).
Multiple This should be applied to being a major goal of the agency who is heading the project.
Gransberg& Shane (2010)
CMR Validated BP
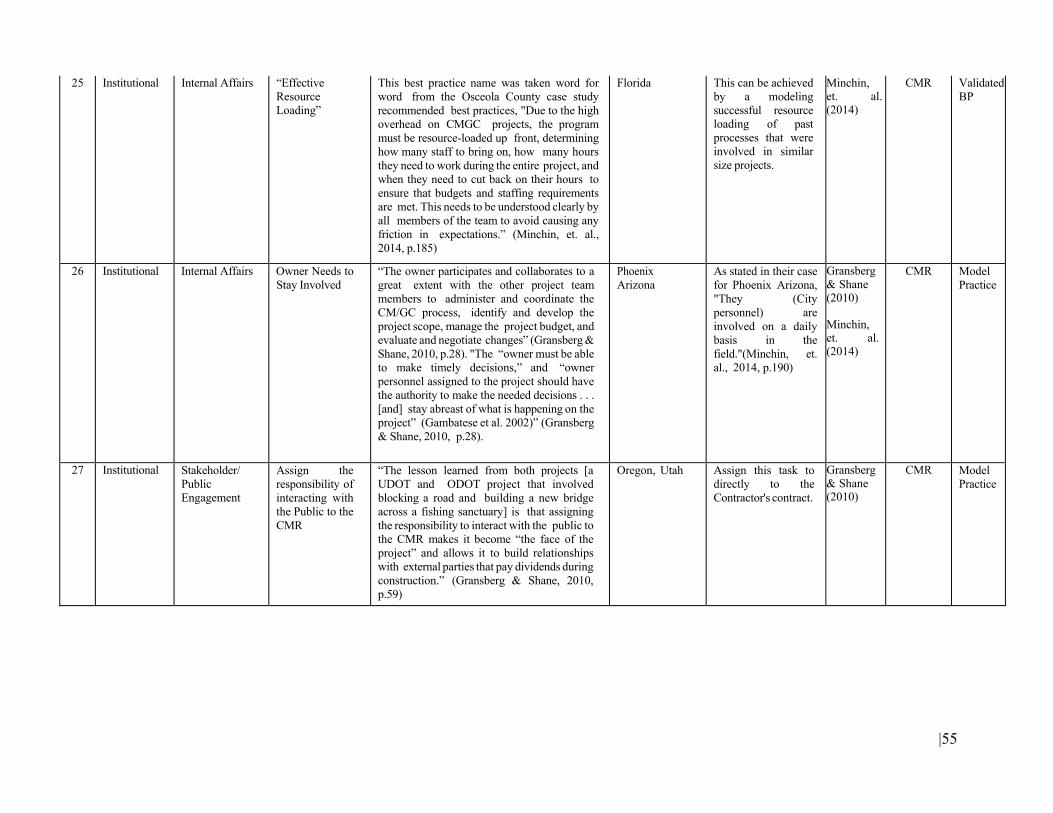
|55
25 Institutional Internal Affairs “Effective Resource Loading”
This best practice name was taken word for word from the Osceola County case study recommended best practices, "Due to the high overhead on CMGC projects, the program must be resource-loaded up front, determining how many staff to bring on, how many hours they need to work during the entire project, and when they need to cut back on their hours to ensure that budgets and staffing requirements are met. This needs to be understood clearly by all members of the team to avoid causing any friction in expectations.” (Minchin, et. al., 2014, p.185)
Florida This can be achieved by a modeling successful resource loading of past processes that were involved in similar size projects.
Minchin, et. al. (2014)
CMR Validated BP
26 Institutional Internal Affairs Owner Needs to Stay Involved
“The owner participates and collaborates to a great extent with the other project team members to administer and coordinate the CM/GC process, identify and develop the project scope, manage the project budget, and evaluate and negotiate changes” (Gransberg & Shane, 2010, p.28). "The “owner must be able to make timely decisions,” and “owner personnel assigned to the project should have the authority to make the needed decisions . . . [and] stay abreast of what is happening on the project” (Gambatese et al. 2002)” (Gransberg & Shane, 2010, p.28).
Phoenix Arizona
As stated in their case for Phoenix Arizona, "They (City personnel) are involved on a daily basis in the field."(Minchin, et. al., 2014, p.190)
Gransberg& Shane (2010) Minchin, et. al. (2014)
CMR Model Practice
27 Institutional Stakeholder/ Public Engagement
Assign the responsibility of interacting with the Public to the CMR
“The lesson learned from both projects [a UDOT and ODOT project that involved blocking a road and building a new bridge across a fishing sanctuary] is that assigning the responsibility to interact with the public to the CMR makes it become “the face of the project” and allows it to build relationships with external parties that pay dividends during construction.” (Gransberg & Shane, 2010, p.59)
Oregon, Utah Assign this task to directly to the Contractor's contract.
Gransberg& Shane (2010)
CMR Model Practice
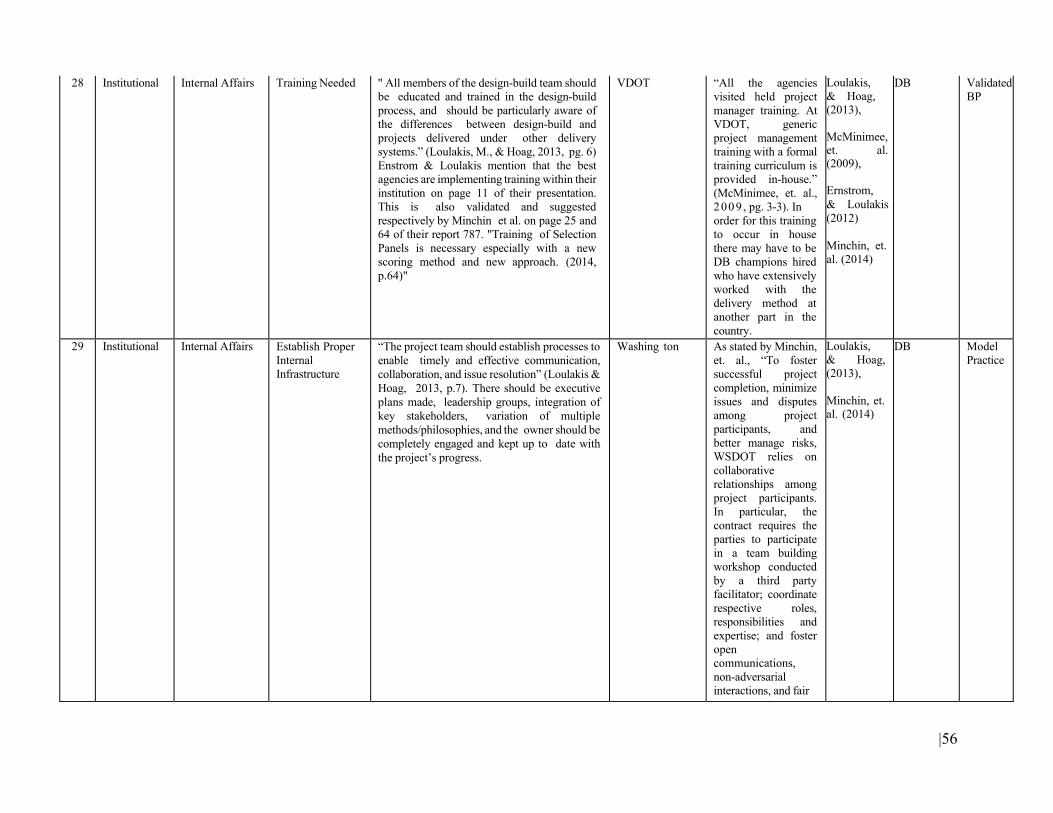
|56
28 Institutional Internal Affairs Training Needed " All members of the design-build team should be educated and trained in the design-build process, and should be particularly aware of the differences between design-build and projects delivered under other delivery systems.” (Loulakis, M., & Hoag, 2013, pg. 6) Enstrom & Loulakis mention that the best agencies are implementing training within their institution on page 11 of their presentation. This is also validated and suggested respectively by Minchin et al. on page 25 and 64 of their report 787. "Training of Selection Panels is necessary especially with a new scoring method and new approach. (2014, p.64)"
VDOT “All the agencies visited held project manager training. At VDOT, generic project management training with a formal training curriculum is provided in-house.” (McMinimee, et. al., 2009 , pg. 3-3). In order for this training to occur in house there may have to be DB champions hired who have extensively worked with the delivery method at another part in the country.
Loulakis,& Hoag, (2013), McMinimee, et. al. (2009), Ernstrom, & Loulakis(2012) Minchin, et. al. (2014)
DB Validated BP
29 Institutional Internal Affairs Establish Proper Internal Infrastructure
“The project team should establish processes to enable timely and effective communication, collaboration, and issue resolution” (Loulakis & Hoag, 2013, p.7). There should be executive plans made, leadership groups, integration of key stakeholders, variation of multiple methods/philosophies, and the owner should be completely engaged and kept up to date with the project’s progress.
Washing ton As stated by Minchin, et. al., “To foster successful project completion, minimize issues and disputes among project participants, and better manage risks, WSDOT relies on collaborative relationships among project participants. In particular, the contract requires the parties to participate in a team building workshop conducted by a third party facilitator; coordinate respective roles, responsibilities and expertise; and foster open communications, non-adversarial interactions, and fair
Loulakis,& Hoag, (2013), Minchin, et. al. (2014)
DB Model Practice
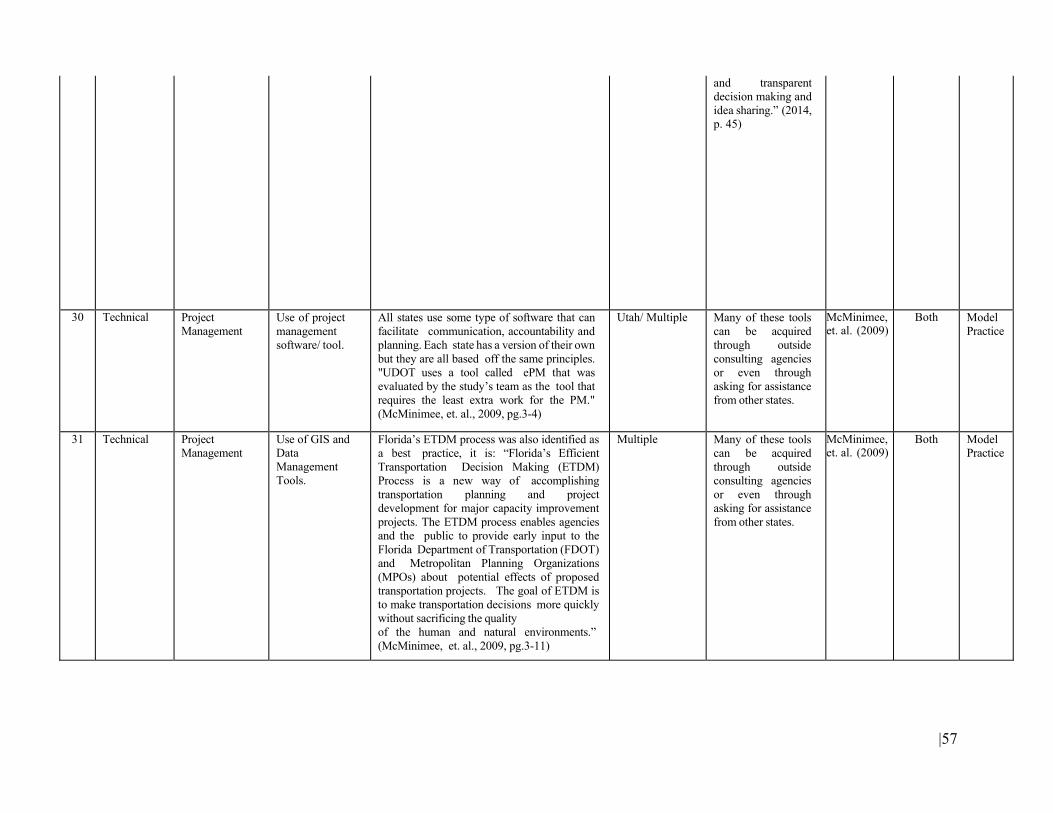
|57
and transparent decision making and idea sharing.” (2014, p. 45)
30 Technical Project Management
Use of project management software/ tool.
All states use some type of software that can facilitate communication, accountability and planning. Each state has a version of their own but they are all based off the same principles. "UDOT uses a tool called ePM that was evaluated by the study’s team as the tool that requires the least extra work for the PM." (McMinimee, et. al., 2009, pg.3-4)
Utah/ Multiple Many of these tools can be acquired through outside consulting agencies or even through asking for assistance from other states.
McMinimee,et. al. (2009)
Both Model Practice
31 Technical Project Management
Use of GIS and Data Management Tools.
Florida’s ETDM process was also identified as a best practice, it is: “Florida’s Efficient Transportation Decision Making (ETDM) Process is a new way of accomplishing transportation planning and project development for major capacity improvement projects. The ETDM process enables agencies and the public to provide early input to the Florida Department of Transportation (FDOT) and Metropolitan Planning Organizations (MPOs) about potential effects of proposed transportation projects. The goal of ETDM is to make transportation decisions more quickly without sacrificing the quality of the human and natural environments.” (McMinimee, et. al., 2009, pg.3-11)
Multiple Many of these tools can be acquired through outside consulting agencies or even through asking for assistance from other states.
McMinimee,et. al. (2009)
Both Model Practice
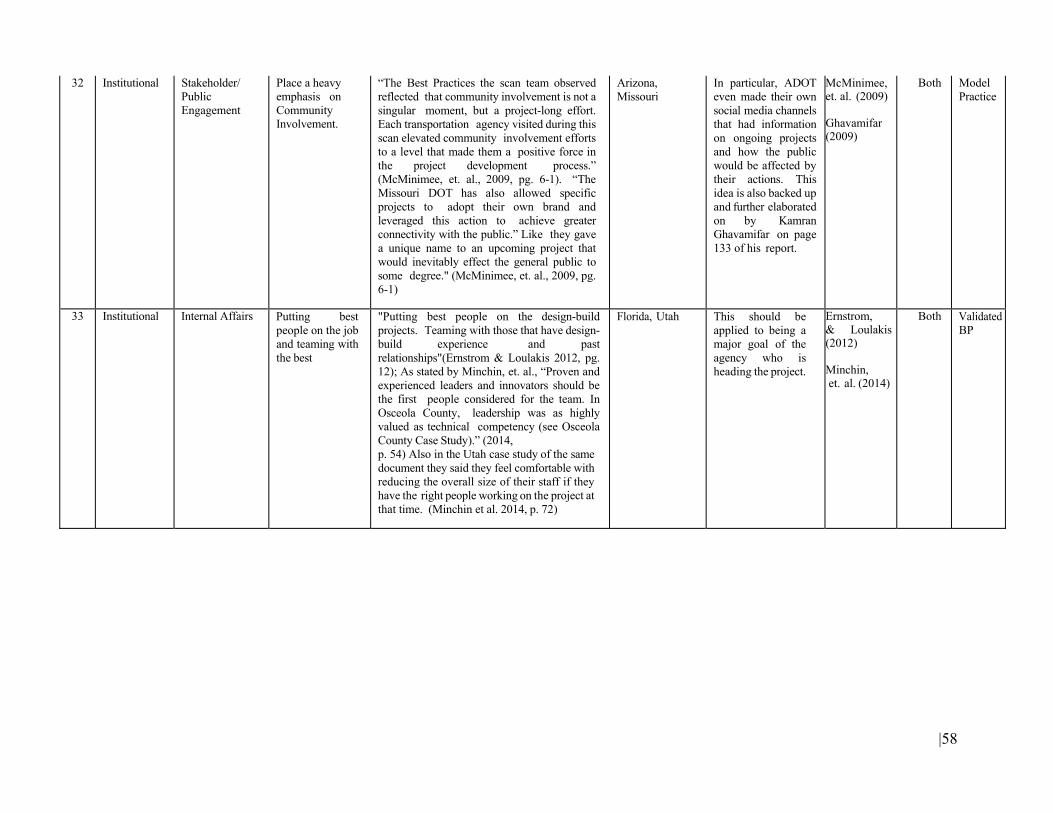
|58
32 Institutional Stakeholder/ Public Engagement
Place a heavy emphasis on Community Involvement.
“The Best Practices the scan team observed reflected that community involvement is not a singular moment, but a project-long effort. Each transportation agency visited during this scan elevated community involvement efforts to a level that made them a positive force in the project development process.” (McMinimee, et. al., 2009, pg. 6-1). “The Missouri DOT has also allowed specific projects to adopt their own brand and leveraged this action to achieve greater connectivity with the public.” Like they gave a unique name to an upcoming project that would inevitably effect the general public to some degree." (McMinimee, et. al., 2009, pg. 6-1)
Arizona, Missouri
In particular, ADOT even made their own social media channels that had information on ongoing projects and how the public would be affected by their actions. This idea is also backed up and further elaborated on by Kamran Ghavamifar on page 133 of his report.
McMinimee, et. al. (2009) Ghavamifar (2009)
Both Model Practice
33 Institutional Internal Affairs Putting best people on the job and teaming with the best
"Putting best people on the design-build projects. Teaming with those that have design-build experience and past relationships"(Ernstrom & Loulakis 2012, pg. 12); As stated by Minchin, et. al., “Proven and experienced leaders and innovators should be the first people considered for the team. In Osceola County, leadership was as highly valued as technical competency (see Osceola County Case Study).” (2014, p. 54) Also in the Utah case study of the same document they said they feel comfortable with reducing the overall size of their staff if they have the right people working on the project at that time. (Minchin et al. 2014, p. 72)
Florida, Utah This should be applied to being a major goal of the agency who is heading the project.
Ernstrom,& Loulakis(2012) Minchin, et. al. (2014)
Both Validated BP
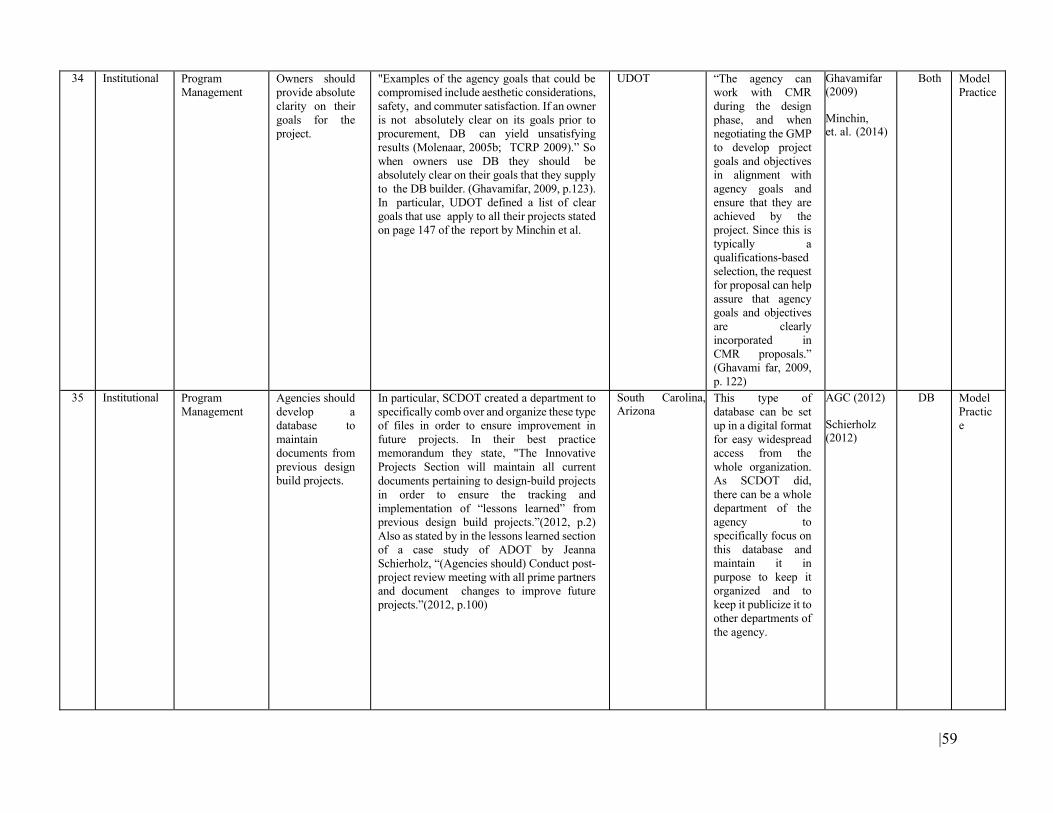
|59
34 Institutional Program Management
Owners should provide absolute clarity on their goals for the project.
"Examples of the agency goals that could be compromised include aesthetic considerations, safety, and commuter satisfaction. If an owner is not absolutely clear on its goals prior to procurement, DB can yield unsatisfying results (Molenaar, 2005b; TCRP 2009).” So when owners use DB they should be absolutely clear on their goals that they supply to the DB builder. (Ghavamifar, 2009, p.123). In particular, UDOT defined a list of clear goals that use apply to all their projects stated on page 147 of the report by Minchin et al.
UDOT “The agency can work with CMR during the design phase, and when negotiating the GMP to develop project goals and objectives in alignment with agency goals and ensure that they are achieved by the project. Since this is typically a qualifications-based selection, the request for proposal can help assure that agency goals and objectives are clearly incorporated in CMR proposals.” (Ghavami far, 2009, p. 122)
Ghavamifar(2009) Minchin, et. al. (2014)
Both Model Practice
35 Institutional Program Management
Agencies should develop a database to maintain documents from previous design build projects.
In particular, SCDOT created a department to specifically comb over and organize these type of files in order to ensure improvement in future projects. In their best practice memorandum they state, "The Innovative Projects Section will maintain all current documents pertaining to design‐build projects in order to ensure the tracking and implementation of “lessons learned” from previous design build projects.”(2012, p.2) Also as stated by in the lessons learned section of a case study of ADOT by Jeanna Schierholz, “(Agencies should) Conduct post-project review meeting with all prime partners and document changes to improve future projects.”(2012, p.100)
South Carolina, Arizona
This type of database can be set up in a digital format for easy widespread access from the whole organization. As SCDOT did, there can be a whole department of the agency to specifically focus on this database and maintain it in purpose to keep it organized and to keep it publicize it to other departments of the agency.
AGC (2012) Schierholz (2012)
DB Model Practice
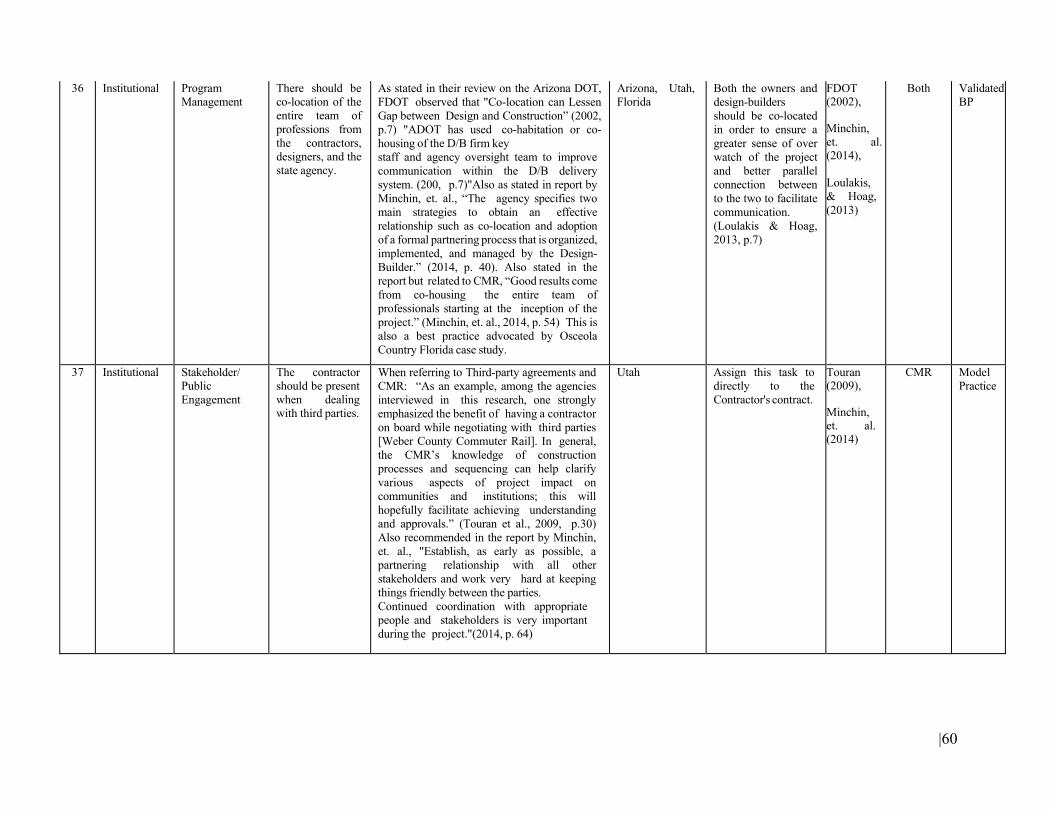
|60
36 Institutional Program Management
There should be co-location of the entire team of professions from the contractors, designers, and the state agency.
As stated in their review on the Arizona DOT, FDOT observed that "Co-location can Lessen Gap between Design and Construction” (2002, p.7) "ADOT has used co-habitation or co-housing of the D/B firm key staff and agency oversight team to improve communication within the D/B delivery system. (200, p.7)"Also as stated in report by Minchin, et. al., “The agency specifies two main strategies to obtain an effective relationship such as co-location and adoption of a formal partnering process that is organized, implemented, and managed by the Design- Builder.” (2014, p. 40). Also stated in the report but related to CMR, “Good results come from co-housing the entire team of professionals starting at the inception of the project.” (Minchin, et. al., 2014, p. 54) This is also a best practice advocated by Osceola Country Florida case study.
Arizona, Utah, Florida
Both the owners and design-builders should be co-located in order to ensure a greater sense of over watch of the project and better parallel connection between to the two to facilitate communication. (Loulakis & Hoag, 2013, p.7)
FDOT (2002), Minchin, et. al. (2014),
Loulakis, & Hoag, (2013)
Both Validated BP
37 Institutional Stakeholder/ Public Engagement
The contractor should be present when dealing with third parties.
When referring to Third-party agreements and CMR: “As an example, among the agencies interviewed in this research, one strongly emphasized the benefit of having a contractor on board while negotiating with third parties [Weber County Commuter Rail]. In general, the CMR’s knowledge of construction processes and sequencing can help clarify various aspects of project impact on communities and institutions; this will hopefully facilitate achieving understanding and approvals.” (Touran et al., 2009, p.30) Also recommended in the report by Minchin, et. al., "Establish, as early as possible, a partnering relationship with all other stakeholders and work very hard at keeping things friendly between the parties. Continued coordination with appropriate people and stakeholders is very important during the project."(2014, p. 64)
Utah Assign this task to directly to the Contractor's contract.
Touran (2009), Minchin, et. al. (2014)
CMR Model Practice
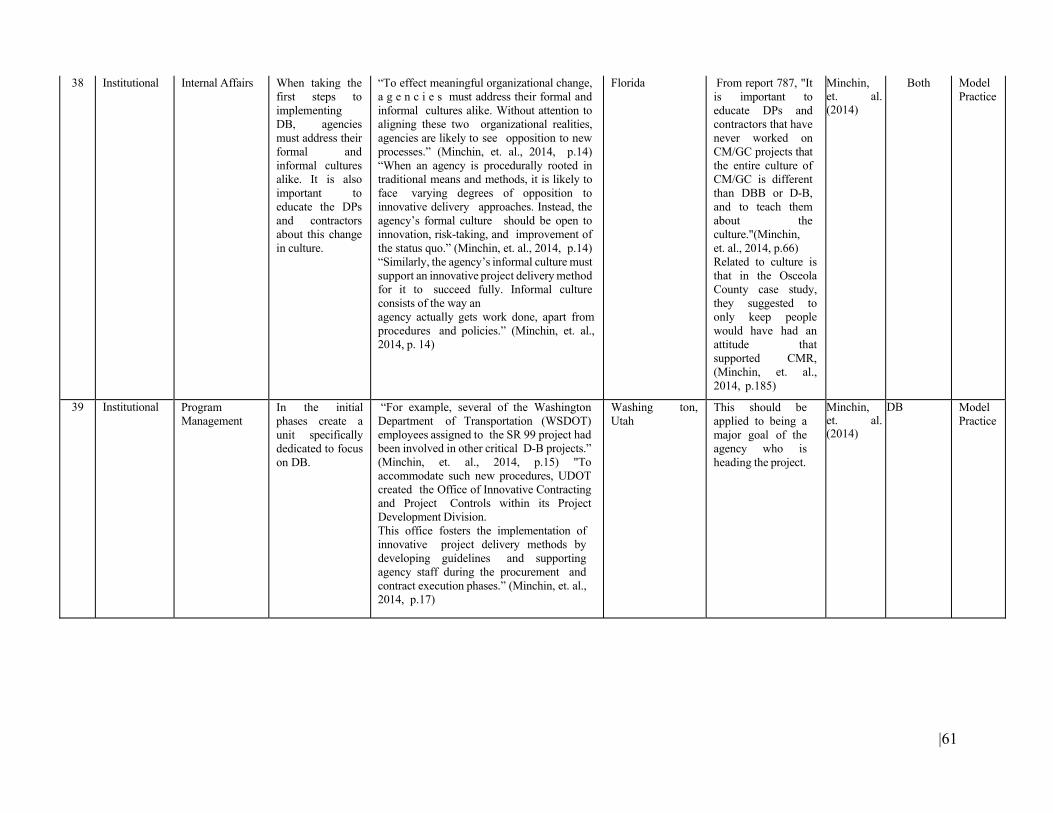
|61
38 Institutional Internal Affairs When taking the first steps to implementing DB, agencies must address their formal and informal cultures alike. It is also important to educate the DPs and contractors about this change in culture.
“To effect meaningful organizational change, a g e n c i e s must address their formal and informal cultures alike. Without attention to aligning these two organizational realities, agencies are likely to see opposition to new processes.” (Minchin, et. al., 2014, p.14) “When an agency is procedurally rooted in traditional means and methods, it is likely to face varying degrees of opposition to innovative delivery approaches. Instead, the agency’s formal culture should be open to innovation, risk-taking, and improvement of the status quo.” (Minchin, et. al., 2014, p.14) “Similarly, the agency’s informal culture must support an innovative project delivery method for it to succeed fully. Informal culture consists of the way an agency actually gets work done, apart from procedures and policies.” (Minchin, et. al., 2014, p. 14)
Florida From report 787, "It is important to educate DPs and contractors that have never worked on CM/GC projects that the entire culture of CM/GC is different than DBB or D-B, and to teach them about the culture."(Minchin, et. al., 2014, p.66) Related to culture is that in the Osceola County case study, they suggested to only keep people would have had an attitude that supported CMR, (Minchin, et. al., 2014, p.185)
Minchin, et. al. (2014)
Both Model Practice
39 Institutional Program Management
In the initial phases create a unit specifically dedicated to focus on DB.
“For example, several of the Washington Department of Transportation (WSDOT) employees assigned to the SR 99 project had been involved in other critical D-B projects.” (Minchin, et. al., 2014, p.15) "To accommodate such new procedures, UDOT created the Office of Innovative Contracting and Project Controls within its Project Development Division. This office fosters the implementation of innovative project delivery methods by developing guidelines and supporting agency staff during the procurement and contract execution phases.” (Minchin, et. al., 2014, p.17)
Washing ton, Utah
This should be applied to being a major goal of the agency who is heading the project.
Minchin,et. al. (2014)
DB Model Practice
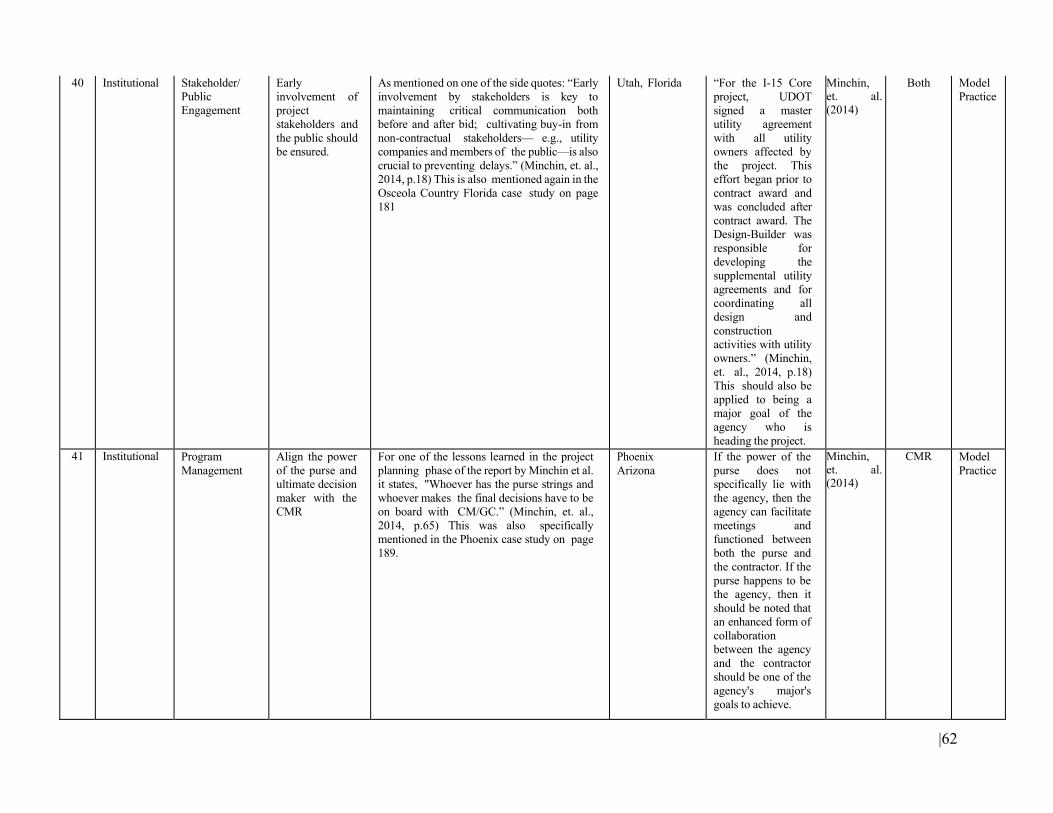
|62
40 Institutional Stakeholder/ Public Engagement
Early involvement of project stakeholders and the public should be ensured.
As mentioned on one of the side quotes: “Early involvement by stakeholders is key to maintaining critical communication both before and after bid; cultivating buy-in from non-contractual stakeholders— e.g., utility companies and members of the public—is also crucial to preventing delays.” (Minchin, et. al., 2014, p.18) This is also mentioned again in the Osceola Country Florida case study on page 181
Utah, Florida “For the I-15 Core project, UDOT signed a master utility agreement with all utility owners affected by the project. This effort began prior to contract award and was concluded after contract award. The Design-Builder was responsible for developing the supplemental utility agreements and for coordinating all design and construction activities with utility owners.” (Minchin, et. al., 2014, p.18) This should also be applied to being a major goal of the agency who is heading the project.
Minchin, et. al. (2014)
Both Model Practice
41 Institutional Program Management
Align the power of the purse and ultimate decision maker with the CMR
For one of the lessons learned in the project planning phase of the report by Minchin et al. it states, "Whoever has the purse strings and whoever makes the final decisions have to be on board with CM/GC.” (Minchin, et. al., 2014, p.65) This was also specifically mentioned in the Phoenix case study on page 189.
Phoenix Arizona
If the power of the purse does not specifically lie with the agency, then the agency can facilitate meetings and functioned between both the purse and the contractor. If the purse happens to be the agency, then it should be noted that an enhanced form of collaboration between the agency and the contractor should be one of the agency's major's goals to achieve.
Minchin,et. al. (2014)
CMR Model Practice
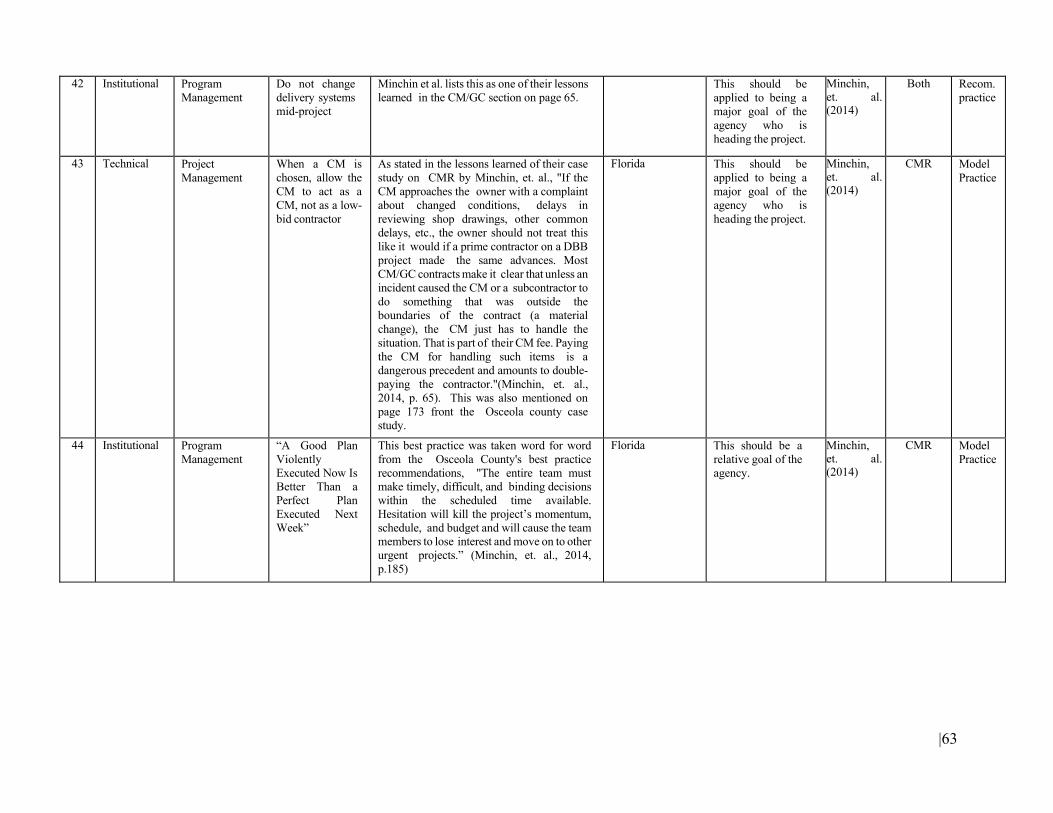
|63
42 Institutional Program Management
Do not change delivery systems mid-project
Minchin et al. lists this as one of their lessons learned in the CM/GC section on page 65.
This should be applied to being a major goal of the agency who is heading the project.
Minchin,et. al. (2014)
Both Recom. practice
43 Technical Project Management
When a CM is chosen, allow the CM to act as a CM, not as a low- bid contractor
As stated in the lessons learned of their case study on CMR by Minchin, et. al., "If the CM approaches the owner with a complaint about changed conditions, delays in reviewing shop drawings, other common delays, etc., the owner should not treat this like it would if a prime contractor on a DBB project made the same advances. Most CM/GC contracts make it clear that unless an incident caused the CM or a subcontractor to do something that was outside the boundaries of the contract (a material change), the CM just has to handle the situation. That is part of their CM fee. Paying the CM for handling such items is a dangerous precedent and amounts to double- paying the contractor."(Minchin, et. al., 2014, p. 65). This was also mentioned on page 173 front the Osceola county case study.
Florida This should be applied to being a major goal of the agency who is heading the project.
Minchin,et. al. (2014)
CMR Model Practice
44 Institutional Program Management
“A Good Plan Violently Executed Now Is Better Than a Perfect Plan Executed Next Week”
This best practice was taken word for word from the Osceola County's best practice recommendations, "The entire team must make timely, difficult, and binding decisions within the scheduled time available. Hesitation will kill the project’s momentum, schedule, and budget and will cause the team members to lose interest and move on to other urgent projects.” (Minchin, et. al., 2014, p.185)
Florida This should be a relative goal of the agency.
Minchin,et. al. (2014)
CMR Model Practice
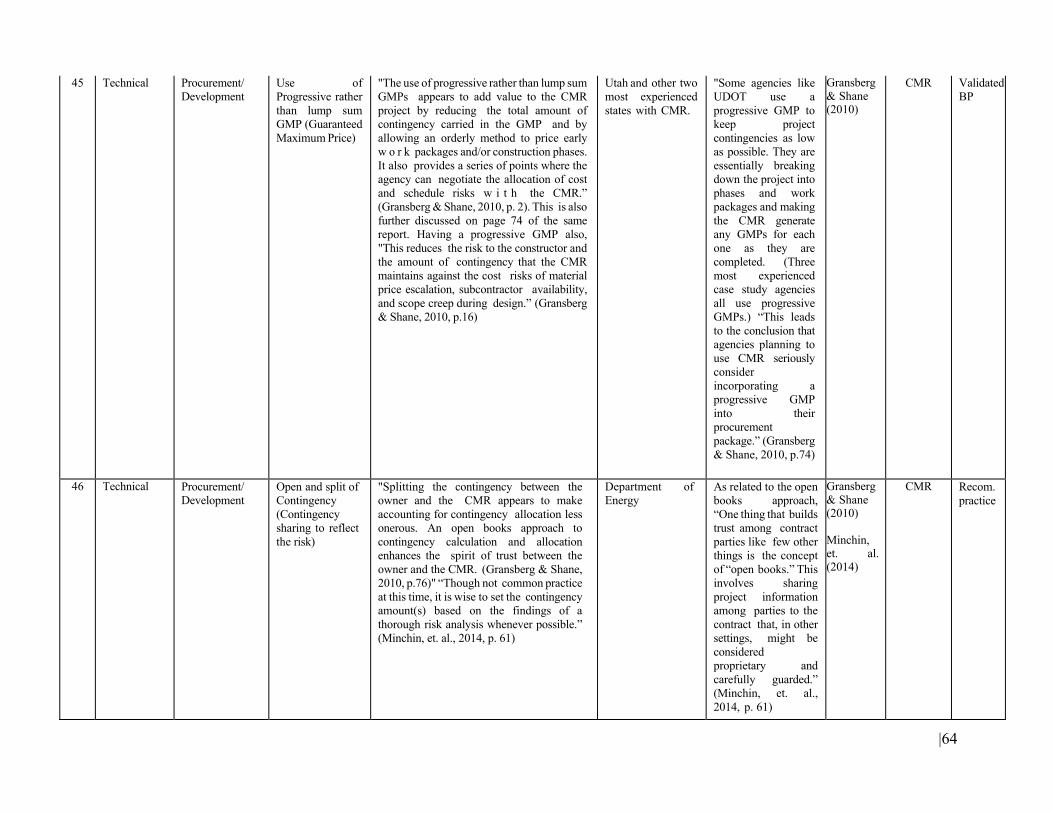
|64
45 Technical Procurement/ Development
Use of Progressive rather than lump sum GMP (Guaranteed Maximum Price)
"The use of progressive rather than lump sum GMPs appears to add value to the CMR project by reducing the total amount of contingency carried in the GMP and by allowing an orderly method to price early w o r k packages and/or construction phases. It also provides a series of points where the agency can negotiate the allocation of cost and schedule risks w i t h the CMR.” (Gransberg & Shane, 2010, p. 2). This is also further discussed on page 74 of the same report. Having a progressive GMP also, "This reduces the risk to the constructor and the amount of contingency that the CMR maintains against the cost risks of material price escalation, subcontractor availability, and scope creep during design.” (Gransberg & Shane, 2010, p.16)
Utah and other two most experienced states with CMR.
"Some agencies like UDOT use a progressive GMP to keep project contingencies as low as possible. They are essentially breaking down the project into phases and work packages and making the CMR generate any GMPs for each one as they are completed. (Three most experienced case study agencies all use progressive GMPs.) “This leads to the conclusion that agencies planning to use CMR seriously consider incorporating a progressive GMP into their procurement package.” (Gransberg & Shane, 2010, p.74)
Gransberg& Shane (2010)
CMR Validated BP
46 Technical Procurement/ Development
Open and split of Contingency (Contingency sharing to reflect the risk)
"Splitting the contingency between the owner and the CMR appears to make accounting for contingency allocation less onerous. An open books approach to contingency calculation and allocation enhances the spirit of trust between the owner and the CMR. (Gransberg & Shane, 2010, p.76)" “Though not common practice at this time, it is wise to set the contingency amount(s) based on the findings of a thorough risk analysis whenever possible.” (Minchin, et. al., 2014, p. 61)
Department of Energy
As related to the open books approach, “One thing that builds trust among contract parties like few other things is the concept of “open books.” This involves sharing project information among parties to the contract that, in other settings, might be considered proprietary and carefully guarded.” (Minchin, et. al., 2014, p. 61)
Gransberg& Shane (2010) Minchin, et. al. (2014)
CMR Recom. practice
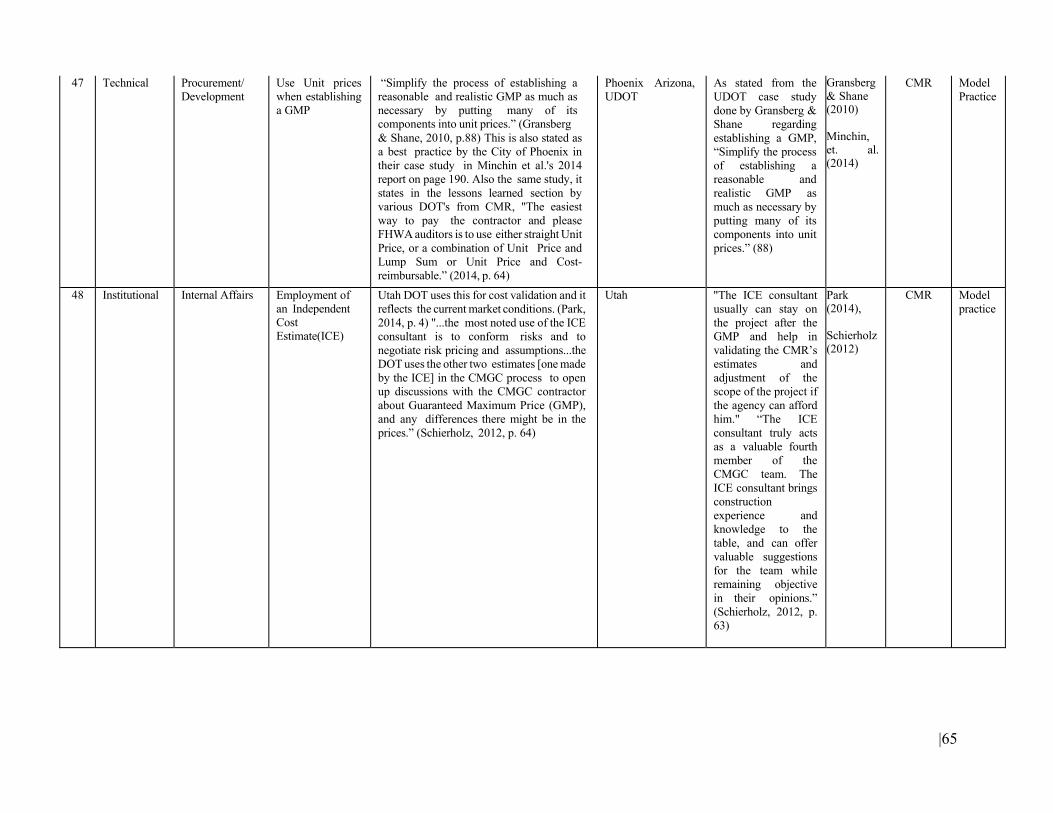
|65
47 Technical Procurement/ Development
Use Unit prices when establishing a GMP
“Simplify the process of establishing a reasonable and realistic GMP as much as necessary by putting many of its components into unit prices.” (Gransberg & Shane, 2010, p.88) This is also stated as a best practice by the City of Phoenix in their case study in Minchin et al.'s 2014 report on page 190. Also the same study, it states in the lessons learned section by various DOT's from CMR, "The easiest way to pay the contractor and please FHWA auditors is to use either straight Unit Price, or a combination of Unit Price and Lump Sum or Unit Price and Cost- reimbursable.” (2014, p. 64)
Phoenix Arizona, UDOT
As stated from the UDOT case study done by Gransberg & Shane regarding establishing a GMP, “Simplify the process of establishing a reasonable and realistic GMP as much as necessary by putting many of its components into unit prices.” (88)
Gransberg& Shane (2010) Minchin, et. al. (2014)
CMR Model Practice
48 Institutional Internal Affairs Employment of an Independent Cost Estimate(ICE)
Utah DOT uses this for cost validation and it reflects the current market conditions. (Park, 2014, p. 4) "...the most noted use of the ICE consultant is to conform risks and to negotiate risk pricing and assumptions...the DOT uses the other two estimates [one made by the ICE] in the CMGC process to open up discussions with the CMGC contractor about Guaranteed Maximum Price (GMP), and any differences there might be in the prices.” (Schierholz, 2012, p. 64)
Utah "The ICE consultant usually can stay on the project after the GMP and help in validating the CMR’s estimates and adjustment of the scope of the project if the agency can afford him." “The ICE consultant truly acts as a valuable fourth member of the CMGC team. The ICE consultant brings construction experience and knowledge to the table, and can offer valuable suggestions for the team while remaining objective in their opinions.” (Schierholz, 2012, p. 63)
Park (2014), Schierholz (2012)
CMR Model practice
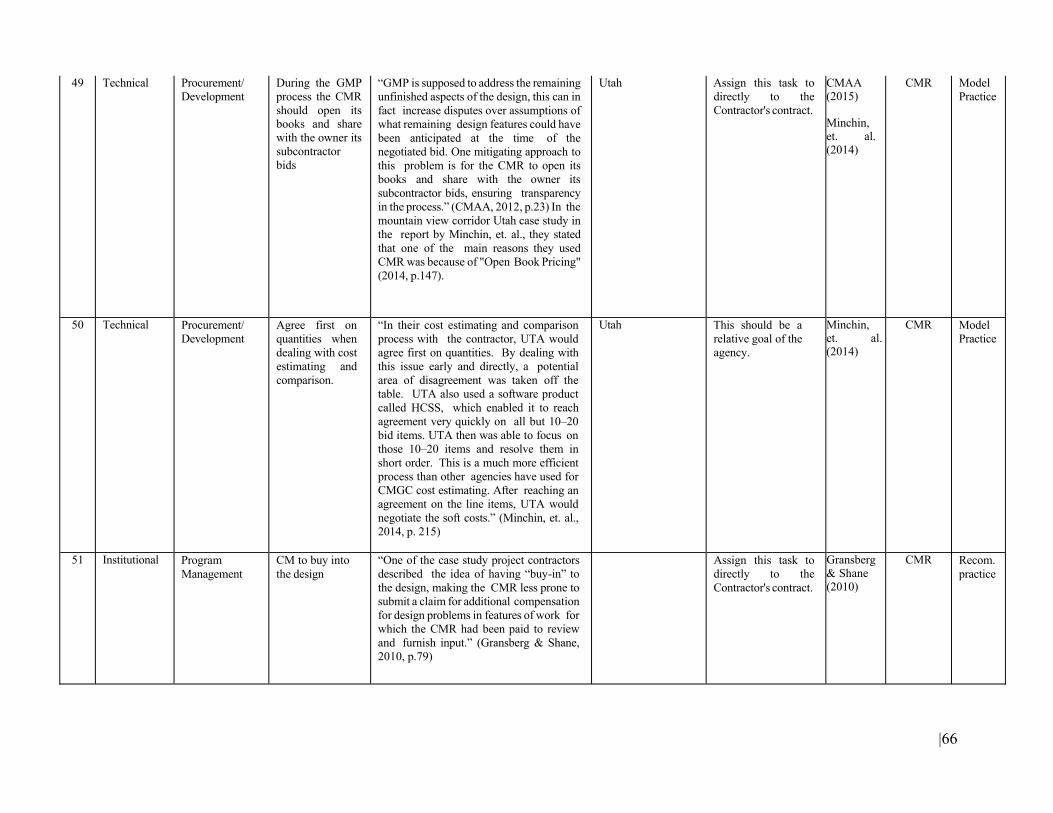
|66
49 Technical Procurement/ Development
During the GMP process the CMR should open its books and share with the owner its subcontractor bids
“GMP is supposed to address the remaining unfinished aspects of the design, this can in fact increase disputes over assumptions of what remaining design features could have been anticipated at the time of the negotiated bid. One mitigating approach to this problem is for the CMR to open its books and share with the owner its subcontractor bids, ensuring transparency in the process.” (CMAA, 2012, p.23) In the mountain view corridor Utah case study in the report by Minchin, et. al., they stated that one of the main reasons they used CMR was because of "Open Book Pricing" (2014, p.147).
Utah Assign this task to directly to the Contractor's contract.
CMAA (2015) Minchin, et. al. (2014)
CMR Model Practice
50 Technical Procurement/ Development
Agree first on quantities when dealing with cost estimating and comparison.
“In their cost estimating and comparison process with the contractor, UTA would agree first on quantities. By dealing with this issue early and directly, a potential area of disagreement was taken off the table. UTA also used a software product called HCSS, which enabled it to reach agreement very quickly on all but 10–20 bid items. UTA then was able to focus on those 10–20 items and resolve them in short order. This is a much more efficient process than other agencies have used for CMGC cost estimating. After reaching an agreement on the line items, UTA would negotiate the soft costs.” (Minchin, et. al., 2014, p. 215)
Utah This should be a relative goal of the agency.
Minchin,et. al. (2014)
CMR Model Practice
51 Institutional Program Management
CM to buy into the design
“One of the case study project contractors described the idea of having “buy-in” to the design, making the CMR less prone to submit a claim for additional compensation for design problems in features of work for which the CMR had been paid to review and furnish input.” (Gransberg & Shane, 2010, p.79)
Assign this task to directly to the Contractor's contract.
Gransberg& Shane (2010)
CMR Recom. practice
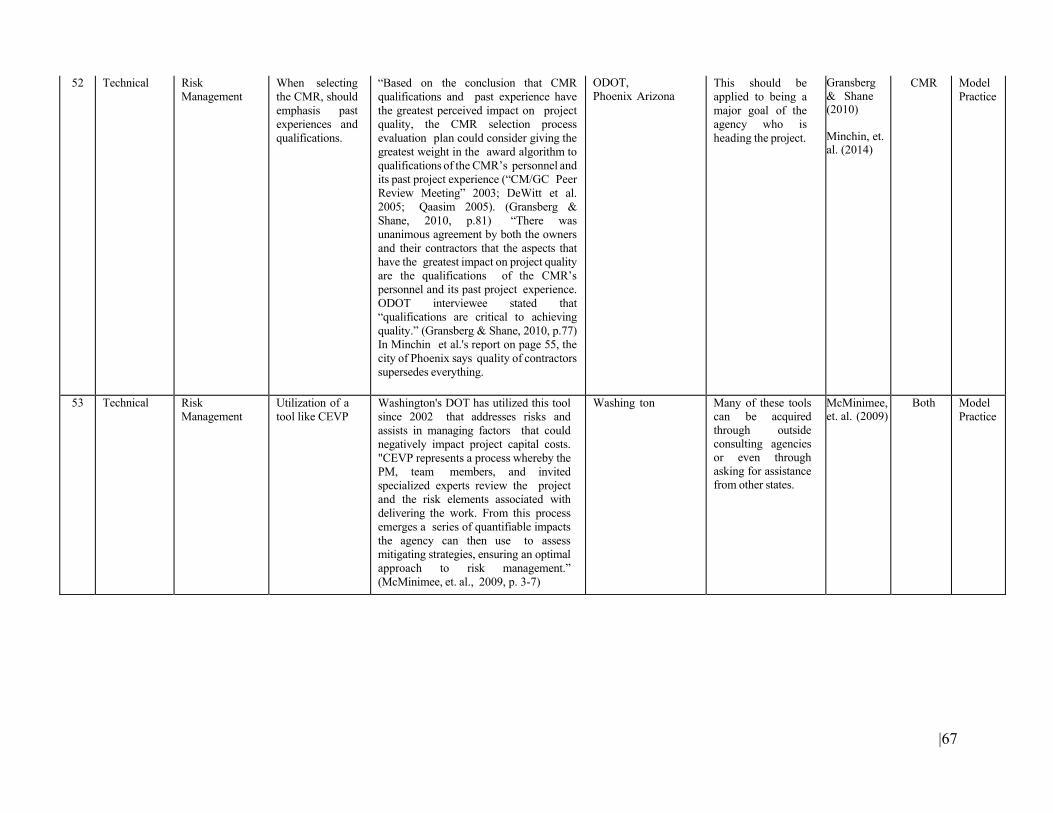
|67
52 Technical Risk Management
When selecting the CMR, should emphasis past experiences and qualifications.
“Based on the conclusion that CMR qualifications and past experience have the greatest perceived impact on project quality, the CMR selection process evaluation plan could consider giving the greatest weight in the award algorithm to qualifications of the CMR’s personnel and its past project experience (“CM/GC Peer Review Meeting” 2003; DeWitt et al. 2005; Qaasim 2005). (Gransberg & Shane, 2010, p.81) “There was unanimous agreement by both the owners and their contractors that the aspects that have the greatest impact on project quality are the qualifications of the CMR’s personnel and its past project experience. ODOT interviewee stated that “qualifications are critical to achieving quality.” (Gransberg & Shane, 2010, p.77) In Minchin et al.'s report on page 55, the city of Phoenix says quality of contractors supersedes everything.
ODOT, Phoenix Arizona
This should be applied to being a major goal of the agency who is heading the project.
Gransberg& Shane (2010) Minchin, et. al. (2014)
CMR Model Practice
53 Technical Risk Management
Utilization of a tool like CEVP
Washington's DOT has utilized this tool since 2002 that addresses risks and assists in managing factors that could negatively impact project capital costs. "CEVP represents a process whereby the PM, team members, and invited specialized experts review the project and the risk elements associated with delivering the work. From this process emerges a series of quantifiable impacts the agency can then use to assess mitigating strategies, ensuring an optimal approach to risk management.” (McMinimee, et. al., 2009, p. 3-7)
Washing ton Many of these tools can be acquired through outside consulting agencies or even through asking for assistance from other states.
McMinimee,et. al. (2009)
Both Model Practice
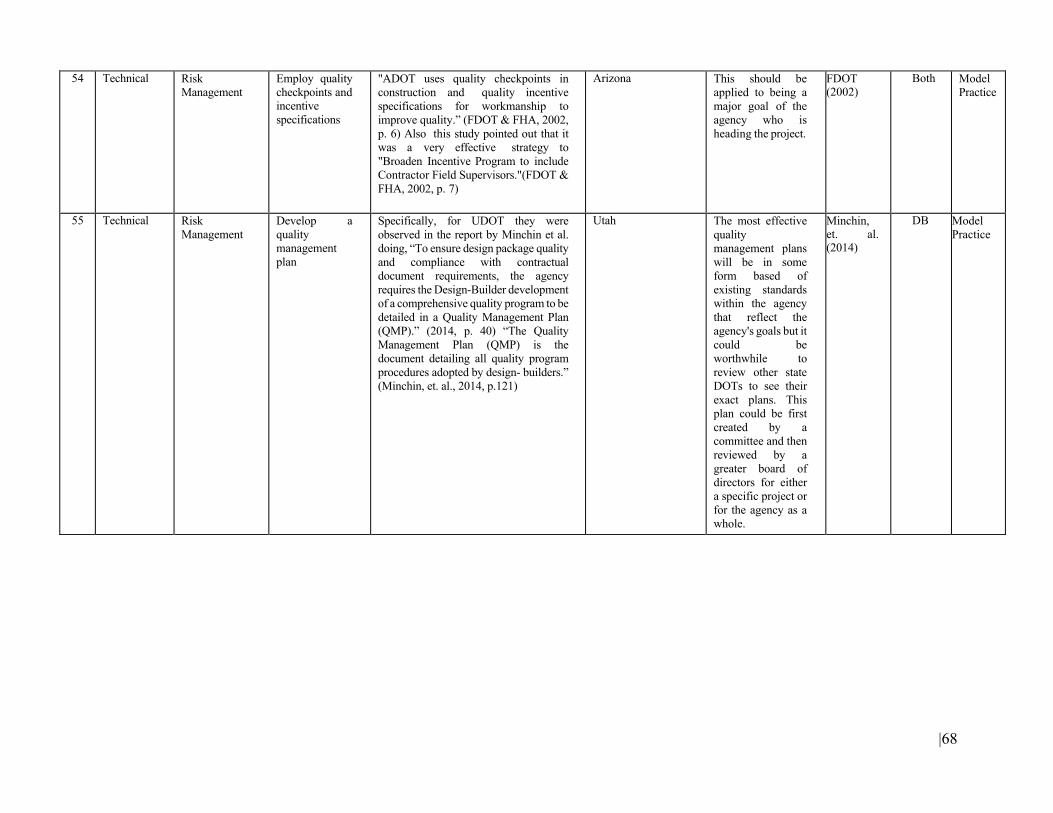
|68
54 Technical Risk Management
Employ quality checkpoints and incentive specifications
"ADOT uses quality checkpoints in construction and quality incentive specifications for workmanship to improve quality.” (FDOT & FHA, 2002, p. 6) Also this study pointed out that it was a very effective strategy to "Broaden Incentive Program to include Contractor Field Supervisors."(FDOT & FHA, 2002, p. 7)
Arizona This should be applied to being a major goal of the agency who is heading the project.
FDOT (2002)
Both Model Practice
55 Technical Risk Management
Develop a quality management plan
Specifically, for UDOT they were observed in the report by Minchin et al. doing, “To ensure design package quality and compliance with contractual document requirements, the agency requires the Design-Builder development of a comprehensive quality program to be detailed in a Quality Management Plan (QMP).” (2014, p. 40) “The Quality Management Plan (QMP) is the document detailing all quality program procedures adopted by design- builders.” (Minchin, et. al., 2014, p.121)
Utah The most effective quality management plans will be in some form based of existing standards within the agency that reflect the agency's goals but it could be worthwhile to review other state DOTs to see their exact plans. This plan could be first created by a committee and then reviewed by a greater board of directors for either a specific project or for the agency as a whole.
Minchin, et. al. (2014)
DB Model Practice
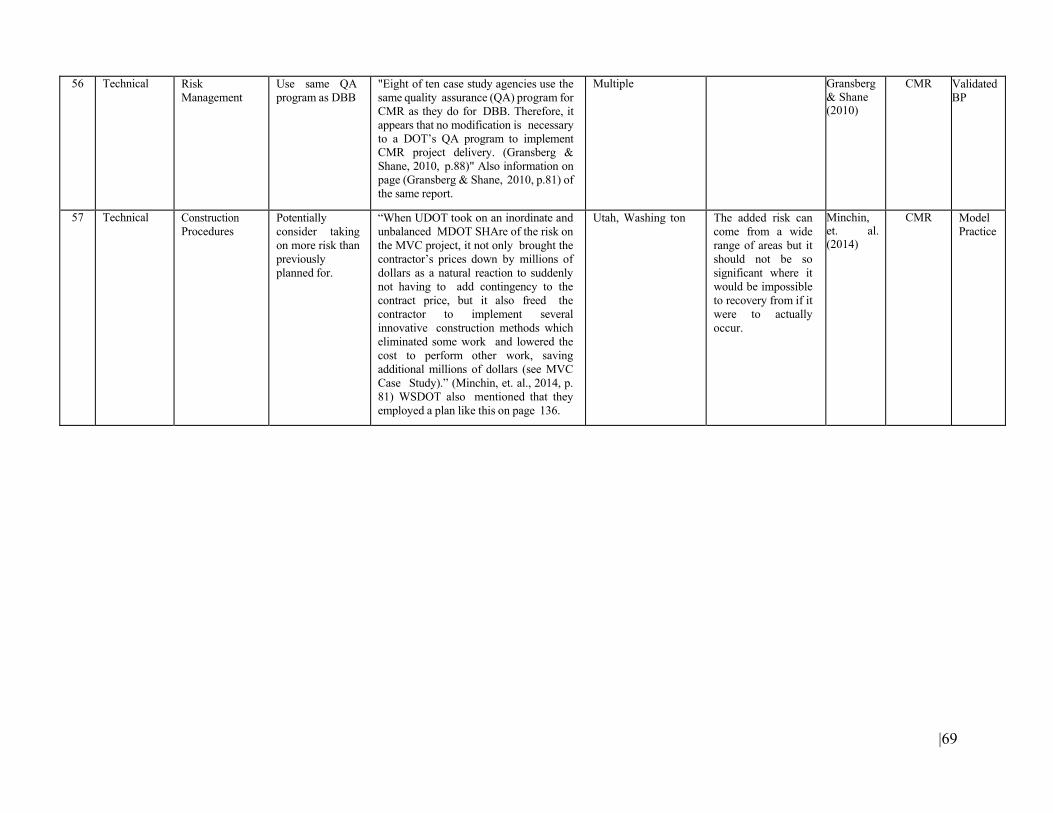
|69
56 Technical Risk Management
Use same QA program as DBB
"Eight of ten case study agencies use the same quality assurance (QA) program for CMR as they do for DBB. Therefore, it appears that no modification is necessary to a DOT’s QA program to implement CMR project delivery. (Gransberg & Shane, 2010, p.88)" Also information on page (Gransberg & Shane, 2010, p.81) of the same report.
Multiple Gransberg& Shane (2010)
CMR Validated BP
57 Technical Construction Procedures
Potentially consider taking on more risk than previously planned for.
“When UDOT took on an inordinate and unbalanced MDOT SHAre of the risk on the MVC project, it not only brought the contractor’s prices down by millions of dollars as a natural reaction to suddenly not having to add contingency to the contract price, but it also freed the contractor to implement several innovative construction methods which eliminated some work and lowered the cost to perform other work, saving additional millions of dollars (see MVC Case Study).” (Minchin, et. al., 2014, p. 81) WSDOT also mentioned that they employed a plan like this on page 136.
Utah, Washing ton The added risk can come from a wide range of areas but it should not be so significant where it would be impossible to recovery from if it were to actually occur.
Minchin,et. al. (2014)
CMR Model Practice
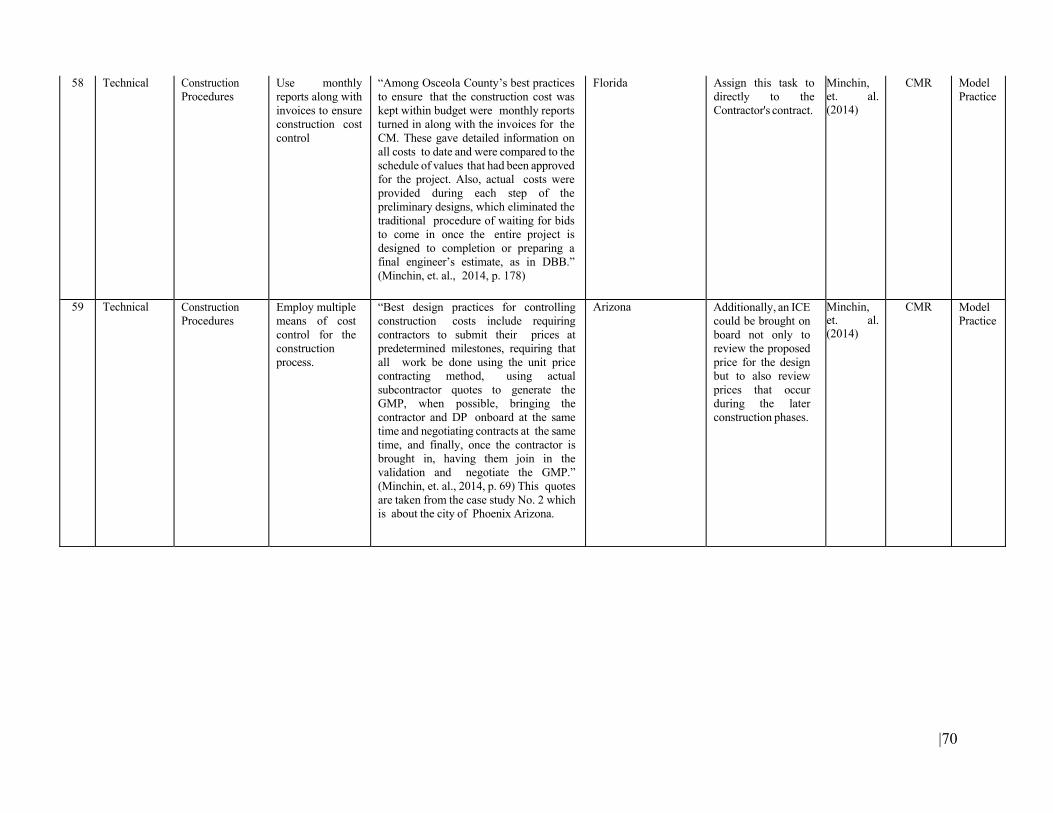
|70
58 Technical Construction Procedures
Use monthly reports along with invoices to ensure construction cost control
“Among Osceola County’s best practices to ensure that the construction cost was kept within budget were monthly reports turned in along with the invoices for the CM. These gave detailed information on all costs to date and were compared to the schedule of values that had been approved for the project. Also, actual costs were provided during each step of the preliminary designs, which eliminated the traditional procedure of waiting for bids to come in once the entire project is designed to completion or preparing a final engineer’s estimate, as in DBB.” (Minchin, et. al., 2014, p. 178)
Florida Assign this task to directly to the Contractor's contract.
Minchin, et. al. (2014)
CMR Model Practice
59 Technical Construction Procedures
Employ multiple means of cost control for the construction process.
“Best design practices for controlling construction costs include requiring contractors to submit their prices at predetermined milestones, requiring that all work be done using the unit price contracting method, using actual subcontractor quotes to generate the GMP, when possible, bringing the contractor and DP onboard at the same time and negotiating contracts at the same time, and finally, once the contractor is brought in, having them join in the validation and negotiate the GMP.” (Minchin, et. al., 2014, p. 69) This quotes are taken from the case study No. 2 which is about the city of Phoenix Arizona.
Arizona Additionally, an ICE could be brought on board not only to review the proposed price for the design but to also review prices that occur during the later construction phases.
Minchin,et. al. (2014)
CMR Model Practice
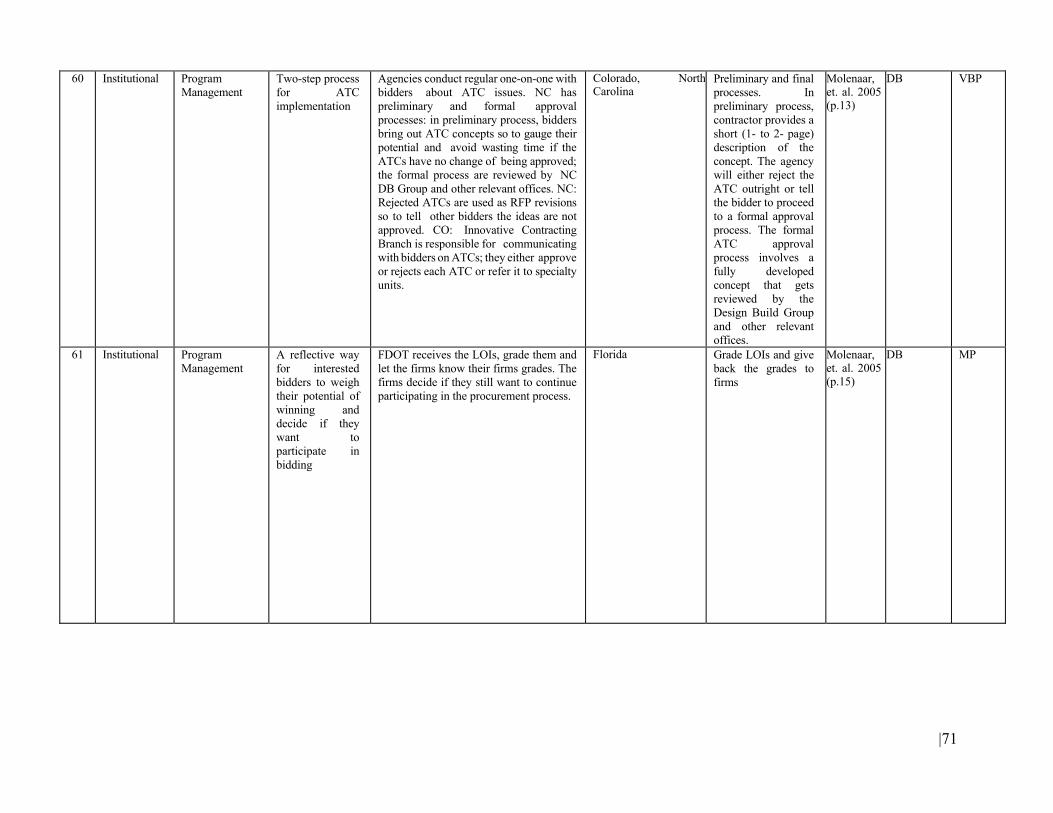
|71
60 Institutional Program Management
Two-step process for ATC implementation
Agencies conduct regular one-on-one with bidders about ATC issues. NC has preliminary and formal approval processes: in preliminary process, bidders bring out ATC concepts so to gauge their potential and avoid wasting time if the ATCs have no change of being approved; the formal process are reviewed by NC DB Group and other relevant offices. NC: Rejected ATCs are used as RFP revisions so to tell other bidders the ideas are not approved. CO: Innovative Contracting Branch is responsible for communicating with bidders on ATCs; they either approve or rejects each ATC or refer it to specialty units.
Colorado, NorthCarolina
Preliminary and final processes. In preliminary process, contractor provides a short (1- to 2- page) description of the concept. The agency will either reject the ATC outright or tell the bidder to proceed to a formal approval process. The formal ATC approval process involves a fully developed concept that gets reviewed by the Design Build Group and other relevant offices.
Molenaar, et. al. 2005(p.13)
DB VBP
61 Institutional Program Management
A reflective way for interested bidders to weigh their potential of winning and decide if they want to participate in bidding
FDOT receives the LOIs, grade them and let the firms know their firms grades. The firms decide if they still want to continue participating in the procurement process.
Florida Grade LOIs and give back the grades to firms
Molenaar, et. al. 2005 (p.15)
DB MP
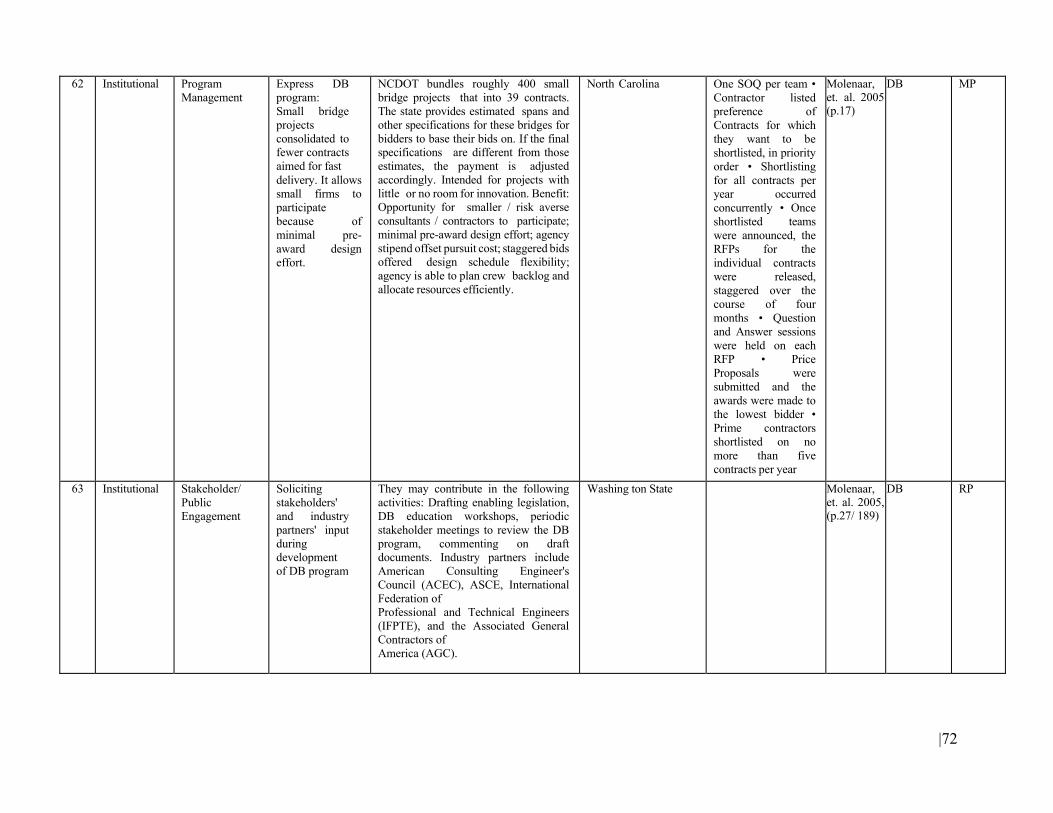
|72
62 Institutional Program Management
Express DB program: Small bridge projects consolidated to fewer contracts aimed for fast delivery. It allows small firms to participate because of minimal pre- award design effort.
NCDOT bundles roughly 400 small bridge projects that into 39 contracts. The state provides estimated spans and other specifications for these bridges for bidders to base their bids on. If the final specifications are different from those estimates, the payment is adjusted accordingly. Intended for projects with little or no room for innovation. Benefit: Opportunity for smaller / risk averse consultants / contractors to participate; minimal pre-award design effort; agency stipend offset pursuit cost; staggered bids offered design schedule flexibility; agency is able to plan crew backlog and allocate resources efficiently.
North Carolina One SOQ per team • Contractor listed preference of Contracts for which they want to be shortlisted, in priority order • Shortlisting for all contracts per year occurred concurrently • Once shortlisted teams were announced, the RFPs for the individual contracts were released, staggered over the course of four months • Question and Answer sessions were held on each RFP • Price Proposals were submitted and the awards were made to the lowest bidder • Prime contractors shortlisted on no more than five contracts per year
Molenaar, et. al. 2005 (p.17)
DB MP
63 Institutional Stakeholder/ Public Engagement
Soliciting stakeholders' and industry partners' input during development of DB program
They may contribute in the following activities: Drafting enabling legislation, DB education workshops, periodic stakeholder meetings to review the DB program, commenting on draft documents. Industry partners include American Consulting Engineer's Council (ACEC), ASCE, International Federation of Professional and Technical Engineers (IFPTE), and the Associated General Contractors of America (AGC).
Washing ton State Molenaar, et. al. 2005, (p.27/ 189)
DB RP
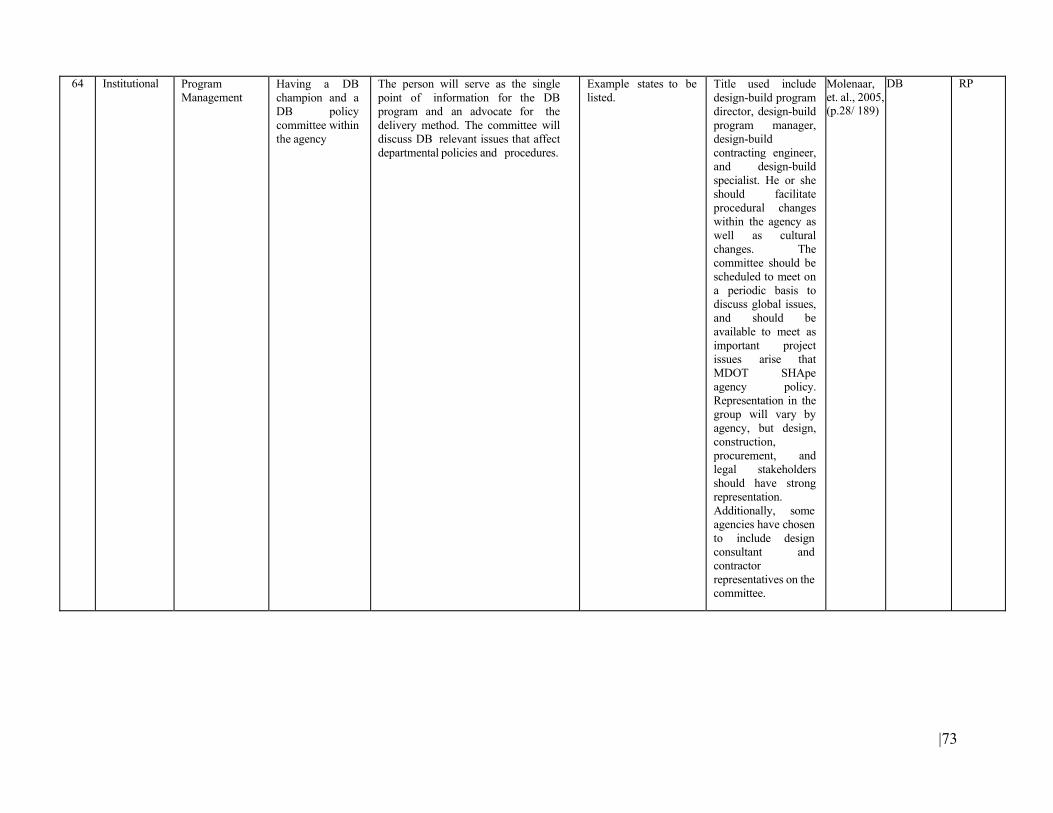
|73
64 Institutional Program Management
Having a DB champion and a DB policy committee within the agency
The person will serve as the single point of information for the DB program and an advocate for the delivery method. The committee will discuss DB relevant issues that affect departmental policies and procedures.
Example states to be listed.
Title used include design-build program director, design-build program manager, design-build contracting engineer, and design-build specialist. He or she should facilitate procedural changes within the agency as well as cultural changes. The committee should be scheduled to meet on a periodic basis to discuss global issues, and should be available to meet as important project issues arise that MDOT SHApe agency policy. Representation in the group will vary by agency, but design, construction, procurement, and legal stakeholders should have strong representation. Additionally, some agencies have chosen to include design consultant and contractor representatives on the committee.
Molenaar, et. al., 2005, (p.28/ 189)
DB RP

|74
65 Institutional Internal Affairs Writing white papers on important policy issues; develop guidelines and manuals
The white papers should be written by the stakeholders who are most affected by the issue. Minnesota DOT cover the following topics in their white papers: Third Party Agreements, Approach to Alternative Technical Concepts, Approach to Notice to Proceed, Approach to Change Order, Approach to Differing Site Conditions, Approach to Dispute Resolution. Guidelines and manuals stimulate discussion of important issues and can help to create consistency in methods across theagency.
Minnesota DOT: white papers; Arizona, Colorado, Florida, Montana, Washington State: guidelines or manuals
Guidelines and manuals can vary in length from 20 to 200 pages depending upon their purpose. They are typically intended to serve as a single source for design-build procedures and policies. They must be living documents as the design-build program develops and they need to have resources committed to keeping them current.
Molenaar, et. al., 2005, (p.28/ 189)
DB RP
66 Institutional Program Management
Pilot projects and benchmarking of performance
Numerous agencies have treated their first design- build projects as “pilots” to test the delivery method. The benefit in doing this is that there is a clear understanding that the process is new and will evolve.
Arizona, Colorado, Florida, Indiana, New Jersey, Minnesota, Ohio, Oregon, Washington State
It requires that the project performance is reviewed and the results are disseminated in the form of lessons learned.
Molenaar et. al., 2005, (p.29/ 189)
DB Model Practice
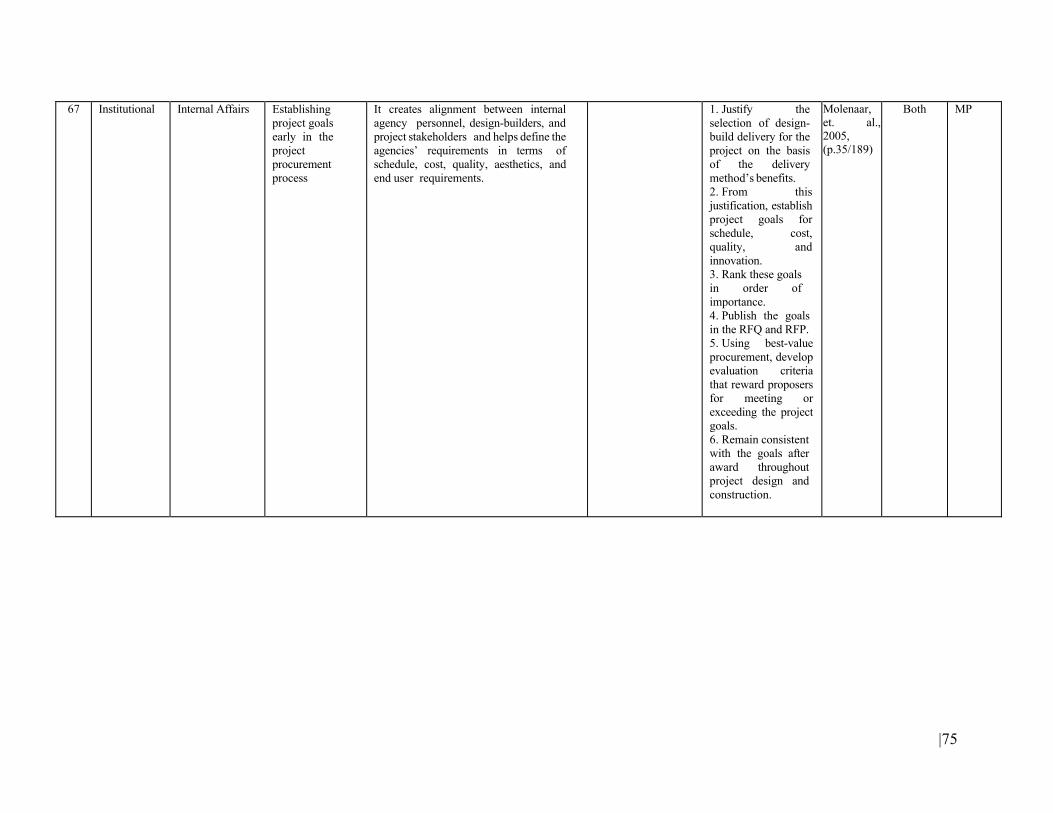
|75
67 Institutional Internal Affairs Establishing project goals early in the project procurement process
It creates alignment between internal agency personnel, design-builders, and project stakeholders and helps define the agencies’ requirements in terms of schedule, cost, quality, aesthetics, and end user requirements.
1. Justify the selection of design- build delivery for the project on the basis of the delivery method’s benefits. 2. From this justification, establish project goals for schedule, cost, quality, and innovation. 3. Rank these goals in order of importance. 4. Publish the goals in the RFQ and RFP. 5. Using best-value procurement, develop evaluation criteria that reward proposers for meeting or exceeding the project goals. 6. Remain consistent with the goals after award throughout project design and construction.
Molenaar,et. al.,2005, (p.35/189)
Both MP
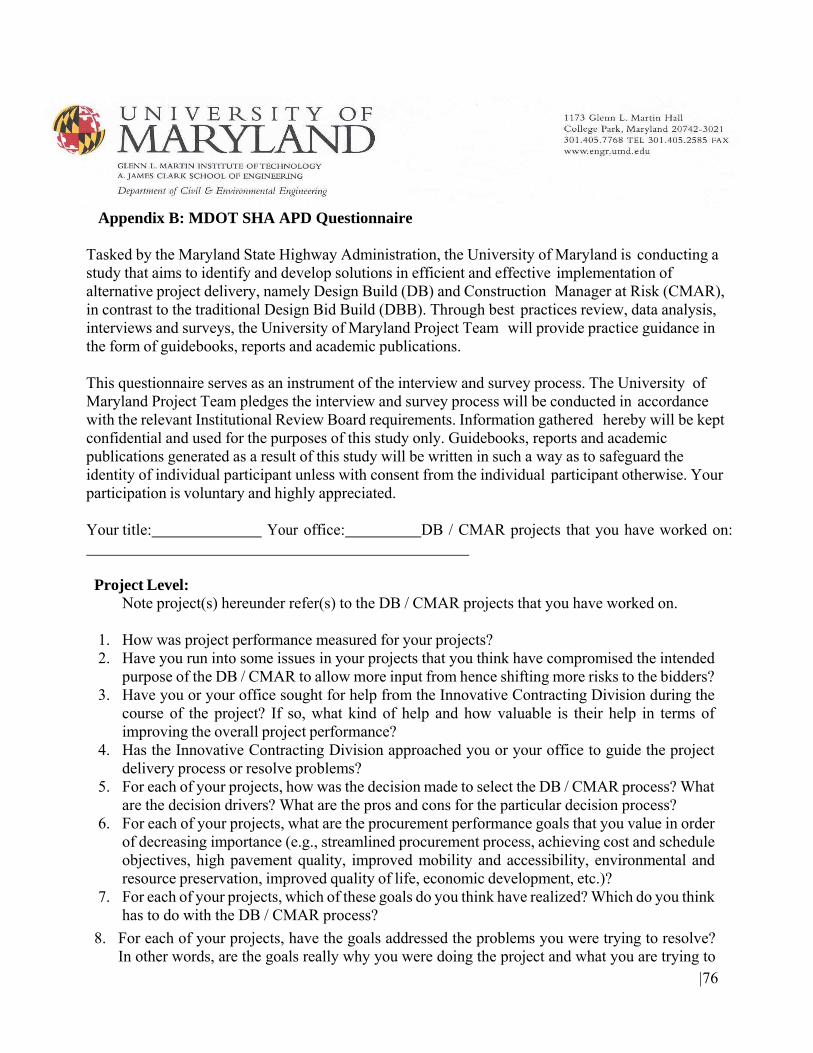
|76
Appendix B: MDOT SHA APD Questionnaire
Tasked by the Maryland State Highway Administration, the University of Maryland is conducting a study that aims to identify and develop solutions in efficient and effective implementation of alternative project delivery, namely Design Build (DB) and Construction Manager at Risk (CMAR), in contrast to the traditional Design Bid Build (DBB). Through best practices review, data analysis, interviews and surveys, the University of Maryland Project Team will provide practice guidance in the form of guidebooks, reports and academic publications. This questionnaire serves as an instrument of the interview and survey process. The University of Maryland Project Team pledges the interview and survey process will be conducted in accordance with the relevant Institutional Review Board requirements. Information gathered hereby will be kept confidential and used for the purposes of this study only. Guidebooks, reports and academic publications generated as a result of this study will be written in such a way as to safeguard the identity of individual participant unless with consent from the individual participant otherwise. Your participation is voluntary and highly appreciated. Your title: Your office: DB / CMAR projects that you have worked on:
Project Level: Note project(s) hereunder refer(s) to the DB / CMAR projects that you have worked on.
1. How was project performance measured for your projects? 2. Have you run into some issues in your projects that you think have compromised the intended
purpose of the DB / CMAR to allow more input from hence shifting more risks to the bidders? 3. Have you or your office sought for help from the Innovative Contracting Division during the
course of the project? If so, what kind of help and how valuable is their help in terms of improving the overall project performance?
4. Has the Innovative Contracting Division approached you or your office to guide the project delivery process or resolve problems?
5. For each of your projects, how was the decision made to select the DB / CMAR process? What are the decision drivers? What are the pros and cons for the particular decision process?
6. For each of your projects, what are the procurement performance goals that you value in order of decreasing importance (e.g., streamlined procurement process, achieving cost and schedule objectives, high pavement quality, improved mobility and accessibility, environmental and resource preservation, improved quality of life, economic development, etc.)?
7. For each of your projects, which of these goals do you think have realized? Which do you think has to do with the DB / CMAR process?
8. For each of your projects, have the goals addressed the problems you were trying to resolve? In other words, are the goals really why you were doing the project and what you are trying to
|77
accomplish? 9. For each of your projects, how many people were there with DB / CMAR experience? Were
they able to influence decisions? 10. For each of your projects, how comfortable / experienced with the DB / CMAR process were
the contractors? Process Level: 11. Are you satisfied with the DB and CMAR processes? What part of the DB and CMAR
processes are you unsatisfied with? How much effort do you feel the agency is willing to spent to improve these conditions.
12. Are there special processes for DB and CMAR compared with the traditional delivery process (DBB)? What are they? Are they handled by personnel with DB / CMAR experience?
13. What benefits of DBB do you think are lost when using DB and CMAR. 14. How do you find the balance point between guidelines and preferences in RFPs / IFBs? The
dilemma is guidelines are not specific about the potential issues and preferences hamper innovations from the bidders.
15. How difficult is the change to adapt the DBB process to DB and CMAR? 16. What is the actual work reduced compared to the DBB process?
Organization Level: 17. How accepting do you feel the agency’s internal culture / mindset is to adapting DB and CMAR
processes. What about your office? 18. How comfortable do you think the agency feel in seeking assistance from state DOT offices
which have more experience in alternative delivery methods? 19. How do you think the agency’s internal infrastructure should change to better facilitate the DB
and CMAR processes. 20. If your office is the lead office, which one do you prefer, having DB / CMAR expertise in your
office or pulling resources from the liaison offices? 21. Which do you think is more efficient, your project being led by the Innovative Contracting
Division or being led by your office? 22. How well prepared is each individual that is deployed in a DB / CMAR project? What are the
staffing concerns? Training: 23. What is the agency seeking to change through training on DB and CMAR processes? 24. What training options do you think is more efficient and effective, centralized training or
selected personnel partnering with different liaison offices while working on the project? Can you think of any other options?
25. What are the barriers to implement each training option? 26. What do you think the agency is hoping to achieve in terms of in terms of increase in
competence in DB and CMAR processes (in percentage)? How do you think the agency is planning on measuring that?
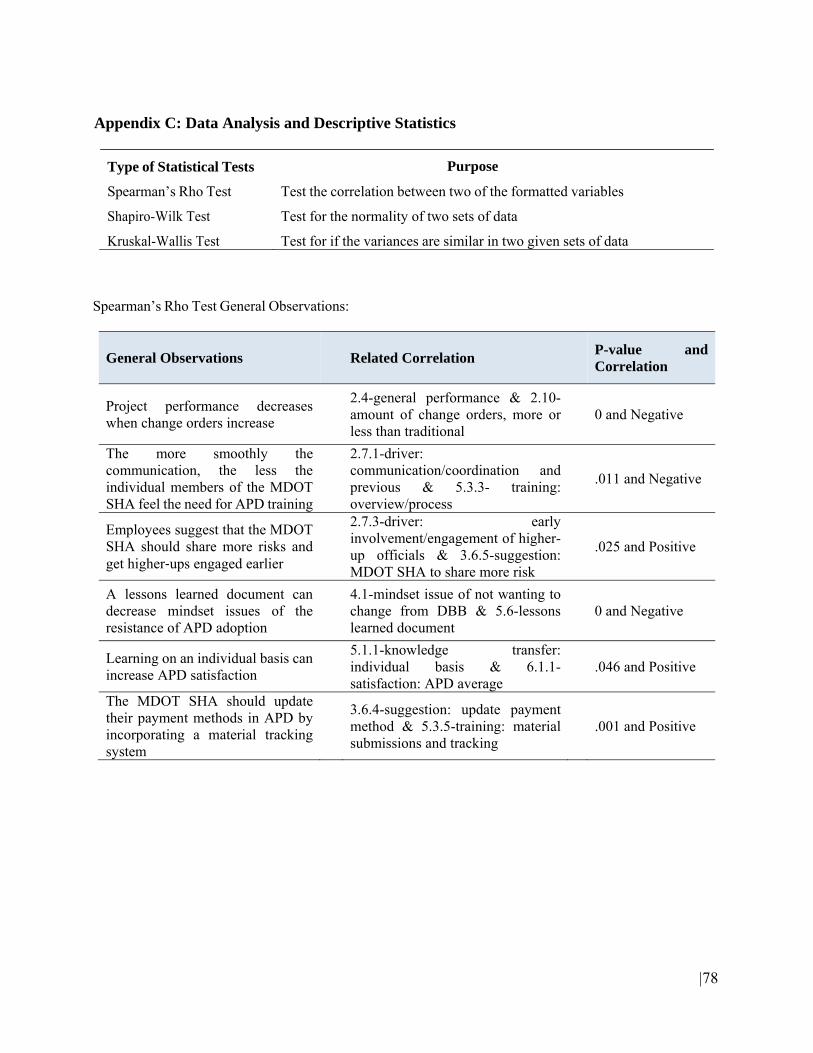
|78
Appendix C: Data Analysis and Descriptive Statistics
Type of Statistical Tests Purpose
Spearman’s Rho Test Test the correlation between two of the formatted variables
Shapiro-Wilk Test Test for the normality of two sets of data
Kruskal-Wallis Test Test for if the variances are similar in two given sets of data
Spearman’s Rho Test General Observations:
General Observations
Related Correlation
P-value and Correlation
Project performance decreases when change orders increase
2.4-general performance & 2.10-amount of change orders, more or less than traditional
0 and Negative
The more smoothly the communication, the less the individual members of the MDOT SHA feel the need for APD training
2.7.1-driver: communication/coordination and previous & 5.3.3- training: overview/process
.011 and Negative
Employees suggest that the MDOT SHA should share more risks and get higher‐ups engaged earlier
2.7.3-driver: early involvement/engagement of higher-up officials & 3.6.5-suggestion: MDOT SHA to share more risk
.025 and Positive
A lessons learned document can decrease mindset issues of the resistance of APD adoption
4.1-mindset issue of not wanting to change from DBB & 5.6-lessons learned document
0 and Negative
Learning on an individual basis can increase APD satisfaction
5.1.1-knowledge transfer: individual basis & 6.1.1-satisfaction: APD average
.046 and Positive
The MDOT SHA should update their payment methods in APD by incorporating a material tracking system
3.6.4-suggestion: update payment method & 5.3.5-training: material submissions and tracking
.001 and Positive
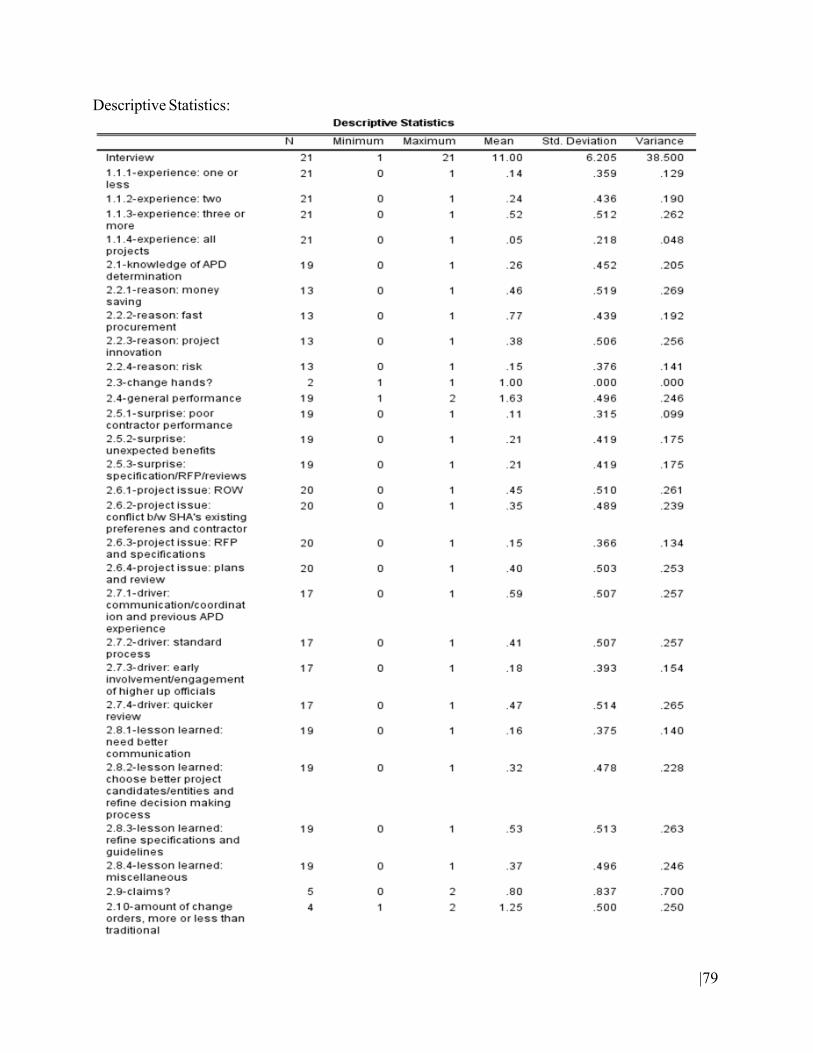
|79
Descriptive Statistics:
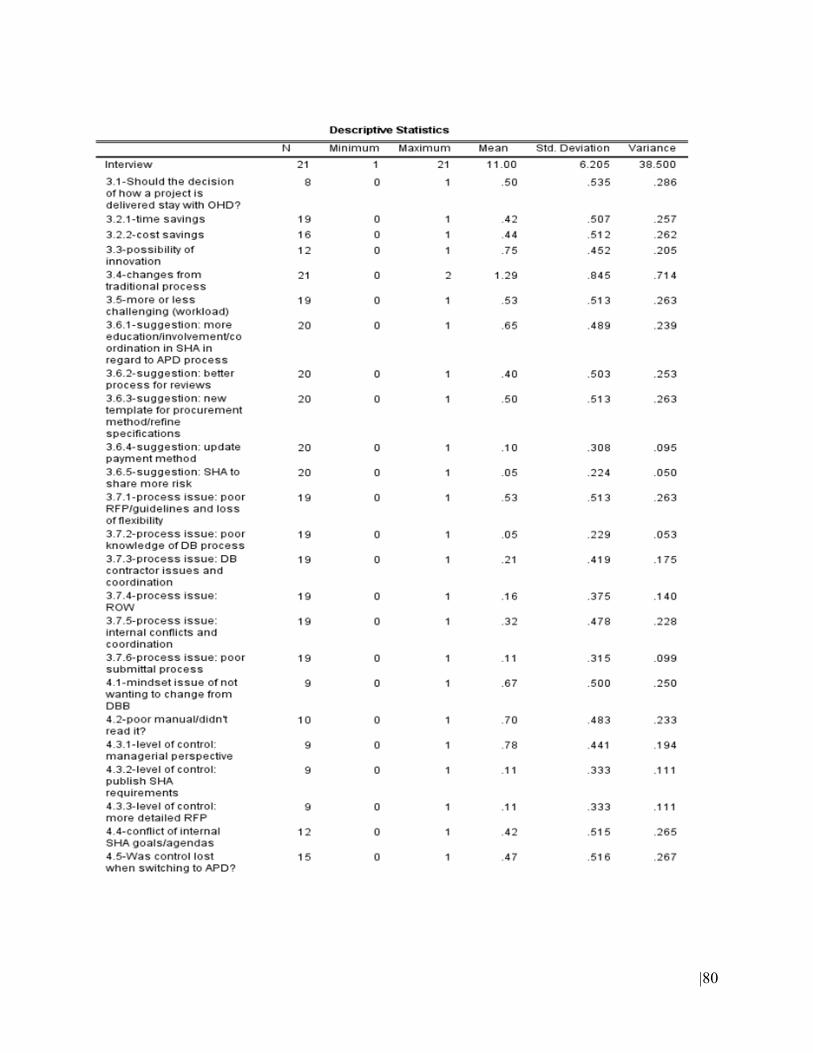
|80

|81
|82
Appendix D: APD Training Program Training is often considered as an effective strategy for public agencies to build capacity and improve operational efficiency. The same conclusion has been reached based on the analysis of interviews with MDOT SHA officials. The research team followed three steps to develop a APD training program that assists the agency in building capacity of alternative project delivery. First, the team first identified the satisfactory level of MDOT SHA employees on APD implementation. Then a thorough evaluation and comparison of agency’s current training program was performed with other APD curricula. Lastly, a set of syllabi was developed that includes learning objectives, knowledge areas, and resources. Based on the review of APD practices and concerns raised by MDOT SHA officials, the team concluded that APD training program at MDOT SHA should address the following five critical issues. Training program needs to meet the need of all public officials with various levels of APD
experience. The focus and training content should be fine-tuned to reflect the audience’s APD knowledge level. For those with little experience, the primary issue was related to plan review process. For those with one or two APD projects experience, the focus of the training would be improving communication. Those with some APD projects experience were interested in understanding detailed process and APD guidelines.
APD Training should explain the reasoning behind APD selection. The analysis in previous section reported that the knowledge of money saving in APD system significantly helped the acceptance of APD methods by MDOT SHA officials. The training program, therefore, should present the drivers behind APD selection and emphasize the effectiveness of APD in alignment with project goals and agency’s strategic objectives.
Some MDOT SHA engineers were skeptical of APD use on MDOT SHA projects. The training program should include concrete project examples and build strong acceptance of APD use.
Inadequate RFPs and specifications were two major barriers to successful APD project execution. The training program should present the best practices, guide, and project application of developing RFP and specification.
Stakeholder communication was regarded as a key success factor for APD project management. Timely and effective communication can avoid team conflicts, reduce costly change orders, and result in innovation and performance. While project communication may be related to any types of projects, it becomes more essential for MDOT SHA to integrate existing communication program into APD training program.
The training should present the standard APD process. Loss of control in APD projects was observed by several MDOT SHA engineers. APD training program should present and compare traditional process and, clarify teaming and roles.
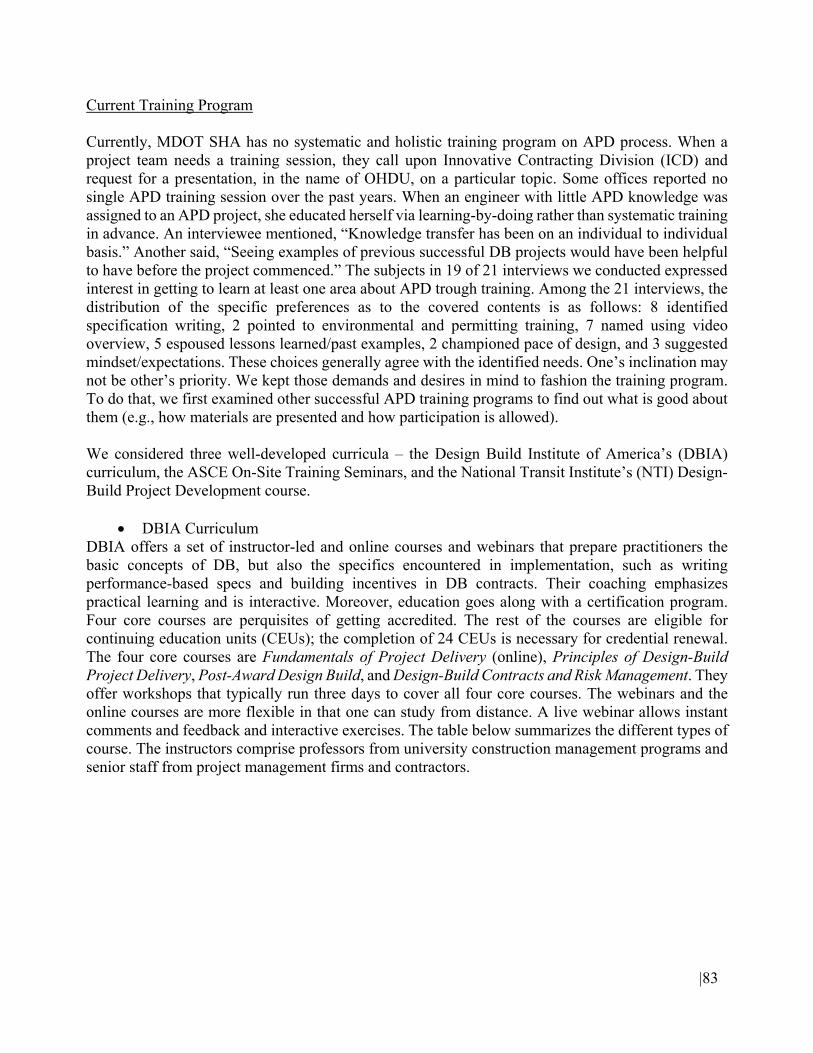
|83
Current Training Program Currently, MDOT SHA has no systematic and holistic training program on APD process. When a project team needs a training session, they call upon Innovative Contracting Division (ICD) and request for a presentation, in the name of OHDU, on a particular topic. Some offices reported no single APD training session over the past years. When an engineer with little APD knowledge was assigned to an APD project, she educated herself via learning-by-doing rather than systematic training in advance. An interviewee mentioned, “Knowledge transfer has been on an individual to individual basis.” Another said, “Seeing examples of previous successful DB projects would have been helpful to have before the project commenced.” The subjects in 19 of 21 interviews we conducted expressed interest in getting to learn at least one area about APD trough training. Among the 21 interviews, the distribution of the specific preferences as to the covered contents is as follows: 8 identified specification writing, 2 pointed to environmental and permitting training, 7 named using video overview, 5 espoused lessons learned/past examples, 2 championed pace of design, and 3 suggested mindset/expectations. These choices generally agree with the identified needs. One’s inclination may not be other’s priority. We kept those demands and desires in mind to fashion the training program. To do that, we first examined other successful APD training programs to find out what is good about them (e.g., how materials are presented and how participation is allowed). We considered three well-developed curricula – the Design Build Institute of America’s (DBIA) curriculum, the ASCE On-Site Training Seminars, and the National Transit Institute’s (NTI) Design-Build Project Development course.
DBIA Curriculum DBIA offers a set of instructor-led and online courses and webinars that prepare practitioners the basic concepts of DB, but also the specifics encountered in implementation, such as writing performance-based specs and building incentives in DB contracts. Their coaching emphasizes practical learning and is interactive. Moreover, education goes along with a certification program. Four core courses are perquisites of getting accredited. The rest of the courses are eligible for continuing education units (CEUs); the completion of 24 CEUs is necessary for credential renewal. The four core courses are Fundamentals of Project Delivery (online), Principles of Design-Build Project Delivery, Post-Award Design Build, and Design-Build Contracts and Risk Management. They offer workshops that typically run three days to cover all four core courses. The webinars and the online courses are more flexible in that one can study from distance. A live webinar allows instant comments and feedback and interactive exercises. The table below summarizes the different types of course. The instructors comprise professors from university construction management programs and senior staff from project management firms and contractors.
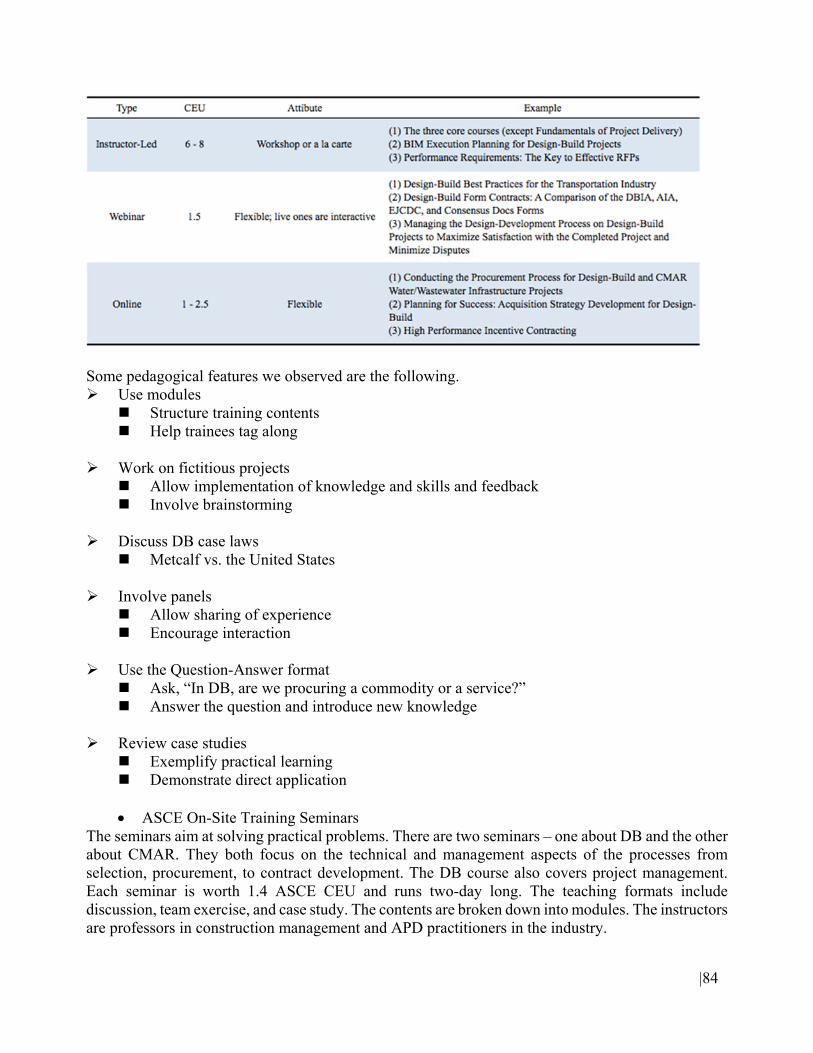
|84
Some pedagogical features we observed are the following. Use modules
Structure training contents Help trainees tag along
Work on fictitious projects
Allow implementation of knowledge and skills and feedback Involve brainstorming
Discuss DB case laws
Metcalf vs. the United States
Involve panels Allow sharing of experience Encourage interaction
Use the Question-Answer format
Ask, “In DB, are we procuring a commodity or a service?” Answer the question and introduce new knowledge
Review case studies
Exemplify practical learning Demonstrate direct application
ASCE On-Site Training Seminars
The seminars aim at solving practical problems. There are two seminars – one about DB and the other about CMAR. They both focus on the technical and management aspects of the processes from selection, procurement, to contract development. The DB course also covers project management. Each seminar is worth 1.4 ASCE CEU and runs two-day long. The teaching formats include discussion, team exercise, and case study. The contents are broken down into modules. The instructors are professors in construction management and APD practitioners in the industry.
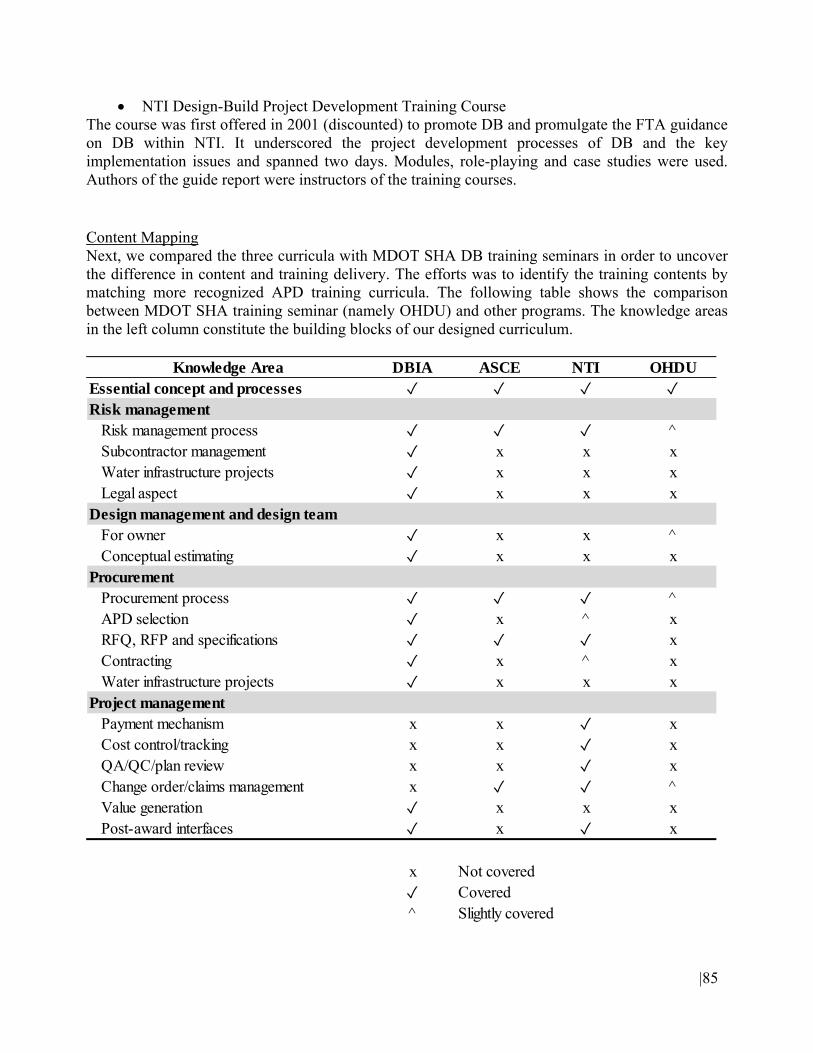
|85
NTI Design-Build Project Development Training Course The course was first offered in 2001 (discounted) to promote DB and promulgate the FTA guidance on DB within NTI. It underscored the project development processes of DB and the key implementation issues and spanned two days. Modules, role-playing and case studies were used. Authors of the guide report were instructors of the training courses. Content Mapping Next, we compared the three curricula with MDOT SHA DB training seminars in order to uncover the difference in content and training delivery. The efforts was to identify the training contents by matching more recognized APD training curricula. The following table shows the comparison between MDOT SHA training seminar (namely OHDU) and other programs. The knowledge areas in the left column constitute the building blocks of our designed curriculum.
Knowledge Area DBIA ASCE NTI OHDUEssential concept and processes ✓ ✓ ✓ ✓Risk management
Risk management process ✓ ✓ ✓ ^Subcontractor management ✓ x x xWater infrastructure projects ✓ x x xLegal aspect ✓ x x x
Design management and design teamFor owner ✓ x x ^Conceptual estimating ✓ x x x
ProcurementProcurement process ✓ ✓ ✓ ^APD selection ✓ x ^ xRFQ, RFP and specifications ✓ ✓ ✓ xContracting ✓ x ^ xWater infrastructure projects ✓ x x x
Project managementPayment mechanism x x ✓ xCost control/tracking x x ✓ xQA/QC/plan review x x ✓ xChange order/claims management x ✓ ✓ ^Value generation ✓ x x xPost-award interfaces ✓ x ✓ x
x Not covered✓ Covered^ Slightly covered
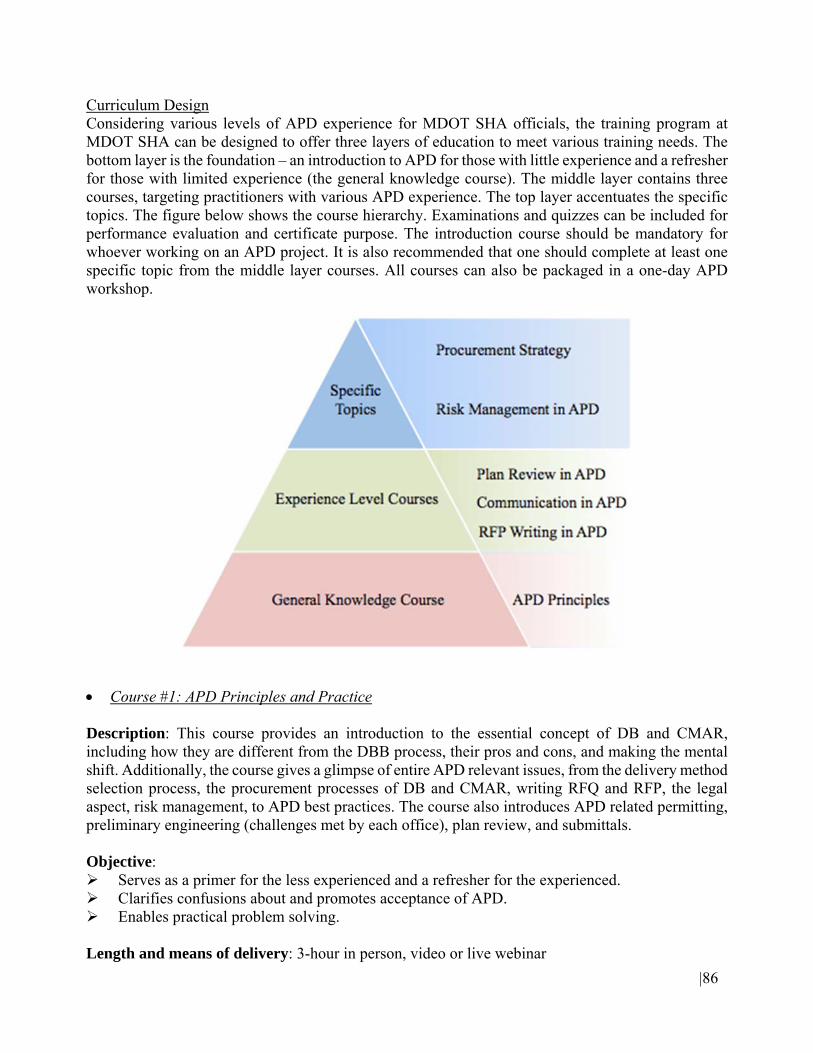
|86
Curriculum Design Considering various levels of APD experience for MDOT SHA officials, the training program at MDOT SHA can be designed to offer three layers of education to meet various training needs. The bottom layer is the foundation – an introduction to APD for those with little experience and a refresher for those with limited experience (the general knowledge course). The middle layer contains three courses, targeting practitioners with various APD experience. The top layer accentuates the specific topics. The figure below shows the course hierarchy. Examinations and quizzes can be included for performance evaluation and certificate purpose. The introduction course should be mandatory for whoever working on an APD project. It is also recommended that one should complete at least one specific topic from the middle layer courses. All courses can also be packaged in a one-day APD workshop.
Course #1: APD Principles and Practice Description: This course provides an introduction to the essential concept of DB and CMAR, including how they are different from the DBB process, their pros and cons, and making the mental shift. Additionally, the course gives a glimpse of entire APD relevant issues, from the delivery method selection process, the procurement processes of DB and CMAR, writing RFQ and RFP, the legal aspect, risk management, to APD best practices. The course also introduces APD related permitting, preliminary engineering (challenges met by each office), plan review, and submittals. Objective: Serves as a primer for the less experienced and a refresher for the experienced. Clarifies confusions about and promotes acceptance of APD. Enables practical problem solving. Length and means of delivery: 3-hour in person, video or live webinar
|87
Teaching format: lecture, case study, role-playing, and discussion. The course should include a few hypothetical or real APD project cases that can demonstrate the selection of APD, RFP writing, and risk management. Modules: (1) essential concepts, (2) making the mental shift, (3) APD selection and procurement processes (4) RFQ/RFP, (4) legal aspect and risk management, (5) standard process, and (6) best practices. Course #2: Plan Review in APD
Description: Plan review is cumbersome, time-consuming and stressful for the reviewers. How many times of plan review are needed? What can be done to improve the efficiency? What is the legal implication if a reviewer failed to catch a problem that resulted in a claim? What happens if a reviewer identified a problem but the contractor ignored it and it turned out that the reviewer is correct? The course answers these questions and visits the best practices related to plan review. Requisite/elective: Successful completion of APD Principles. Objective: Prepares reviewers to efficiently and responsibly review plans in APD projects. Length and means of delivery: 2-hour in person, video or live webinar. Teaching formats: lecture, case study, and discussion. Modules: (1) Role of plan reviewer, (2) legal implications, and (3) best practices Course #3: Communication in APD
Description: The course covers how to communicate effectively among all stakeholders, engage the contractor and the construction manager in the post-award period, communication within the owner’s team, integrated solution finding, plan submittal procedure, permitting, progress payment, material tracking, and memos. Requisite/elective: Successful completion of APD Principles. Objective: Optimizes information exchange, improves intra- and inter-organization collaboration, and streamlines various procedures. Length and means of delivery: 1-hour in person, video or live webinar. Teaching formats: lecture and discussion. The following is a discussion seed about lack of coordination between the road design engineers and the landscape architects. There needs to be a coordination meeting among the DB landscape architect,
|88
the MDOT SHA landscape architect and the prime at the beginning of the design process. Often, the meeting doesn’t take place until the road or the building has been designed. It is then too late to make significant changes to the design layout. Regarding plan submittals, an employee suggested contractors should only use ProjectWise, instead of emails. The person also recommended the use of project webpage where different reviewers could type in comments and then project managers compiles all comments before sending to contractor. The following example describes a permitting issue. Contractors send documents to the MDE for permitting and they should send a copy of all the documents to MDOT SHA as well. Sometimes MDOT SHA didn’t receive the documents and the changes were made without MDOT SHA’s input. Time is wasted on chasing the documents. A MDOT SHA official had a suggestion about progress payment. Contractors want more money upfront. So MDOT SHA should set a limit on payment for mobilization. Another issue was related to existing payment system where contractors often got underpaid due to a tenth of a percent accounting method. So there were fights month to month about their money. It would be better if the system allows exact payment amount. Some suggested a separate pay coding system for DB projects. Others supported to use a detailed breakdown similar to DBB projects. There was a comment about how material tracking is problematic in DB. The computer system is designed for tracking in DBB. The contractor provides a minimum breakdown. When inspectors check the materials, they have to think whether one item represents multiple items on the item list. For federal funded DB projects, the agency needs to have clearance for both DB and DBB, which sometimes caused problems. There was a call for a standard letters book for APD such that the system alerts when a certain memo should be sent out. Modules: (1) Communication plan and means, (2) Meetings and submittals, and (3) Procedures and execution Course #4: RFP Writing in APD
Description: A good RFP helps realize the project goals and encourages innovations. There is a dilemma of preference vs. guidelines – too much preference stymies creativity, too much guidelines could result in a design not meeting the performance expectations. The course teaches how to develop definitive performance criteria in functional terms while maintaining owner’s control of the final product. Requisite/elective: Successful completion of APD Principles. Objective: Distinguish between good and bad RFPs Learn scoping a project in functional terms Define performance criteria for APD projects
|89
Length and means of delivery: 2-hour in person, video or live webinar. Teaching formats: lecture, case study, and discussion. The instructor presents RFP examples and encourage participants to determine the pros and cons of RFP or performance criteria. Modules: (1) Scoping the project, (2) Writing performance criteria. (3) How to write good RFPs? (4) RFP case study and discussion. Course #5: Procurement Strategy Description: This course outlines the owner’s considerations in procuring a project and decision making process on selecting the best-fit project delivery method. Requisite/elective: Successful completion of APD Principles and .at least one experience level course Objective: Understand the reason of adopting APD is alignment of goals. Length and means of delivery: 2 hour in person, video or live webinar. Teaching formats: lecture, discussion and class exercise. A class exercise can be designed to allow participants to select the project delivery method for a MDOT SHA project using structured APD selection process. The exercise can be in the format of workshop or team discussion. Modules: (1) Owner’s considerations, and (2) project delivery selection approach. Course #6: Risk Management in APD Projects Description: This course discusses the key risks and contract provisions that imply agency’s liabilities, explicates an owner’s role in APD project risk management, compares risks in APD vs. DBB, and reviews risk management best practices. Requisite/elective: Successful completion of APD Principles and .at least one experience level course. Objective: Understand key risks in APD projects Master the approach to evaluating risks Explore options to mitigate risks Apply risk management techniques to APD projects Length and means of delivery: 2-hour in person, video or live webinar.
|90
Teaching formats: lecture, case study, and discussion. The following are two discussion seeds. One primary risk stems from underground condition. Sufficient subsurface exploration can reduce such risk but extend the project design and procurement. By shifting the underground risk to contractors in an APD project, what level of subsurface exploration should MDOT SHA perform? The MDOT SHA has a better relationship with the utilities than the contractor. Letting the contractor deal with the utilities succumbs to the risk of utility permits that leads to a contractor’s claim for delay damages. From the MDOT SHA’s view, the claim is untenable as the contractor could have started earlier. What could the MDOT SHA have done differently to avert such delay? Modules: (1) Risk assessment and register (2) Risk allocation and contract provisions, (3) Best practices, (4) Case study.