Embed Size (px)
Citation preview

Efficiency Dynamics of Sugar Industry of Pakistan
Abdul Raheman PhD Scholar, Department of Management Sciences
COMSATS Institute of Information Technology Islamabad & Assistant Professor, University Institute of Management Sciences,
PMAS- Arid Agriculture University Rawalpindi Email: [email protected]
Dr. Abdul Qayyum Professor
Pakistan Institute of Development Economics, Islamabad Email: [email protected]
Dr. Talat Afza Professor, Department of Management Sciences COMSATS Institute of Information Technology, Defence Road off Raiwind Road, Lahore Pakistan
Email: [email protected]

Efficiency Dynamics of Sugar Industry of Pakistan
Abdul Raheman, Abdul Qayyum and Talat Afza
Abstract
Pakistan is the 15th largest producer of sugar in the world, 5th largest in terms of area under sugar cultivation and 60th in yield. The sugar industry is the 2nd
largest agro based industry which comprises of 81 sugar mills. With this scenario, Pakistan has to import sugar which exposes it to the effects of shortage and rising prices in the world. The present sugar crisis has opened up new avenues for researcher to analyze the performance and efficiency of the firms in this sector.
Total factor productivity plays a significant role in measuring the performance of a firm which ultimately affects the shareholder’s value. This paper analyzes the performance of sugar firms in Pakistan and estimate/calculate the Malmquist total factor productivity growth indices using non-parametric approach. TFP growth is further decomposed into technical, scale and managerial efficiency change using balanced panel data of 20 sugar firms listed on Karachi Stock Exchange for the period 1998 to 2007.
The results reflect a tormenting picture for the sugar industry. Overall sugar industry improved technological progress by 0.8% while managerial efficiency change put a negative effect on the productivity by a same percentage; as a result the overall total factor productivity during 1998-2007 remained almost static with a decline of 0.1%. If we see the TFP and its components in individual year for overall sugar industry, it presents divergent trend. The research suggests that sugar industry is facing serious productivity growth problems where no increase is recorded in total factor productivity during 1998 to 2007. The sugar industry is lacking in terms of managerial efficiency which could be explained by a general reduction in the quality of managerial decision-making among the best practice firms, Regardless of the reason for this decline, it has potentially serious implications for the longer-term financial viability of these sugar firms. The pattern of TFP growth tends to be driven more by technical change (or technical progress) rather than improvements in technical efficiency.
1. Introduction
Sugarcane is among the most valuable crops of Pakistan. It is a source of raw material for
entire sugar industry. At present, the sugar industry is second largest agro-based industry
in Pakistan. Production efficiency has become an important determinant for the future of
this industry in Pakistan due to declining competitiveness of the domestic sugar industry
because of increasing imports, and high costs of production. The Development and
adoption of new production technologies can improve productive efficiency. But at

present it is difficult due to limited income and credit to the out growers. Therefore, this
industry can improve the efficiency of its operations using currently available technology.
Measures of productivity, its growth and sources for the sugar industry of Pakistan play a
significant role for policy development. Productivity growth can be decomposed into
three components: technical change, scale effects, and changes in the degree of technical
efficiency (Coelli et al 2005). Technical change means progress in technology not only
physically in the form of improved machinery but also innovations in the knowledge
base. Regarding scale effects, it relate to economies in production. If there exist
increasing economies of scale it indicates that the production of additional outputs will
require a less than proportional increase in inputs. Improvements in the degree of
technical efficiency arise from situations where resources can be used more efficiently by
applying practices from the present stock of knowledge.
The most comprehensive measure of aggregate or sectoral productivity is Total Factor
Productivity (TFP). However, given the paucity of good data, this area of research has
remained quite limited in Pakistan (Ali, 2004). There are some studies on manufacturing
sector of Pakistan which include Raheman et. al. (2008), where total factor productivity
and its components are estimated using Malmquist Productivity growth index for major
manufacturing industries of Pakistan using aggregate firm level financial data but sugar
industry is not among the industries analyzed. The results of the study highlighted the
role of efficiency change in the TFP growth while deficiencies in terms of technological
progress. The efficiency of the large scale manufacturing sector of Pakistan was
examined by Mahmood et. al. (2007) using the stochastic production frontier approach
for periods 1995-96 and 2000-01. The results of this study showed that there was some
improvement in the efficiency of the large scale manufacturing sector, although the
magnitude was small. The results were mixed at the disaggregated level, whereas a
majority of industries had gained in terms of technical efficiency and some industries
were also weaker in terms of their efficiency level. , Afzal (2006) also estimated total
factor productivity for the large scale manufacturing sector from 1975 to 2001 using three
different approaches. Overall results showed that productivity was affected by many
factors like labor, capital, Gross National Product and per capita income. Further,
different economic models were applicable and predictable to the data of large scale

manufacturing sector of Pakistan and macroeconomic policies might help in improving
productivity of large scale manufacturing sector. Burki and Khan (2005) analyzed the
implications of allocative efficiency on resource allocation and energy substitutability for
large scale manufacturing. There are no reported productivity efficiency studies for the
sugar industry in Pakistan
This study attempts to fill this gap by estimating firm level efficiency and total factor
productivity growth and its components for a sample of twenty sugar firms in the sugar
industry and to assess the variations in TFP growth between firms and over Time. The
TFP growth is estimated for the period 1998 to 2007 using improved ideas of output and
inputs measures. This study, therefore, would provide a fresh perspective on the growth
of TFP in sugar sector for use in developing appropriate policy responses towards this
sector of Pakistan’s economy.
There are several techniques available, parametric and non-parametric, to estimate total
factor productivity. The most widely used example of a non-parametric technique is DEA
(Coelli, 1995; Seiford, 1996). Parametric techniques encompass stochastic frontier
techniques and Bayesian methods (Kalirajan and Shand 1999). In this paper we employ
DEA to estimate Malmquist TFP indices from panel data set. The reason for the choice of
DEA as the method of estimation is that the methodology has been employed widely to
conduct benchmarking analysis (for example, see Jaforullah and Whiteman 1999). Most
of the existing studies that employs panel data for estimation of efficiency and
productivity change reports estimates for the entire data period, while in the present study
our focus is on the annual estimates because we wish to examine how productivity
changes through time at the firm level.
The basic objective of this paper is to use the data envelopment analysis as a tool for the
measurement of total factor productivity growth for sugar industry and sugar firms. The
objective is also to decompose TFP growth into technical change, technical efficiency
change and scale efficiency change for understanding the source of productivity for
Pakistani sugar firms listed at Karachi Stock Exchange. This decomposition enables
policymakers to trace lagging productivity to particular factors. For example, if slowing
technical progress causes declining TFP growth, the production frontier can be shifted
upward through investment in research and development (R&D); if slow productivity

growth is traced primarily to deteriorating technical efficiency (TE), learning-by-doing
processes and managerial practices can be targeted for this purpose; if there will be
benefits from SE, production scales should be adjusted toward optimum values. The
specific objective of the study is to consider implications for policy and strategies for
improving sugar firm’s production efficiency. Policymakers can recommend policies that
improve the productivity of firms only if they understand the sources of variation in
productivity growth.
Studies on Productivity growth at the country level are usually based on the overall or
aggregate data; therefore, results of those studies are average of the overall economy
which comprises of different sectors. Hence contribution in each country’s productivity
has different proportion of sectors. This study uses financial data of sugar firms extracted
from annual reports obtained from different sources. This data allows examination of the
TFP performance of individual firms, which was not previously done.
The structure of this article is as follows. In the following section, an overview of sugar
industry of Pakistan is presented followed by the third section which describes the data
used in the analysis and methodology opted for analysis including discussion of input and
output variables. Then the results of our Malmquist TFP estimates are presented. In the
final section we discuss the results presented and provide conclusions
2. Overview of Sugar Industry of Pakistan
Sugarcane is an important industrial and cash crop in Pakistan. Pakistan is an important
sugarcane producing country and is ranked fifth in terms of area under sugar cultivation,
60th in yield and 15th in sugar production. Sugarcane is grown on over a million hectares
and provides the raw material for Pakistan’s 84 sugar mills which comprise the country’s
second largest agro-industry after textiles. The sugar sector constitutes 4.2% of
manufacturing. In size, the sugar sector matches the cement sector. Sugar industry has an
indirect socio-economic impact in overall terms which is significantly larger than its
direct contribution to GDP because of it’s backward (sugarcane growers) and forward
linkages (food processors) in the economy.
The sugar cane yield for some important countries of the world is given in the following
table No. 1

Table 1 Sugar Cane Yield of World
Country Cane Yield (T/ha)
Sugar Recovery (%) Sugar Yield (t/ha)
Australia
Egypt Brazil USA
Colombia Mexico
India Pakistan
World Avg.
100.4 110.8 68.4 80.2 80.5 79.5 66.9 49.0 64.4
13.8 11.5 14.5 11.7 11.5 11.6 9.9 9.2
10.6
13.85 12.74 9.91 9.38 9.26 9.22 6.64 3.54 6.82
Source: www.pakboi.gov.pk/word/Sugar%20.doc
According to the Table, Egypt is the highest in terms of sugarcane yield per hector which
is 110.8 tons per hector while the Pakistan is the lowest in terms of this yield. As far as
the sugar recovery is concerned, Brazil has the highest percentage and again Pakistan is
at the lowest. If we analyze the sugar yield from sugarcane, Australia has the highest
sugar yield in these countries and again Pakistan is at the lowest with 3.54 tons per
hector. It indicates that in Pakistan, improvements can be made in terms of sugarcane
yield, sugar recovery and sugar yield.
The area under cultivation has increased more rapidly than any other major crops. The
Table 2 presents the area production and yield during period 1997-98 to 2007-08.
Table No. 2 Pakistan Sugarcane Area and Yield
Year Area (000 Ha)
Produced 000 Tonnes
Yield per Hectare
Utilization % by Sugar Mills
1997-98 1,056.2 53,104 50.28 77.32
1998-99 1,155.1 55,191 47.78 77.90
1999-00 1,009.8 42,000 41.59 69.00
2000-01 960.0 43,620 45.40 67.47
2001-02 999.7 48,041 48.10 76.33
2002-03 1,099.7 52,049 47.30 80.28

2003-04 1,074.8 53,800 50.10 81.15
2004-05 966.4 43,533 45.00 73.74
2005-06 907.0 44,292 48.80 67.94
2006-07 1,033.0 54,871 53.12 73.78
2007-08 1160.0 61,503 53.02 -
2008-09 1045.0 55,385 53.00 -
Source: Pakistan Sugar Mills Association Annual Report: 2007, 2008
During the year 2007/08 production of sugar was estimated at 61.5Million Metric Ton
(MMT), an increase of 12% over previous year due to increase in area under cultivation
and yield. While during 2008/09 sugar production is estimated at 55MMT a decline of
10% over the previous year. According to press reports, Pakistan's 2009-10 sugar
production is expected around 3 millions tons as against 3.2 million tons in the last year.
The country's annual sugar consumption fluctuates between 3.6 to 4.2 million tons, but
industry's officials say it has gone down since October, because of higher prices and an
economic slowdown that resulted in lower demand from industries such as drink
producers. According to farmers association, the area under sugarcane cultivation has
gone down slightly, but they are expecting better yield because of the better varieties of
seeds. With this scenario, Pakistan has to import sugar which exposes it to the effects of
shortage and rising prices in the world.
Sugar consumption has been showing an increasing trend for the last 15 years. It has
increased from 2.89 million tons in 1995-96 to 3.95 million tons in 2005-06. One of the
many reasons behind this increase is rise in the total population of the country, which has
reached 170 million. For 2008-09, the overall sugar consumption is forecast at over 4
million tons, which is less than the target production. According to a rough estimate, the
country will need approximately 5.5 million tons of sugar to meet the local demand by
year 2020. It will require about 1.5 million hectares of area under cultivation which is at
present about 1 hector. The per capita sugar consumption is around 25kg per year which
is highest in the developing countries. The demand of sugar will increase in the coming
years at the rate of about 2.3% because of growth in the population which is about 2.3%.

The sugarcane production in terms of sugarcane crushed, sugar made and recovery
percentage is presented in the table 3 for period 1997-98 to 2006-07.
Table No.3 Sugarcane Production and Recovery
Year No. of Mills Cane Crushed
Tonnes
Sugar Made Tonnes Recovery
1997-98 71 41,062,268 3,548,953 8.64%
1998-99 71 42,994,911 3,530,931 8.21%
1999-2000 69 28,982,711 2,414,746 8.33%
2000-01 65 29,408,879 2,466,788 8.39%
2001-02 69 36,708,638 3,197,745 8.71%
2002-03 71 41,786,689 3,652,745 8.74%
2003-04 71 43,661,378 3,997,010 9.15%
2004-05 71 32,101,739 2,922,126 9.10%
2005-06 74 30,090,632 2,588,176 8.59%
2006-07 77 40,483,977 3,516,218 8.69% Source: Pakistan Sugar Mills Association Annual Report: 2007
This table is showing an in creasing trend in terms of sugarcane crushed and sugar made
except for years 2004-05 and 2005-06. During these two years Pakistan sugar industry
faced the crisis due to decline in area under cultivation which causes decline in
production and yield. Otherwise number of mills increased during this period.
After getting an overview of the sugar industry, we develop the methodology for
estimating productivity growth of sugar industry in Pakistan by examining this issue at
firm level
4. Methodology
Total factor productivity growth and its sources are estimated using Data Envelopment
Analysis approach. Malmquist productivity growth indices are calculated for twenty
sugar firms and also for sugar industry. The Malmquist Productivity Index also includes
the sources of productivity growth for these firms.
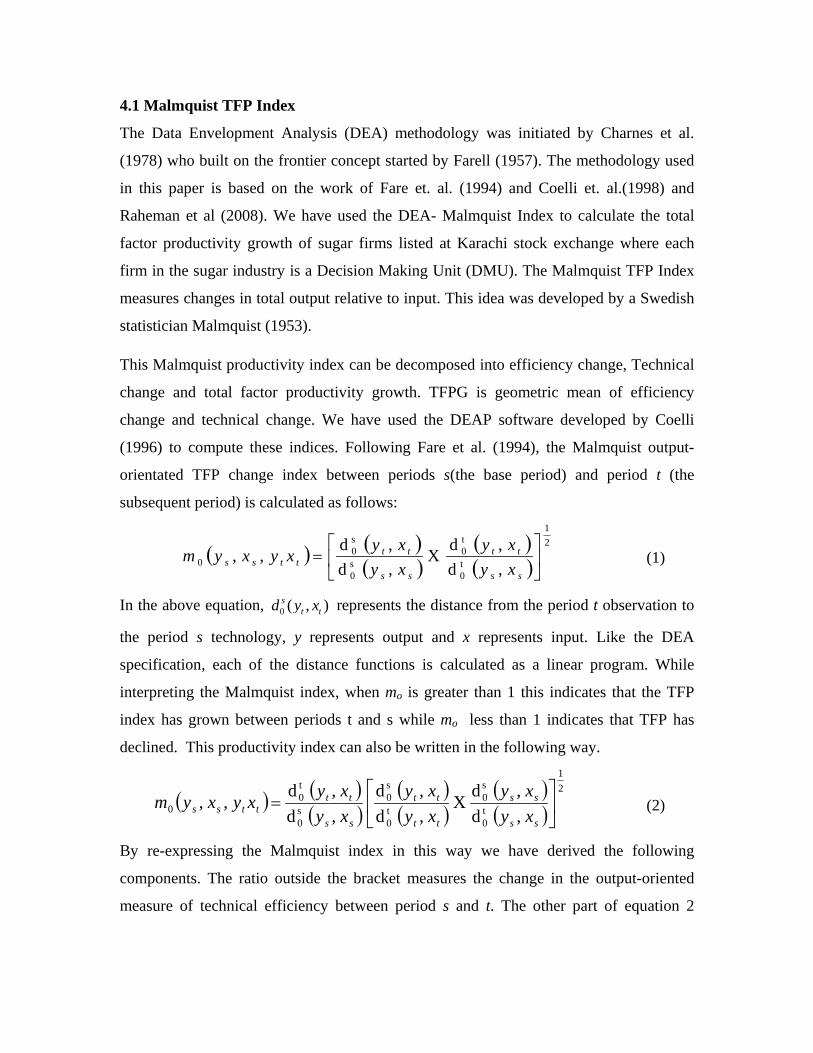
4.1 Malmquist TFP Index
The Data Envelopment Analysis (DEA) methodology was initiated by Charnes et al.
(1978) who built on the frontier concept started by Farell (1957). The methodology used
in this paper is based on the work of Fare et. al. (1994) and Coelli et. al.(1998) and
Raheman et al (2008). We have used the DEA- Malmquist Index to calculate the total
factor productivity growth of sugar firms listed at Karachi stock exchange where each
firm in the sugar industry is a Decision Making Unit (DMU). The Malmquist TFP Index
measures changes in total output relative to input. This idea was developed by a Swedish
statistician Malmquist (1953).
This Malmquist productivity index can be decomposed into efficiency change, Technical
change and total factor productivity growth. TFPG is geometric mean of efficiency
change and technical change. We have used the DEAP software developed by Coelli
(1996) to compute these indices. Following Fare et al. (1994), the Malmquist output-
orientated TFP change index between periods s(the base period) and period t (the
subsequent period) is calculated as follows:
2
1
t0
t0
s0
s0
0 , d
, d X
, d
, d , ,
ss
tt
ss
ttttss xy
xy
xy
xyxyxym (1)
In the above equation, 0 ( , )st td y x
represents the distance from the period t observation to
the period s technology, y represents output and x represents input. Like the DEA
specification, each of the distance functions is calculated as a linear program. While
interpreting the Malmquist index, when mo is greater than 1 this indicates that the TFP
index has grown between periods t and s while mo less than 1 indicates that TFP has
declined. This productivity index can also be written in the following way.
2
1
t0
s0
t0
s0
s0
t0
0 , d
, d X
, d
, d
, d
, d , ,
ss
ss
tt
tt
ss
ttttss xy
xy
xy
xy
xy
xyxyxym (2)
By re-expressing the Malmquist index in this way we have derived the following
components. The ratio outside the bracket measures the change in the output-oriented
measure of technical efficiency between period s and t. The other part of equation 2

measures the technical change which is measured as a geometric mean in the shift in the
production technology between two periods evaluated at xt and xs.
In the above model efficiency change (catching up effect) and a technical change
(frontier effect) as measured by shift in a frontier over the same period. The catching up
effect measures that a firm is how much close to the frontier by capturing extent of
diffusion of technology or knowledge of technology use. On the other side, frontier effect
measures the movement of frontier between two periods with regard to rate of technology
adoption. In DEA-Malmquist TFP Index does not assume all the firms are efficient
therefore, any firm can be performing less than the efficient frontier. In this methodology,
we will use the output oriented analysis because most of the firms and sectors have their
objectives to maximize output in the form of revenue or profit.
4.2 Input and Output Variables
Data Envelopment Analysis (DEA) approach can be applied to revenue producing firms.
This can be done by converting the financial performance measures to the firm’s
technical efficiency equivalents. While using input and output variables, we have
followed the methodology of Raheman et al (2008) which is also based on Feroz et. al.
(2003) and Wang (2006), who have converted the financial performance measures to the
firm’s technical efficiency equivalent using DuPont Model*. The DuPont model is a
technique for analyzing a firm’s profitability using traditional performance management
tools. For enabling this, DuPont model integrates income statement elements with
balance sheet
This process of measuring financial performance indicators can be converted into output
and input variables. Where, sales revenue can be used as output variable while cost of
goods sold, operating expenses, total assets and shareholder’s equity as input variables.
The above methodology helps us to logically convert performance ratios into efficiency.
In this way long term resources total assets and equity and short term resources cost of
goods sold and operating expenses are used to produce output in the form of sales
revenue.
* The Dupont formula and discussion regarding conversion of financial performance measures to firm’s technical efficiency equivalents can be seen in Raheman et. a. (2008)

4.3 Data
This study covers twenty major sugar manufacturing firms listed at Karachi Stock
Exchange. There are 38 sugar firms listed in the sugar and allied sector on Karachi stock
exchange. The data is collected for those firms which not only remained listed on the
KSE during 1998 to 2007, but also performed operations during this time period.
Considering the imitates of Data Envelopment Analysis Program (DEAP) only those
firms are included in analysis which have their equity in positive and their annual reports
were available for all the ten years from 1998 to 2007. Therefore, finally 20 firms are
included in the analysis. We have calculated the Total Factor Productivity Growth and its
components using Malmquist productivity Index for these twenty sugar firms. Data for
the study is obtained from secondary sources in the form of annual reports of the sugar
firms listed on Karachi Stock Exchange for the period 1998 to 2007.
5. Results and Discussion
The TFP Index technique is used to construct a grand frontier based on the data from
twenty sugar mills. Each firm is compared to the frontier. Technical efficiency is how
much closer a firm gets to the grand frontier and how much this grand frontier shift at
each firm observed input mix is called technical change.
We have calculated Malmquist total factor productivity and efficiency change, technical
change, pure technical efficiency and scale change component for all the sugar firms in
the sample.
5.1 Total Factor Productivity Growth in Sugar Sector
In Table 4, the bottom line shows that sugar industry experienced an overall negative
TFP growth of -0.1% during 1998-2007 which is insignificant. It means that during the
study period there is no substantial increase or decrease in the total factor productivity
growth. The analysis of sugar mills revealed that seven out of twenty mills enjoyed
positive TFP growth. The overall TFP growth is insignificant because the decline in
technical efficiency by 0.8% is offset by a same percentage increase in the technical
change. The overall technical change in 11 out of 20 firms is more than 1. Technical
efficiency change is the result of pure technical efficiency change and scale efficiency

change. With regards to pure efficiency change, it is one or more than one in most of the
firms but overall the pure efficiency of sugar industry declined by 0.7%. In case of Scale
efficiency change, value close to unity shows that most of the industries are operating at
optimum scale but again the scale efficiency of sugar industry declined by 0.5%.
Therefore, both Scale efficiency and pure technical efficiency have contributed to the
decline in efficiency change.
Table No. 4 Malmquist Index of Firm Means (1998-2007)
No. Firm TE Change
Tech. Change
PE Change
SE Change
TFP Change
1 Adam Sugar Mills Limited 0.967 1.021 0.978 0.988 0.987
2 Al Abass Sugar Mills limited 0.996 1.008 0.999 0.997 1.004
3 Al Noor Sugar Mills Limited 1.000 0.996 1.000 1.000 0.996
4 Chashma Sugar Mils Limited 1.000 0.993 1.000 1.000 0.993
5 Dewan Sugar Mills Limited 0.987 1.007 1.000 0.987 0.993
6 Faran Sugar Mills limited 1.000 0.980 1.000 1.000 0.980
7 Habib Sugar Mills Limited 1.000 1.012 1.000 1.000 1.012
8 Haseeb Waqas Sugar Mills Limited 0.983 1.005 0.987 0.996 0.988
9 Husein Sugar Mills Limited 1.001 0.999 0.998 1.003 0.999
10 JDW Sugar Mills Limited 1.000 0.999 1.000 1.000 0.999
11 Kohinoor Sugar Mills Limited 0.979 1.001 0.981 0.998 0.980
12 Mirpurkhas Sugar Mills Limited 0.998 1.058 0.995 1.002 1.056
13 Noon Sugar Mills Limited 0.991 0.999 0.989 1.002 0.990
14 Sanghar Sugar Mills Limited 1.011 1.008 1.007 1.004 1.019
15 Shahtaj Sugar Mills limited 1.000 0.999 1.000 1.000 0.999
16 Shakarganj Mills limited 1.002 1.112 1.000 1.002 1.114
17 Sind Abadgar Sugar Mills Limited 1.000 1.022 1.000 1.000 1.022
18 Tandlianwala Sugar Mills limited 1.000 1.008 1.000 1.000 1.008
19 The Frontier Sugar Mills & Distillery Limited
0.910 0.998 1.000 0.910 0.908
20 The Thal Industries Corporation Limited 1.015 0.937 1.000 1.015 0.951
Mean Sugar Sector 0.992 1.008 0.997 0.995 0.999
In the above table, the comparison of total factor productivity change in different firms
shows that Shakarganj Mills Limited on average has the highest growth in TFP (11.4%)
during 1998 to 2007, followed by the Mirpurkhas Sugar Mills Limited that has (5.6%)
total factor productivity growth. The worst performer in terms of total factor productivity
growth is the Frontier Sugar Mills & Distillery Limited and the Thal Industries

Corporation Limited. Total factor productivity of these two mills decreased on average
by -9.2%and -4.9% respectively.
The results presented in table 5 show that TFP growth has been volatile with little
apparent trend. The changes in TFP growth closely follow changes in technical progress
with changes in technical efficiency. The years 2002 and 1999 appear to be the years
where the total factor productivity growth was the highest at 5.3% and 5.2% respectively.
During years 2001 and 2007, the TFP growth is lowest at 4.7% and 4.4% respectively. If
we analyze the efficiency change over period, it indicates that during year 2003 the
efficiency increased by 3.9% while it decreased by -5.9% during 2006. On the other hand
the technological change increased by 8.7% during year 2002 where the TFP growth is
also maximum. Similarly technical change is negative in the similar years where TFP
growth was negative i.e. year 2001 and 2007.
Table No. 5
Malmquist Index of Yearly Means of All Sugar Firm (1998-2007)
Year EFFCH TECHCH PECH SECH TFPCH
1999 0.998
1.054
0.994
1.005
1.052
2000 0.957
1.036
0.970
0.986
0.991
2001 1.005
0.948
1.016
0.989
0.953
2002 0.969
1.087
0.965
1.004
1.053
2003 1.039
0.999
1.023
1.016
1.038
2004 1.024
0.960
1.015
1.009
0.983
2005 0.985
1.026
0.990
0.995
1.011
2006 0.941
1.022
0.985
0.956
0.962
2007 1.010
0.947
1.014
0.996
0.956
Mean 0.992
1.008
0.997
0.995
0.999
These above results show an overall picture of TFP growth, efficiency change and
technical change for the sugar industry. For firm level analysis, these measures of
productivity need to be analyzed at firm level during period 1998 to 2007.

5.2 Total Factor Productivity Growth
The comparative results of individual firms in terms of productivity for each year during
1998-2007 are presented in table 6 (Appendix), which explains the total factor
productivity change for all firms on yearly basis and provides a comprehensive
understanding about the performance of different firms.
In the first year of analysis, The Thal Industries Corporation Limited is the best
performer among all the firms with TFP growth 24.2% followed by The Frontier Sugar &
Distillery Limited where the productivity increased by 19.9%. Habib sugar mill is the
worst performer with decline in TFP growth by -6.6%. This year was also the most
favorable for sugar industry where the TFP of 15 out of 20 firms increased and TFP for
sugar industry increased by 5.2%. During year 2000, the total factor productivity of 10
out of 20 firms increased with the Husein sugar mills limited has the highest TFP growth
of 9.6%. In the next year 2001, the TFP declined for thirteen sugar mills and the
Chashma sugar mill was the worst performer in terms of TFP growth which declined by
25.2% and the TFP declined by 4.7% for the overall sugar industry which is the worst
performance for the overall sugar industry during the study period. The next three years
2002, 2003 and 2004 were relatively better years for the sugar firms where the TFP
increased for 12 out of 20 firms in all the three years. Mirpurkhas sugar mill was the best
performer during year 2002 while Faran sugar mill was the best performer during year
2003 and Chashma sugar mill during 2004. TFP growth for the sugar industry increased
during 2002 and 2003 while declined during 2004. Shakarganj sugar mill played a
leading role in total factor productivity growth with highest (best performance) 76.6%
during year 2005. Year 2006 was suitable for nine sugar mills in terms of total factor
productivity with highest TFP growth for Dewan sugar mill at 35.9%. In this year the
TFP for the sugar industry declined by 3.8%. Year 2006-07 was a crucial year for the
sugar industry where the productivity change for fourteen out of twenty firms declined
and the TFP for the sugar industry declined by 4.4%. In this year the best performer was
the Chashma sugar mill with a growth of 23% in total factor productivity. These results
serve to show that firm-level results can display a great deal of variations.
In terms of total factor productivity change, Shakarganj sugar mill has relatively more
stable results. In this firm TFP change in seven out of nine years is greater than unity.

Due to this reason, this sectors topped in ranking in terms of total factor productivity. As
discussed earlier year 2006-07 was the most crucial year for most of the firms where TFP
declined for fourteen firms in the sample. If we exclude this year from our analysis, the
overall TFP growth for the manufacturing sector would increase to 0.53% which is now -
0.1% including year 2007. The Frontier sugar mill is the worst performer in terms of TFP
growth followed by the Thal industries corporation limited which has negative TFP
growth for six out of nine years.
The total factor productivity growth has been decomposed into technical efficiency
change also called managerial efficiency and technical (technological adoption) change.
These two sources of productivity are presented in the next section.
5.3 Technical Efficiency Growth
Technical efficiency change can make use of existing input to produce more of same
product. As one gets more experience in producing some product, it becomes more and
more efficient in it. In order to understand the contribution made by technical efficiency
in the productivity growth, a firm-wise technical efficiency movement is presented in
Table 7(Appendix).
In general, these results suggest that technical efficiency is an important contributor in
dampening the total factor productivity growth of the sugar industry. The average
efficiency change for eight mills is less than one while for nine firms it is equal to one
which means there is no change in the managerial efficiency during study period for these
firms. During 1999, being the first year of analysis, the technical efficiency change for
eight firms is less than one and Habib sugar mills the worst performer with a decline in
efficiency change by -8.7%. In this year six mills did not show any change in their
efficiency. Managerial efficiency further declined in year 2000, where 14 mills have their
efficiency change in negative and three mills have no change in efficiency. During this
year AL Abass sugar mill was the worst performer with a decline in efficiency change by
13.8%. Year 2001 was relatively better for the sugar industry in terms of managerial
efficiency where thirteen mills were having their efficiency change equal to or more than
one. The efficiency change for sugar industry declined during years 2002, 2005 and 2006

by -3.1%, -1.5% and -5.9% respectively. The maximum decline in the managerial
efficiency for the sugar industry was during Year 2006. On the other side efficiency
change increased during years 2003, 2004 and 2007.
The firm level changes in managerial efficiency shows that many mills remain static as
their efficiency change remain equal to one in most of the years. These firms include
Faran sugar mills, JDW sugar mills and Shahtaj sugar mills limited. Thal industries
corporation limited which is on top in ranking according to managerial efficiency based
on aggregate efficiency change is also more stable firm where efficiency change id more
than one in seven out of nine years.
5.4 Technology Adoption
The second important source of total factor productivity growth is the change in the
technology. As Squires and Reid (2004) expressed that technological change is the
development of new technologies or new products to improve and shift production
frontier upward.
Table 8 (Appendix) presents the comparative technical change for twenty sugar firms
during period 1998 to 2007. In general, the technical change can be seen in eleven firms
where Shakarganj mills limited at the top with 11.2% change followed by the Mirpurkhas
sugar mills limited with 5.8%. . In year 1999, the comparative technical change shows
positive change where all mills have their technical change more than one and Thal
industries corporation top in ranking followed by the Chashma sugar mills limited. In this
year technical change increased by 5.4% for the overall sugar industry. Year 2000 was
also better in terms of technical change where it was positive for sixteen mills and sugar
industry overall recorded a 3.6% technical progress. In this year Haseeb Waqas sugar
mills limited was the best performer where technical change increased by 13% while
Shahtaj sugar mills limited was the worst performer with decline in technical progress by
10.7%. Years 2001 and 2007 were the worst in terms of technical progress where it
declined by 5.2% and 5.3% respectively. In these years only three to four mills were
having their technical change in positive. The best year according to technical progress
was the year 2002 where the technical change increased by 8.7% for the overall sugar
industry and eighteen firms have their technical change above one. In this year
Mirpurkhas sugar mill was highest in ranking with a progress of 69% followed by Husein

sugar mills limited with 36.5%. JDW sugar mill was the worst performer where the
technical change declined by 16.7%. Shakarganj sugar mill was the leading one during
year 2004 and 2005, where the technical progress increased by 20.3% and 76.6%.
Further, increase of 76.6% is the maximum increase in any mill in a year during period
1998 to 2007.
Table 9 (Appendix) presents the ranking of all sugar firms in terms of total factor
productivity growth, technical efficiency change and technical change. According to the
ranking, Shakarganj mills limited is top in ranking according to TFP growth and technical
change while at number three according to efficiency change. Mirpurkhas sugar mill is
although next in ranking according to TFP growth and technical change but at number
thirteen according to managerial efficiency change. Similar type of ranking is for the Sind
Abadgar sugar mill which is at number three in ranking as per TFP growth and technical
change but at number eleven according to efficiency change. This indicates that technical
change is the major factor which affects the total factor productivity growth for the sugar
firms. The Frontier sugar mills and distillery limited is the laggard firm according to
efficiency change and technical change. The other laggard firm is The Thal Industries
Corporation limited according to TFP growth and technical change but highest in ranking
according to efficiency change. This also indicates that for sugar firms technical change
is the major source of total factor productivity.
6. Conclusion
Research on productivity growth is very important because economic growth cannot be
sustainable without improvement in the Total Factor Productivity. From a policy point of
view, the assessment of TFP growth is important as it serves as a guide for resource
allocation and investment decisions. This paper applied DEA approach to estimate the
total factor productivity growth, technical efficiency change and technological progress
in Pakistan’s sugar industry using panel data for twenty sugar firms from 1998 to 2007.
Malmquist productivity index was used to measure the productivity growth. Following
Fare et. al. (1994), this paper decomposed the Malmquist productivity index into
technical efficiency and technical change component. This decomposition helped us to
identify improvement in efficiency and contribution of technological progress and

innovation to productivity growth in sugar industry. Most of the studies of productivity
growth efficiency which are based on panel data discuss the estimates of overall sample
or sector. However, we have presented the estimated TFP growth, efficiency change and
technical change at each firm level and for each year during 1998 to 2007 which shows
that these estimates varies widely at firm level during the data period.
The empirical estimates on the performance of sugar industry yielded several striking
results. The Malmquist TFP results reflect a tormenting picture for the sugar industry.
Overall sugar industry improved technological progress by 0.8% while managerial
efficiency change put a negative effect on the productivity by a same percentage; as a
result the overall total factor productivity during 1998-2007 remained almost static with a
decline of 0.1%. If we see the TFP and its components in individual year for overall sugar
industry, it presents divergent trend.
The results from individual industries show that static TFP growth is mainly contributed
by technical efficiency which declined for nine sugar firms and remained equal to one for
nine sugar firms during period 1998 to 2007, while the technical change is positive for
eleven out of twenty sugar firms. It suggests that sugar industry is lacking in terms of
managerial efficiency which could be explained by a general reduction in the quality of
managerial decision-making among the best practice firms, Regardless of the reason for
this decline, it has potentially serious implications for the longer-term financial viability
of these sugar firms.
Further, year wise analysis highlights that there is divergence in all sugar firms over
1998-2007 in terms of total factor productivity, technical efficiency and technical change.
Except few firms which are relatively stable include Shakarganj mills limited and Al
Abass sugar mills limited, all sugar firms have a mix trend over 1998-2007 which affects
the productivity and ranking of firms.
The pattern of TFP growth tends to be driven more by technical change (or technical
progress) rather than improvements in technical efficiency. Shakarganj Mills Limited is
at the top in ranking in terms of TFP due to highest technical change and also due to
better performance in terms of managerial efficiency change. This firm has also
performed better in terms of stability over the period 1998 to 2007, where the total factor

productivity increased for seven out of nine years. Mirpurkhas sugar mill comes next in
ranking where again the major source is technical change. Sind Abadgar sugar mill and
Habib sugar mill are also relatively better performer where the technical change is the
main source while Sanghar sugar mill is also among the top ranking firms where the main
sources is managerial efficiency. The Frontier sugar mill is among the worst performers
in terms of productivity over 1998 to 2007 where the problem lies in managerial
efficiency and also non adoption of new technologies. Similarly, The Thal Industries is
also one of the laggard firms in terms of total factor productivity where the major source
is non adoption of new technologies although top in ranking in terms of efficiency
change.
The research suggests that the Pakistani sugar industry is facing serious productivity
growth problems where no increase is recorded in total factor productivity during 1998 to
2007. Therefore, this industry must increase total factor productivity in most of the firms
under study and efforts must be made to provide a stable pattern to the productivity
growth. In sugar industry, there is a need to improve both technical efficiency and
technological progress. Improvement in technical efficiency requires improvement in
quality of input like capital and labor. The management aspect is also very important in
terms of capital. These strategies will improve the technical change as well which also
relies on managing technology and adoption capability of firms. The research and
development (R & D) activities can play a vital role to bring technological progress.
Although there is very little increase in the technical change but for further considerable
increase in the productivity, efforts could be made to increase the research and
development (R & D) activities in this industry. Therefore firms in the sugar industry
need greater investment in (R & D) activities and adoption of new technologies. Increase
in skilled worker through human resource development reduces skills shortage which
hampers technological adoption.
References:
Afzal, M. (2006). Some New Production Measurement Methods for Large-Scale Manufacturing Sector of Pakistan. PhD Dissertation (unpublished) submitted to National College of Business Administration & Economics. Agricultural Economics, 78(2):331–8.
Ali, S (2004), Total factor productivity growth in Pakistan’s agriculture: 1960-1996. The Pakistan Development Review, Volume 43, No. 4, pp.493-513.
Burki, A. A. and Mahmood ul Hassan, K. (2005). Effects of Allocative Inefficiency on Resource Allocation and Energy Substitution in Pakistan’s Manufacturing. Lahore University of Management Sciences. (CMER Working Paper No. 04-30).
Charnes, A., Cooper, W.W. and Rhodes, E. (1978). Measuring the Efficiency of Decision Making Units. European Journal of Operations Research, 2, 429-444
Coelli, T. (1996) A guide to DEAP version 2.1: A Data Envelopment Analysis (Computer) program. Centre for Efficiency and Productivity Analysis working paper 96/08 Armidale, NSW, Department of Econometrics, University of New England, Australia.
Coelli, T. J., D. S. P. Rao, C. J. O’Donnell and G. E. Battese. 2005. An Introduction to Efficiency and Productivity Analysis, 2nd ed. New York: Springer.
Coelli, T., Rao, D.S.P. and Battase, G.E. (1998). An Introduction to Efficiency and Productivity Analysis. Boston: Kluwer Academic Publishers.
Coelli, T.J. 1995, `Recent developments in frontier modelling and e¤ciency measurement', Australian Journal of Agricultural Economics, vol. 39, pp. 219^45.
Fare, R., Grosskopf, S., Norris, M., & Zhang, Z. (1994). Productivity Growth, Technical Progress, and Efficiency Change in Industrialized Countries. The American Economic Review, 84, 66-83.
Farrell, M.J. (1957). The Measurement of Productive Efficiency. Journal of the Royal Statistical Society, 120, 253-81.
Feroz, E.H., Kim, S. and Raab, R.L. (2003). Financial Statement Analysis: A Data Envelopment Analysis Approach. Journal of Operational Research Society. 54: 48-58.
Jaforullah, M. and Whiteman, J. 1999, `Scale e¤ciency in the New Zealand dairy industry: a non-parametric approach', Australian Journal of Agricultural and Resource Economics, vol. 43, pp. 523-42.
Kalirajan, K.P. and Shand, R.T. (1999), `Frontier production functions and technical efficiency measures', Journal of Economic Surveys, vol. 13, pp. 149^72.
Mahmood, T., Ghani, E. and Din, M. (2007). Efficiency of Large Scale Manufacturing In Pakistan: A production Frontier Approach. Working paper, Pakistan Institute of Development Economics. 27.
Malmquist, S. (1953). Index Numbers and Indifference Curves. Trabajos de Estatistica, 4, 1, 209-42.
Pakistan Sugar Mills Association of Pakistan, (2007), “Annual Report -2007” Pakistan Sugar Mills Association of Pakistan, (2008), “Annual Report -2008” Raheman A., Talat A., Abdul, Q. and Mahmood A. B. (2008), “Estimating Total Factor
Productivity and its Components: Evidence from Major Manufacturing Industries of Pakistan” Pakistan Development Review, vol.47, No.4.

Seiford, L.M. (1996), `Data Envelopment Analysis: the evolution of the state of the art', Journal of Productivity Analysis, vol. 7, pp. 99-137.
Squires, D. and C., Reid, (2004). "Using Malmquist Indices to Measure Changes in TFP of Purse-Seine Vessels While Accounting for Changes in Capacity Utilisation, The Resource Stock and the Environment." .SCTB17 Forum Fisheries Agency, Working Paper, pp.1-15 Wang, J.C. (2006), “Corporate performance efficiency investigated by data envelopment
analysis and balanced scorecard”, Journal of American Academy of Business, Vol. 9 No. 2, pp. 312-8.
www.pakboi.gov.pk/word/Sugar%20.doc

22
Table No. 6
Comparative Total Factor Productivity Change in all Sugar Firms During (1998-2007) Sector 1999 2000 2001 2002 2003 2004 2005 2006 2007 Mean
Adam Sugar Mills Limited 1.101
0.914
1.277
1.082
0.916
0.976
1.020
0.865
0.811
0.987
Al Abass Sugar Mills limited 1.046
0.952
1.056
0.894
1.128
1.087
0.882
1.016
1.000
1.004
Al Noor Sugar Mills Limited 1.022
1.005
0.947
0.944
1.032
0.990
1.051
1.012
0.967
0.996
Chashma Sugar Mils Limited 1.118
0.984
0.748
1.199
0.769
1.222
0.966
0.852
1.230
0.993
Dewan Sugar Mills Limited 1.030
0.988
0.995
0.818
1.141
1.062
0.967
1.091
0.888
0.993
Faran Sugar Mills limited 1.034
1.070
1.045
0.768
1.668
0.591
0.892
1.359
0.789
0.980
Habib Sugar Mills Limited 0.934
1.020
0.965
0.925
1.063
1.135
0.996
1.125
0.971
1.012
Haseeb Waqas Sugar Mills Limited 0.992
1.046
0.885
1.138
1.019
1.001
1.067
0.822
0.964
0.988
Husein Sugar Mills Limited 1.053
1.096
0.770
1.667
0.794
1.013
0.999
0.874
0.956
0.999
JDW Sugar Mills Limited 1.069
0.892
1.284
0.792
1.072
0.998
1.036
0.994
0.923
0.999
Kohinoor Sugar Mills Limited 1.079
1.023
0.832
1.154
0.888
1.082
1.040
0.979
0.804
0.980
Mirpurkhas Sugar Mills Limited 0.976
1.025
1.003
1.812
0.943
0.879
1.175
1.064
0.864
1.056
Noon Sugar Mills Limited 1.059
1.054
0.935
1.079
0.963
1.007
0.996
0.851
0.984
0.990
Sanghar Sugar Mills Limited 1.066
0.976
1.051
0.716
1.249
1.131
0.963
1.213
0.919
1.019
Shahtaj Sugar Mills limited 1.062
0.893
0.966
1.164
0.921
0.985
0.964
0.979
1.082
0.999
Shakarganj Mills limited 1.020
0.961
1.080
1.024
1.085
1.203
1.766
0.984
1.070
1.114
Sind Abadgar Sugar Mills Limited 0.986
1.016
0.974
0.929
1.121
0.871
1.015
1.298
1.039
1.022
Tandlianwala Sugar Mills limited 0.995
0.978
0.941
1.184
0.840
1.015
1.047
1.013
1.089
1.008
The Frontier Sugar Mills & Distillery Limited 1.199
1.005
0.762
1.146
1.124
1.202
0.855
0.387
0.892
0.908
The Thal Industries Corporation Limited 1.242
0.944
0.762
1.210
1.368
0.565
0.787
0.970
0.999
0.951
Mean 1.052
0.991
0.953
1.053
1.038
0.983
1.011
0.962
0.956
0.999

23
Table No. 7
Comparative Efficiency (Managerial Efficiency) Change in all Sugar Firms during (1998-2007) Sector 1999 2000 2001 2002 2003 2004 2005 2006 2007 Mean
Adam Sugar Mills Limited 1.000
0.981
1.019
1.000
0.966
0.990
0.996
0.884
0.877
0.967
Al Abass Sugar Mills limited 0.992
0.862
1.169
0.839
1.158
1.030
0.857
1.057
1.061
0.996
Al Noor Sugar Mills Limited 1.000
0.985
0.995
0.891
1.076
0.951
1.025
1.052
1.034
1.000
Chashma Sugar Mils Limited 1.000
1.000
0.886
1.128
0.814
1.227
0.945
0.862
1.229
1.000
Dewan Sugar Mills Limited 0.984
0.948
1.071
0.789
1.115
1.026
0.936
1.085
0.968
0.987
Faran Sugar Mills limited 1.000
1.000
1.000
0.825
1.212
1.000
1.000
1.000
1.000
1.000
Habib Sugar Mills Limited 0.913
0.920
1.083
0.862
1.094
1.115
0.917
1.085
1.051
1.000
Haseeb Waqas Sugar Mills Limited 0.954
0.925
1.035
1.063
0.987
1.005
1.041
0.820
1.043
0.983
Husein Sugar Mills Limited 1.016
1.071
0.819
1.221
0.956
1.038
0.967
0.953
1.012
1.001
JDW Sugar Mills Limited 1.000
0.882
1.134
0.951
1.052
1.000
1.000
1.000
1.000
1.000
Kohinoor Sugar Mills Limited 1.038
0.947
0.930
1.082
0.913
1.075
0.984
1.011
0.857
0.979
Mirpurkhas Sugar Mills Limited 0.919
1.012
1.053
1.072
0.952
0.843
1.136
1.097
0.933
0.998
Noon Sugar Mills Limited 1.029
0.961
1.049
1.000
1.000
1.000
0.964
0.874
1.052
0.991
Sanghar Sugar Mills Limited 1.042
0.935
1.116
0.664
1.292
1.127
0.983
1.066
1.000
1.011
Shahtaj Sugar Mills limited 1.000
1.000
0.977
1.023
1.000
1.000
1.000
1.000
1.000
1.000
Shakarganj Mills limited 0.965
0.912
1.155
0.968
1.033
1.000
1.000
1.000
1.000
1.002
Sind Abadgar Sugar Mills Limited 0.944
0.992
1.025
0.878
1.143
0.924
1.122
1.000
1.000
1.000
Tandlianwala Sugar Mills limited 0.961
0.923
1.011
1.115
0.870
0.987
1.008
1.025
1.127
1.000
The Frontier Sugar Mills & Distillery Limited 1.135
0.890
0.870
1.074
1.156
1.213
0.871
0.396
0.935
0.910
The Thal Industries Corporation Limited 1.097
1.013
0.810
1.136
1.119
1.000
1.000
0.914
1.092
1.015
Mean 0.998
0.957
1.005
0.969
1.039
1.024
0.985
0.941
1.01
0.992

24
Table No. 8
Comparative Technical Change in all Sugar Firms during (1998-2007) Sector 1999 2000 2001 2002 2003 2004 2005 2006 2007 Mean
Adam Sugar Mills Limited 1.101
0.932
1.252
1.082
0.948
0.986
1.024
0.979
0.925
1.021
Al Abass Sugar Mills limited 1.054
1.104
0.903
1.066
0.974
1.056
1.030
0.961
0.943
1.008
Al Noor Sugar Mills Limited 1.022
1.021
0.952
1.059
0.959
1.041
1.026
0.962
0.935
0.996
Chashma Sugar Mils Limited 1.118
0.984
0.844
1.063
0.945
0.996
1.022
0.988
1.001
0.993
Dewan Sugar Mills Limited 1.047
1.042
0.929
1.038
1.023
1.035
1.033
1.005
0.917
1.007
Faran Sugar Mills limited 1.034
1.070
1.045
0.931
1.376
0.591
0.892
1.359
0.789
0.980
Habib Sugar Mills Limited 1.024
1.109
0.891
1.073
0.972
1.018
1.086
1.037
0.924
1.012
Haseeb Waqas Sugar Mills Limited 1.039
1.130
0.855
1.071
1.032
0.996
1.025
1.003
0.925
1.005
Husein Sugar Mills Limited 1.036
1.023
0.941
1.365
0.831
0.976
1.033
0.917
0.945
0.999
JDW Sugar Mills Limited 1.069
1.012
1.132
0.833
1.019
0.998
1.036
0.994
0.923
0.999
Kohinoor Sugar Mills Limited 1.039
1.080
0.895
1.067
0.972
1.007
1.056
0.967
0.938
1.001
Mirpurkhas Sugar Mills Limited 1.062
1.013
0.953
1.691
0.990
1.043
1.035
0.970
0.926
1.058
Noon Sugar Mills Limited 1.030
1.097
0.892
1.079
0.963
1.007
1.033
0.974
0.936
0.999
Sanghar Sugar Mills Limited 1.024
1.043
0.941
1.079
0.966
1.004
0.980
1.138
0.919
1.008
Shahtaj Sugar Mills limited 1.062
0.893
0.988
1.137
0.921
0.985
0.964
0.979
1.082
0.999
Shakarganj Mills limited 1.057
1.054
0.935
1.058
1.050
1.203
1.766
0.984
1.070
1.112
Sind Abadgar Sugar Mills Limited 1.044
1.024
0.950
1.058
0.981
0.942
0.904
1.298
1.039
1.022
Tandlianwala Sugar Mills limited 1.036
1.059
0.931
1.063
0.965
1.028
1.040
0.989
0.966
1.008
The Frontier Sugar Mills & Distillery Limited 1.056
1.129
0.876
1.067
0.972
0.991
0.982
0.976
0.954
0.998
The Thal Industries Corporation Limited 1.132
0.931
0.940
1.065
1.223
0.565
0.787
1.061
0.916
0.937
Mean 1.054
1.036
0.948
1.087
0.999
0.96
1.026
1.022
0.947
1.008

25
Table No. 9
Ranking of Sugar Firms based on Malmquist TFP and its Components Ranking
Industry
TFP Change Industry
TE Change Industry
Tech. Change
1
Shakarganj Mills limited 1.114
The Thal Industries Corporation Limited 1.015
Shakarganj Mills limited 1.112
2
Mirpurkhas Sugar Mills Limited 1.056
Sanghar Sugar Mills Limited 1.011
Mirpurkhas Sugar Mills Limited 1.058
3
Sind Abadgar Sugar Mills Limited 1.022
Shakarganj Mills limited 1.002
Sind Abadgar Sugar Mills Limited 1.022
4
Sanghar Sugar Mills Limited 1.019
Husein Sugar Mills Limited 1.001
Adam Sugar Mills Limited 1.021
5
Habib Sugar Mills Limited 1.012
Al Noor Sugar Mills Limited 1.000
Habib Sugar Mills Limited 1.012
6
Tandlianwala Sugar Mills limited 1.008
Chashma Sugar Mils Limited 1.000
Al Abass Sugar Mills limited 1.008
7
Al Abass Sugar Mills limited 1.004
Faran Sugar Mills limited 1.000
Sanghar Sugar Mills Limited 1.008
8
Husein Sugar Mills Limited 0.999
Habib Sugar Mills Limited 1.000
Tandlianwala Sugar Mills limited 1.008
9
JDW Sugar Mills Limited 0.999
JDW Sugar Mills Limited 1.000
Dewan Sugar Mills Limited 1.007
10
Shahtaj Sugar Mills limited 0.999
Shahtaj Sugar Mills limited 1.000
Haseeb Waqas Sugar Mills Limited 1.005
11
Al Noor Sugar Mills Limited 0.996
Sind Abadgar Sugar Mills Limited 1.000
Kohinoor Sugar Mills Limited 1.001
12
Chashma Sugar Mils Limited 0.993
Tandlianwala Sugar Mills limited 1.000
Husein Sugar Mills Limited 0.999
13
Dewan Sugar Mills Limited 0.993
Mirpurkhas Sugar Mills Limited 0.998
JDW Sugar Mills Limited 0.999
14
Noon Sugar Mills Limited 0.990
Al Abass Sugar Mills limited 0.996
Noon Sugar Mills Limited 0.999
15
Haseeb Waqas Sugar Mills Limited 0.988
Noon Sugar Mills Limited 0.991
Shahtaj Sugar Mills limited 0.999
16
Adam Sugar Mills Limited 0.987
Dewan Sugar Mills Limited 0.987
The Frontier Sugar Mills & Distillery Limited
0.998
17
Faran Sugar Mills limited 0.980
Haseeb Waqas Sugar Mills Limited 0.983
Al Noor Sugar Mills Limited 0.996
18
Kohinoor Sugar Mills Limited 0.980
Kohinoor Sugar Mills Limited 0.979
Chashma Sugar Mils Limited 0.993
19
The Thal Industries Corporation Limited 0.951
Adam Sugar Mills Limited 0.967
Faran Sugar Mills limited 0.980
20
The Frontier Sugar Mills & Distillery Limited
0.908
The Frontier Sugar Mills & Distillery Limited
0.910
The Thal Industries Corporation Limited 0.937