Embed Size (px)
Citation preview

NBER WORKING PAPER SERIES
EFFECTS OF WELFARE REFORM ON VOCATIONAL EDUCATION AND TRAINING
Dhaval M. DaveNancy E. Reichman
Hope CormanDhiman Das
Working Paper 16659http://www.nber.org/papers/w16659
NATIONAL BUREAU OF ECONOMIC RESEARCH1050 Massachusetts Avenue
Cambridge, MA 02138January 2011
This project was funded by the National Institute of Child Health and Human Development (Grant#R01HD060318). The authors are grateful for helpful information on welfare policies vis-à-vis educationfrom Julie Strawn and Elizabeth Lower-Basch, as well as Gilbert Crouse and Don Oellerich of theDepartment of Health and Human Services' Office of The Assistant Secretary for Planning and Evaluation,for helpful comments from Jennifer Kohn, and for valuable research assistance from Oliver Joszt.The views expressed herein are those of the authors and do not necessarily reflect the views of theNational Bureau of Economic Research.
NBER working papers are circulated for discussion and comment purposes. They have not been peer-reviewed or been subject to the review by the NBER Board of Directors that accompanies officialNBER publications.
© 2011 by Dhaval M. Dave, Nancy E. Reichman, Hope Corman, and Dhiman Das. All rights reserved.Short sections of text, not to exceed two paragraphs, may be quoted without explicit permission providedthat full credit, including © notice, is given to the source.

Effects of Welfare Reform on Vocational Education and TrainingDhaval M. Dave, Nancy E. Reichman, Hope Corman, and Dhiman DasNBER Working Paper No. 16659January 2011JEL No. I3,I38,J24
ABSTRACT
Exploiting variation in welfare reform across states and over time and using relevant comparison groups,this study estimates the effects of welfare reform on an important source of human capital acquisitionamong women at risk for relying on welfare: vocational education and training. The results indicatethat welfare reform reduced enrollment in full-time vocational education and had no significant effectson part-time vocational education or participation in other types of work-related courses, though thereis considerable heterogeneity across states with respect to the strictness of educational policy and thestrength of work incentives under welfare reform. In addition, we find heterogeneous effects by prioreducational attainment. We find no evidence that the previously-observed negative effects of welfarereform on formal education (including college enrollment), which we replicated in this study, havebeen offset by increases in vocational education and training.
Dhaval M. DaveBentley UniversityDepartment of Economics175 Forest Street, AAC 195Waltham, MA 02452-4705and [email protected]
Nancy E. ReichmanRobert Wood Johnson Medical SchoolUniversity of Medicine and Dentistry of New Jersey97 Paterson St., Room 435New Brunswick, NJ [email protected]
Hope CormanRider University2083 Lawrenceville RoadLawrenceville, NJ 08648and [email protected]
Dhiman DasRobert Wood Johnson Medical SchoolUniversity of Medicine and Dentistry of New Jersey97 Paterson St., Room 435New Brunswick, NJ [email protected]

2
Introduction
A major goal of the Personal Responsibility and Work Opportunity Reconciliation Act
(PRWORA) of 1996 was to move recipients off of cash assistance and into the labor force. The
legislation imposes time limits on welfare receipt, expands work requirements for recipients, and
allows states to impose stricter sanctions for non-compliance with work requirements and other
rules. PRWORA’s “work first” approach de-emphasizes education and training, representing a
departure from previous approaches that encouraged human capital formation as a strategy for
achieving self-sufficiency. Although minor mothers are required to attend high school or training
in order to receive welfare and are not subject to time limits or work requirements if they are
full-time students, PRWORA sharply restricts the extent to which adult recipients can count
education and training as required work activities.
Few studies have investigated the effects of welfare reform on educational acquisition of
adult women even though the vast majority of mothers on welfare are adults, education and
training activities are common among adults beyond traditional ages for schooling, and
PRWORA de-emphasized education for this group. Previous research using a quasi-experimental
design has found that welfare reform decreased the probability of both high school and college
enrollment among adult women. No previous research has investigated the effects of welfare
reform on vocational education and training, defined broadly as educational training that
provides practical experience in a particular occupational field, despite the importance of this
type of education for women likely to be on welfare. In 1995, 23% of unmarried mothers in the
U.S. age 25-54 with less than a college education participated in non-college work-related
courses (authors’ own calculations from the dataset used for this study).
Using the National Household Education Survey Adult Education Supplement from

3
multiple years before and after welfare reform, we exploit variation in welfare policy across
states and over time and use relevant comparison groups to estimate effects of welfare reform on
vocational education and training of adult women who are at risk for relying on welfare—those
who are unmarried, have low education, and have dependent children. Limitations in counting
education and training as authorized work activities may increase the cost of engaging in those
activities for adult mothers on welfare and thereby decrease their participation in any educational
activities, including vocational education and training. However, if work and education are
complementary (e.g., if welfare reform increases access to vocational education or training
through employers), welfare reform could increase this type of education. Finally, findings from
previous research that welfare reform decreased the probability of college enrollment among
adult women leave open the possibility that women affected by welfare reform substituted
vocational education and training for formal higher education. Thus, the effects of welfare
reform on this important type of human capital acquisition for women at risk for relying on
welfare are an important gap in the welfare reform and education literature.
Background
The PRWORA legislation of 1996 ended entitlement to welfare benefits under Aid to
Families with Dependent Children (AFDC) and replaced AFDC with Temporary Assistance for
Needy Families (TANF) block grants to states. Among the features of TANF and many pre-
PRWORA state waiver programs,1 which together constitute “welfare reform,” were time limits
on the receipt of welfare benefits, work requirements as a condition of receiving welfare, and
1 Although welfare reform is often dated to the landmark 1996 PRWORA legislation, reforms actually started taking place in the early 1990s when the Clinton Administration greatly expanded the use and scope of “welfare waivers” to allow states to carry out experimental or pilot changes to their AFDC programs, with random assignment required for evaluation. Waivers were approved in 43 states, ranging from modest demonstration projects to broad-based statewide changes, and constituted the first phase of welfare reform. Many policies and features of state waivers were later incorporated into PRWORA.

4
sanctions for non-compliance with program rules. PRWORA also strengthened child support
enforcement and made it easier for married and cohabiting couples to qualify for welfare
benefits. These sweeping changes ushered in a new “work first” era that de-emphasized
education for adult women. The PRWORA legislation granted considerable discretion to states
in establishing welfare eligibility and program rules. As a result, there is substantial state policy
variation within the broad national regime of time-limited cash assistance for which work is
required.
In terms of reducing caseloads, welfare reform (including the pre-PRWORA waivers) has
been successful; welfare rolls have declined by over 50% since their peak in 1994 and at least
one-third of the caseload decline can be explained by welfare reform (see Grogger & Karoly
2005). At the same time, employment rates of low-skilled mothers rose dramatically (Ziliak
2006), and at least some of that increase was a result of welfare reform (Schoeni & Blank 2000).
The effects on family structure are less dramatic. A large literature on the effects of welfare
reform on marriage and a smaller one on cohabitation reveal mixed findings, and the literature on
non-marital childbearing and female headship indicates slightly negative but inconsistent effects
of welfare reform (Blank 2002, 2007; Moffitt 1992, 1995, 1998; Grogger & Karoly 2005;
Gennetian & Knox 2003; Peters, Plotnick & Jeong 2003; Ratcliffe et al. 2002).
Welfare reform and education
Traditionally, mothers on AFDC were not required to work and were allowed to attend
school if they so chose. The situation changed for some mothers under the Job Opportunities and
Basic Skills Training (JOBS) program, which was created under the Family Support Act of 1988
and required states, to the extent resources allowed, to engage mothers with no children below
age 3 in education, work, or training activities. However, many women were exempt from

5
participation in JOBS, and between 1992 (just prior to the first statewide AFDC waiver program)
and 1996 (enactment of PRWORA) only 10% of all welfare recipients in the U.S. participated in
JOBS programs.2
Major statewide AFDC waiver programs, first implemented in late 1992, substantially
altered the nature of welfare by imposing time limits, significantly reducing participation
exemptions, imposing sanctions, increasing earnings disregards, imposing family caps, and/or
implementing work requirements. Compared to JOBS programs, statewide waivers were broad-
based in that they applied to large proportions of welfare recipients. While states were required
to provide many specifics of their programs in their waiver plans, they were not required to
report policies vis-à-vis educational activities. Complicating the picture, states could change their
policies without having to amend their waiver plans (U.S. Department of Health and Human
Services 1997). The situation changed notably under TANF, which required states to file detailed
program specifics (including educational policies) at the outset as well as any intended changes
to those policies. That is, under TANF, the extent to which educational activities could count
toward work requirements was more explicit. Because of the reporting issues under the waivers,
it is difficult to compare educational policies under AFDC waivers and TANF, even in a given
state. However, it is clear that under both AFDC waivers and TANF, work and other
requirements gave women less flexibility in deciding how to spend their time and many welfare
recipients could attend school or vocational training only after fulfilling work requirements.
The PRWORA legislation treats education and training programs very differently
depending on whether the potential recipient is a teen or an adult. The “work first” approach is
2 Committee on Ways and Means, U.S. House of Representatives, “Overview of Entitlement Programs” for 1994 and 1998 (Green Books). Available at: http://aspe.hhs.gov/94gb/sec10.txt and http://frwebgate.access.gpo.gov/cgi-bin/getdoc.cgi?dbname=105_green_book&docid=f:wm007_07.105.

6
targeted to adult mothers, for whom the legislation sharply restricts the extent to which education
and training can count as required work activities. In particular, PRWORA limits the extent to
which education or training can count toward federal work participation requirements, generally
restricting the length of full-time education and training to 12 months and for no more
than 30 percent of TANF participants (Martinson & Strawn 2003). In contrast, minor mothers are
subject to the “human capital” approach, as they are required to attend high school or training
(and to live with their parents or in another approved setting) in order to receive welfare and are
not subject to time limits or work requirements if they are full-time students. Several studies
using quasi-experimental designs have examined the effects of welfare reform on teen drop-out
rates (Hao & Cherlin 2004; Kaestner, Korenman & O’Neill 2003; Offner 2005; Dave, Reichman
and Corman 2008; Koball 2007). Overall, the available evidence suggests that welfare reform
has had favorable effects on high school completion of teenage girls.
For adult women, the situation vis-à-vis welfare reform and education is very different
than that for teens. By requiring work and imposing restrictions on education and training,
welfare reform increased the costs of engaging in such activities for this group. However, it also
potentially increased the benefits of education and training, since the five-year lifetime limit
created greater incentives for women to become more engaged in the labor market. Thus, it is not
clear a priori whether welfare reform would have been expected to decrease or increase adult
women’s investments in education and training.
As far as we know, only two previous studies used nationally representative data and
quasi-experimental designs to investigate the effects of welfare reform on adult women’s
educational enrollment and those focused on formal education. The more comprehensive study,
by Dave, Reichman and Corman (2008), used annual data from the October Education
7
Supplement of the Current Population Survey (CPS) from 1992 to 2001 to estimate the effects of
welfare reform on high school and college enrollment of adult women using a difference-in-
differences methodology. The primary focus was on college enrollment, because the number of
women in the relevant sample attending high school was quite small. The target group for the
analyses of college enrollment was women aged 24-49 who were unmarried, had less than a
college degree, and had minor children in the household, while the comparison group was
women in the same age range and with the same educational levels but who had no children.
They found that welfare reform reduced college enrollment by about 20% The authors also
examined the extent to which college enrollment varied by state TANF education and work
incentive policies and found that the negative effects of welfare reform on college enrollment
were stronger in strict states (those that did not allow post-secondary education to be considered
a valid work-related activity and those with stricter work requirements) than in more lenient
states. Finally, they found that women who worked 20 or more hours per week were far less
likely than those who worked fewer hours to attend college.
In an earlier study, Jacobs and Winslow (2003) compared the probability of post-
secondary education enrollment at 2 points in time: 1995 and 2000 (using March CPS data) and
1995 and 1999 (using the National Household Education Survey—NHES). The CPS analysis
included information on state policies but restricted the analysis to women age 16 to 24 (thereby
missing many adults who may be affected by welfare reform) and confounding the differential
educational incentives for teens versus adults. The NHES analysis included women of all ages,
but did not include state policy data. In the CPS analysis, they found that single mothers are less
likely to go to college post-welfare reform, holding welfare receipt constant, and that adult
women in states that allow education to count toward work requirements are more likely than

8
those in stricter states to attend college. In the NHES analysis, they found that single mothers are
more likely to attend college after welfare reform but that welfare receipt negatively affects
enrollment. A shortcoming of this study is that it takes snapshots at 2 points in time and
attributes all changes to PRWORA. Also, using 1995 as the pre-reform comparison would
provide biased estimates because welfare reform was well under way by then (19 states had
already implemented major AFDC waivers).
Overall, both previous studies found that welfare reform decreased acquisition of post-
secondary education among women at risk for relying on welfare, and that the stricter the
policies, the more negative the effects. Both studies, in their conclusions, discuss the possibility
that other types of human capital acquisition may be more desirable or cost/effective than college
education for women at risk for relying on welfare and that this group may have substituted
vocational education or training for formal education as a response to welfare reform. To date,
no studies have examined this question. Given that the existing literature indicates that welfare
reform has led to decreases in formal education among adult women, the next obvious question
is whether less formal, vocationally-oriented education has also decreased or whether welfare
reform led to a substitution of vocational education for formal education.
Vocational education and training
Vocational education and training activities are not uncommon among adult women. For
example, 80% of females taking vocational courses in the U.S. in 2006 were age 25 years or
older (U.S. Census Bureau 2008). Figures on vocational education for population subgroups,
such as low-educated unmarried women (i.e., women at risk for relying on welfare) are not
readily available, and presenting some relevant statistics in that regard is one of the contributions
of this study. According to Leigh & Gill (1997), the returns to community college education

9
(both degree-granting and vocational programs) are about the same for returning adult students
as for traditional-age students. Welfare recipients are more likely to attend two-year rather than
four-year colleges, and those who do so are less likely than non-recipients to graduate (London
2006). However, each year of credit at a community college yields, on average, a 5 to 8%
increase in annual earnings—a return similar to that from one year of a four-year college
(review, Kane & Rouse 1999). Thus, it appears that there are positive returns to vocational
education in a formal school setting. Several studies have also examined returns to less formal
vocational training activities as a form of human capital acquisition and found that such training,
even firm-specific training, imparts a positive effect on wages (Veum 1999; Loewenstein &
Spletzer 1999; Marcotte 2005). Frazis, Gittleman, and Joyce (2000) found a strong positive
association between formal educational attainment and employer-provided or employer-financed
training, and Marcotte (2005) suggests that complementarities between the two types of
education have been growing over time. To the extent that complementarities exist between
vocational training and formal education for women at risk for relying on welfare, we would
expect that welfare reform had a negative impact on vocational education and training. To the
extent that complementarities exist between work and access to work-related training, we would
expect that higher employment rates among at-risk women due to welfare reform would have a
positive impact on vocational education and training.
Data
We use data from the National Household Education Survey (NHES), which collects
information about the educational activities of the U.S. population. Specifically, we use the
Adult Education Supplements administered in 1991, 1995, 1999, 2001, 2003, and 2005, which
span the period enveloping welfare reform, to estimate the effects of the welfare reform on

10
vocational education. We define any vocational education as having participated in a full-time
vocational education program, part-time vocational education program, or other work-related
courses. Full-time vocational education includes full-time activity toward a diploma or certificate
from a vocational or technical school after high school or a formal vocational training program.
It excludes those enrolled in any degree-granting program. It includes full-time community
college enrollment if the individual is in the process of obtaining a certificate or diploma but not
a degree. Our measure of part-time vocational education corresponds to the measure of full-time
vocational education but pertains to part-time enrollment. Our measure of other work-related
courses pertains to courses that are vocationally oriented but not part of a degree or vocational
program. These are usually part-time and short-term, and include activities such as courses taken
at one’s job, courses taken anywhere else that relate to one’s job or new career, or courses taken
for a license or certification for one’s job.
In our main analyses, we estimate models for participation in full time vocational
education, part time vocational education, and other work-related courses, as defined above; a
composite of those three, which we call “any vocational education;” and employer-paid
education (that for which an employer paid for some or all of educational expenses or for the
employee’s time during which those activities occurred). The last outcome includes college in
addition to the three types of vocational education. In other analyses, we examine enrollment in
full-time and part-time degree programs (college or university) and in any type of education or
training (college or any type of vocational education).
We attach measures of state implementation of welfare reform to the NHES data. Welfare
reform was implemented in two phases. The first consists of federal waivers granted to states to
experiment with AFDC rules prior to PRWORA. Since 1962, the Secretary of Health and Human

11
Services has had the authority to waive federal welfare rules if a state proposed experimental or
pilot programs that furthered the goals of AFDC. Some waivers increased the amount of earnings
that recipients were allowed to keep while maintaining welfare eligibility; others expanded work
requirements to larger groups, established term limits for cash assistance, permitted states to
issue sanctions to recipients who failed to meet work requirements, or allowed states to eliminate
increases in benefits to families who had additional children while on welfare. We construct an
indicator to reflect whether a given state in a given month and year had a statewide waiver in
place that substantially altered the nature of AFDC with regard to time limits, work exemptions,
sanctions, earnings disregards, family caps, and/or work requirements.3 The second phase of
welfare reform was the implementation of TANF programs post-PRWORA. Because all states
implemented TANF programs between the 1995 survey and the 1999 survey, all states are coded
with a zero for TANF implementation for 1991 and 1995, and a one for subsequent years.4 These
two measures follow the convention in the literature (reviewed in Blank 2002). For simplicity of
exposition and because we find that the waiver/TANF distinction does little to enhance our
analyses and has no bearing on our inferences, our primary measure of welfare reform combines
the two into a dichotomous indicator of whether the state had either an AFDC waiver or TANF
in place during the time period measured. However, we conduct corresponding analyses that
include the separate indicators for AFDC waivers and TANF (several specifications are
presented in Appendix Table 2 and the others are available upon request). Finally, in certain
3 The educational variables in the NHES reference the prior year. Based on the respondent’s month of interview, we therefore match welfare reform policies that were in place in the respondent’s state of residence during the midpoint of the past 12 months. Eleven states enacted major waivers to their AFDC programs across various months, between 1992 and 1994. Estimates are robust to alternative measures of the fraction of the past year (since the month of interview) that the welfare policy was in effect. 4 Information on state implementation of major AFDC waivers and TANF is obtained from the Assistant Secretary for Planning and Evaluation at the U.S. Department of Health and Human Services: http://aspe.hhs.gov/HSP/Waiver-Policies99/policy_CEA.htm.

12
models we estimate differential effects by state educational policies, sanctions, and benefit
generosity under TANF, as described later.
Since welfare reform is measured at the state level, we incorporate additional state-
specific socioeconomic measures in the analyses to capture time-varying trends within areas.
State unemployment rate and per capita personal income are derived from figures provided by
the Bureau of Labor Statistics. Welfare caseloads, defined as the total number of welfare
recipients in a state, are obtained from the Department of Health and Human Service’s
Administration for Children and Families Office of Family Assistance.5 All models further
include indicators for whether a given state in a given year had a strict high school exit exam
(testing material at or above the 9th grade level) or a less strict exam (below the 9th grade level),
with the reference category being no high school exit exam. For women who completed high
school, we use the existence of the exam during their eighteenth year. For those who did not
complete high school, we use the contemporaneous existence of the exam in their state. These
data are derived from the Appendix provided by Dee & Jacob (2007).
Methods
The primary aim of this study is to evaluate the impact of welfare reform on adult
women’s vocational education and training. We employ a difference-in-difference-in-differences
(DDD) framework – akin to a pre- and post-comparison with treatment and control groups – in
conjunction with multivariate regression methods, which is standard in the economics literature
on evaluating the effects of welfare reform and other state policies (e.g., Kaestner & Tarlov
2006; Bitler, Gelbach & Hoynes 2005; Blank 2002). Under certain conditions, described below,
this quasi-experimental research design will yield causal estimates of the effects of welfare
5 Specifically, the data can be found at: http://www.acf.hhs.gov/programs/ofa/caseload/caseloadindex.htm.

13
reform on our outcomes of interest. We conduct various specification and robustness checks to
assess the validity of the identification assumptions underlying this methodology.
Consider the following DDD model which relates changes in educational outcomes to
implementation of welfare reform for the target group relative to a comparison group:
iststsstist
stistiist
tStateYearStateZX
WRTargetWRTargetE
'''''
*1
*11
*11
'
)*(
)()*)(()()1(
Equation 1 posits that the educational outcome (E), for the ith woman residing in state s during
year t, is a function of welfare reform implementation (WR), measured here by an indicator
reflecting whether a given state has enacted either a statewide AFDC waiver or TANF (based on
the respondent’s interview month and year). In addition, educational acquisition depends on a
vector of individual characteristics (X) such as age, race, ethnicity, highest grade completed, and
urban residence, a vector of time-varying state characteristics (Z) such as economic conditions
and educational policies, state fixed effects (States), and year fixed effects (Yeart). The
parameter μ represents an individual error term.6
There are several benefits to estimating Equation 1. It bypasses having to estimate the
structural model relating welfare reform to welfare caseloads, which has been problematic in the
literature (Kaestner & Tarlov 2006; Blank 2002).7 Equation 1 is also more policy relevant as it
represents the reduced-form model directly linking welfare policy measures to key outcomes,
6 We estimate equation (1) via OLS, though results are not affected when probit or logit methods are employed. All models control for the sampling weights as a covariate to increase efficiency, as recommended in Korn and Graubard (1995) and because the NHES over-sampled those who participated in educational activities. Reported standard errors are adjusted for arbitrary correlation across observations within each state. 7 Changes in welfare caseloads are not due solely to welfare policy. Research suggests that much of the drop in caseloads, especially prior to TANF implementation in 1996, was not policy-related. While the welfare caseload fell dramatically in the 1990s, only part of the decline (≤ 35 %) was due to welfare reform legislation (Blank 2002). Changes in economic conditions and other factors also played an important role.

14
and therefore accounts for any and all mechanisms through which welfare policy may be
affecting educational acquisition.
The direct focus on welfare reform, either an AFDC waiver or TANF, also underscores
the point that the population of interest, that which is affected by welfare reform legislation, is all
women at risk of being on public assistance, and not just current or former program participants
(Kaestner & Tarlov 2006). Welfare reform can affect exit rates as well as entry rates.
Considering all women at risk addresses some of the limitations from leavers’ studies, which
focus solely on individuals who have left welfare. These studies find it difficult to differentiate
individuals who leave public assistance voluntarily from those who left because of welfare
reform policies. They also do not consider the experiences of individuals who have been diverted
from public assistance as a result of policy shifts. Potential welfare recipients are shown to
behave strategically in their use of welfare benefits when faced with time limits and other
regulatory constraints (DeLeire et al. 2006; Grogger 2004). Thus, in order to identify the
population effect of welfare reform on key outcomes, the appropriate sample is all women at risk
of being on public assistance.
Traditionally, the welfare caseload has consisted primarily of low-educated, unmarried
mothers. This at-risk population group is the target group, for whom welfare policy would be
expected to have the largest behavioral effects. In addition to the state-varying trends we
consider when estimating equation (1), the possibility of omitted variables remains. This
problem is addressed in the DDD framework by considering a comparison group – individuals
who are similar in many ways to the target group but are unlikely to participate in public
assistance programs and therefore not likely to be affected by welfare policies. In the above
equation, Target represents a dichotomous indicator equal to one if the individual is in the target

15
group (population at risk of being on welfare) and zero if the individual is in the comparison
group (population not at risk of being on welfare). The DDD estimates of the effects of welfare
reform are the coefficients of the interaction terms between the policy measures (WR or, in
supplemental analyses, separate indicators for AFDC Waiver and TANF) and the Target group
indicator.8 The impact of welfare reform is identified using variation in the timing and incidence
of welfare reform across different states over time.
The assumption necessary for the DDD effect to represent an unbiased estimate is that in
the absence of welfare reform, unobserved state-varying factors would affect the target and
comparison groups similarly. Consequently, the choice of target and comparison groups is
integral to a valid implementation of the DDD methodology. Following the literature, we employ
target and comparison groups that are conventionally defined (Dave et al. 2008; Kaushal and
Kaestner 2001; Kaestner and Kaushal 2003). Identifying the target group for our analyses—
individuals who are at risk of relying on public assistance—is relatively straightforward. As
indicated earlier, welfare reform is likely to have its strongest behavioral impacts on unmarried
mothers with low levels of education and their children. As such, we compare unmarried women
ages 25-54 who have less than a college education and live with children (target group) to
unmarried women in the same age and education groups who do not live with any children
(comparison group).
We confirm that baseline means between the target and comparison groups were similar
in 1991, the period that predated any welfare reform. For instance, unadjusted weighted
differences in full-time college enrollment (-0.0054), part-time college enrollment (-0.0193), and
8 For parsimony, Equation 1 imposes the restriction that, within states, the effects of the non-welfare reform measures (vectors X, Z, Year and State*t) are similar for the target and comparison groups. In supplemental analyses, we estimated all models allowing the effects of X and Z to differ across target and comparison groups, by including interactions between the target indicator and X and Z. Coefficient magnitudes are not materially affected, though standard errors are inflated somewhat due to reduced degrees of freedom.

16
any vocational education (-0.0051) between the target and comparison groups were insignificant.
Individuals in the comparison group were significantly more likely (by about 10 percentage
points) to participate in work-related courses in 1991 relative to the target group; this is to be
expected since labor force participation and employment were much higher among individuals in
the comparison group relative to individuals at-risk of welfare assistance (target group) who
were not required to work in order to receive welfare benefits. Trends between 1991 and 1995
(excluding states that had implemented major AFDC waivers) were also generally similar
between the groups for these measures; for work-related courses, the increasing trend was
qualitatively similar for both groups but somewhat steeper for the target group. Some of this
confounding is likely due to differential effects of the economic expansion on employment
between the target and comparison groups as work-related courses are expected to be highly
complementary to employment. We are therefore careful to control for measures of economic
activity in all models, and in fact when we do so, the baseline difference in work-related courses
between the target and comparison groups is attenuated by 60 percent and the difference in trend
becomes statistically insignificant.
One concern is that states may have implemented major waivers to their AFDC programs
in response to economic conditions or the behavior of welfare caseloads on the state. Therefore,
all models control for one- and two-year lags of the state unemployment rate, real personal
income per capita, and welfare caseloads. 9 We conduct several specification checks to assess
the robustness of our estimates. First, in alternate models, we include state-specific trends to
9 Results (available upon request) are virtually unchanged if these lagged covariates are excluded from the models. In alternate models, we also control for a larger vector of state-specific factors including state child support expenditures, minimum wage, and poverty rates. Results (available upon request) are highly robust with respect to both magnitudes and significance. This robustness to additional controls for state-varying factors is validating since in a well-specified DD model, the comparison group accounts for time-shifting unobservable factors; thus, results should not be sensitive to parametric controls for state-specific factors.

17
account for systematically-varying unobservable factors within each state. Second, we assess
whether our estimates are sensitive to the choice of the comparison group by utilizing an
alternate comparison group (low-educated married women with children) that has also been used
in the welfare reform literature. Third, we estimate alternate specifications only for individuals
in the target group, separately controlling for state-specific prevalence of vocational and work-
related educational engagement among unmarried women with no children and married women
with children (individuals who are not likely to be impacted by welfare policies) to capture
general trends in these educational activities. Our estimates remain generally robust across all of
these specifications, adding to the weight of the evidence bearing on our conclusions.
Results
The results are organized as follows. Table 1 replicates previous work that estimated the
effects of welfare reform on college attendance. Tables 2 and 3 present our main results--effects
of welfare reform on vocational education and training and on employer-subsidized education.
Table 4 presents results from models that stratify by state TANF policies vis-a-vis education,
sanctions, and benefit generosity in order to explore effect heterogeneity along those dimensions.
These analyses also assess the plausibility of our estimates by checking for a “dose-response”
relation based on whether the effects are expectedly larger for stricter states. In Table 5, we allow
for heterogeneous effects of welfare reform on vocational education by prior formal educational
attainment, allowing us to explore complementarity between formal and vocational education. In
Table 6, we present estimates from models of welfare reform on any schooling (formal or
vocational education) to assess overall effects on potential human capital acquisition. In all
tables, the estimated effects of welfare reform are indicated by the (bolded) coefficients on the
interaction terms between the welfare reform and target group indicators. All sample sizes have
18
been rounded to the nearest 10, and we perform weighted analyses per National Center for
Education Statistics guidelines.
In Table 1, we replicate previously discussed findings, based on the October supplement
of the CPS, of Dave, Reichman and Corman (2008) that welfare reform reduced college
enrollment of adult women at risk of relying on welfare. The estimates for any enrollment and
full-time enrollment confirm these previous findings, although that for any enrollment is
imprecisely estimated. For instance, welfare reform is associated with a 3.7 to 3.9 percentage
points decline in college enrollment among low-educated single mothers ages 25-54, relative to
similar aged and educated women without children. 10 Estimate magnitudes and standard errors
are robust to the inclusion of state-specific trends. Sample sizes vary across outcomes because
individuals engaging in types of education other than that being modeled are excluded from the
sample (for example, the 2,910 observations in Column 3 consist of women who either engaged
in no education or full-time degree education, and excludes women who engaged in any other
type of education or training). Thus, the reference group in all models consists of individuals
who did not participate in any schooling or training, making the marginal effects directly
comparable across all specifications.
Table 2 presents our main results. As indicated earlier, nationally representative statistics
are not readily available for vocational education participation among women at risk for relying
on welfare—before or after welfare reform. As shown in the bottom row, in 1990-1991 (our
“baseline” pre-welfare reform period), about 4.5% of women at-risk for welfare (aged 25 to 54
years, less than college-educated, unmarried, and with dependent children) were enrolled in a
10 For any degree enrollment, we find a higher-magnitude effect than the corresponding estimate by Dave, Reichman & Corman (3-4 percentage points versus 1-2 percentage points). This is partly due to a somewhat higher prevalence of any degree enrollment for the target group in the NHES relative to the October CPS (11.6 percent vs. 8.9 percent), suggesting that the educational focus of the NHES may be picking up greater participation in degree-granting activities that is perhaps missed in the CPS.

19
full-time vocational education program at some point during the year. Another 1.8% had been
enrolled in a part-time vocational program, and another 13.6% had engaged in any other work-
related courses during the year. Thus, about 20% of women at-risk for welfare participation
engaged in some type of vocational education and over one-quarter were engaged in either
vocational training or formal college education. For vocational education, the most common type
was short-term, part-time training that does not lead to a degree or diploma (“any other work
related courses”). We also find that almost 14% of women at risk for welfare reform in 1990-
1991 received employer-subsidized education (including college or any type of vocational
education).
The estimates in Columns 2-4 of Table 2 indicate that welfare reform reduced full-time
vocational enrollment by about 4 percentage points but increased part-time vocational education
by one percentage point. This latter represents a large effect relative to the baseline mean, though
this effect is imprecisely estimated. There is no significant or substantial effect of welfare reform
on participation on any other work-related training. When the three types of vocational education
are combined (Column 1), we find no evidence that welfare reform had a significant impact on
vocational education among women at risk for relying on welfare. In addition, we find no
significant effects of welfare reform on employer-subsidized education. Table 3 presents
estimates from models that control for state-specific trends; effect magnitudes and standard
errors are not materially affected.
We would expect the negative effects of welfare reform on vocational education to be
particularly strong in states that do not permit or that limit education as an authorized work
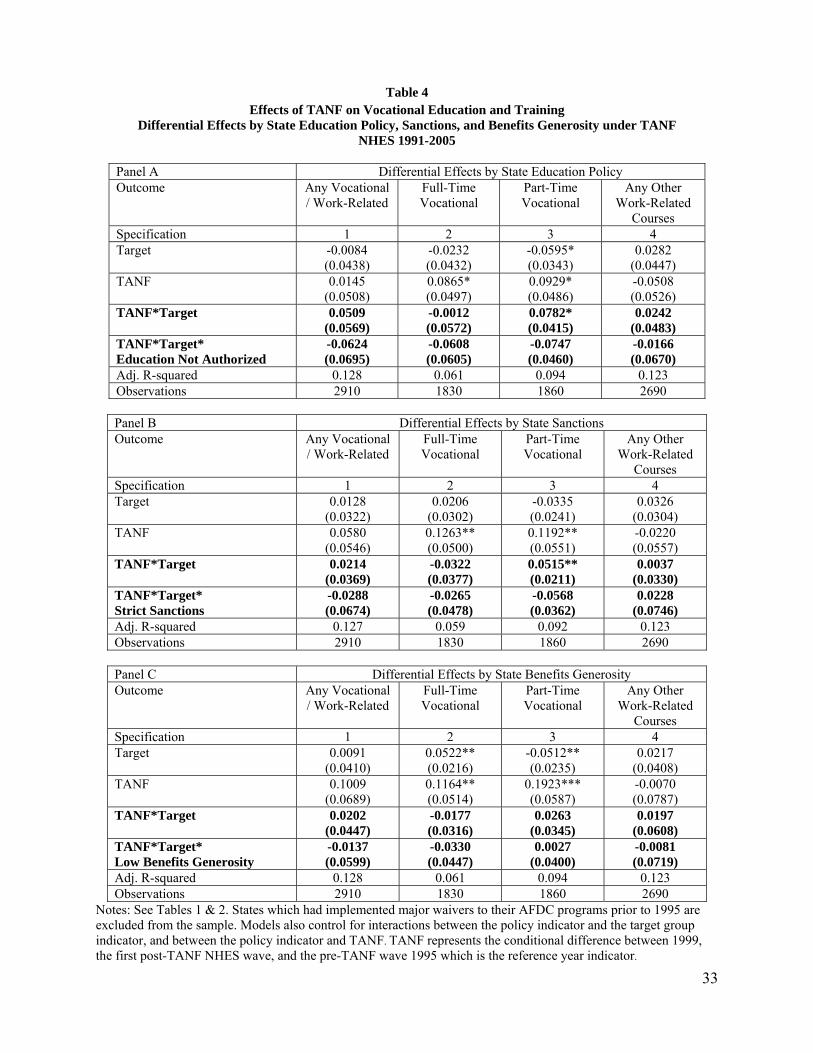
activity for adults. To explore this, Table 4 (panel A) presents estimates from models with a three
20
way interaction between TANF, target, and state TANF education policy.11 Specifically, we
created a dichotomous variable equal to one if the state never allows post-secondary or other
education to substitute for work requirements, or imposes substantial time limits on the duration
of the educational activities. We then interacted this variable with our TANF*Target variable.12
None of these states allow schooling, as a stand-alone activity, to satisfy work requirements.
Since these state educational policies specifically refer to TANF, we focus on the TANF effect in
these models and exclude states that had already implemented welfare reform through major
waivers to AFDC prior to TANF implementation.
Although measured with some imprecision due to reduced effective cell size, we find that
the negative effect of TANF on full-time vocational education becomes stronger in strict states
and approaches zero in states that have more lenient policies with respect to educational
enrollment. We also find some evidence of heterogeneity with respect to part-time vocational
enrollment. That is, in lenient states, at-risk women are more likely to attend part-time vocational
programs (by about 8 percentage points), and in strict states, at-risk women are less likely to
attend such programs (by about 7 percentage points) relative to the lenient states. Combining the
effects over all states thus yielded a net one percentage point increase in part-time vocational
education. There is also some suggestive evidence of differential effects for other work-related
courses (1.7 percentage points decline among the stricter states relative to the lenient states, and
a 2.4 percentage points increase among the lenient states), though the difference here is not as
11 We investigate only TANF because there is no known source of information on educational policies under AFDC waivers. 12 Specifically, we examined these policies at two points in time (1999 and 2002), and designated states as "strict" if they did not allow education as a stand-alone activity and they did not allow schooling to be combined with other work activities for more than one year. Twenty-two states (AZ, CO, CT, FL, ID, IN, KS, LA, MA, MD, MI, MS, ND, NM, NY, OH, OK, OR, SD, TX, WA, WI) and D.C. fall into this category. The data, available on the State Policy Documentation Project website, can be found at: http://www.spdp.org/tanf/postsecondary.PDF and http://clasp.org/publications/postsec_table_i_061902.pdf.

21
large as for vocational training. This is not surprising, since these courses do not represent major
financial commitments compared to the other two categories.
We would also expect the effects of welfare reform on vocational education to be
stronger in states with strict work incentives, such as sanctions for non-compliance with work
requirements and low benefits generosity. As above for TANF education policy, we interacted a
measure of strict state sanctions in Panel B and a measure of low or medium (relative to high)
benefits generosity in Panel C (as characterized by Blank & Schmidt 2001). Again, we find
significant differential effects on vocational education depending on strict versus less strict
states. That is, women in states with stricter work incentives were less likely than women in
more lenient states to engage in full-time and part-time vocational education.
As discussed earlier, more highly educated individuals are more likely than those with
lower educational levels to engage in work-related courses. Thus, it is possible that our overall
results may mask important differences in propensity to engage in vocational education within
the at-risk population. Table 5 presents results that allow for differential effects of welfare
reform depending on whether the woman had a high school diploma (about 70% of the target
group). Because of small cell sizes, we present results only for the two largest categories of
vocational education (any vocational education and work-related courses) and for employer-
subsidized schooling (which includes college as well as vocational education). Similar to the
above analyses of heterogeneous effects based on state variation in TANF policies, we interact
our main DD effect (Welfare Reform*Target) with an indicator for whether the woman had a
high school diploma. The coefficient of this triple interaction term (Welfare Reform* Target*
High School Graduate) represents the effects of welfare reform for those at-risk women who
have a high school degree, relative to those who do not.

22
Although imprecisely estimated, we find that for women with less than a high school
diploma, welfare reform reduced any vocational education by about 3 percentage points and any
other work-related courses by about 6 percentage points. Relative to these women with less than
a high school education, welfare reform is associated with a 2.6 and 6.8 percentage points
increase any vocational education and work-related courses, respectively. Overall, for these
high-school graduates, there is no appreciable negative effects of welfare reform (sum of the
coefficients of Welfare Reform*Target and Welfare Reform*Target*High School Graduate).
These findings suggest that limitations in counting education and training as authorized work
activities increase the cost of engaging in those activities overall, but that complementarities
between work and education (such as access to employer-subsidized education) may largely
offset those effects for high school graduates. The results for employer-subsidized education are
consistent with this scenario. Although welfare reform had small and statistically insignificant
effects on employer-subsidized education (Table 2), we see here that the effects were negative
for the least educated women while small but positive for those with at least a high school
diploma relative to those with less than a high school education.
Table 6 considers the overall effects of welfare reform on any type of education (formal
college, vocational programs, or work-related courses). These estimates address the question of
whether the decrease in formal schooling found by Dave et al. (2008) and corroborated in this
study were tempered by increases in informal schooling in the form of vocational training and
work-related courses. Models 1 and 2 (excluding and including state-specific trends,
respectively) estimate average effects of welfare reform across the sample, while models 3 and 4
consider differential effects of welfare reform by the woman’s prior education. From the first
two columns, we can see that welfare reform had a negative (but statistically insignificant) effect

23
on overall educational participation, which is consistent with the separate findings for college
and vocational enrollment (in Tables 1 and 2, respectively). From the last two columns, we can
see that for women with at least a high school diploma, this effect is substantially attenuated.
Together, these estimates suggest that while welfare reform led to overall declines in educational
acquisition among women at risk for relying on welfare, the effects were confined for the most
part to very low-educated women. The effects for women with a least a high school diploma
appear to have been offset by increases in employer-subsidized education (from Table 5). In
other words, the “work first” strategy under welfare reform appears to have had uneven impacts
in terms of its effects on educational acquisition, with the most disadvantaged (in terms of
completed education) falling even farther behind and the others experiencing neutral effects.
In additional specifications (not shown) we used an alternative comparison group—
married women (with children in the household) in the same age range and with the same
education levels as the target group—and found that results were consistent in terms of both
effect magnitudes and significance relative to those presented in Tables 2 and 3. The only
substantive difference is that we find a significant decrease in other work-related courses,
confirming that welfare reform seemed to have an overall negative effect on the target women's
human capital acquisition through formal education and training.
When the target and comparison groups are defined according to characteristics, such as
education, parental status, and marital status, which may themselves be affected by welfare
reform, potential bias due to compositional selection is a concern. We confirm that key
characteristics used to define the target and comparison groups have not changed significantly
over the sample period. For instance, 6.85 percent of all women are classified into the target
group prior to TANF (being low-educated, unmarried, and with children) compared to 6.71

24
percent in 2005. Similarly, the prevalence of marriage among low-educated women and the
number of children among low-educated unmarried and married women have remained
relatively stable over the sample period. Thus, selection bias with respect to parental and marital
status or family structure is unlikely, and this is consistent with prior research which has also
found weak to no effects of welfare reform on those as outcomes.
As an alternative check for compositional selection, we also assessed whether welfare
reform can predict who is in our analysis sample and who is in the target versus comparison
samples (controlling for observed covariates). In both cases, welfare reform is not significantly
or substantially associated with the probability of inclusion in the analysis sample (target or
comparison group relative to all others) or inclusion in the target group relative to the
comparison group (marginal effect of -0.008). When the welfare reform indicator is separated
into AFDC waivers and TANF, we find that neither is significantly associated with the
probability of inclusion in the analysis sample. However, TANF appears to reduce the
probability that an adult woman is observed in the target group by about 6 percentage points
(about 10% relative to the baseline prevalence of the target indicator). Since the only difference
between the target and comparison groups is the presence of minor children in the household,
this result could reflect changes in household structure post-TANF, such as formation of multi-
family or intergenerational households (outcomes that have not been explored in the welfare
reform literature). Thus, women who may otherwise have been in the target group are classified
in the comparison group potentially because their living arrangements were affected by welfare
reform. Since about 10 percent of the target group potentially shifted into the comparison sample
as result of welfare reform, it should be noted that this would attenuate observed DDD effects by
about 10 percent (Dave and Kaestner, 2008). Thus, if anything, the reported estimates are
25
conservative and compositional selection has a negligible effect on the results. It is also
validating that results are robust to alternate definitions of the comparison group as noted above.
Appendix Table 1 presents the separate effects of state AFDC waivers and TANF
implementation on all reported educational outcomes. The patterns and magnitudes of the
estimates are consistent with those discussed above with respect to the overall welfare reform
indicator. In addition, both AFDC waivers and TANF similarly impacted educational outcomes;
we are unable to reject the null hypothesis of no difference in effects between the two indicators.
This is consistent with the results reported in Table 4, which suggest that work incentives were a
key mechanism through which welfare reform impacted educational outcomes, and both AFDC
waivers and TANF imposed strict work requirements as a condition for receiving benefits.
Conclusion
We found robust and convincing evidence that welfare reform significantly decreased the
probability of full time vocational training and had no significant effects on part-time vocational
education acquisition or participation in any other type of work-related education among adult
women on average. We also found considerable heterogeneity across states, suggesting that
states with stricter educational policies and stronger work incentives experienced larger declines
in full- and part-time vocational training participation. Indeed, participation in part-time
vocational education appears to have significantly increased (relative to no education or training)
in lenient states. The negative effects of welfare reform on vocational education appear to be
confined to women with less than a high school education. We found no evidence that the
previously-reported negative effects of welfare reform on enrollment in formal education
(particularly college), which we replicated in this study, have been offset by increases in
vocational education and training on average. In other words, welfare reform appeared to

26
decrease adult women’s education and training overall, and again, the effects appear to be
confined to those with very low levels of completed education.
The results from this study fill an important gap in the welfare reform literature and
confirm that the gains from welfare reform in terms of increasing employment and reducing
caseloads have come at a cost—lower education and training among women at risk for relying
on welfare. Our finding that the effects appear to be concentrated among women with very low
education has negative implications for this group’s ability to attain self-sufficiency and
experience upward mobility. These negative effects of welfare reform on adult women’s
education may have become even larger under the Deficit Reduction Act of 2006, which raised
states’ work participation targets and narrowed the range of welfare-to-work activities that can
be counted toward those targets, and during the recent economic downturn. Finally, the findings
from this study contribute generally to the sparse economics literature on adult vocational
education by identifying welfare policy as a determinant of vocational education and training,
and underscore that public policies not specifically focusing on education can be important
determinants of human capital acquisition.
27
References
Bitler, M.P., Gelbach, J.B., & Hoynes, H.W. (2005). Welfare Reform and Health. Journal of Human Resources, 40 (2), 309-34. Blank, R.M. (2002). Evaluating Welfare Reform in the United States. Journal of Economic Literature, 40 (4), 1105-66. Blank, R.M. (2007). What We Know, What We Don’t Know, and What We Need to Know about Welfare Reform. National Poverty Center Working Paper Series #07-19, http://www.http://npc.umich.edu/publications/u/working_paper07-19.pdf Blank, R.M., & Schmidt, L. (2001). Work, Wages, and Welfare. In R.M. Blank & R. Haskins, The New World of Welfare. Washington, D.C.: Brookings Institution. Dave, D., & Kaestner, R. (2006). Health Insurance and Ex Ante Moral Hazard: Evidence from Medicare. National Bureau of Economic Research Working Paper Series. Dave, D., Reichman, N.E., & Corman, H. (2008). Effects of Welfare Reform on Educational Acquisition of Young Adult Women. National Bureau of Economic Research Working Paper Series. Dee, T.S., & Jacob, B.A. (2007). Do High School Exit Exams Influence Educational Attainment or Labor Market Performance? In Adam Gamoran, Standards-Based Reform and Children in Poverty: Lessons for "No Child Left Behind” (pp. 154-200). Washington D.C.: Brookings Institution Press. DeLeire, T., Levine, J., & Levy, H. (2006). Is Welfare Reform Responsible for Low-Skilled Women’s Declining Health Insurance Coverage in the 1990s? Journal of Human Resources, 41 (3), 495-528. Frazis, H., Gittleman, M., & Joyce, M. (2000). Correlates of Training: An Analysis Using Both Employer and Employee Characteristics. Industrial and Labor Relations Review, 53 (3), 443-462. Gennetian, L.A., & Knox, V. (2003). Staying Single: The Effects of Welfare Reform Policies on Marriage and Cohabitation. New York, NY: MDRC. Grogger, J. (2004). Time Limits and Welfare Use. Journal of Human Resources, 39 (2), 405-24. Grogger, J., & Karoly, L.A. (2005). Welfare Reform: Effects of a Decade of Change. Cambridge, MA, Harvard University Press. Hao, L., & Cherlin, A.J. (2004). Welfare Reform and Teenage Pregnancy, Childbirth, and School Drop-out. Journal of Marriage and Family, 66 (1), 179-94.

28
Jacobs, J.A., & Winslow, S. (2003). Welfare Reform and Enrollment in Postsecondary Education. Annals of the American Academy of Political and Social Science, 586, 194-217. Kaestner, R., Korenman, S., & O'Neill, J. (2003). Has Welfare Reform Changed Teenage Behaviors? Journal of Policy Analysis and Management, 22 (2), 225-48 Kaestner, R., & Tarlov, E. (2006). Changes in the Welfare Caseload and the Health of Low-Educated Mothers. Journal of Policy Analysis and Management, 25 (3), 623-43. Kane, T., & Rouse, C.B. (1999). The Community College: Training Students at the Margin Between College and Work. Journal of Economic Perspectives, 13 (1), 63-84. Kaushal, N., & Kaestner, R. (2001). From Welfare to Work: Has Welfare Reform Worked? Journal of Policy Analysis and Management, 20 (4), 699-719. Koball, H. (2007). Living Arrangements and School Drop-out Among Minor Mothers Following Welfare Reform. Social Science Quarterly, 88 (5), 1374-91. Leigh, D.E., & Gill, A.M. (1997). Labor Market Returns to Community Colleges: Evidence for Returning Adults. Journal of Human Resources, 32 (2), 334-53. Loewenstein, M.A., & Spletzer, J.R. (1999). Formal and Informal Training: Evidence from the NLSY. Research in Labor Economics, 18, 403-438. London, R.A. (2006). The Role of Postsecondary Education in Welfare Recipients' Paths to Self-Sufficiency. The Journal of Higher Education, 77 (3), 472-498. Marcotte, D.E. (2000). Continuing Education, Job Training, and the Growth of Earnings Inequality. Industrial and Labor Relations Review, 53 (4), 602-623. Martinson, K., & Strawn, J. (2003). Built to Last: Why Skills Matter for Long-Run Success in Welfare Reform. Center for Law and Social Policy, Workforce Development Series, Brief No. 1. Available at: http://www.clasp.org/admin/site/publications/files/0120.pdf Moffitt, R.A.(1992). Incentive Effects of the U.S. Welfare System: A Review. Journal of Economic Literature, 30 (1), 1-61. Moffitt, R.A. (1995). Report to Congress on Out-of-Wedlock Childbearing. Hyattsville, MD: U.S. Department of Health and Human Services. Moffitt, R.A. (1998). The Effects of Welfare on Marriage and Fertility." In R. A. Moffitt, Welfare, the Family, and Reproductive Behavior: Research Perspectives (pp. 50-97). Washington, D.C.: National Academy Press. Offner, P. (2005). Welfare Reform and Teenage Girls. Social Science Quarterly, 86 (2), 306-22.

29
Peters, E.H., Plotnick, R.D., & Jeong, S. (2003). How Will Welfare Reform Affect Childbearing and Family Structure Decisions? In R. A. Gordon & H. J. Walberg, Changing Welfare (pp. 59-91). New York: Kluwer Academic/Plenum Publishers. Ratcliffe, C., McKernan, S., & Rosenberg, E. (2002). Welfare Reform, Living Arrangements, and Economic Well-Being: A Synthesis of Literature, Washington, D.C.: The Urban Institute. Schoeni, R.F. & Blank, R.M. (2000). What Has Welfare Reform Accomplished? Impacts on Welfare Participation, Employment, Income, Poverty, and Family Structure. National Bureau of Economic Research Working Paper #7627. U.S. Census Bureau. Table 6. Employment Status and Enrollment in Vocational1 Courses for the Population 15 Years Old and Over, by Sex, Age, Educational Attainment, and College Enrollment: October 2008. www.census.gov/population/socdemo/school/cps2008/tab6.xls U.S. Department of Health and Human Services. Office of the Assistant Secretary for Planning and Evaluation. “Setting the Baseline: A Report on State Welfare Waivers,” June 1997. Available at: http://aspe.hhs.gov/hsp/isp/waiver2/title.htm [Accessed April 3, 2009]. Veum, J. (1999). Training, Wages, and the Human Capital Model. Southern Economic Journal, 65 (3), 526-538. Ziliak, J.P. (2006). Taxes, Transfers, and the Labor Supply of Single Mothers. Unpublished working paper, 2006. Available at: http://www.nber.org/~confer/2006/URCf06/ziliak.pdf.

30
Table 1 Effects of Welfare Reform on Schooling Outcomes – Higher Education
(replicates October CPS results of Dave et al. 2008) NHES 1991-2005
Sample Target: Unmarried Women with Children, Less than College-Educated, Ages 25-54
Comparison: Unmarried Women with No Children, Less than College-Educated, Ages 25-54 Outcome Any Degree Any Degree Full-Time
Degree Full-Time
Degree Part-Time
Degree Part-Time
Degree Specification 1 2 3 4 5 6 Target 0.0586*
(0.0298) 0.0557* (0.0302)
0.0888*** (0.0315)
0.0906*** (0.0316)
-0.0043 (0.0229)
-0.0086 (0.0237)
Any Welfare Reform 0.0571** (0.0284)
-0.0050 (0.0344)
0.0437* (0.0237)
0.0146 (0.0285)
0.0375 (0.0263)
-0.0101 (0.0332)
Any Welfare Reform* Target -0.0394 (0.0288)
-0.0369 (0.0299)
-0.0492** (0.0226)
-0.0497** (0.0237)
-0.0059 (0.0288)
-0.0043 (0.0293)
Lagged State Covariates Yes Yes Yes Yes Yes Yes State-specific Trends No Yes No Yes No Yes Adj. R-squared 0.259 0.261 0.205 0.209 0.179 0.179 Observations 3350 3350 2910 2910 2960 2960 Sample Baseline Mean for Target Group 0.1157 0.1157 0.0695 0.0695 0.0532 0.0532
Notes: Coefficient estimates are from linear probability models. The reference group in all models corresponds to no schooling. Standard errors are adjusted for arbitrary correlation within each state and reported in parentheses. All models include age and age squared, indicators for race and Hispanic ethnicity, indicators for high school graduate and less than high school, number of children less than 16 years of age in the household, number of residents in the household, urban residence, state fixed effects, year fixed effects, and the appropriate sampling probability weights. State covariates include state-level unemployment rate, real state personal income per capita, and indicators for state high school exit exam requirements. Lagged state covariates include one- and two-year lags of the welfare caseload, unemployment rate, and real personal income per capita. Significance is denoted as follows: *** p≤0.01, ** 0.01<p≤0.05, * 0.05<p≤0.10. All sample sizes are rounded to the nearest 10 per National Center for Education Statistics guidelines. Baseline mean represents the weighted outcome mean for the analysis sample, for the target group, from 1991 and 1995 (excluding states in 1995 that had enacted statewide AFDC waivers).

31
Table 2 Main Results--Effects of Welfare Reform on Vocational Education
and Training and Employer Paid Schooling NHES 1991-2005
Sample Target: Unmarried Women with Children, Less than College-Educated, Ages 25-54
Comparison: Unmarried Women with No Children, Less than College-Educated, Ages 25-54
Outcome Any Vocational
Education or Training
Full-Time Vocational
Education or Training
Part-Time Vocational
Education or Training
Any Other Work-Related
Courses
Any Employer-
Paid Schooling
Specification 1 2 3 4 5 Target 0.0416
(0.0254) 0.0394* (0.0223)
-0.0132 (0.0168)
0.0451* (0.0226)
0.0116 (0.0217)
Any Welfare Reform 0.0110 (0.0172)
0.0407** (0.0195)
0.0318** (0.0150)
-0.0106 (0.0217)
-0.0382 (0.0259)
Any Welfare Reform* Target
-0.0085 (0.0286)
-0.0436** (0.0216)
0.0101 (0.0179)
-0.0017 (0.0289)
0.0126 (0.0278)
Lagged State Covariates Yes Yes Yes Yes Yes Adj. R-squared 0.134 0.052 0.072 0.132 0.094 Observations 4160 2660 2700 3860 4980 Sample Baseline Mean for Target Group 0.1795 0.0447 0.0176 0.1356 0.1359
Notes: Any vocational education or training (1) includes full time (2), part-time (3), and other (4). Any employer-paid schooling (5) includes (1) or any college. Coefficient estimates are from linear probability models. The reference group in all models corresponds to no schooling. Standard errors are adjusted for arbitrary correlation within each state and reported in parentheses. All models include age and age squared, indicators for race and Hispanic ethnicity, indicators for high school graduate and less than high school, number of children less than 16 years of age in the household, number of residents in the household, urban residence, state fixed effects, year fixed effects, and the appropriate sampling probability weights. State covariates include state-level unemployment rate, real state personal income per capita, and indicators for state high school exit exam requirements. Lagged state covariates include one- and two-year lags of the welfare caseload, unemployment rate, and real personal income per capita. Significance is denoted as follows: *** p≤0.01, ** 0.01<p≤0.05, * 0.05<p≤0.10. All sample sizes are rounded to the nearest 10 per National Center for Education Statistics guidelines. Baseline mean represents the weighted outcome mean for the analysis sample, for the target group, from 1991 and 1995 (excluding states in 1995 that had enacted statewide AFDC waivers).

32
Table 3 Main Results--Effects of Welfare Reform on Vocational Education
and Training and Employer Paid Schooling Controlling for State-specific Trends
NHES 1991-2005
Sample Target: Unmarried Women with Children, Less than College-Educated, Ages 25-54
Comparison: Unmarried Women with No Children, Less than College-Educated, Ages 25-54
Outcome Any Vocational
Education or Training
Full-Time Vocational
Education or Training
Part-Time Vocational
Education or Training
Any Other Work-Related
Courses
Any Employer-
Paid Schooling
Specification 1 2 3 4 5 Target 0.0436*
(0.0257) 0.0386* (0.0226)
-0.0120 (0.0164)
0.0450* (0.0235)
0.0084 (0.0219)
Any Welfare Reform -0.0127 (0.0342)
0.0463 (0.0277)
-0.0037 (0.0230)
-0.0063 (0.0372)
-0.0300 (0.0451)
Any Welfare Reform* Target
-0.0077 (0.0298)
-0.0385* (0.0224)
0.0144 (0.0180)
-0.0040 (0.0304)
0.0114 (0.0280)
Lagged State Covariates Yes Yes Yes Yes Yes State-specific Trends Yes Yes Yes Yes Yes Adj. R-squared 0.134 0.053 0.082 0.131 0.095 Observations 4160 2660 2700 3860 4980 Sample Baseline Mean for Target Group 0.1795 0.0447 0.0176 0.1356 0.1359
Notes: Any vocational education or training (1) includes full time (2), part-time (3), and other (4). Any employer-paid schooling (5) includes (1) or any college. Coefficient estimates are from linear probability models. The reference group in all models corresponds to no schooling. Standard errors are adjusted for arbitrary correlation within each state and reported in parentheses. All models include age and age squared, indicators for race and Hispanic ethnicity, indicators for high school graduate and less than high school, number of children less than 16 years of age in the household, number of residents in the household, urban residence, state fixed effects, year fixed effects, and the appropriate sampling probability weights. State covariates include state-level unemployment rate, real state personal income per capita, and indicators for state high school exit exam requirements. Lagged state covariates include one- and two-year lags of the welfare caseload, unemployment rate, and real personal income per capita. Significance is denoted as follows: *** p≤0.01, ** 0.01<p≤0.05, * 0.05<p≤0.10. All sample sizes are rounded to the nearest 10 per National Center for Education Statistics guidelines. Baseline mean represents the weighted outcome mean for the analysis sample, for the target group, from 1991 and 1995 (excluding states in 1995 that had enacted statewide AFDC waivers).
33
Table 4
Effects of TANF on Vocational Education and Training Differential Effects by State Education Policy, Sanctions, and Benefits Generosity under TANF
NHES 1991-2005
Panel A Differential Effects by State Education Policy Outcome Any Vocational
/ Work-Related Full-Time Vocational
Part-Time Vocational
Any Other Work-Related
Courses Specification 1 2 3 4 Target -0.0084
(0.0438) -0.0232 (0.0432)
-0.0595* (0.0343)
0.0282 (0.0447)
TANF 0.0145 (0.0508)
0.0865* (0.0497)
0.0929* (0.0486)
-0.0508 (0.0526)
TANF*Target 0.0509 (0.0569)
-0.0012 (0.0572)
0.0782* (0.0415)
0.0242 (0.0483)
TANF*Target* Education Not Authorized
-0.0624 (0.0695)
-0.0608 (0.0605)
-0.0747 (0.0460)
-0.0166 (0.0670)
Adj. R-squared 0.128 0.061 0.094 0.123 Observations 2910 1830 1860 2690
Panel B Differential Effects by State Sanctions Outcome Any Vocational
/ Work-Related Full-Time Vocational
Part-Time Vocational
Any Other Work-Related
Courses Specification 1 2 3 4 Target 0.0128
(0.0322) 0.0206
(0.0302) -0.0335 (0.0241)
0.0326 (0.0304)
TANF 0.0580 (0.0546)
0.1263** (0.0500)
0.1192** (0.0551)
-0.0220 (0.0557)
TANF*Target 0.0214 (0.0369)
-0.0322 (0.0377)
0.0515** (0.0211)
0.0037 (0.0330)
TANF*Target* Strict Sanctions
-0.0288 (0.0674)
-0.0265 (0.0478)
-0.0568 (0.0362)
0.0228 (0.0746)
Adj. R-squared 0.127 0.059 0.092 0.123 Observations 2910 1830 1860 2690
Panel C Differential Effects by State Benefits Generosity Outcome Any Vocational
/ Work-Related Full-Time Vocational
Part-Time Vocational
Any Other Work-Related
Courses Specification 1 2 3 4 Target 0.0091
(0.0410) 0.0522** (0.0216)
-0.0512** (0.0235)
0.0217 (0.0408)
TANF 0.1009 (0.0689)
0.1164** (0.0514)
0.1923*** (0.0587)
-0.0070 (0.0787)
TANF*Target 0.0202 (0.0447)
-0.0177 (0.0316)
0.0263 (0.0345)
0.0197 (0.0608)
TANF*Target* Low Benefits Generosity
-0.0137 (0.0599)
-0.0330 (0.0447)
0.0027 (0.0400)
-0.0081 (0.0719)
Adj. R-squared 0.128 0.061 0.094 0.123 Observations 2910 1830 1860 2690
Notes: See Tables 1 & 2. States which had implemented major waivers to their AFDC programs prior to 1995 are excluded from the sample. Models also control for interactions between the policy indicator and the target group indicator, and between the policy indicator and TANF. TANF represents the conditional difference between 1999, the first post-TANF NHES wave, and the pre-TANF wave 1995 which is the reference year indicator.

34
Table 5 Effects of TANF on Vocational Education and Training Differential Effects by Formal Educational Attainment
NHES 1991-2005
Sample Target: Unmarried Women with Children, Less than College-Educated, Ages 25-54
Comparison: Unmarried Women with No Children, Less than College-Educated, Ages 25-54
Outcome Any Vocational Education or Training
Any Other Work-Related Courses
Any Employer-Paid Schooling
Specification 1 2 3 Target 0.0832
(0.0661) 0.1217* (0.0630)
0.0664* (0.0349)
Any Welfare Reform 0.0463 (0.0500)
0.0666 (0.0487)
-0.0050 (0.0396)
Any Welfare Reform* Target
-0.0326 (0.0685)
-0.0621 (0.0633)
-0.0193 (0.0447)
Any Welfare Reform*Target* High School Graduate
0.0259 (0.0817)
0.0676 (0.0800)
0.0344
(0.0454)Lagged State Covariates Yes Yes Yes Adj. R-squared 0.133 0.131 0.094 Observations 4160 3860 4980 Sample Baseline Mean for Target Group 0.1795 0.1356
0.1359
Notes: Outcome definitions correspond to those in Table 2. Coefficient estimates are from linear probability models. The reference group in all models corresponds to no schooling. Standard errors are adjusted for arbitrary correlation within each state and reported in parentheses. All models include age and age squared, indicators for race and Hispanic ethnicity, indicators for high school graduate and less than high school, number of children less than 16 years of age in the household, number of residents in the household, urban residence, state fixed effects, year fixed effects, and the appropriate sampling probability weights. Models also control for interactions between welfare reform and high school graduate indicators, and between the target group and high school graduate indicators. State covariates include state-level unemployment rate, real state personal income per capita, and indicators for state high school exit exam requirements. Lagged state covariates include one- and two-year lags of the welfare caseload, unemployment rate, and real personal income per capita. Significance is denoted as follows: *** p≤0.01, ** 0.01<p≤0.05, * 0.05<p≤0.10. All sample sizes are rounded to the nearest 10 per National Center for Education Statistics guidelines. Baseline mean represents the weighted outcome mean for the analysis sample, for the target group, from 1991 and 1995 (excluding states in 1995 that had enacted statewide AFDC waivers).

35
Table 6 Effects of Welfare Reform on Any Schooling
NHES 1991-2005
Sample Target: Unmarried Women with Children, Less than College-Educated, Ages 25-54
Comparison: Unmarried Women with No Children, Less than College-Educated, Ages 25-54
Outcome Any Schooling Any Schooling Any Schooling Any Schooling Specification 1 2 3 4 Target 0.0542**
(0.0234) 0.0541** (0.0237)
0.0777 (0.0540)
0.0757 (0.0558)
Any Welfare Reform 0.0348 (0.0218)
-0.0278 (0.0322)
0.0383 (0.0404)
-0.0211 (0.0430)
Any Welfare Reform* Target -0.0190 (0.0278)
-0.0148 (0.0290)
-0.0492 (0.0567)
-0.0499 (0.0583)
Any Welfare Reform*Target* High School Graduate
_
_
0.0393 (0.0640)
0.0456 (0.0657)
Lagged State Covariates Yes Yes Yes Yes State-specific Trends No Yes No Yes Adj. R-squared 0.187 0.187 0.186 0.187 Observations 4980 4980 4980 4980 Sample Baseline Mean for Target Group (from 1991 survey) 0.2591 0.2591 0.2591 0.2591
Notes: Any schooling includes any vocational education or training, or college. Coefficient estimates are from linear probability models. The reference group in all models corresponds to no schooling. Standard errors are adjusted for arbitrary correlation within each state and reported in parentheses. All models include age and age squared, indicators for race and Hispanic ethnicity, indicators for high school graduate and less than high school, number of children less than 16 years of age in the household, number of residents in the household, urban residence, state fixed effects, year fixed effects, and the appropriate sampling probability weights. Models also control for interactions between welfare reform and high school graduate indicators, and between the target group and high school graduate indicators. State covariates include state-level unemployment rate, real state personal income per capita, and indicators for state high school exit exam requirements. Lagged state covariates include one- and two-year lags of the welfare caseload, unemployment rate, and real personal income per capita. Significance is denoted as follows: *** p≤0.01, ** 0.01<p≤0.05, * 0.05<p≤0.10. All sample sizes are rounded to the nearest 10 per National Center for Education Statistics guidelines. Baseline mean represents the weighted outcome mean for the analysis sample, for the target group, from 1991 and 1995 (excluding states in 1995 that had enacted statewide AFDC waivers).

36
Appendix Table 1 Effects of Welfare Reform on Schooling Outcomes
Controlling for AFDC Waivers and TANF Separately NHES 1991-2005
Sample Target: Unmarried Women with Children, Less than College-Educated, Ages 25-54
Comparison: Unmarried Women with No Children, Less than College-Educated, Ages 25-54 Outcome Any Degree Full-Time
Degree Part-Time
Degree Any Vocational
Education or Training
Full-Time Vocational Education
Part-Time Vocational Education
Any Other Work-Related
Courses
Any Employer-Paid Schooling
Any Schooling
Specification 1 2 3 4 5 6 7 8 9 Target 0.0582*
(0.0294) 0.0884*** (0.0312)
-0.0045 (0.0228)
0.0409 (0.0254)
0.0391* (0.0217)
-0.0151 (0.0169)
0.0442* (0.0228)
0.0116 (0.0217)
0.0544** (0.0232)
AFDC Waiver -0.0073 (0.0370)
-0.0130 (0.0319)
0.0049 (0.0302)
-0.0191 (0.0325)
0.0249 (0.0192)
-0.0111 (0.0206)
-0.0153 (0.0324)
-0.0236 (0.0493)
-0.0195 (0.0322)
AFDC Waiver*Target
-0.0290 (0.0476)
-0.0339 (0.0398)
-0.0018 (0.0380)
0.0020 (0.0432)
-0.0381 (0.0310)
0.0150 (0.0317)
0.0067 (0.0327)
-0.0011 (0.0504)
-0.0177 (0.0480)
TANF1 0.1473*** (0.0421)
0.1185*** (0.0321)
0.0844* (0.0457)
0.0738 (0.0445)
0.0810** (0.0344)
0.1076*** (0.0282)
0.0135 (0.0453)
-0.0498 (0.0428)
0.1106** (0.0414)
TANF*Target -0.0381 (0.0288)
-0.0498** (0.0224)
-0.0050 (0.0303)
-0.0085 (0.0296)
-0.0431* (0.0218)
0.0134 (0.0172)
-0.0030 (0.0312)
0.0152 (0.0280)
-0.0148 (0.0277)
Lagged State Covariates Yes Yes Yes Yes Yes Yes Yes Yes Yes Adj. R-squared 0.260 0.206 0.179 0.134 0.054 0.074 0.131 0.094 0.187 Observations 3350 2910 2960 4160 2660 2700 3860 4980 4980
Notes: See notes from Tables 1 and 2. Models 1-3 correspond to results reported in Table 1; models 4-8 correspond to results reported in Table 2; and model 9 corresponds to specification 1 in Table 6.