Embed Size (px)
Citation preview
BIS Papers No 54 133
Effects of reserve requirements in an inflation targeting regime: the case of Colombia
Hernando Vargas Herrera, Yanneth R Betancourt, Carlos Varela and Norberto Rodríguez1
1. Introduction
The Colombian economy and financial system have coped reasonably well with the effects of the global financial crisis. Hence, “unconventional” policy measures have not been at the centre of the Colombian central bank’s policy decisions and discussions.
Even though bank loans decelerated markedly in 2009, they are still growing in real terms and credit markets have not experienced the severe crunch that is hindering economic growth in other parts of the world. Deposit, loan, bond and interbank markets have not undergone any important disruption. This has been a consequence of the restrictions and prudential regulation that existed before 2006 or which were introduced thereafter (Uribe (2008a,b, 2009)). As a result, there has been little room for “unconventional” financial/monetary policy measures aimed at preserving liquidity in key markets or at reactivating the credit channel for firms and households. For example, the collateral requirements and maturity of central bank credit facilities have remained basically unchanged since the onset of the crisis.
At the same time, annual consumer price index (CPI) inflation decreased significantly from 7.67% in December 2008 to 2% a year later. Unlike other countries, however, this reversion has not turned into deflation, and the economic slowdown has been relatively moderate. Thus, nominal short-term interest rates have not hit the zero bound and have remained the main monetary policy tool. “Quantitative easing” measures have not been central in the policy response.
Changes in reserve requirements (RRs) on financial system deposits have been the one “unconventional” monetary instrument used by the central bank in Colombia. Interestingly, they were adopted before the global financial crisis, as a reaction to domestic credit conditions. Between the second half of 2006 and the first half of 2007, the Colombian financial system produced a rapid expansion of loan supply, partially offsetting the monetary policy tightening pursued by the central bank to curb excessive expenditure growth and inflation. Marginal reserve requirements were then introduced in May 2007 to try to reinforce the transmission of policy interest rate increases and limit credit growth. Towards the third quarter of 2008, the economy started to show signs of a slowdown and, as uncertainty about the effects of the crisis increased the liquidity risk perception of financial intermediaries, some local lending interest rates rose in the fourth quarter of 2008. The central bank responded by reducing RRs to increase the liquidity in the hands of banks.
What is the role of RRs as a monetary policy tool in an inflation targeting (IT) regime, where the central bank stabilises the short-term interest rate? What were the effects of the changes
1 The authors are, respectively, Deputy Governor of the Central Bank and staff members of the Economic
Studies Subdirectorate at the Banco de la República, Colombia’s central bank (corresponding author’s e-mail: [email protected]). The opinions expressed in this paper are those of the authors and do not represent the views of the Banco de la República or its Board of Directors. We are especially grateful to Mauricio Salazar for his invaluable help and to Luisa Silva for her help with the database.

134 BIS Papers No 54
in RRs on the transmission of policy rate movements? Were the changes in RRs effective in achieving the objectives that motivated them? This paper attempts to answer such questions. The next section provides the rationale for the use of RRs as a monetary policy instrument in an IT regime, both theoretically and in the context of the Colombian economy over the past three years. The effects of RR changes are empirically examined in the third section. The final section concludes.
2. The rationale for reserve requirements as a monetary policy tool in an inflation targeting regime
a. Events in Colombian credit markets
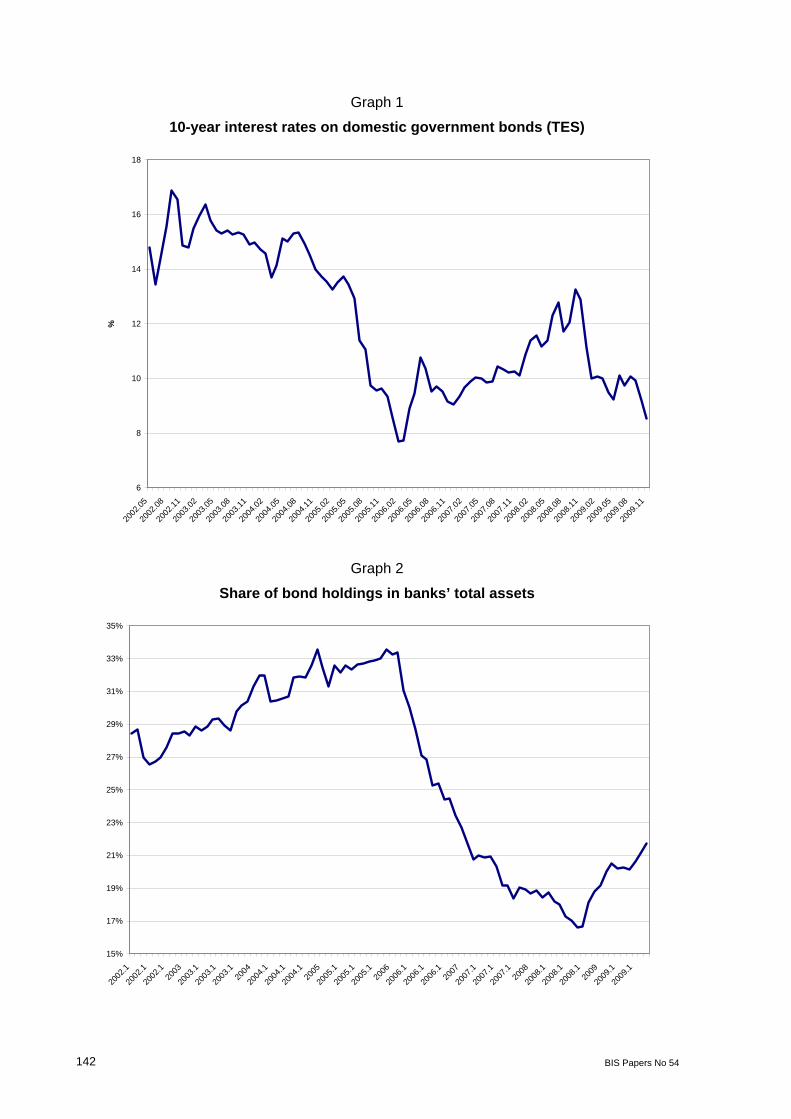
Following a prolonged decline in sovereign risk premia and inflation, local government bond long interest rates fell significantly between 2003 and 2005 (Graph 1). Colombian financial intermediaries had steadily increased their share of local public bonds in total assets since 2003 (Graph 2) and had benefited substantially from the rising trend in public bond prices. By the first quarter of 2006, bond holdings represented around a third of banks’ assets, implying a large exposure to unhedged market risk (Vargas et al (2006)). These institutions sustained large losses in the second quarter of 2006, when a spike in global risk aversion caused a drop in the price of domestic public bonds.
In response, financial intermediaries reduced their exposure to market risk and abruptly shifted their asset portfolios away from government bonds and into loans to firms and households (Graph 2). In doing so, they delayed or offset the tightening of monetary policy that the central bank had started in April 2006 to slow aggregate expenditure and prevent emerging inflationary pressures (Graph 3). While policy interest rates increased throughout 2006 and in the first quarter of 2007, consumer, commercial and mortgage lending rates dropped or remained stable (Graphs 4 and 5). Only short-term commercial bank treasury rates and prime lending rates increased along with the policy interest rate (Graph 6).
At the same time, average financial system credit real growth rates jumped from 15.2% in the first half of 2006 to 25.3% in the second semester of 2006 and 26.3% in the first half of 2007 (Graph 7). The behaviour of prices and quantities in the loan markets suggested the effect of a supply shock generated by the shift in the bank asset portfolio. The near one-year delay in the transmission of policy rate hikes (Graphs 4 and 5) and the abrupt jump of loan growth raised concerns in the central bank about both price and financial stability. There was also apprehension about the quality of the new loans, especially in the consumer credit segment (Graph 8).2
Hence, it was deemed crucial to intervene in the credit markets to prevent excessive leverage of the private sector and control the credit risk of the financial system. Loan provisioning requirements were increased by the Financial Superintendency,3 while the
2 Consumer credit growth rates went from 29.4% on average in the second half of 2005 to 37.5% in the first half
of 2006, 42.2% in the second half of 2006 and 39.5% in the first half of 2007. 3 A system to manage commercial loan credit risk (SARC) was introduced by the Financial Superintendency in
July 2007. This system determines the loan provisioning requirements for commercial loans depending on each loan’s risk qualification. Since higher provisions were foreseen before implementation, the Superintendency required a gradual upward adjustment in provisions prior to the formal introduction of SARC. Something similar occurred with the adoption of an analogous system for consumer credit. The system was formally introduced in July 2008, but provisioning requirements were raised from June 2007.
BIS Papers No 54 135
central bank introduced marginal RRs on domestic deposits in May 2007 (Table 1). RRs on foreign indebtedness were reactivated as a complementary measure.
In June 2007, RRs and their remuneration were again modified to combine savings accounts and sight deposits in one group.4 The rationale was that the distinction between these types of deposits in terms of liquidity had been blurred, so their RRs should be levelled as well. A year later, the central bank changed the RRs again in order to sterilise part of the monetary expansion caused by a programme of international reserve purchases. This time, the marginal RRs were eliminated, but the average levels were increased (Table 1).
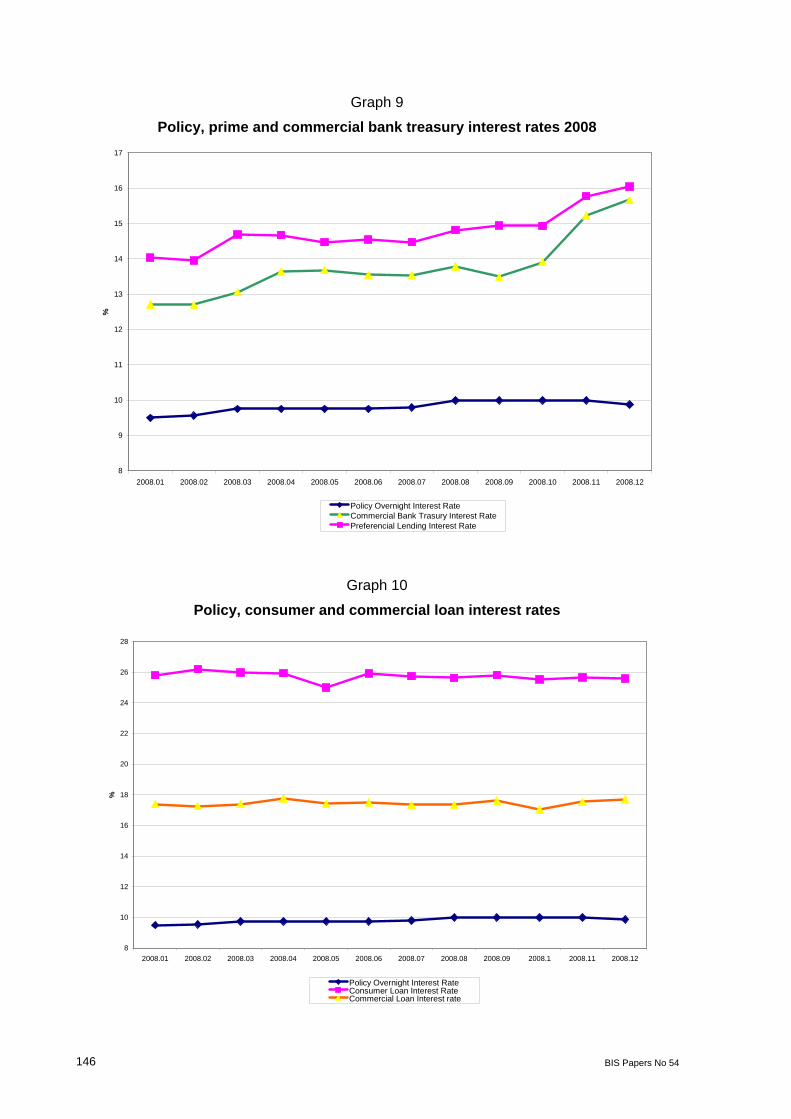
In the last quarter of 2008, following the failure of Lehman Brothers, commercial bank treasury interest rates and prime lending rates rose (Graph 9). Interestingly, in the same period, longer maturity loan rates (consumer and commercial) did not increase (Graph 10), suggesting that, at that time, financial intermediaries were mostly concerned about liquidity and not credit risk. A bank liquidity gap indicator shows a slight deterioration in the same period (Graph 11).5 The central bank then acted pre-emptively, allowing the currency to depreciate with minimal intervention in the foreign exchange (FX) market and reducing RRs to ensure the availability of local currency liquidity (Table 1). Finally, remuneration of RRs was reduced in January 2009 and eliminated altogether in July 2009.
In sum, RRs have been used in Colombia since May 2007 to enhance the transmission of policy interest rates and curb credit growth, to sterilise FX purchases by the central bank and to guarantee the provision of liquidity in periods of potential turmoil. Among these objectives, the first deserves special attention, as RRs had been used in the past in Colombia as a monetary policy tool under financially repressed monetary targeting regimes. Their use in an IT regime, where the central bank stabilises the interest rate in the short term, had no precedent in the country.
b. Reserve requirements in an inflation targeting regime
In a monetary targeting regime, an increase in RRs causes a rise in base money demand and, given the money supply, pushes up short-term interest rates. In a regime that stabilises short-term interest rates, such as the conventional IT strategy, the central bank will provide the additional money demand implied by larger RRs, so that short-term interest rates do not change. Thus, the effects of RRs in such a regime are not as straightforward as those under a monetary targeting regime.
In an IT regime, RRs may directly affect market interest rates and the pass-through from the policy interest rate to those interest rates. In both cases, the results would depend on the degree of substitution between central bank credit and deposits, as explained below.
(i) Direct effects of reserve requirements on market interest rates One effect stems from the fact that RRs constitute a tax on financial intermediation. Therefore, higher RRs are reflected in larger interest rate spreads. However, as long as central bank credit is a close substitute of deposits as a source of funds for banks, higher RRs will produce a fall in deposit interest rates, leaving lending rates unchanged. Intuitively, a step up in RRs makes deposits more expensive, reduces bank demand for deposits and increases bank demand for central bank credit. If the interest rate on the latter (the policy
4 The existing regime remunerated RR on savings accounts and CDs. 5 Liquidity gap indicator = (liquid liabilities - liquid assets)/illiquid assets. Liquid assets include domestic
government bonds whose prices fell during the Lehman Brothers crisis. This may help to explain the observed increase in the indicator.

136 BIS Papers No 54
rate) is constant, the marginal cost of funds for banks does not change and neither does the lending interest rate. In contrast, the fall in bank demand for deposits reduces their interest rate.
A key assumption in the foregoing analysis is the high degree of substitution between deposits and central bank credit as funding sources for banks. If that is not the case, a rise in RRs will not be fully accommodated with a larger use of central bank credit. Thus, both bank loan supply and demand for deposits will be affected, as will lending and deposit rates.
Betancourt and Vargas (2009) show that, in the presence of interest rate risk and risk-averse banks, central bank credit and deposits are not perfect substitutes. In this case, an increase in RRs in an interest rate smoothing monetary regime raises lending rates and has an ambiguous effect on deposit rates. Intuitively, higher RRs make deposits more expensive and tend to reduce bank demand for deposits and increase bank demand for central bank credit. Nevertheless, a larger reliance on term central bank credit adds to interest rate risk when the latter has shorter maturities than loans. The increased risk reduces the perceived benefits of loans for risk-averse banks, restricts loan supply and drives lending interest rates up.
The net effect on bank demand for deposits is uncertain. On the one hand, higher RRs make them more expensive for banks and reduce demand. On the other, if deposits have longer maturities than central bank credit, a larger reliance on the latter generates higher interest rate risk, makes deposits more convenient and increases deposit demand by banks.6 As a result, the effect on deposit interest rates is also ambiguous.
The impact of RRs on the volume of loans and deposits follows the effects they have on the respective interest rates. If credit demand is inversely related to the lending rate, higher RRs imply higher loan interest rates and a smaller volume of credit. Given a deposit supply schedule, higher RRs have an ambiguous effect on the volume of deposits.
(ii) Effects of reserve requirements on interest rate pass-through RRs may not only affect market interest rates directly, but also influence the pass-through from policy rates to market rates, ie the transmission of monetary policy is determined to some extent by the RRs. A policy interest rate hike makes central bank credit more expensive and induces banks to rely more on deposits, pushing up deposit interest rates. The marginal cost of funds for banks increases, bank loan supply is cut and lending interest rates go up. In this context, higher RRs do not affect transmission to loan rates, but they do influence deposit rates. Increased RRs imply costlier additional deposits and, therefore, a smaller expansion of deposit demand by banks. Thus, the transmission of the policy interest rate hike to deposit rates decreases with the level of RRs.
The effect of RRs on monetary policy transmission is further complicated when RRs affect the risks facing banks. For example, in the case studied by Betancourt and Vargas (2009), RRs induce demand for central bank credit by banks to fund their assets, exposing them to interest rate risk. In this situation, a policy rate hike amplifies interest rate risk by raising the need for short-term central bank credit in the future, as the initial borrowing plus the accrued interest must be rolled over. The rise in interest rate risk is larger when central bank credit is larger too, which is likely when RRs are higher.
Moreover, higher RRs reduce the amount by which additional deposits alleviate interest rate risk. In this case, one additional dollar in deposits yields less funds to be used to substitute for central bank credit. These effects entail a larger cut in bank loan supply in the face of a
6 In a world with several types of deposits, it also leads to a greater reliance on long-term deposits.

BIS Papers No 54 137
policy interest rate increase. Therefore, RRs strengthen the pass-through from policy rates to lending interest rates.
The impact of RRs on the pass-through to deposit interest rates is ambiguous in this case. On the one hand, additional deposits are less profitable in the presence of higher RRs, so deposit demand by banks expands less after a policy interest rate rise, as mentioned above. On the other hand, higher RRs exacerbate the interest rate risk related to central bank credit and induce banks to demand more deposits instead.
Finally, it should be noted that these outcomes depend on the extent to which the central bank is a net creditor of the financial system. When the supply of the monetary base is large relative to bank reserves, central bank credit to financial institutions may be low or negative, even if RRs are high (in percentage). In the case of Colombia in recent years, for example, international reserve accumulation has provided financial intermediaries with large amounts of new deposits, reducing the net creditor position of the central bank. According to the foregoing hypotheses, this would weaken interest rate pass-through, since the interest rate risk facing banks is lower. Appendix 1 formally shows these results in the context of the model by Betancourt and Vargas (2009).
3. Effects of reserve requirements in Colombia
a. Reserve requirement measures
To gauge the effects of RRs in Colombia, their aggregate measures must be generated (in addition to the deposit-specific ratios). These measures must be related to the purpose for which the RRs were set. The same concept of aggregate RRs may not necessarily be useful to pin down the effects on both the liquidity of the financial system and the impact on credit expansion or market interest rates. In Colombia, this is further complicated because of the many changes in the structure of RRs between 2006 and 2009, including the establishment of marginal RRs and shifts in RR remuneration (Table 1).
A simple measure of RRs is the ratio of observed required reserves to deposits subject to RRs (ORR). This indicator includes both average and marginal RRs (when effective) and is affected by the changes in deposit composition occurring throughout the period. While ORR is useful to capture the liquidity changes introduced by RR policy, it may not be the best measure of the effect of RR changes on the marginal cost of bank funds and market interest rates. It may put too much weight on average rather than marginal RRs and does not consider movements in RR remuneration.
The last drawback is especially relevant in 2007 and 2009, when RR remuneration was changed (Table 1). In addition, the existence of RR remuneration affects the actual burden of RRs on the marginal cost of bank funds, so the ORR ratio alone may overestimate the impact of RR policy on market interest rates. To correct for this possible bias, two remuneration-adjusted RR (RARR) concepts were calculated, as explained in Appendix 2. One allows for changes in deposit composition through time, while the other assumes a fixed composition equal to the May 2002–November 2009 average. This distinction may be important, for RR shifts induced important recompositions of deposits in some periods (Saade and Pérez (2009)).
Graph 12 shows that the dynamics of the three measures are similar until 2009, when RR remuneration was reduced and ultimately eliminated (Table 1). In that year, the RARR gauges increased, indicating that the burden of RRs on market financial intermediation rose, despite the fact that RR ratios remained stable. Throughout the period 2002–08, RR remuneration implied a reduction of roughly 1 percentage point in RR ratios in terms of their effect on the marginal cost of deposits (Graph 12).

138 BIS Papers No 54
b. Reserve requirements, interest rates and liquidity
Based on a simple inspection of the data, it is difficult to judge the effectiveness of RR policy in influencing market interest rates. Graph 13 indicates that short-term CD interest rates (90–360 days) tracked policy interest rates more closely after 2006. Savings account interest rates are generally more sluggish than policy rates. Longer-term CD interest rates (greater than 360 days) are more volatile than other deposit interest rates, a feature that may be attributed to the relatively small issuance of this type of deposit.
The spread between short-term CD interest rates and the policy rate started to increase around the time that marginal RRs were adopted and has been growing slowly ever since (Graphs 14 and 15). The spreads for the other deposit interest rates do not exhibit a clear relationship with RRs. In the particular case of savings account interest rates, their spread with respect to the policy rate fell after marginal RRs were introduced, but rose in 2009 when RARR measures increased (Graph 16).
With regard to loan interest rates, the impact of RRs is not apparent either. The spreads between lending and policy interest rates tended to increase or stopped falling by the end of 2006 and the beginning of 2007, before marginal RRs were imposed (Graph 17). The consumer loan interest rate spread shifted abruptly in February 2007 due to a redefinition of the usury limits, which seem to be binding for a significant fraction of those loans.
Interestingly, the spreads between commercial bank treasury and prime lending rates with respect to the policy rate started to fall at the beginning of 2009, after RRs had been reduced to increase liquidity. The central bank was successful in this regard, since the cumulative effect of international reserve purchases and the reduction of RRs expanded liquidity in money markets, as reflected by the growing deviation of the interbank overnight interest rate from the policy rate (Graph 18).
In general, capturing the effects of RRs on market interest rates and interest rate pass-through requires controlling for other variables affecting deposit and credit markets, such as economic growth, expectations of future policy rates, credit and sovereign risk shifts, etc. An empirical exercise along these lines is presented in the next section.
c. Econometric evidence
(i) Market interest rate models and the effects of reserve requirements To assess the effect of RRs on market interest rates and interest rate pass-through, a simple model is posited in the spirit of the expectations theory of interest rates:
tttbom Xfsiitt
)(1 (1)
imt is a deposit or loan interest rate, ibt is the overnight policy interest rate, st is the slope of the zero coupon curve for government bonds corresponding to the average maturity of the deposit or loan, and f(Xt) is a function of variables affecting the specific loan or deposit market, such as industrial production, credit risk, RRs, etc. The slope of the zero coupon curve is intended to proxy the expectations on future central bank interest rates and is defined as:
tt brft iis
irft is the risk-free interest rate for the maturity of the corresponding market interest rate (approximated by the government zero coupon interest rate).

BIS Papers No 54 139
Equation (1) represents a long-term relationship between market interest rates and their determinants. This is complemented with an error correction equation describing the short-term dynamics:
tttmbttm uXLsLiLieLittt
111 11
t represents the error correction term. The influence of RRs on interest rate pass-through is captured by the term et , which shows the additional short-term effect of policy interest rates on market rates due to RRs.
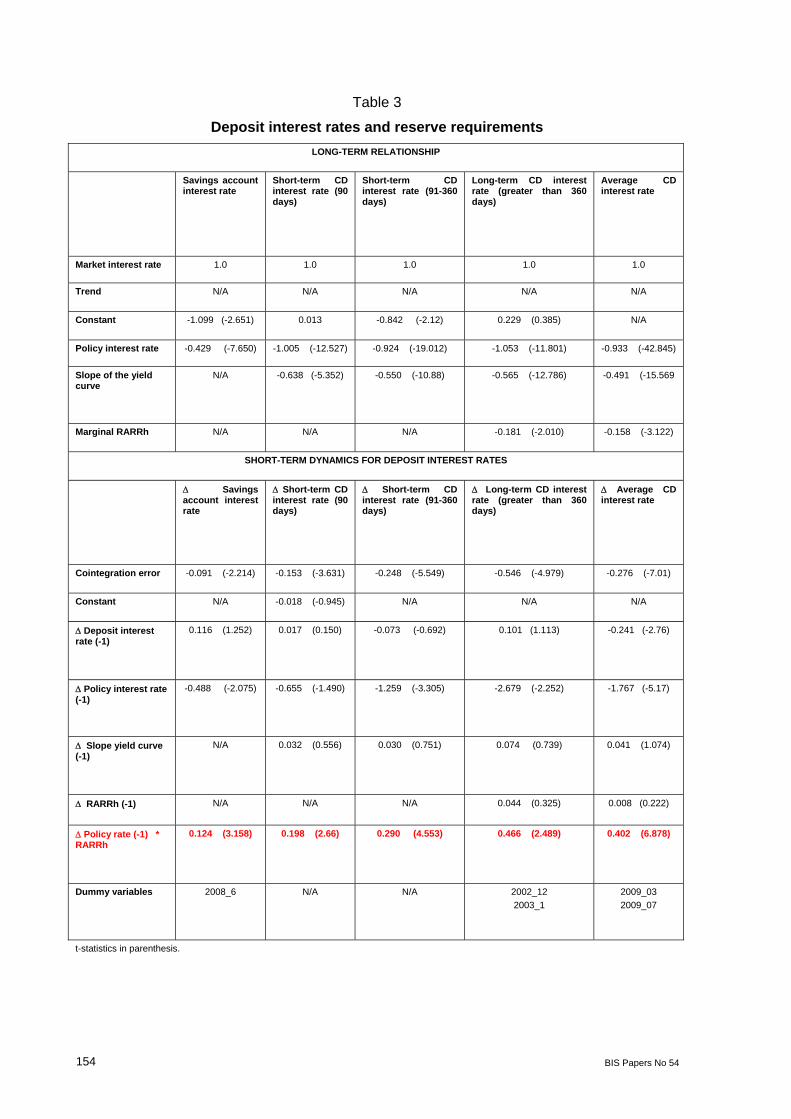
The estimations were made for different loan and deposit interest rates using Colombian monthly data for the period May 2002–October 2009. The Johansen VEC Cointegration methodology was used. According to the information criteria (Schwarz and Akaike) only one lag turned out to be significant in the VEC models for all cases. After verifying normality7 – the existence of at least one cointegrating vector with the expected signs and weak endogeneity of market interest rates – we found the following results (Tables 2 and 3):
Long-term relationships:
A positive relationship between the policy interest rate and market rates, except for the mortgage rate. With the exception of the savings account and consumer loan rates, in all cases the long-term coefficient of the policy rate is close to unity. For savings account rates, the coefficient is significantly less than 1 and for consumer loan rates is greater than 1.
Mortgage loan rates are positively related to long-term government bond rates, with a coefficient close to 1.
The slope of the zero coupon curve enters positively in the long-term relationship for consumer, prime and average lending rates. It also appears in the equations for CD interest rates.
The RARRh ratio is directly related to commercial, prime and commercial bank treasury interest rates, in line with the hypotheses presented above.
Marginal CD RARR ratios have a significant positive impact in the longer-term and average CD interest rates. Interestingly, longer-term CDs, which have a zero RR, are positively affected by other CD marginal RRs. This is possibly caused by a shift in the composition of deposits induced by changes in the RR structure.
(Seasonally adjusted) industrial production was found to be directly related to commercial, prime and commercial bank treasury interest rates.
Short-term dynamics:
The combined effect of the RARRh ratio and the change in the policy rates is significantly positive in the short-term dynamics for all market interest rates, except mortgage rates.8 In other words, the interest rate pass-through appears to be generally strengthened by the RRs.9
7 In some cases, it was necessary to include dummy variables for particular dates in order to obtain normality. 8 However, mortgage rates are positively affected by changes in policy interest rates in the short-term
dynamics. 9 These results did not change when the RARRc measure was used.
140 BIS Papers No 54
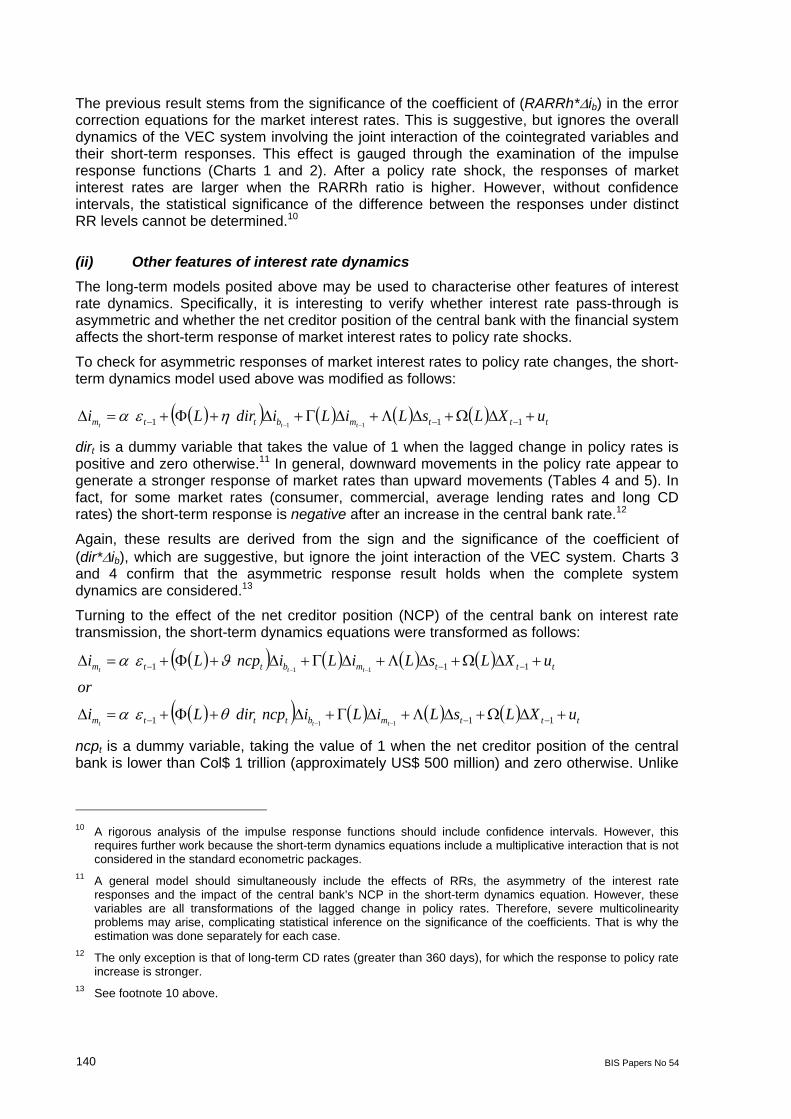
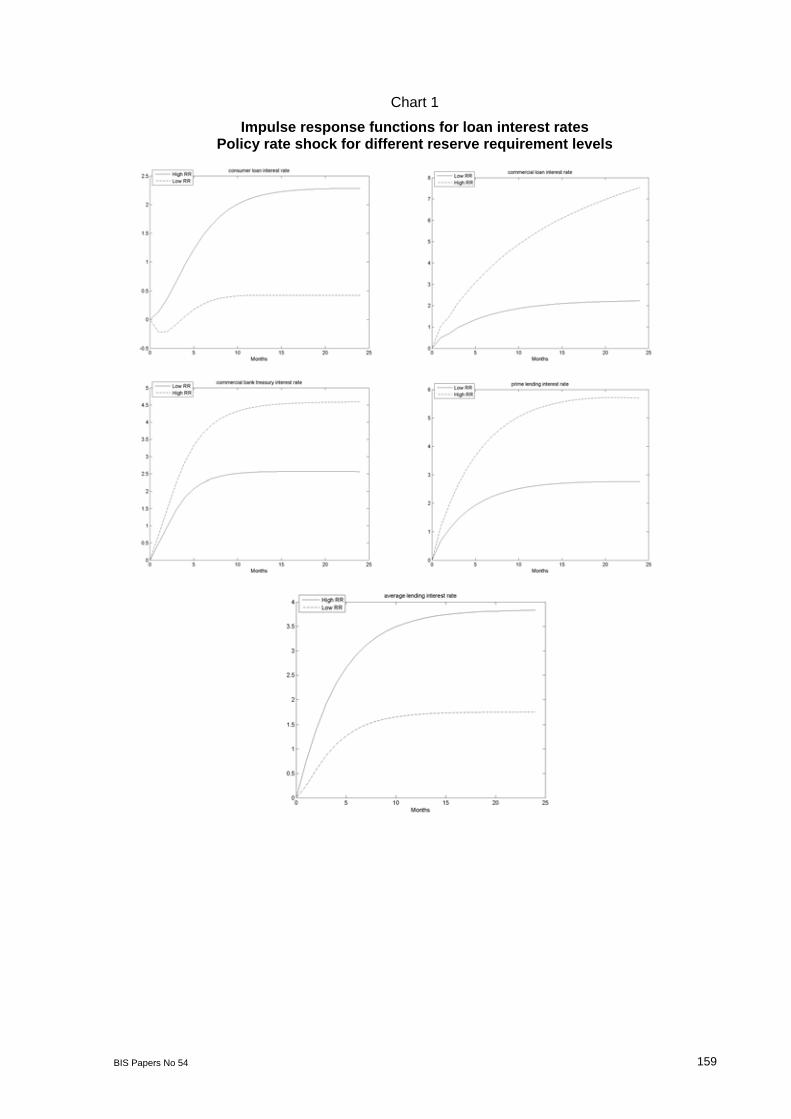
The previous result stems from the significance of the coefficient of (RARRh*ib) in the error correction equations for the market interest rates. This is suggestive, but ignores the overall dynamics of the VEC system involving the joint interaction of the cointegrated variables and their short-term responses. This effect is gauged through the examination of the impulse response functions (Charts 1 and 2). After a policy rate shock, the responses of market interest rates are larger when the RARRh ratio is higher. However, without confidence intervals, the statistical significance of the difference between the responses under distinct RR levels cannot be determined.10
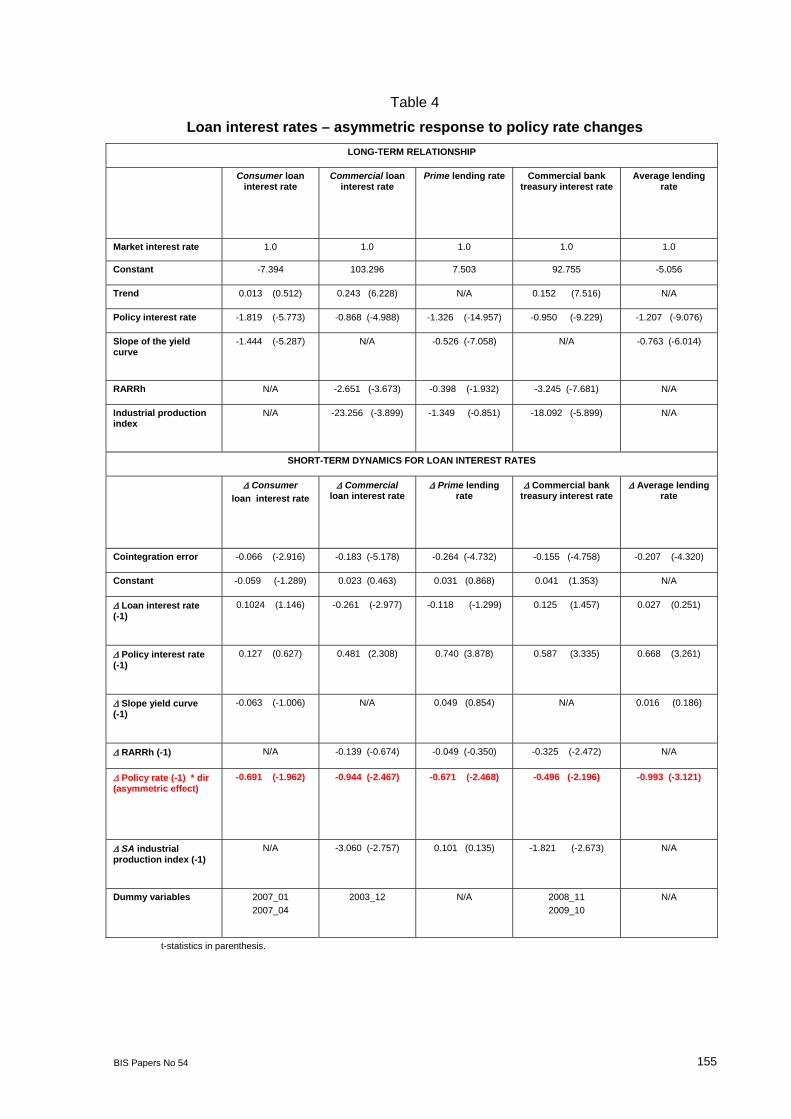
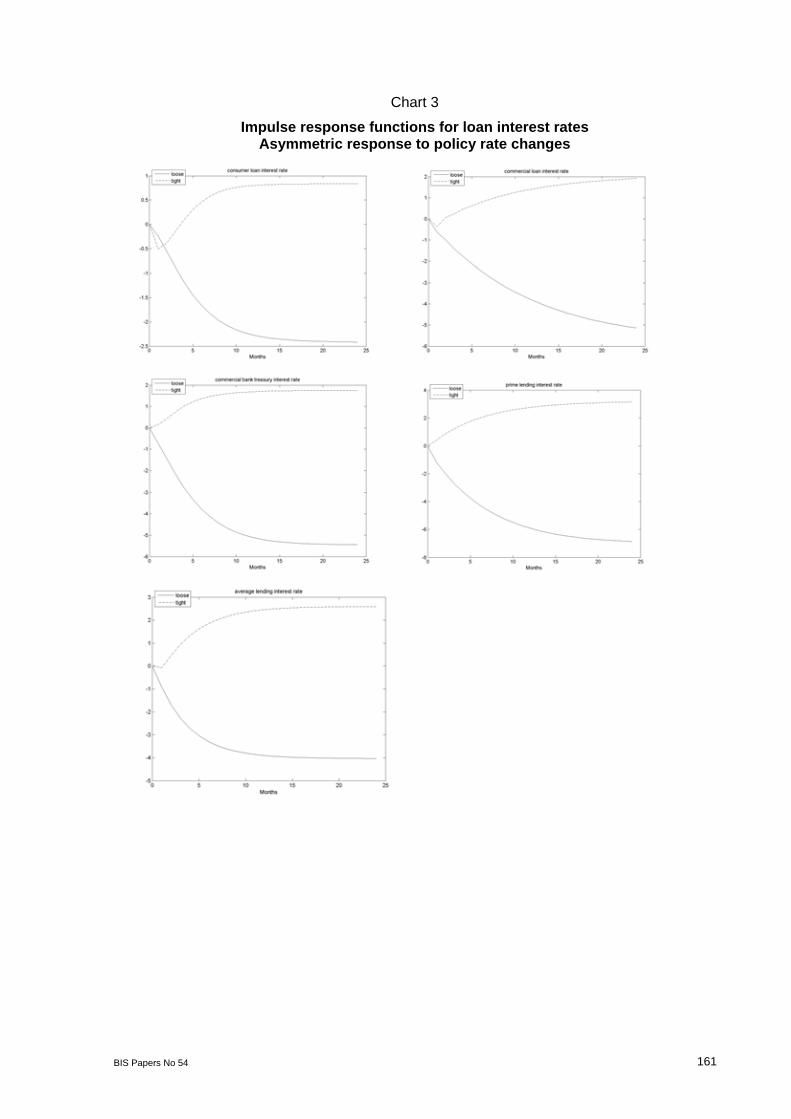
(ii) Other features of interest rate dynamics The long-term models posited above may be used to characterise other features of interest rate dynamics. Specifically, it is interesting to verify whether interest rate pass-through is asymmetric and whether the net creditor position of the central bank with the financial system affects the short-term response of market interest rates to policy rate shocks.
To check for asymmetric responses of market interest rates to policy rate changes, the short-term dynamics model used above was modified as follows:
tttmbttm uXLsLiLidirLittt
111 11
dirt is a dummy variable that takes the value of 1 when the lagged change in policy rates is positive and zero otherwise.11 In general, downward movements in the policy rate appear to generate a stronger response of market rates than upward movements (Tables 4 and 5). In fact, for some market rates (consumer, commercial, average lending rates and long CD rates) the short-term response is negative after an increase in the central bank rate.12
Again, these results are derived from the sign and the significance of the coefficient of (dir*ib), which are suggestive, but ignore the joint interaction of the VEC system. Charts 3 and 4 confirm that the asymmetric response result holds when the complete system dynamics are considered.13
Turning to the effect of the net creditor position (NCP) of the central bank on interest rate transmission, the short-term dynamics equations were transformed as follows:
tttmbtttm
tttmbttm
uXLsLiLincpdirLi
or
uXLsLiLincpLi
ttt
ttt
111
111
11
11
ncpt is a dummy variable, taking the value of 1 when the net creditor position of the central bank is lower than Col$ 1 trillion (approximately US$ 500 million) and zero otherwise. Unlike
10 A rigorous analysis of the impulse response functions should include confidence intervals. However, this
requires further work because the short-term dynamics equations include a multiplicative interaction that is not considered in the standard econometric packages.
11 A general model should simultaneously include the effects of RRs, the asymmetry of the interest rate responses and the impact of the central bank’s NCP in the short-term dynamics equation. However, these variables are all transformations of the lagged change in policy rates. Therefore, severe multicolinearity problems may arise, complicating statistical inference on the significance of the coefficients. That is why the estimation was done separately for each case.
12 The only exception is that of long-term CD rates (greater than 360 days), for which the response to policy rate increase is stronger.
13 See footnote 10 above.

BIS Papers No 54 141
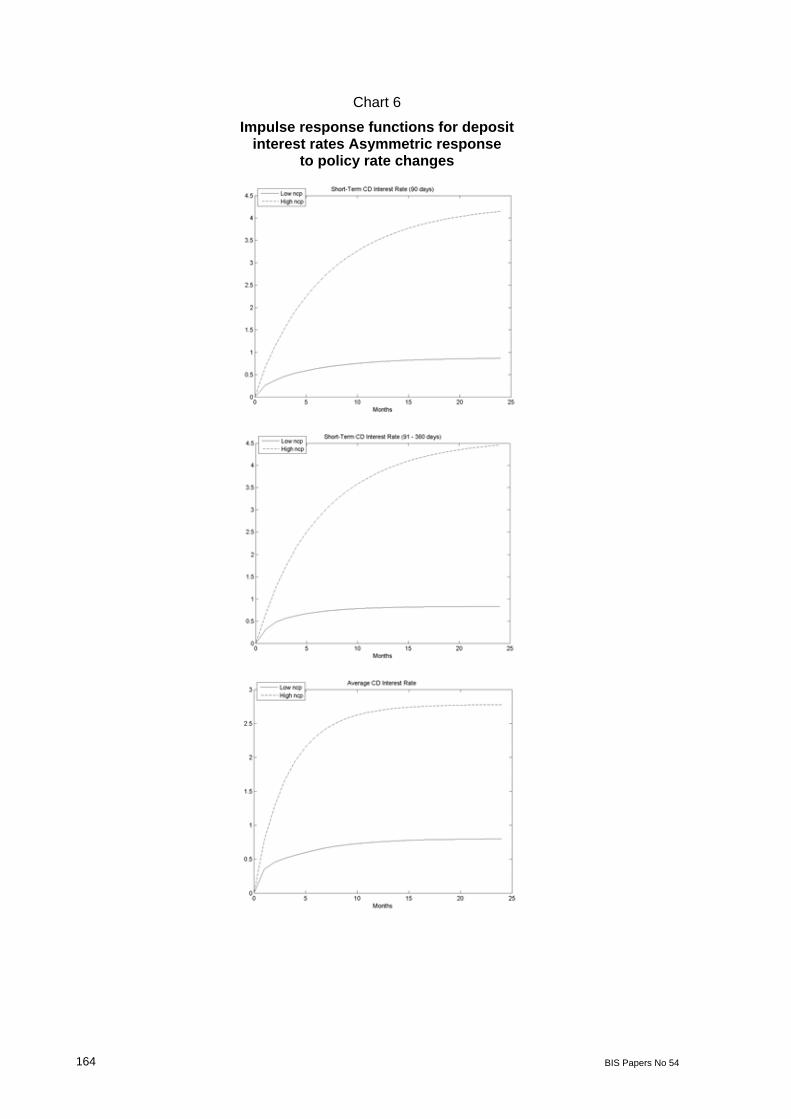
the effect of RARRh on interest rate pass-through and the asymmetric responses to policy rate changes, the influence of the central bank’s NCP is not general. It is restricted to a few lending interest rates (commercial bank treasury and prime lending rates) and most deposit rates (Tables 6 and 7). In these cases, a low or negative NCP weakens the interest rate pass-through in both directions. For an increase in policy rates, the abundant liquidity implied by the low NCP runs counter to the policy tightening. For a decrease in policy rates, it is possible that the market rates are already low in response to the small NCP. Hence, when the policy rate is reduced, a strong concurrent movement in the market rate is not observed. Impulse response function analysis corroborates these results when allowing for complete VEC system dynamics (Charts 5 and 6).
Finally, the interaction of ncpt and dirt has negative coefficients for commercial treasury lending rates, savings and short-term CD rates (Tables 6 and 7), indicating that the transmission of policy interest rate increases is diminished when the central bank’s NCP is low or negative.
4. Conclusions
RRs have been used in Colombia under an IT regime with different objectives. In 2007, RR increases were aimed at speeding up monetary policy transmission and curbing excessive credit growth. In 2008, RRs were again raised to sterilise part of the monetary expansion resulting from international reserve purchases. Later that year, they were reduced to ensure the provision of adequate liquidity in the context of heightened uncertainty brought about by the Lehman Brothers crisis.
The effects of RRs on interest rate and interest rate pass-through in an IT regime are not as straightforward as those under a monetary targeting regime. Conceptually, those effects depend on the degree of substitution between deposits and central bank credit as sources of bank funding and on the extent to which RR changes affect the risks facing banks. The empirical results for Colombia suggest that RRs are important long-term determinants of business loan interest rates and have been effective in strengthening the pass-through from policy to deposit and lending interest rates.
These findings support the use of RRs as a policy instrument in an IT regime in terms of their effectiveness in reinforcing monetary policy transmission. These benefits must be contrasted with the fact that RRs are costly taxes on financial intermediation and may be too blunt a tool to fine-tune the adjustment of credit markets or aggregate demand. Hence, their use is justified when policymakers perceive that standard, less costly policy instruments are deemed insufficient to maintain price or financial stability.
The empirical models used to assess the impact of RRs on interest rates were also exploited to characterise other features of the dynamics of interest rate pass-through. For Colombia, policy rate transmission seems to be asymmetric, with rate drops generating larger responses of market rates than policy rate increases. Moreover, a low NCP of the central bank with the financial system appears to weaken the transmission of policy rates to CD and short-term lending interest rates.
142 BIS Papers No 54
Graph 1
10-year interest rates on domestic government bonds (TES)
6
8
10
12
14
16
18
2002
.05
2002
.08
2002
.11
2003
.02
2003
.05
2003
.08
2003
.11
2004
.02
2004
.05
2004
.08
2004
.11
2005
.02
2005
.05
2005
.08
2005
.11
2006
.02
2006
.05
2006
.08
2006
.11
2007
.02
2007
.05
2007
.08
2007
.11
2008
.02
2008
.05
2008
.08
2008
.11
2009
.02
2009
.05
2009
.08
2009
.11
%
Graph 2
Share of bond holdings in banks’ total assets
15%
17%
19%
21%
23%
25%
27%
29%
31%
33%
35%
2002
.1
2002
.1
2002
.120
03
2003
.1
2003
.1
2003
.120
04
2004
.1
2004
.1
2004
.120
05
2005
.1
2005
.1
2005
.120
06
2006
.1
2006
.1
2006
.120
07
2007
.1
2007
.1
2007
.120
08
2008
.1
2008
.1
2008
.120
09
2009
.1
2009
.1

BIS Papers No 54 143
Graph 3
Domestic absorption growth and core inflation
0.0%
2.0%
4.0%
6.0%
8.0%
10.0%
12.0%
01/03/
2005
01/06/
2005
01/09/
2005
01/12/
2005
01/03/
2006
01/06/
2006
01/09/
2006
01/12/
2006
01/03/
2007
01/06/
2007
01/09/
2007
01/12/
2007
Dom
esti
c A
bsor
ptio
n (r
eal a
nnua
l gro
wth
l)
3.0%
3.5%
4.0%
4.5%
5.0%
Core
Infla
tion
Domestic Absorption
Core Inflation (ex food and regulated prices)
Graph 4
Policy interest rate and consumer credit interest rate
17
18
19
20
21
22
23
2006
.01
2006
.02
2006
.03
2006
.04
2006
.05
2006
.06
2006
.07
2006
.08
2006
.09
2006
.10
2006
.11
2006
.12
2007
.01
2007
.02
2007
.03
2007
.04
2007
.05
2007
.06
%
5
5.5
6
6.5
7
7.5
8
8.5
9
9.5
Consumer Credit Interest Rate
Policy Overnight Interest Rate (Right)

144 BIS Papers No 54
Graph 5
Policy, average, commercial and mortgage interest rates
12
13
14
15
16
17
18
2006
.01
2006
.02
2006
.03
2006
.04
2006
.05
2006
.06
2006
.07
2006
.08
2006
.09
2006
.10
2006
.11
2006
.12
2007
.01
2007
.02
2007
.03
2007
.04
2007
.05
2007
.06
%
5
5.5
6
6.5
7
7.5
8
8.5
9
9.5
Average Lending Interest RateCommercial Interest RateMortgage Interest RatePolicy Overnight Interest Rate (Right)
Graph 6
Policy, prime and commercial bank treasury interest rates
6
7
8
9
10
11
12
13
2006
.01
2006
.02
2006
.03
2006
.04
2006
.05
2006
.06
2006
.07
2006
.08
2006
.09
2006
.10
2006
.11
2006
.12
2007
.01
2007
.02
2007
.03
2007
.04
2007
.05
2007
.06
%
5
5.5
6
6.5
7
7.5
8
8.5
9
9.5
Commercial Bank Treasury Interest RatePrime Lending Interest RatePolicy Overnight Interest Rate( (Right)

BIS Papers No 54 145
Graph 7
Real bank loan annual growth (CPI ex food)
-3.00
2.00
7.00
12.00
17.00
22.00
27.00
Ene-0
4
Mar
-04
May
-04
Jul-0
4
Sep-0
4
Nov-0
4
Ene-0
5
Mar
-05
May
-05
Jul-0
5
Sep-0
5
Nov-0
5
Ene-0
6
Mar
-06
May
-06
Jul-0
6
Sep-0
6
Nov-0
6
Ene-0
7
Mar
-07
May
-07
Jul-0
7
Sep-0
7
Nov-0
7
Ene-0
8
Mar
-08
May
-08
%
Graph 8
Consumer credit: risky loans/total loans by vintage
0.0%
2.0%
4.0%
6.0%
8.0%
10.0%
12.0%
14.0%
16.0%
18.0%
20.0%
Semester ofOrigination
1 semesterlater
2 semesterslater
3 semesterslater
4 semesterslater
5 semesterslater
6 semesterslater
7 semesterslater
8 semesterslater
9 semesterslater
10semesters
later
2004 - I
2004 - II
2005 - I
2005 - II
2006 - I
2006 - II
2007 - I
2007 - II
2008 - I
2008 - II
2009 - I
Vintages:
146 BIS Papers No 54
Graph 9
Policy, prime and commercial bank treasury interest rates 2008
8
9
10
11
12
13
14
15
16
17
2008.01 2008.02 2008.03 2008.04 2008.05 2008.06 2008.07 2008.08 2008.09 2008.10 2008.11 2008.12
%
Policy Overnight Interest RateCommercial Bank Trasury Interest RatePreferencial Lending Interest Rate
Graph 10
Policy, consumer and commercial loan interest rates
8
10
12
14
16
18
20
22
24
26
28
2008.01 2008.02 2008.03 2008.04 2008.05 2008.06 2008.07 2008.08 2008.09 2008.1 2008.11 2008.12
%
Policy Overnight Interest RateConsumer Loan Interest RateCommercial Loan Interest rate

BIS Papers No 54 147
Graph 11
Liquidity GAP indicator
-18.0%
-16.0%
-14.0%
-12.0%
-10.0%
-8.0%
-6.0%
-4.0%
-2.0%
0.0%
01/01/
2007
01/05/
2007
01/09/
2007
01/01/
2008
01/05/
2008
01/09/
2008
01/01/
2009
01/05/
2009
Indicator = (liquid liabilities – liquid assets)/(illiquid assets)
Graph 12
Aggregate reserve requirement ratios
3
4
5
6
7
8
9
2002
.05
2002
.08
2002
.11
2003
.02
2003
.05
2003
.08
2003
.11
2004
.02
2004
.05
2004
.08
2004
.11
2005
.02
2005
.05
2005
.08
2005
.11
2006
.02
2006
.05
2006
.08
2006
.11
2007
.02
2007
.05
2007
.08
2007
.11
2008
.02
2008
.05
2008
.08
2008
.11
2009
.02
2009
.05
2009
.08
2009
.11
RARRc ORR RARRh
ORR = Observed required reserves/total deposits subject to RRs RARRc = Remuneration-adjusted RR ratio (fixed deposit composition) RARRh = Remuneration-adjusted RR ratio (variable deposit composition)

148 BIS Papers No 54
Graph 13
Policy and deposit interest rates
2
4
6
8
10
12
14
2002
.05
2002
.08
2002
.11
2003
.02
2003
.05
2003
.08
2003
.11
2004
.02
2004
.05
2004
.08
2004
.11
2005
.02
2005
.05
2005
.08
2005
.11
2006
.02
2006
.05
2006
.08
2006
.11
2007
.02
2007
.05
2007
.08
2007
.11
2008
.02
2008
.05
2008
.08
2008
.11
2009
.02
2009
.05
2009
.08
2009
.11
%
CD (Total) Savings Accounts CD90 CD>90,<=360 CD>360 Policy Rate
Graph 14
Spread between deposit interest rates and the overnight policy rate
-6
-4
-2
0
2
4
6
8
2002
.05
2002
.08
2002
.11
2003
.02
2003
.05
2003
.08
2003
.11
2004
.02
2004
.05
2004
.08
2004
.11
2005
.02
2005
.05
2005
.08
2005
.11
2006
.02
2006
.05
2006
.08
2006
.11
2007
.02
2007
.05
2007
.08
2007
.11
2008
.02
2008
.05
2008
.08
2008
.11
2009
.02
2009
.05
2009
.08
2009
.11
%
4
4.5
5
5.5
6
6.5
7
7.5
8
CD (Total) Savings Accounts CD90 CD>90,<=360 CD>360 RARRh (Right)

BIS Papers No 54 149
Graph 15
Average and marginal CD remuneration-adjusted reserve requirements and spreads between CD interest rates and policy interest rates
-2
-1
0
1
2
3
4
5
6
2002
.1
2002
.1
2002
.120
03
2003
.1
2003
.1
2003
.120
04
2004
.1
2004
.1
2004
.120
05
2005
.1
2005
.1
2005
.120
06
2006
.1
2006
.1
2006
.120
07
2007
.1
2007
.1
2007
.120
08
2008
.1
2008
.1
2008
.120
09
2009
.1
2009
.1
2009
.1
%
CD90-Pol. Rate CD>90,<=360 - Pol. Rate RARRCD CDTot-Pol. Rate Marginal RARRCD
Graph 16
Average and marginal savings account remuneration-adjusted reserve requirements and spreads between savings account
interest rates and policy interest rates
0
2
4
6
8
10
12
2002
.05
2002
.08
2002
.11
2003
.02
2003
.05
2003
.08
2003
.11
2004
.02
2004
.05
2004
.08
2004
.11
2005
.02
2005
.05
2005
.08
2005
.11
2006
.02
2006
.05
2006
.08
2006
.11
2007
.02
2007
.05
2007
.08
2007
.11
2008
.02
2008
.05
2008
.08
2008
.11
2009
.02
2009
.05
2009
.08
2009
.11
%
-6
-5
-4
-3
-2
-1
0
RARRSAV Marginal RARRSAV Savings Accounts - Pol. Rate (Right)

150 BIS Papers No 54
Graph 17
Spread between lending interest rates and the overnight policy rate
0
5
10
15
20
25
2002
.05
2002
.08
2002
.11
2003
.02
2003
.05
2003
.08
2003
.11
2004
.02
2004
.05
2004
.08
2004
.11
2005
.02
2005
.05
2005
.08
2005
.11
2006
.02
2006
.05
2006
.08
2006
.11
2007
.02
2007
.05
2007
.08
2007
.11
2008
.02
2008
.05
2008
.08
2008
.11
2009
.02
2009
.05
2009
.08
2009
.11
%
4
4.5
5
5.5
6
6.5
7
7.5
8
Consumer Commercial Prime Comm. Bank Treasury Mortgage Avg. Lending RARRh
Graph 18
Overnight interbank and policy interest rates 2008
8.50%
8.70%
8.90%
9.10%
9.30%
9.50%
9.70%
9.90%
10.10%
10.30%
10.50%
Jan-
08
Feb-
08
Mar
-08
Apr
-08
May
-08
Jun-
08
Jul-0
8
Aug
-08
Sep-
08
Oct
-08
Nov
-08
Dec
-08
Interbank RatePolicy Rate

BIS Papers No 54 151
Table 1
Reserve requirement regulation
DATE AVERAGE RESERVE
REQUIREMENTS
MARGINAL RESERVE
REQUIREMENTS
RESERVE RQUIREMENT
REMUNERATION NOTES
2000
–200
7
13% checking accounts and sight deposits 6% savings accounts 2.5% CD and bonds with maturity 18 months 0% CD and bonds with maturity > 18 months
----
75% of the inflation target for RRs on savings accounts 100% of the inflation target for RRs on CD and bonds 18 months
----
6 M
ay 2
007
Unchanged
27% checking accounts and sight deposits 12.5% savings accounts 5% CD with maturity 18 months
Marginal RRs are NOT remunerated Average RR remuneration is unchanged
Applies since 7 May 2007 Marginal RRs apply for deposits above the level at 7 May 2007
15 J
une
200
7
8.3% checking accounts, sight deposits and savings accounts 2.5% CD and bonds with maturity 18 months 0% CD and bonds with maturity > 18 months
27% checking accounts, sight deposits and savings accounts 5% CD and bonds with maturity 18 months
Marginal RRs are NOT remunerated Remuneration of average RRs: 37.5% of the
inflation target for RRs on checking accounts, sight deposits and savings accounts
100% of the inflation target for RRs on CD and bonds 18 months
RRs on checking accounts, sight deposits and savings accounts are levelled
20 J
une
200
8
11.5% checking accounts, sight deposits and savings accounts 6% CD and bonds with maturity 18 months 0% CD and bonds with maturity > 18 months
Marginal RRs are ELIMINATED
Unchanged Applies since the last half of August 2008

152 BIS Papers No 54
24 O
ctob
er 2
008
11% checking accounts, sight deposits and savings accounts 4.5% CD and bonds with maturity 18 months 0% CD and bonds with maturity > 18 months
--- Unchanged Applies since December 2008
30 J
anua
ry 2
009
Unchanged ---
Remuneration of average RRs: 0% for RRs on
checking accounts, sight deposits and savings accounts
100% of the inflation target for RRs on CD and bonds 18 months
Applies since February 2009
2 4
2 0 Unchanged --- Remuneration of RRs is ELIMINATED
---

BIS Papers No 54 153
Table 2
Loan interest rates and reserve requirements
LONG-TERM RELATIONSHIP
Consumer loan interest rate
Commercial loan interest rate
Prime lending rate
Commercial bank treasury interest rate
Mortgage interest rate
Average lending rate
Market interest rate 1.0 1.0 1.0 1.0 1.0 1.0
Constant -6.690 182.710 0.464 82.036 -4.603
(-3.457)
-5.367
(-5.383)
Trend 0.0135 (0.484) 0.375 (5.721) N/A 0.139 (7.124) N/A N/A
Policy interest rate -1.925
(-5.857)
-0.993 (-3.391) -1.331
(-17.493)
-0.942 (-9.359) N/A -1.158
(-9.823)
Slope of the yield curve
-1.437
(-4.897)
N/A -0.463 (-7.370) N/A N/A -0.662
(-5.885)
RARRh N/A -5.143 (-4.265) -0.723 (-3.921) -3.203 (-7.921) N/A N/A
Industrial production index
N/A -38.259
(-3.826)
0.461 (0.348) -15.782
(-5.327)
N/A N/A
TES interest rate N/A N/A N/A N/A -1.060
(-9.956)
N/A
SHORT-TERM DYNAMICS FOR LOAN INTEREST RATES
Consumer loan interest rate
Commercial loan interest rate
Prime lending rate
Commercial bank treasury interest rate
Mortgage interest rate
Average lending rate
Cointegration error -0.072
(-3.339)
-0.092
(-3.817)
-0.314 (-5.369) -0.155 (-4.395) -0.102 (-3.792) -0.253
(-5.015)
Constant -0.080
(-1.995)
-0.003 (-0.072) 0.024 (0.819) 0.040 (0.926) N/A N/A
Loan interest rate (-1)
0.084 (0.955)
-0.336 (-3.718) -0.108 (-1.287) 0.149 (1.766) 0.253 (2.744) 0.014 (0.130)
Policy interest rate (-1)
-2.231
(-2.627)
-2.892 (-2.937) -2.380 (-3.551) -0.962 (-1.736) 0.308 (2.646) -2.670
(-2.878)
Slope yield curve (-1)
-0.057
(-0.935)
N/A 0.040 (0.760) N/A N/A 0.0006 (0.007)
RARRh (-1) N/A -0.228 (-1.078) -0.219 (-1.61) -0.361 (-2.703) N/A N/A
Policy rate (-1) * RARRh
0.359 (2.606) 0.557 (3.340) 0.494 (4.630) 0.239 (2.573) N/A 0.505 (3.430)
SA industrial production index (-1)
N/A -2.202 (-1.940) 0.667 (0.964) -1.481 (-2.185) N/A N/A
TES interest rate N/A N/A N/A N/A -0.076
(-1.365)
N/A
Dummy variables 2007_01
2007_04
2003_12 N/A 2008_11
2009_10
N/A N/A
t-statistics in parenthesis.
154 BIS Papers No 54
Table 3
Deposit interest rates and reserve requirements
LONG-TERM RELATIONSHIP
Savings account interest rate
Short-term CD interest rate (90 days)
Short-term CD interest rate (91-360 days)
Long-term CD interest rate (greater than 360 days)
Average CD interest rate
Market interest rate 1.0 1.0 1.0 1.0 1.0
Trend N/A N/A N/A N/A N/A
Constant -1.099 (-2.651) 0.013 -0.842 (-2.12) 0.229 (0.385) N/A
Policy interest rate -0.429 (-7.650) -1.005 (-12.527) -0.924 (-19.012) -1.053 (-11.801) -0.933 (-42.845)
Slope of the yield curve
N/A -0.638 (-5.352) -0.550 (-10.88) -0.565 (-12.786) -0.491 (-15.569
Marginal RARRh N/A N/A N/A -0.181 (-2.010) -0.158 (-3.122)
SHORT-TERM DYNAMICS FOR DEPOSIT INTEREST RATES
Savings account interest rate
Short-term CD interest rate (90 days)
Short-term CD interest rate (91-360 days)
Long-term CD interest rate (greater than 360 days)
Average CD interest rate
Cointegration error -0.091 (-2.214) -0.153 (-3.631) -0.248 (-5.549) -0.546 (-4.979) -0.276 (-7.01)
Constant N/A -0.018 (-0.945) N/A N/A N/A
Deposit interest rate (-1)
0.116 (1.252) 0.017 (0.150) -0.073 (-0.692) 0.101 (1.113) -0.241 (-2.76)
Policy interest rate (-1)
-0.488 (-2.075) -0.655 (-1.490) -1.259 (-3.305) -2.679 (-2.252) -1.767 (-5.17)
Slope yield curve (-1)
N/A 0.032 (0.556) 0.030 (0.751) 0.074 (0.739) 0.041 (1.074)
RARRh (-1) N/A N/A N/A 0.044 (0.325) 0.008 (0.222)
Policy rate (-1) * RARRh
0.124 (3.158) 0.198 (2.66) 0.290 (4.553) 0.466 (2.489) 0.402 (6.878)
Dummy variables 2008_6 N/A N/A 2002_12
2003_1
2009_03
2009_07
t-statistics in parenthesis.
BIS Papers No 54 155
Table 4
Loan interest rates – asymmetric response to policy rate changes
LONG-TERM RELATIONSHIP
Consumer loan interest rate
Commercial loan interest rate
Prime lending rate Commercial bank treasury interest rate
Average lending rate
Market interest rate 1.0 1.0 1.0 1.0 1.0
Constant -7.394 103.296 7.503 92.755 -5.056
Trend 0.013 (0.512) 0.243 (6.228) N/A 0.152 (7.516) N/A
Policy interest rate -1.819 (-5.773) -0.868 (-4.988) -1.326 (-14.957) -0.950 (-9.229) -1.207 (-9.076)
Slope of the yield curve
-1.444 (-5.287) N/A -0.526 (-7.058) N/A -0.763 (-6.014)
RARRh N/A -2.651 (-3.673) -0.398 (-1.932) -3.245 (-7.681) N/A
Industrial production index
N/A -23.256 (-3.899) -1.349 (-0.851) -18.092 (-5.899) N/A
SHORT-TERM DYNAMICS FOR LOAN INTEREST RATES
Consumer loan interest rate
Commercial loan interest rate
Prime lending rate
Commercial bank treasury interest rate
Average lending rate
Cointegration error -0.066 (-2.916) -0.183 (-5.178) -0.264 (-4.732) -0.155 (-4.758) -0.207 (-4.320)
Constant -0.059 (-1.289) 0.023 (0.463) 0.031 (0.868) 0.041 (1.353) N/A
Loan interest rate (-1)
0.1024 (1.146) -0.261 (-2.977) -0.118 (-1.299) 0.125 (1.457) 0.027 (0.251)
Policy interest rate (-1)
0.127 (0.627) 0.481 (2.308) 0.740 (3.878) 0.587 (3.335) 0.668 (3.261)
Slope yield curve (-1)
-0.063 (-1.006) N/A 0.049 (0.854) N/A 0.016 (0.186)
RARRh (-1) N/A -0.139 (-0.674) -0.049 (-0.350) -0.325 (-2.472) N/A
Policy rate (-1) * dir (asymmetric effect)
-0.691 (-1.962) -0.944 (-2.467) -0.671 (-2.468) -0.496 (-2.196) -0.993 (-3.121)
SA industrial production index (-1)
N/A -3.060 (-2.757) 0.101 (0.135) -1.821 (-2.673) N/A
Dummy variables 2007_01
2007_04
2003_12 N/A 2008_11
2009_10
N/A
t-statistics in parenthesis.

156 BIS Papers No 54
Table 5
Deposit interest rates – asymmetric response to policy rate changes
LONG-TERM RELATIONSHIP
Savings account
interest rate
Short-term CD interest rate (90
days)
Short-term CD interest rate (91-
360 days)
Short-term CD interest rate (91-
360 days)
Long-term CD interest rate
(greater than 360 days)
Average CD interest rate
Market interest rate
1.0 1.0 1.0
1.0
1.0 1.0
Constant -0.850 0.088 -0.640 -0.802 0.136 N/A
Policy interest rate
-0.462 (-6.876) -1.009 (-13.128) -0.960 (-19.230) -0.937 (-20.199) -1.038 (-11.585) -0.953 (-38.438)
Slope of the yield curve
N/A -0.711 (-6.362) -0.591 (-11.534) -0.566 (-11.873) -0.550 (-12.433) -0.506 (-14.359)
Marginal reserve requirement
N/A N/A N/A N/A -0.185 (-2.040) -0.138 (-2.440)
SHORT-TERM DYNAMICS FOR LOAN INTEREST RATES
Savings account
interest rate
Short-term CD interest rate (90
days)
Short-term CD interest rate (91-
360 days)
Short-term CD interest rate (91-
360 days)
Long-term CD interest rate
(greater than 360 days)
Average CD interest rate
Cointegration error
-0.063 (-1.736) -0.165 (-3.789) -0.227 (-5.138) -0.256 (-5.691) -0.574 (-5.374) -0.246 (-6.008)
Constant N/A -0.001 (-0.063) N/A N/A N/A N/A
Market interest rate (-1)
0.119 (1.256) 0.011 (0.099) -0.102 (-0.915) -0.127 (-1.161) 0.109 (1.223) -0.214 (-2.271)
Policy interest rate (-1)
0.304 (5.689) 0.639 (5.186) 0.690 (6.345) -0.552 (-1.024) -5.354 (-2.926) 0.840 (7.955)
Slope yield curve (-1)
N/A 0.137 (0.232) 0.0345 (0.852) 0.023 (0.567) 0.091 (0.929) 0.044 (1.104)
Marginal RARRh (-1)
N/A N/A N/A N/A -0.010 (-0.075) 0.049 (1.199)
Policy rate (-1) * dir
-0.183 (-2.196) -0.453 (-2.458) -0.656 (-4.512) -0.363 (-2.037) 1.161 (1.996) -0.803 (-5.956)
Policy rate *RARRh
N/A N/A N/A 0.193 (2.323) 0.861 (3.093) N/A
Dummy variables
2008_06 N/A N/A N/A 2002_12
2003_1 2009_3 2009_7
t-statistics in parenthesis.

BIS Papers No 54 157
Table 6
Loan interest rates – central bank’s net creditor position
LONG-TERM RELATIONSHIP
Commercial bank treasury interest rate
Commercial bank treasury interest rate
Prime lending rate
Market interest rate 1.0 1.0 1.0
Constant 84.667 81.888 2.198
Trend 0.143 (7.201) 0.140 (7.264) N/A
Policy interest rate -0.984 (-9.849) -0.998 (-10.188) -1.429 (-16.255)
Slope of the yield curve N/A N/A -0.508 (-7.44)
Average reserve requirement -3.004 (-7.231) -3.001 (-7.621) -0.48 (-2.555)
Industrial production index -16.520 (-5.553) -15.892 (-5.429) N/A
SHORT-TERM DYNAMICS FOR LOAN INTEREST RATES
Commercial bank treasury interest rate
Commercial bank treasury interest rate
Prime lending rate
Cointegration error -0.163 (-4.778) -0.166 (-4.761) -0.264 (-4.682)
Constant 0.013 (0.516) 0.005 (0.210) -0.01 (-0.344)
Loan interest rate (-1) 0.134 (1.522) 0.178 (2.105) -.077 (-0.864)
Policy interest rate (-1) 0.457 (2.730) 0.432 (2.701) 0.607 (3.495)
Slope yield curve (-1) N/A N/A 0.058 (1.03)
RARRh (-1) -0.301 (-2.304) -0.303 (-2.316) -0.034 (-0.241)
Industrial production index (-1) -1.889 (-2.765) -1.829 (-2.707) N/A
Policy rate (-1) * dir * NCP -0.518 (-1.648) N/A N/A
Policy rate (-1) * NCP
N/A -0.420 (-1.887) -0.567 (-2.084)
Industrial production index N/A N/A -1.243 (-1.688)
Dummy variables 2008_11
2009_10
2008_11
2009_10 N/A
t-statistics in parenthesis.

158 BIS Papers No 54
Table 7
Deposit interest rates – central bank’s net creditor position effects
LONG-TERM RELATIONSHIP
Savings account
interest rate
Short-term CD interest rate (90
days)
Short-term CD interest rate (90
days)
Short-term CD interest rate (91-360 days)
Short-term CD interest rate
(91-360 days)
Average CD
interest rate
Average CD interest
rate
Market interest rate
1 1 1 1 1 1 1
Constant -0.787 0.528 0.538 -0.003 -0.054 N/A N/A
Policy interest rate
-0.471
(-6.534)
-1.064 (-11.318) -1.071 (-11.663) -1.018 (-13.46) -1.011
(-13.704)
-0.920 (-26.861)
-0.929 (-29.798)
Slope of the yield curve
N/A -0.769 (-5.601) -0.7101
(-5.323)
-0.631 (-7.961) -0.591 (-7.765) -0.497 (-9.868)
-0.479 (-10.617)
Marginal reserve requirement
N/A N/A N/A N/A N/A -0.179 (-2.242)
-0.153 (-2.106)
SHORT-TERM DYNAMICS FOR LOAN INTEREST RATES
Savings account
interest rate
Short-term CD interest
rate (90 days)
Short-term CD interest
rate (90 days)
Short-term CD interest rate (91-360 days)
Short-term CD interest rate (91-360 days)
Average CD interest rate
Average CD interest rate
Cointegration error -0.047
(-1.311)
-0.115
(-2.864)
-0.117
(-3.056)
-0.146
(-3.708)
-0.161
(-4.116)
-0.175
(-3.954)
-0.194 (-4.434)
Constant N/A -0.022
(-1.138)
-0.026
(-1.386)
N/A N/A
Deposit interest rate (-1)
0.156 (1.656)
0.086 (0.773)
0.113 (1.023) 0.043 (0.401) 0.066 (0.63)
-0.070
(-0.694)
-0.038 (-0.394)
Policy interest rate (-1)
0.263 (5.448)
0.523 (4.777)
0.539 (5.163) 0.523 (5.021) 0.513 (5.22)
0.612 (5.635)
0.605 (5.850)
Slope yield curve (-1)
N/A 0.03 (0.497)
0.048 (0.837) 0.069 (1.68) 0.072 (1.759)
0.023 (0.506)
0.022 (0.504)
Marginal RARRh (-1)
N/A N/A N/A N/A N/A 0.107 (2.378)
0.110 (2.525)
Policy rate (-1) * dir * NCP
-0.185
(-1.425)
-0.357 (-1.434)
N/A -0.438
(-2.175)
N/A -0.474
(-2.337)
N/A
Policy rate (-1) * NCP
N/A N/A -.0402 (-2.35) N/A -0.355
(-2.395)
N/A -0.430 (-2.876)
Dummy variables 2008_6 N/A N/A N/A N/A N/A N/A
t-statistics in parenthesis.
BIS Papers No 54 159
Chart 1
Impulse response functions for loan interest rates Policy rate shock for different reserve requirement levels

160 BIS Papers No 54
Chart 2
Impulse response functions for deposit interest rates Policy rate shock for different reserve requirement levels
BIS Papers No 54 161
Chart 3
Impulse response functions for loan interest rates Asymmetric response to policy rate changes

162 BIS Papers No 54
Chart 4
Impulse response functions for deposit interest rates Asymmetric response to policy rate changes

BIS Papers No 54 163
Chart 5
Impulse response functions for loan interest rates Policy rate shock – central bank’s
net creditor position (NCP) effects
164 BIS Papers No 54
Chart 6
Impulse response functions for deposit interest rates Asymmetric response
to policy rate changes
BIS Papers No 54 165
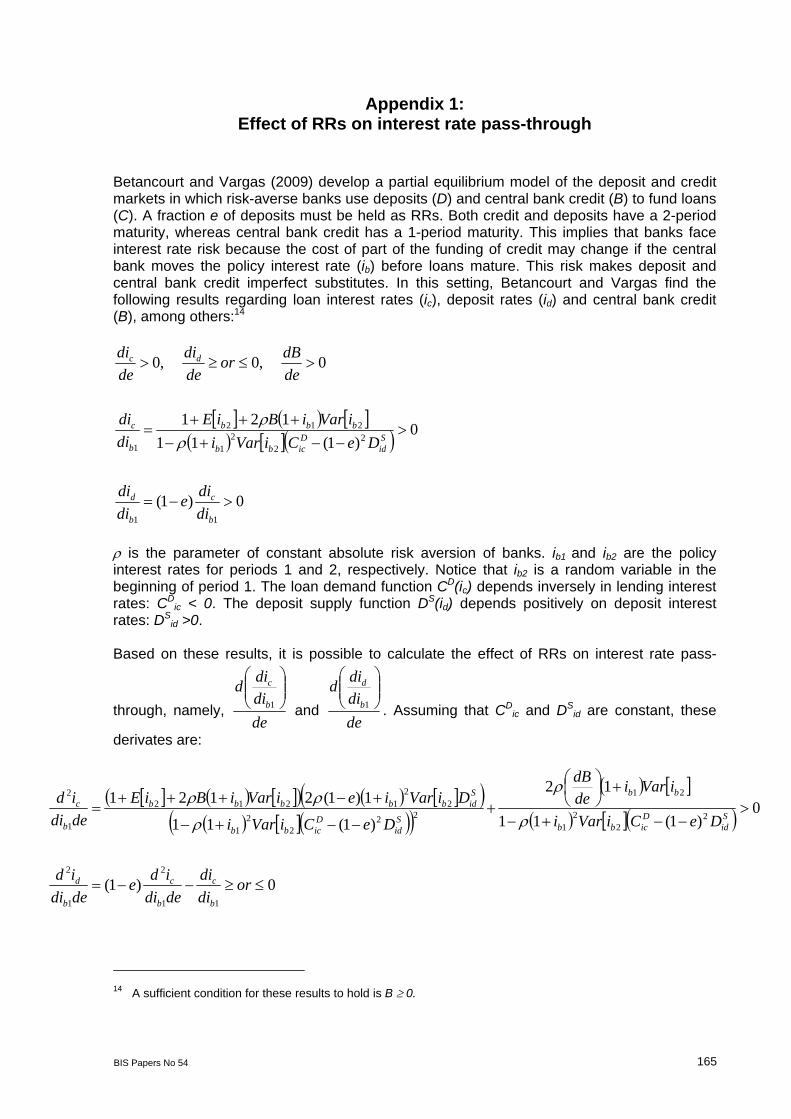
Appendix 1: Effect of RRs on interest rate pass-through
Betancourt and Vargas (2009) develop a partial equilibrium model of the deposit and credit markets in which risk-averse banks use deposits (D) and central bank credit (B) to fund loans (C). A fraction e of deposits must be held as RRs. Both credit and deposits have a 2-period maturity, whereas central bank credit has a 1-period maturity. This implies that banks face interest rate risk because the cost of part of the funding of credit may change if the central bank moves the policy interest rate (ib) before loans mature. This risk makes deposit and central bank credit imperfect substitutes. In this setting, Betancourt and Vargas find the following results regarding loan interest rates (ic), deposit rates (id) and central bank credit (B), among others:14
0)1(
0)1(11
121
0,0,0
11
22
21
212
1
b
c
b
d
Sid
Dicbb
bbb
b
c
dc
didie
didi
DeCiVariiVariBiE
didi
dedBor
dedi
dedi
is the parameter of constant absolute risk aversion of banks. ib1 and ib2 are the policy interest rates for periods 1 and 2, respectively. Notice that ib2 is a random variable in the beginning of period 1. The loan demand function CD(ic) depends inversely in lending interest rates: CD
ic < 0. The deposit supply function DS(id) depends positively on deposit interest rates: DS
id >0. Based on these results, it is possible to calculate the effect of RRs on interest rate pass-
through, namely, dedidid
b
c
1 and dedidid
b
d
1 . Assuming that CDic and DS
id are constant, these
derivates are:
0)1(
0)1(11
12
)1(11
1)1(2121
11
2
1
2
22
21
21
222
21
22
1212
1
2
ordidi
dediide
dediid
DeCiVari
iVaridedB
DeCiVari
DiVarieiVariBiEdediid
b
c
b
c
b
d
Sid
Dicbb
bb
Sid
Dicbb
Sidbbbbb
b
c
14 A sufficient condition for these results to hold is B 0.

166 BIS Papers No 54
Notice that the magnitude of the derivatives 1b
c
didi
,1b
d
didi
, dediid
b
c
1
2
and dediid
b
d
1
2
depends on the
value of central bank credit, B. The larger it is, the greater the interest rate pass-through and the impact of RRs on interest rate pass-through.15 A larger reliance on central bank credit implies a higher response of interest rate risk to policy rate increases.
15 Mathematically, this can be seen in the expressions for the respective derivatives. In the case of the impact of
RRs on interest rate pass-through, dedB
depends positively on B, as shown in Betancourt and Vargas (2009).

BIS Papers No 54 167
Appendix 2: Remuneration-adjusted RRs
The remuneration-adjusted reserve requirement for a particular deposit is the RR ratio without remuneration that yields the same equilibrium prices in quantities in the deposit and credit markets as the official RR ratio with remuneration. To compute it, the marginal net benefit of a deposit under the official RR ratio with remuneration is equated to the marginal net benefit of a deposit under the remuneration-adjusted RR ratio: Under the official RR ratio, the marginal net benefit of a deposit for a competitive bank is:
cdrdc CMgrCMgiriri )1()1( . Here, ic is the nominal lending interest rate, id is the
nominal deposit interest rate, CMgd is the marginal “operating” cost of deposits, CMgc is the marginal “operating” cost of loans, r is the required reserve ratio and ir is the remuneration on the RR. Under the remuneration-adjustment RR ratio, the marginal net benefit of a deposit for a competitive bank is: cddc CMgeCMgiei )1()1( . Here, e is the remuneration-
adjusted RR ratio.16 For the equilibrium that emerges from both RR regimes to be the same, lending and deposit interest rates as well as deposit and loan volumes (and hence marginal costs) must coincide. Thus, the remuneration-adjusted RR ratio may be found by equating the net marginal benefits in each regime:
cc
r
CMgiire 1 (A2-1)
If some market power in the loan market or credit risk were allowed, the above expression should be modified as follows:
cc
r
CMgiire
1
Here, (0,1) represents a “markup” term if there is market power or the fraction of interest that is collected if there is credit risk. Notice that the adjustment basically takes into account the fact that the burden of the RR is smaller the larger RR remuneration, ir , and the smaller the marginal revenue of a dollar lent (ie the opportunity cost of the RRs). The expression for the remuneration-adjusted RR ratio (e) may be refined to consider all the details that must be included in the net marginal benefit of deposits. In this paper, the basic formula assuming perfect competition (A2-1) is used as a rough approximation. Still, this simple equation has at least two practical problems for empirical purposes. First, “operational” marginal costs of lending are not observed. And, second, if this measure is used in lending interest rate regressions, there will be a strong correlation by construction, since the lending rate is used in the definition of e.
16 Notice that at the bank optimum, both net marginal benefits must be zero.

168 BIS Papers No 54
The second problem was solved by using the average overall lending interest rate for each year of the sample, so that a monthly variation of e does not reflect lending interest rate changes. The first problem was solved by re-expressing equation (A2-1) as:
c
cc
r
iCMgi
ire1
1 (A2-2)
and calculating the term c
c
iCMg
as:
AssetsTotalLoans
venueInterestLoanTotalCostOperatingTotal
iCMg
c
c
Re
ie marginal costs of loans are approximated by average costs. The latter, in turn, are estimated on the basis of an attribution of total operating costs17 to loans according to the fraction of loans in total assets or in the aggregate Loans + Deposits. Formula (A2-2) was used to calculate the remuneration-adjusted RR ratio for each type of deposit j = {Checking Accounts and Sight Deposits, Savings Accounts, CD and Bonds with maturities 18 months}. When there were marginal RRs (without remuneration), a weighted average of remuneration-adjusted average and marginal RR ratios was computed using the amounts of deposits subject to average and marginal RRs to construct the weights. Hence, for each month, t , and deposit, j , in the sample there are estimates of remuneration-adjusted RR ratios, ej,t . Finally, two measures of aggregate remuneration-adjusted RR ratios were calculated:
42
32
,
_
,
,,,
AeRARR
AeRARR
jtjjtc
jtjtjth
(A2-3) allows for changes in deposit composition over time. In contrast, (A2-4) uses a fixed deposit composition, corresponding to the sample average (May 2002–November 2009).
17 Total operating costs include fees, personnel and depreciation of fixed assets.

BIS Papers No 54 169
References
Betancourt, Y R and H Vargas (2008): “Encajes bancarios y la estrategia de Inflación Objetivo”, Borradores de Economía, no 533, Banco de la República. Ensayos sobre política económica, vol 27, no 59, June 2009, forthcoming.
Saade, A and D Pérez (2009): “Cambios en los incentivos de los bancos como consecuencia de modificaciones en los esquemas de encaje”, Reporte de Estabilidad Financiera, Banco de la República, September.
Uribe, J D (2008a): contribution to the panel discussion at the 12th Annual Conference on Financial Stability, Monetary Policy and Central Banking, Santiago, Chile, November. Available at: www.banrep.gov.co/documentos/presentaciones-discursos/Uribe/2008/chile_noviembre.pdf
——— (2008b): “Políticas macroprudenciales del Banco de la República”, presentation at the Seminario macroeconómico y sectorial, Anif-Fedesarrollo, November. Available at: www.banrep.gov.co/documentos/presentaciones-discursos/Uribe/2008/ANIF_nov.pdf
——— (2009): “The Colombian monetary and exchange regime under stress”, paper presented at the Money and Banking Conference on Lessons and Challenges for Emerging Countries during the Crisis, Argentina, September. Available at: www.banrep.gov.co/documentos/presentaciones-discursos/Uribe/2009/argentina.pdf
Vargas, H and the Financial Stability Department (2006): “Public debt market risk: the effects on the financial system and on monetary policy – the case of Colombia”, BIS Papers, no 28, August.