Embed Size (px)
Citation preview

EFFECTS OF LIVESTOCK GRAZING ON HONEY PRODUCTION IN A
MEDITERRANEAN RANGELAND ECOSYSTEM
by
Scott Brenton
A thesis submitted
in partial fulfillment of the requirements
for the degree of
Master of Science
(Natural Resources and Environment)
at the University of Michigan
December 2015
Thesis Committee:
Associate Professor Johannes Foufopoulos, Chair
Associate Professor Rebecca Hardin


ii
Abstract
Livestock husbandry has played an integral role for human societies in the Mediterranean Basin.
While ruminant grazing traditionally comprised part of diverse agrosilvopastoral systems, in recent decades it has experienced substantial intensification in Mediterranean countries due to European Union subsidies and production for international markets. Apiculture has also played
an important role in rural Mediterranean livelihoods for millennia, and is important globally both for apicultural products and crop pollination. Honeybees have faced worldwide losses in recent
decades, along with a decline of floral resources, although the drivers of these changes are not well understood. The aim of this study is to (1) evaluate the impact of livestock grazing on Mediterranean vegetation structure and floral resources; (2) determine the relationship, between
grazing intensity and the productivity of managed honeybee hives, and; (3) determine the economic effect, if any, that overgrazing has on apicultural activities in the region.
Methods. I measured vegetation condition and floral resources across a broad range of livestock grazing intensities in a Mediterranean phryganic ecosystem on the islands of Naxos and Paros in
the Aegean Sea (Greece). 14 study plots were surveyed, and the vegetation metrics of canopy gap, basal gap, vegetation height, plant species richness, spring flower coverage, thyme flower
coverage, and thyme bush coverage were measured. As a proxy for grazing intensity, I used stocking rates, as well as biomass removed by grazers, quantified as the amount of ruminant dung collected along standardized transects. I monitored beehive productivity by weighing
beehives every 10 to 14 days over the course of the summer flowering season. I established transects in the vicinity of the beehives, and repeated the same vegetation measurements used in
the 14 study plots to determine vegetation condition around each beehive site. Mixed models were utilized in order to determine the relationship between beehive productivity and surrounding vegetation characteristics. In addition, I conducted surveys with a majority of
beekeepers on each island to determine potential economic effects of grazing intensity on apiculture.
Results. I found grazing to significantly impact vegetation cover and floral resources. Canopy gap and basal gap sizes were positively correlated with grazing intensity, while plant species
richness was negatively associated with grazing intensity. Standing vegetation biomass decreased with increased grazing intensity, whether quantified as stocking rate or amount of
plant matter consumed. Spring flower coverage also decreased with amount of plant matter consumed by livestock. However, cover of Conehead thyme (Coridothymus capitatus), the most important apicultural plant in the region, and a chemically defended taxon, actually benefitted
from light to intermediate grazing conditions and followed a hump-shaped curve peaking at intermediate stocking rates. As a result, progressive increases in stocking rate had mixed effects
on floral resources, leading to an overall reduction in general flower cover and diversity, while simultaneously leading to denser populations of thyme. Mixed models revealed that beehive productivity during the main honey-producing period was positively associated with increased
thyme flower area, stocking rate, thyme bush area, canopy gap, and basal gap (in decreasing order of importance). Interviews with beekeepers also revealed that grazing intensity was
positively correlated with the need for higher amounts of supplemental bee food outside the short summer thyme season, elevated antiparasitic drug expenditures, as well as increased total costs (including feed, drug, labor and hive replacement expenditures). These expenses erased higher

iii
income from elevated thyme honey production in grazed areas. Notably, the surveys showed no correlation between grazing intensity and net profits. As a matter of fact, comparison of the
economic apiculture models on the neighboring islands of Naxos (mostly heavily grazed) and Paros (mostly ungrazed) revealed that beekeeping operations on Paros, by virtue of their lower
costs, generated higher overall returns, despite producing less honey.
Conclusions. This study highlights the central importance of C. capitatus, a prolific nectar-
producing species, for honey production in the Aegean. Despite the fact that C. capitatus benefits from low to intermediate levels of grazing, due to competitive release, livestock husbandry has
largely negative effects on apiculture in the Aegean. By extending the scope of this study beyond the traditionally considered first order metrics (honey production) to include additional factors (previously externalized beehive maintenance costs), I show any increases in thyme honey
production in grazed regions are negated by concomitant increased costs for bee food, drugs, labor and elevated beehive replacement rates. Thus my data suggest that light levels of grazing
are best suited to maximize economic returns from apiculture in the Aegean Sea region.

iv
Acknowledgements
I would like to thank all of the beekeepers on Naxos and Paros who cooperated with me, offering me their beehives and making this study possible. Permission was required for access to each of
my study plots, so additional thanks goes to the shepherds who allowed me to utilize their property for vegetation measurements. I am also grateful to the beekeepers who took time to meet and fill out surveys so that I could acquire data on the economic aspects of apiculture,
which greatly improved my understanding of the study system. I would also like to thank my field assistants, Colton Babladelis, Panayiotis Stratis, Joseph Jozlin, and Amelia Runco for all of
their hard work in the field collecting vegetation data. Without their help, I would not have been able to collect the necessary data in the limited time I had.
I would like to give special thanks to my advisor Johannes Foufopoulos for the help, input, and direction he offered from the very beginning and for welcoming me back into the University of
Michigan and inviting me into his lab. I also want to give special thanks to my fellow lab members who helped me out. Thank you to Erin O’Brien for helping me collect field data during my first field season, and to Nicolas Louis for weighing beehives when I was not able to do it
myself.
I would also like to thank Rebecca Hardin for her advice and feedback, and for agreeing to be involved with my project. Corey Powell deserves an extra special thanks for guiding me through my statistical endeavors. Without his advice and help with statistics and SPSS, I would have
been unable to conduct all but the most simple of the analyses.
Finally, I would like to thank Rackham Graduate School, the School of Natural Resources and Environment, and the Vihtelic Pollinator grant for funding this research and making my extended trips to Greece possible for 2 summers in a row.

v
Contents
Abstract ........................................................................................................................................... ii
Acknowledgements ..........................................................................................................................iv
1. Introduction ..............................................................................................................................1
2. Methods ........................................................................................................................................3
2.1 STUDY AREA.........................................................................................................................3
2.2 QUANTIFYING THE EFFECTS OF GRAZING INTENSITY ON PLANT COMMUNITY
STRUCTURE AND APICULTURE .............................................................................................4
2.3 VEGETATION STRUCTURE AND PLANT SPECIES COMPOSITION..............................4
2.4 FLORAL RESOURCES..........................................................................................................4
2.5 QUANTIFYING GRAZING INTENSITY ..............................................................................5
2.7 QUANTIFYING BEEHIVE FOOD AND DRUG SUPPLEMENTATION ..............................6
2.8 STATISTICAL ANALYSIS ....................................................................................................6
3.2 EFFECTS OF VEGETATION CONDITION AND FLORAL RESOURCES ON BEEHIVE
PRODUCTIVITY .........................................................................................................................7
3.3 RELATIVE IMPORTANCE AND PHENOLOGY OF VARIOUS FLORAL RESOURCE
SPECIES TO HONEYBEES.........................................................................................................8
3.4 ECONOMIC SURVEY RESULTS..........................................................................................8
4. Discussion..................................................................................................................................9
4.1 EFFECTS OF GRAZING ON VEGETATION STRUCTURE AND FLORAL RESOURCES
......................................................................................................................................................9
4.2 PRIMARY EFFECTS OF GRAZING ON APICULTURE: HONEY PRODUCTION.......... 10
5. Conclusion .................................................................................................................................. 12
Figures ............................................................................................................................................ 15
Tables ............................................................................................................................................. 22
References....................................................................................................................................... 24

1
1. Introduction
This study seeks to quantify the effects of livestock grazing on floral resources and honey
production in an archetypal Mediterranean heath ecosystem located in the Cyclades Archipelago (Aegean Sea, Greece). The present-day Mediterranean landscape has been shaped over the millennia by a broad spectrum of human pursuits (Perevolotsky and Seligman, 1998). In most
parts of the Mediterranean Basin, agro-pastoral activities have contributed significantly to the current vegetation structure (Enne et al., 2004). Mediterranean ecosystems have been grazed by
livestock for over 5,000 years (Sternberg et al., 2000), and sheep and goat husbandry has been an integral part of Mediterranean livelihoods since the Neolithic (Kizos et al., 2013). Currently, much of the Mediterranean region is characterized by agriculturally marginal lands (Petanidou
and Smets, 1995), due to a combination of climate conditions, overgrazing, and the geology of the region. Because sheep and goat production is frequently the most profitable enterprise in
such landscapes (De Rancourt et al., 2006), it often is considered the main source of rural employment in marginal areas of the Mediterranean, ranging from the Balkans and across the Levant to vast swaths of North Africa and the Maghreb region (Lorent et al., 2009).
In recent years, as the result of social, economic and technological changes, livestock
populations have increased significantly in many parts of the Mediterranean basin (Enne et al., 2004). Historically, the raising of farm animals was part of an integrated, complex management system, which included agriculture and arboriculture; however, since the 1960s, the region has
undergone a transition from diversified agrosilvopastoral systems to intensified livestock husbandry, often resulting in overgrazing, i.e. grazing beyond the production limits of the
landscape (Kizos et al., 2013, Enne et al., 2004). Overgrazing in arid climates can result in significant changes in botanical composition leading to a general decrease in biodiversity and vegetation cover and an increase in soil erosion (Lorent et al., 2009); it is thought to contribute to
the desertification in the Mediterranean (Grove and Rackham, 2001, Enne et al., 2004).
Much of the recent intensification of the livestock husbandry sector can be attributed to European Union policies (De Rancourt et al., 2006). After joining the European Economic Community (EEC), Mediterranean countries such as Greece frequently abandoned traditional
land management practices in exchange for more intensive ones (Lorent et al., 2009). This transition was brought about by changes in agricultural policies and technologies, as well as
production for the common EU agricultural market, which represented a change from subsistence management to production for national and global markets (Kizos et al., 2013). Subsidies under the European Union’s Common Agricultural Policy (CAP) have been blamed
for Greek livestock expansion and increased grazing pressure leading to land degradation (Lorent et al., 2009)
The same marginal landscapes that are currently experiencing significant increases in grazing pressure have often also had a long tradition of rural apiculture (Petanidou and Smets, 1995).
Apiculture plays an important role in Mediterranean agricultural economies, both for hive products and pollination services (Bacandritsos et al., 2010). Honeybees are important
pollinators, contributing to the pollination of the approximate one-third of global crops and 60-90% of those plants that require animal pollination (Kremen et al., 2007). Apiculture has been a tradition in rural Mediterranean landscapes for a long time; it is considered a key sustainable way

2
to utilize marginal and overgrazed lands in many rural areas in the Mediterranean, and may also contribute to the ecological health of the landscape (Petanidou and Smets, 1995).
Structure and abundance of both domestic honeybees, as well as wild bee communities depend
critically on nectar resource diversity, floral diversity, and floral richness (Potts et al., 2003, Naug 2009). Bagella (2013), argued that the primary factors dictating honeybee foraging behavior in Mediterranean silvo-pastoral systems are plant community composition and
structure. The recent worldwide declines in honeybees have been at least partially attributed to the decay of floral resource diversity in intensively managed landscapes (Decourtye, 2010).
Homogenous agricultural landscapes reduce the floral resource abundance and diversity that bees depend on, and heavily overgrazed landscapes likely have the same effect (Garibaldi et al., 2011;
Pasquale et al, 2013; Russo et al., 2013). Grazing in temperate zones often leads to reduced plant diversity, thus creating a simplified landscape likely to lead to boom-and-bust cycles akin to
what is already documented in intensively farmed areas, with flowers outnumbering bees during the short blooming season of the few species present, while bees are left with little forage resources for the rest of the year (Winfree, 2008).
However, in Mediterranean ecosystems, the relationship between grazing, floral resource
abundance, and honeybee productivity is not so simple. Certain levels of grazing may in fact be beneficial to honey production, as ungrazed areas in Mediterranean climates often become dominated by dense woody thickets with low species diversity (Perevolotsky and Seligman,
1998). Several studies have shown that moderate grazing increases plant species diversity in Mediterranean environments (Perevolotsky and Seligman, 1998; Thompson and Gilbert, 2013;
Enne et al., 2004; Hadar et al., 1999; Vulliamy et al., 2006). Moderate levels of grazing can limit the growth of dominant shrubs and trees and open up the landscape, creating opportunities for rich plant communities to thrive (Enne et al., 2004). It is therefore likely that in some types of
Mediterranean landscapes, light to moderate grazing actually increases floral resource diversity, leading to a landscape more conducive to apiculture. Beyond simply opening up the vegetation
cover, livestock further change plant community composition and corresponding floral resources available to bees by preferentially foraging on palatable plant species while avoiding others; ruminants reject species with morphological or biochemical protection mechanisms
(Perevolotsky and Seligman, 1998), tending to avoid these species until few alternatives are available. One important species, conehead thyme (Coridothymus capitatus), which is
biochemically protected with unpalatable compounds such as thymol, is extremely widespread across the NE Mediterranean Basin. Thyme also happens to be the source of the most prized unifloral Greek honey making this grazing-resistant plant a species of significant economic
importance (Alissandrakis et al., 2007).
Free-ranging flocks of goats and sheep are widespread in the Cyclades and are grazed throughout the year with limited supplementation during the winter months. At the same time, apiculture is an increasingly important part of the rural economy, and profitable beekeeping depends on
landscapes with ample pollen and nectar sources (Decourtye, 2010). Nonetheless, while bees in the area forage on a wide range of floral resources, in practice most of the honey production in
the Cyclades occurs from May to July and is driven predominantly by the nectar production of C. capitatus (Conehead thyme). Given the economic and ecological importance of livestock

3
husbandry and apiculture in the area, it is important to investigate the ecological interactions between these two types of activities, yet such as study has never been done.
In this study we investigate the effects of livestock grazing on Mediterranean vegetation
structure and floral resources with the ultimate goal to determine how grazing practices affect the economic viability of beekeeping. This question is addressed through a combination of three sub-studies. In Sub-study 1, vegetation structure, flower numbers, and livestock herbivory were
quantified across 14 varyingly-grazed study plots in order to determine the relationship between grazing intensity and floral resources. In Sub-study 2, we determined the vegetation
characteristics associated with amount of honey produced by taking similar measurements along transects surrounding 5 focal beekeepers sites. Beehives at each site were weighed over the course of the summer at periodic intervals to quantify honey and brood production. In Sub-study
3, surveys were administered to local beekeepers to determine the economic dimensions of their apiculture operations in areas of different grazing regimes.
2. Methods
2.1 STUDY AREA
The study was conducted over the summers of 2013 and 2014 on the islands of Naxos and Paros
(Cyclades archipelago, Aegean Sea, Greece) located across an approx. 8 km wide water strait (Fig. 1). The area belongs to the Mediterranean climate zone, which is characterized by warm,
dry summers and mild, rainy winters (Sternberg et al., 2000). All study sites are covered by the same type of xerophytic dwarf scrub plant community termed ‘phrygana’ (Lorent et al., 2009; Petanidou & Smets, 1995; Fig. 1). Phrygana communities, which are characteristic for low-
elevation habitats throughout the Mediterranean Basin, are very diverse heaths and are dominated by woody, summer-deciduous, spinose and generally aromatic scrubs, many of which
are strongly adapted to herbivory (Petanidou & Smets, 1995). Phrygana communities contain dozens of species of melliferous plants that flower over the course of the year and support local honey bee populations. Particularly important among these is Coridothymus capitatus, a
dominant phrygana species that flowers profusely from late May to mid-July.
Livestock herding is prevalent in the area. Mixed flocks of sheep and goats are herded daily, with each shepherd’s flock grazing the same area throughout the year. Apiculture is also common practice. Although bees forage year round, the main nectar resource is thyme. Thyme flowers for
about 40 days in mid-summer, and thyme honey is harvested in August. Beehives are supplemented with sugar-based food supplements during periods of low nectar flow, as well as
with various antiparasitic agents to reduce the incidence of disease, especially infestation by the parasitic mite Varroa destructor.

4
2.2 QUANTIFYING THE EFFECTS OF GRAZING INTENSITY ON PLANT
COMMUNITY STRUCTURE AND APICULTURE
Paros habitats are, by virtue of a non-agricultural economic focus, largely ungrazed, in contrast
to Naxos ecosystems which experience a broad range of often heavy grazing conditions. Sub-study 1 utilizes a spectrum of grazing intensities across ecologically matched sites on Naxos to elucidate the relationship between goat herbivory and vegetation condition. In contrast, Sub-
studies 2 and 3 extend these comparisons across the two islands to investigate relationships of floral conditions to honey production. In Sub-Study 1, in order to quantify the effects of grazing
on vegetation structure and floral resources, I selected 14 rectangular study plots (10,000 m2 each) representing a wide range of grazing intensities, from ungrazed to highly overgrazed conditions (Fig. 1; Table 1). To reduce confounding factors, all study plots were located in the
same area (SW Naxos), in the same elevational band (<300m asl), and on the same limestone substrate. Each site, as well as its surroundings, were chosen to be homogenously covered by the
same type of phrygana plant communities and subjected to the same level of grazing. Originating from the center of each plot I established four 50 m transects in the four cardinal directions. Vegetation height, canopy and basal gap, floral resources, plant species composition, dung mass,
and plant biomass were measured along each transect. Vegetation metrics for these surveys followed closely the survey methods outlined by Herrick et al. (2005).
2.3 VEGETATION STRUCTURE AND PLANT SPECIES COMPOSITION
Vegetation height, canopy gap, and basal gap were measured at 5m intervals along four 50 m
transects placed along the cardinal directions from the center of each plot. A meter stick was randomly tossed at each 5 m interval, and canopy gap was defined as the distance in cm between adjacent plant canopies at the spot where the stick fell (Herrick et al., 2005). Canopy was defined
as the top of any woody plant taller than 20 cm, with herbaceous plants and plants shorter than 20cm not taken into account. Basal gap was defined as the distance between the bases of
adjacent woody plants falling directly under the meter stick. Vegetation height was determined by creating a one m2 square where the meter stick fell, and measuring the tallest plant inside of it (Herrick et al., 2005). Vegetation biomass was determined by clipping all above-ground
vegetation inside eight 80cm x 80cm squares randomly placed on each plot. I surveyed plant species composition by using the line-point intersect method, in which a pin is dropped every
five meters along each transect, and all plant species it intercepts are recorded. For Sub-study 2, I carried out each of these measurements along five transects around each of the beehive sites in order to determine vegetation condition and grazing status around the beehives. All of the above
methods were adapted from Herrick et al. (2005).
2.4 FLORAL RESOURCES
I measured floral resources along a 0.5m wide strip along the entire length of each transect (adapted from Potts et al., 2003; Potts et al., 2004; Nombré et al., 2009; Vulliamy et al., 2006).
As an aid in estimating surface area coverage of open flowers, I used a 50cm x 50cm square transparent acrylic sheet with 16 equally sized squares engraved onto it. The number of grid

5
squares containing open flowers was used to estimate flower coverage, with each grid square representing 1/64 of a square meter. I quantified floral resources in three complementary ways.
General floral coverage was estimated during May of 2014, the period of time when many flowering species are in bloom. Floral coverage for thyme specifically, the most important
melliferous plant in the region, was estimated in June and July, coincident with the days that thyme flowering was peaking on each plot. As a complementary method to assess thyme abundance, I also determined total thyme bush (Coridothymus) coverage on each plot using the
same method. I used the same method to quantify thyme flower and thyme bush coverage on the transects surrounding the beehives (see also Potts et al., 2003; Potts et al., 2004; Nombré et al.,
2009; Vulliamy et al., 2006)
2.5 QUANTIFYING GRAZING INTENSITY
In order to quantify herbivory levels, I collected dung following the same established methodology used in previous studies (Potts et al., 2003; Vulliamy et al., 2006). Thus, I determined the amount of plant matter removed by livestock from each area by exhaustively
collecting livestock excreta on all study sites. All dung was collected along the aforementioned, 50m long transects, at a width of 50cm on each side of the transect line. No droppings were
collected along the first 5 meters of each of transect to avoid overlap between transects. Vegetation cover is sufficiently open that each faex is clearly visible and can be collected readily. Fecal pellet collection was exhaustive within each transect sampling strip, with repeat
surveys by a different fieldworker failing to collect any additional dung pellets. Vulliamy et al. (2006) showed that dried livestock feces can last for at least 22 months in Mediterranean
habitats, so that the amount of excreta collected at a site integrates livestock presence over a substantial period of time. I further quantified stocking rate by interviewing the pastoralists using each area and obtaining animal flock sizes, which were corrected for the size of the area
they grazed. Because flock sizes stayed stable over the course of the study and because pastoralists in the area use the same herding practices (yearlong daytime access to the grazing
grounds with nightly return to a central pen) the results were comparable across sites. For Sub-study 2, I calculated grazing intensity for the surrounding areas of the beehive sites by interviewing beekeepers about the number of animals grazing the area within a 3 km radius of
their hives to reflect the typical foraging radius of honey bees (Beekman & Ratnieks, 2000, Hagler et al., 2011, Steffan-Dewenter & Kuhn, 2003). These numbers were then cross-referenced
by counting flock sizes foraging in the focal area.
2.6 HONEY PRODUCTION AND BEEHIVE PRODUCTIVITY
During the summer of 2014, a total of 53 beehives belonging to 5 beekeeping operations (three beekeepers [with a total of 30 beehives] on Naxos and two on Paros [with a total of 23 beehives]) were monitored. All beehives on Naxos were located in the SW region of the island (Fig. 1),
which experiences relatively high levels of grazing. Study hives on Paros were located in the east of the island, approximately 10 kilometers northwest of the Naxos sites. In contrast to Naxos,
Paros experiences very low levels of grazing pressure, because the island’s economy is more heavily dependent on tourism and agriculture rather than animal husbandry.

6
I measured hive productivity by weighing beehives following a well-established methodology
(Bagella, 2013; Farrar, 1937; Nombré et al., 2009; Szabo & Lefkovitch, 1989). Hive weight was determined by using a spring-loaded balance (American Weigh, AMW-TL330, 330 pound,
accurate to ca. 20g) and suspending hives from a shoulder-supported crossbeam. Because this approach does not distinguish between different components of a bee hive, measured hive weight increases represent total hive productivity, including both honey production and brood
production (Bagella, 2013; Farrar, 1937; Nombré et al., 2009; Szabo & Lefkovitch, 1989). I monitored hive productivity over the course of approx. 6 weeks in the late spring and early
summer season (May-July), coinciding with the prime annual and thyme (Coridothymus) flowering season. Hive weights were taken every 10-14 days over the study season with the last measurement taken shortly before the annual honey harvest. I weighed the hives at
approximately the same time of the day and under similar environmental conditions in order to reduce external variation and to ensure that comparable proportions of the bee population were
inside the hive.
2.7 QUANTIFYING BEEHIVE FOOD AND DRUG SUPPLEMENTATION
For Sub-study 3, in order to compare food and drug supplementation between beekeepers and relate this information to grazing intensity, I administered surveys to beekeepers belonging to the beekeeping associations of both Naxos and Paros. Beekeepers were asked to rate the relative
level of grazing intensity in the landscape surrounding their beehives on a scale from 0 (no grazing) to 10 (completely overgrazed, defined as the complete removal of plant cover). In
addition to grazing intensity, the survey also included questions about each beekeeper’s total number of hives, the previous year’s average honey yield, total annual cost of feed supplements and drugs administered, feed weight, feed duration, labor hours, labor cost, and total profit
(expressed in €/hive). The surveys were intended to investigate the relationship between grazing intensity and each of these other variables. Responses were obtained from a total of 18
individuals representing the majority of beekeepers from the two study islands.
2.8 STATISTICAL ANALYSIS
I used a combination of statistical approaches to analyze the data. Parametric approaches were used unless distributional assumptions were violated, in which case I transformed the data. I used linear mixed models to analyze predictors of beehive productivity. AICc scores were calculated
for each model, and then used to compare models against each other (Burnham and Anderson, 1998). Statistical analyses were implemented in the SPSS statistical package (IBM SPSS
Statistics, version 22.0).

7
3. Results
3.1 EFFECTS OF GRAZING ON VEGETATION STRUCTURE AND FLORAL
RESOURCES
Dung mass was positively correlated with stocking rate, indicating that amount of biomass
removed was proportional to the number of livestock on each study plot (Fig. 2; r=0.938, p<0.001, n=14, Pearson). Stocking rate was positively correlated with canopy gap (r=0.795,
p=0.001, n=14, Pearson) and basal gap (r=0.664, p=0.01, n=14, Pearson), and negatively correlated with vegetation height (r=-0.716, p=0.004, n=14, Pearson), thus demonstrating that livestock had a significant impact on vegetation structure. Parallel results were found when
using dung mass as the metric of livestock herbivory, with dung mass being positively correlated to canopy gap (r=0.806, p=0.001, n=14 Pearson) and basal gap (r=0.685, p=0.007, n=14,
Pearson) and negatively related to vegetation height (r=-0.779, p=0.001, n=14, Pearson). Plant species richness exhibited a negative relationship with both stocking rate (r=-0.685,
p=0.007, n=14, Pearson) and dung mass (r=-0.738, p=0.003, n=14, Pearson). Vegetation biomass (log-transformed) was negatively correlated with both stocking rate and dung mass, whether log
transformed (stocking rate: r=-0.769, p=0.001, n=14; dung mass: r=-0.775, p=0.001, n=14 respectively) or not (stocking rate: r=-0.633, p=0.015, n=14; dung mass: r=-0.626, p=0.017, n=14). Spring flower coverage (log-transformed) also exhibited a negative relationship, with the
natural log of dung mass (r=-0.547, p=0.043, n=14), showing that grazing negatively influences floral resources (see Fig. 2).
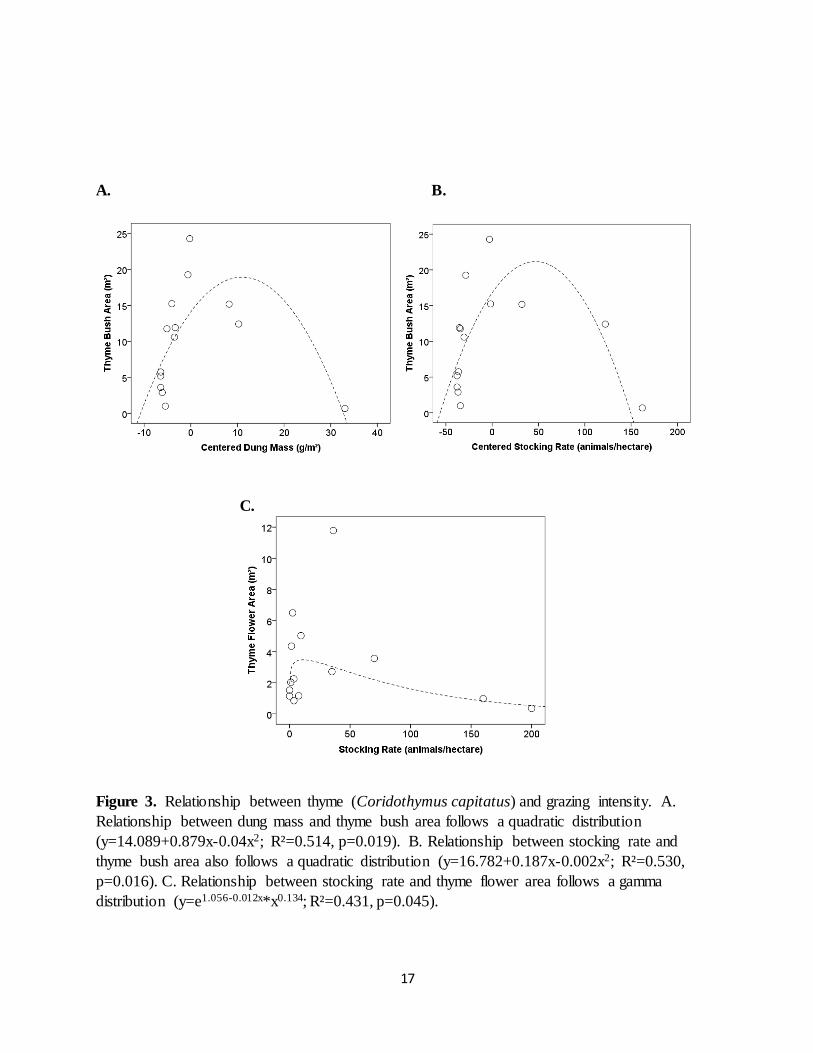
Grazing affected thyme abundance in a somewhat more complex way than it affected vegetation structure. Thyme bush coverage exhibited a hump-shaped curve with increases in grazing levels,
following a quadratic function with both dung mass (R²=0.514, p=0.019, n=14; Fig. 3) and stocking rate (R²=0.530, p=0.016, n=14). Thyme flower coverage exhibited a hump-shaped
gamma curve with stocking rate (R²=0.431, p=0.045, n=14; Fig. 3).
3.2 EFFECTS OF VEGETATION CONDITION AND FLORAL RESOURCES ON
BEEHIVE PRODUCTIVITY
I determined the effects of vegetation condition on beehive productivity using linear mixed models. Each vegetation metric was multiplied by the number of days since the first
measurement, creating a new variable which is the product of the original variable and time. This was done in order to determine whether there was a significant interaction between time and
each variable. The new variable was used in the mixed models to determine whether it was correlated with honey production. I found significantly positive relationships relating beehive productivity to thyme flower area (F=44.329, p<0.001, AICC=771.114), stocking rate (F=27.628,
p<0.001, AICC=785.538), thyme bush area (F=20.934, p<0.001, AICC=788.266), canopy gap (F=19.153, p<0.001, AICC=788.549), and basal gap (F=14.242, p<0.001, AICC=792.277).
Comparison of AICC scores showed that the thyme flower area was most predictive of beehive productivity, followed by stocking rate, thyme bush area, canopy gap, and basal gap. These results suggest that grazing in fact has a positive effect on summer honey production. Results for

8
thyme suggest that summer honey production increases with thyme abundance, which is maximized at light to intermediate grazing levels. Results are summarized in Table 2.
3.3 RELATIVE IMPORTANCE AND PHENOLOGY OF VARIOUS FLORAL
RESOURCE SPECIES TO HONEYBEES
In addition to referencing standard regional botanical literature, local beekeepers helped me determine the relative importance and phenology of local floral resource species to honeybees
Species phenology and relative importance are summarized in Figure 5, which illustrates the importance of the presence of an array of species to support honeybees throughout the year. In general, more heavily grazed areas had a shorter period of available floral resources relative to
ungrazed areas. For example study areas on Paros (ungrazed) had on average significantly longer flowering season (in months) than neighboring areas on Naxos (grazed) (xGRAZED= 3.87±0.524
months vs. xUNGRAZED= 5.8±0.249 months; t=-3.33 p=0.003, n=25, indep. samples t-test).
3.4 ECONOMIC SURVEY RESULTS
Interviews with 18 beekeepers revealed a number of interesting relationships between environmental conditions, apicultural practices and honey production. The interviewed beekeepers were located on the islands of Paros and Naxos and kept their beehives in areas under
widely varying grazing regimes. The interviews conducted in this study revealed that honey production increased with yearly extend of food supplementation (r=0.468, p=0.050, n=18,
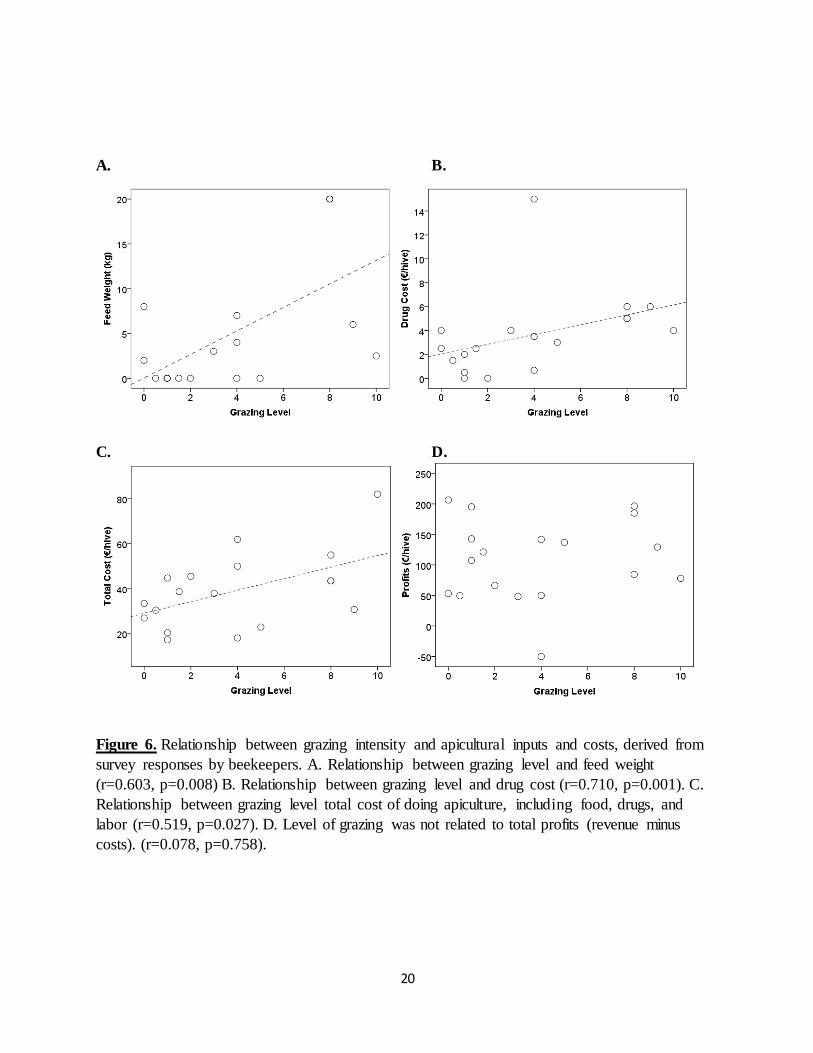
Pearson), suggesting that supplemental feeding successfully prevented bees from consuming the honey they had gathered. Beekeepers were forced to provide more supplemental feed (measured as feed weight in kg) in areas with more extensive levels of livestock grazing (r=0.603, p=0.008,
n=18, Pearson) to make up for reduced local nectaring opportunities. Increases in grazing level were also associated with an increase in drug expenditures (r=0.710, p=0.001, n=18, Pearson), in
combined food and drug costs (r=0.483, p=0.042, n=18, Pearson), as well as in total cost, which included food, drugs, and labor (r=0.519, p=0.027, n=18, Pearson; see Fig. 6C).
These results show that more intense levels of grazing exact higher input costs erasing any increased earnings from rising honey production. This is further underscored by the lack of any
significant relationship between grazing level and net apiculture profits (Fig. 6D.). In a parallel analysis I display the results for all the beekeepers from Paros versus those from Naxos. Figure 7 displays the average income, costs and profits for the beekeepers surveyed on Naxos and Paros.
In addition average cost for the replacement of lost hives was calculated by multiplying the average colony loss rate reported for each island and the cost of replacing a colony. As shown in
Fig. 7, although Naxos beekeepers generate more income from their honey, net profits are actually lower due to increased costs.

9
4. Discussion
4.1 EFFECTS OF LIVESTOCK GRAZING ON VEGETATION STRUCTURE AND
FLORAL RESOURCES
My results demonstrate that livestock grazing leads to significant changes in vegetation structure, plant community diversity and floral resources in Mediterranean heathlands. The primary effect
of livestock herbivory on the vegetation in phryganic ecosystems is a decrease in plant species richness, a decline in spring flower coverage, a reduction in plant biomass and a general opening-up of vegetation cover. Although grazing has historically been deemed detrimental for
plants, more recent studies have suggested that it may in fact be beneficial in some circumstances, improving primary productivity in areas with a grazing history and in arid
environments; this is likely because water stress and grazing both select for similar traits in plants (Thompson & Gilbert, 2013). Thus, plants that are already adapted to water stress possess traits that bestow a certain tolerance to grazing. Removal of older leaves by grazers has been
found to improve vegetation quality and prevent senescence, and in some cases moderate grazing can lead to increases in species richness, plant cover, and biomass, when compared to both
overgrazed and ungrazed areas (Thompson & Gilbert, 2013). While some studies have found moderate levels of grazing to be beneficial, overgrazing can lead
to land degradation and the acceleration of the desertification process in the Mediterranean (Enne et al., 2004; Petanidou & Smets, 1995). Increases in stocking rates to levels exceeding those
encountered by plants throughout their evolutionary history can result in rapid declines in species richness and changes in species composition (Thompson & Gilbert, 2013). In my study, species richness, vegetation biomass, and spring flower coverage (Fig. 2) declined monotonically with
increasing grazing intensity, exhibiting little evidence of positive effects at intermediate grazing levels.
Individual plant species, may also have very different responses to grazing. For example, here we find that abundance of conehead thyme Coridothymus (Thymus) capitatus follows a hump-
shaped curve with increasing grazing intensity (Fig. 3). Because thyme is the most important species for apiculture in the Aegean islands, and produces the most expensive honey, this has
important management implications for this region (Alissandrakis et al., 2007). C. capitatus densities on my study plots peaked at goat stocking rates of ~50 animals/ha; it is likely that below these densities thyme is outcompeted by less grazing-resistant plant species (Thompson &
Gilbert, 2013). Conehead thyme is however by no means immune to grazing: above these stocking rates, direct foraging pressure, as well as probably indirect damage by goat hoofs lead
to a progressive decline in thyme populations. The moderate grazing resistance of C. capitatus documented here follows a general pattern also
seen in previous studies on thyme. For example, in a simulated grazing experiment, Thompson and Gilbert (2013) demonstrated that Egyptian thyme (Thymus decussatus) exhibited no evidence of a negative response to grazing, suggesting that most levels of herbivory do not pose
a threat to this species. In another study, foraging goats and sheep consistently avoided feeding on these plants presumably because of their copious production of allelochemicals and the
associated strong taste (Rashad et al., 2003; Thompson & Gilbert, 2013). In Spain, another

10
species of thyme, Thymus praecox, is known to actually benefit from livestock grazing presumably because of competitive release (Thompson & Gilbert, 2013).
4.2 PRIMARY EFFECTS OF LIVESTOCK GRAZING ON APICULTURE: HONEY
PRODUCTION
My data point towards a complex relationship between livestock grazing and beehive productivity. Using a model selection approach for linear mixed models I found significant
positive relationships between summer hive weight gain – a surrogate for thyme honey production - and several characteristics of the surrounding landscape: thyme flower coverage, stocking rate, thyme bush coverage, canopy gap, and basal gap, with relative fit of the models
decreasing in that order (Table 2). All of these variables co-vary because stocking an area with higher numbers of goats results in more open phryganic communities, i.e. areas characterized by
larger canopy and basal gap distances and also containing higher numbers of thyme bushes (see Fig. 3). The strong positive relationship between amount of honey produced and the abundance of conehead thyme, the main melliferous plant in the surrounding area, is both intuitive and
follows a similar pattern established by previous studies (e.g. Nombré et al., 2009).
While abundance of thyme is the strongest predictor of summer honey production, the actual relationship between honey production and intensity of livestock herbivory is more complex. Given the direct link between honey production and amount of thyme present in the surrounding
landscape as demonstrated in Sub-study 2, and because thyme occurrence peaks at intermediate levels of grazing, this would suggest that honey production would also be maximized at
intermediate levels of grazing. As such, this sub-study indicates that at least light to moderate levels of grazing should have a positive effect on honey production.
Considered narrowly, the positive effect of moderate grazing on honey production that I report here, would seem to contradict the results of first sub-study, which found that even light grazing
led to monotonic declines in floral resources (Fig. 2). The two results however do not conflict with each other because they consider somewhat different types of floral resources. Sub-study 1 evaluates spring annual flower cover, which constitutes only a relatively minor source of honey
for Aegean apiculture, but which is of great importance as a source of pollen and for maintaining healthy bee colonies until summer thyme season commences. In contrast, the second sub-study,
by virtue of the timing, focuses on honey production during the main summer thyme season: this period is of paramount significance for commercial honey production but not as important as a source of nourishment for the bees.
4.3 SECONDARY EFFECTS OF GRAZING ON APICULTURE: COLONY HEALTH Landscape grazing on the Cyclades by sheep and goats has profound effects on the amount,
temporal extent and quality of the floral resources available to foraging bees. Even moderate amounts of grazing lead to a decline in floral diversity in local phrygana and result in a shift to a
species-poor, grazing-resistant plant community, frequently dominated by C. capitatus.

11
Although thyme flowers are the most important melliferous floral resource in the study area, they only blossom at the beginning of the summer, providing nectar for only about 40 days a year
(Alissandrakis et al., 2007). Thus, I found that while a grazed landscape had an abundance of thyme flowers, it also had few other floral resources to support the honeybees through the rest of
the year. Areas that are not grazed, provide a broad spectrum or floral resources (termed ‘a ladder of flowers’ by local beekeepers) that provide food for a bee colony over the whole course of the year. While most of the native plant species flower during the spring and early summer
periods, there are several taxa that are available even during the winter season. I found that grazed areas (e.g. on Naxos) had significantly shorter period of available floral resources relative
to ungrazed areas. The reduced diversity of flowering resources and the resulting shorter flowering season in grazed areas puts at least two different types of strain on local beehives. First, it creates a longer period of the year when there are no natural food sources are available to
foraging bees, and second, it limits the nutritional diversity of foods, therefore increasing the risk for malnutrition.
Considering the relative brevity of the thyme season, the fact that most of this thyme honey is harvested, and the dearth of alternative flowers during the rest of the year, one would expect that
significant food supplementation is needed to ensure beehive survivorship. Beekeeper surveys on both Paros and Naxos corroborate this notion.
Survey results showed that beekeepers in more heavily grazed areas supplement their bees with more food and drugs. In addition beekeepers in such areas also had to invest more funds in the
application of larger amounts of antiparasitic agents reflecting the challenge of fending off pests such as Varroa destructor. This is in line with current scientific consensus, that food
supplements do not provide the same nutritive quality to honeybees as natural sources of nectar and pollen thus rendering them increasingly susceptible to parasites and diseases (Decourtye, 2010).
Adequate nutrition is the basis for a colony’s healthy growth, development, and survival, as a
colony can rear brood only when all essential nutrients are present in the diet (Brodschneider & Crailsheim, 2010; di Pasquale et al., 2013). Nutritional stress interacts with many factors affecting honeybees, including impacting birth, death and adult survival rates, as well as
immunocompetence and susceptibility to infection (Naug, 2009, Brodschneider & Crailsheim, 2010). While nectar is certainly important as source of calories, pollen is the main source of
proteins, amino acids, lipids, starch, steroids, vitamins, and minerals, and an adequate pollen supply is essential for the long-term survival of a colony (Keller et al., 2005, Di Pasquale et al., 2013). Because different pollen types vary considerably in their nutritional contents and quality,
the optimal diet for honeybees is comprised of a diversity of different pollens (Brodschneider & Crailsheim, 2010; Keller et al., 2005; di Pasquale et al., 2013). Whereas thyme is the most
important nectariferous flower in this region, beekeepers reported that it is not a good provider of pollen. This means that Aegean bee colonies foraging primarily on thyme nectar are in particular need of alternative sources of protein and nutrients. Unfortunately, in heavily grazed landscapes,
few other floral resources exist beyond thyme so that many potentially critical nutritional needs of bees are left unmet. Local beekeepers indeed report that in with strong livestock presence,
beehives tend to be less virile, and more susceptible to infection with Varroa, requiring higher and more frequent application of costly anti-parasitic agents to ensure survival. Furthermore,

12
beehives in grazed, species-poor areas require more sustained care to survive and tend to have a shorter life expectancy, thus reducing the duration of their productive period and raising hive
replacement costs.
4.4 ECONOMIC RAMIFICATIONS OF GRAZING ON APICULTURE
Results from my survey indicate that beekeepers in heavily grazed areas were only able to maintain honey production after investing heavily in supplemental feeds, drugs and substantial
additional labor. I found that beekeepers in heavily grazed areas initiate supplementation after the main honey harvest in August and maintain a constant feeding regime throughout most of the winter until well into the spring flowering season. On the other extreme, beekeepers in ungrazed
areas would frequently not provide any supplemental feeding, explaining instead that the local flora offered continuous flower resources that carried a bee colony throughout the year. Indeed in
ungrazed areas, we documented the presence of a diversity of flowering plants providing nectar every month of the year (Fig. 5).
Heavily supplemented bee colonies in more grazed areas also appear to be in poorer health, requiring a heavier investment in antiparasitic drugs. Other studies have shown that this occurs
because artificial feed is an inadequate substitute for naturally available nectar and pollen (Brodschneider & Crailsheim, 2010, Decourtye, 2010). As a result, although hives in grazed areas may produce a higher amount of thyme honey, they also incur higher expenses in the form
of labor, drugs, supplemental feeding and elevated replacement costs due to shortened life expectancy. These costs tend to offset any gains produced by increased honey production; our
survey showed that higher grazing intensity and by extension higher amounts of thyme honey production status, did not result in more profits (Fig. 6D). As a matter of fact, beekeepers on the lightly grazed island of Paros generated more income per beehive despite collecting less honey
than their counterparts on the heavily grazed island of Naxos (Fig. 7).
5. Conclusion
Increasing evidence suggests that human-caused landscape alteration is driving a worldwide
decline in the spatial and temporal availability of resources upon which honeybees depend, resulting in inadequate nutrition, poor colony health, and hive population decreases (Decourtye, 2010; di Pasquale et al., 2013). While much attention has been paid to agricultural intensification
as the driver of landscape degradation, overgrazing by ruminants plays an analogous role in the Mediterranean (Petanidou & Smets, 1995, Enne et al., 2004).
Current consensus is that the greatest economic and environmental benefits provided by Mediterranean-type rangelands are realized through multiple uses (Amiri et al., 2011; Bagella et
al., 2013). Apiculture is considered to be an important source of income in Mediterranean rangelands and particularly in phryganic ecosystems, and represents a sustainable source of
income for inhabitants of rural areas (Petanidou & Smets, 1995, Koniak, 2009, Amiri et al., 2011, Bacandritsos et al., 2010, Bagella et al., 2013).

13
Because of the long history of grazing in the Mediterranean, grazing-adapted species have
become especially widespread, and it has been suggested that only extremely intensive grazing will cause a reduction in diversity with some authors arguing that relatively high levels are
actually required for the maintenance of floral diversity (Vulliamy et al., 2006). This study does not support this, instead, our results show a monotonic decline in species richness and spring flower coverage with increasing grazing pressure.
From the perspective of apiculture, while overly intense, heavy grazing surely damages
vegetation and is detrimental to honey production, it remains unclear what are exactly the optimal levels of grazing. Lighter grazing is most likely beneficial to floral resource diversity and thus honey production. Heavier grazing also significantly decreased species richness and
flower coverage. Thyme, the most important nectariferous flower in the study system, was found to benefit most from light to intermediate levels of grazing. This study confirms that increased
grazing in Aegean heathlands can shift the community to a thyme-dominated scrubland with pronounced benefits (higher crop yields) and costs (reduced floral resource diversity, bee colony stress and elevated supplementation, drug and labor costs).
Because much of this pattern is driven by the unusual ecological characteristics of an extreme
nectar producer (C. capitatus), it is not clear to which extent the increased benefits of grazing reported above are generalizable outside the geographic range of this specific plant taxon. In contrast, the costs associated with more livestock grazing, i.e. reduced floral diversity (shorter
flowering season, reduced diversity of foods and associated stress and disease susceptibility in beehives), appear robust and are likely to hold across a range of ecological settings. Even in this
favorable setting, increased honey yields fail to compensate for ballooning bee colony maintenance costs, indicating that intensive livestock grazing of Aegean heathlands is incompatible with profitable apiculture operations.
Maintaining abundant and diverse floral resources within any agro-ecosystem is necessary to
thwart the negative effects of intensive land use on honeybee populations, productivity, and health (Di Pasquale et al., 2013). Further studies relating plant community composition and phenology with honeybee foraging are needed to develop greater understanding of the effects of
floral resource abundance and diversity on honey production (Bagella, 2013). Such studies should also take into consideration all economic inputs and outputs in order to gain a more
complete understanding of the economic implications that landscape has on apiculture. In addition, much needed information on the links between nutrient availability and bee health would help prevent current bee colony losses by elucidating how presence of specific floral
resources affects overall bee colonies health (Di Pasquale et al., 2013).
While beekeepers can compensate for some of these losses through increased supplementation with foods and drugs, this has proven to be much less healthy for bees than natural nutrient sources (Brodschneider and Crailsheim, 2010; Decourtye, 2010), and requires additional
economic inputs, therefore reducing profits. Beekeepers thus have a vested interest in promoting policies which move away from supporting overly intensified modes of land use such as grazing.
Therefore, appropriate livestock management is critical in order to not only ensure the welfare of rural people in economically deprived areas of the Mediterranean, but is also important in

14
sustaining increasingly threatened honeybee populations that we rely upon to pollinate the majority of our crops. Future studies expanding on this research will help further illuminate the
importance of sustaining diverse agroecological landscapes.
Achieving sustainable levels of grazing in the Mediterranean requires policy changes to reverse the current trend of heavy subsidies, and instead promote the re-establishment of sounder, locally targeted and voluntary management practices (Kizos et al., 2013). In other rangeland landscapes,
inhabitants have found that the landscape is most efficiently utilized through multiple uses beyond livestock farming, such as gaming, harvesting of wood products, apiculture, cultivation
of ornamental and medicinal plants, all of which can provide good supplemental incomes to animal husbandry (Amiri et al., 2011). Optimal use of the phryganic ecosystem for a diversity of such activities, is best achieved by maintaining its original semi-natural state with sustained but
extensive grazing (Petanidou & Smets, 1995). Allowing moderate levels of grazing preserves the heterogeneous landscape of shrubland and open patches, therefore maximizing the diversity and
abundance of floral resources (Vulliamy et al., 2006). The conclusions from this study are in line with this management approach: light to intermediate goat stocking rates promote elevated populations of thyme without depressing the remaining floral resources.
Ultimately, livestock grazing can have a variety of first and second order effects on
Mediterranean vegetation; however, the exact nature of these remains unclear, as they depend on the intensity and timing of grazing as well as on the prevailing local conditions (Kaltsas et al., 2013). In conclusion, a certain degree of grazing in Mediterranean landscapes likely promotes
and maintains maximal biodiversity of floral resources, as well as productive beehives. However, in recent decades, livestock subsidies have led to serious overgrazing, a practice that not only is
unsustainable but which also undermines the economic potential of the landscape and reduces its suitability for multi-use purposes. Petanidou & Smets (1995) claimed that apiculture may be the best method for the ecological upkeep of the marginal areas which overgrazing has contributed
to creating, as well as aiding in the economic revival for the inhabitants of these areas. In this study, I demonstrate that livestock husbandry, if it exceeds certain stocking levels, has the
potential to not only damage native vegetation and associated floral resources but also undermines the profitability of other activities such as apiculture.

15
Figures
Figure 1. Map of the study sites on the islands of Naxos and Paros. Vegetation study plots are
indicated with triangles and focal beehives sites are indicated with hexagons.

16
A. B.
C. D.
Figure 2. Dung mass as measured along transects closely reflected local goat stocking rates (top
left [A.]; r=0.938, p<0.001). Increasing dung mass was significantly associated with declining
plant species richness (top right [B.]; r=-0.738, p=0.003); vegetation biomass (bottom left [C.];
y=2.53*x-0.165, R2=0.6, p=0.001), and spring flower coverage (bottom right [D.]; y=3.7*x-0.118,
R2=0.299, p=0.043). Power function curves fit best to the vegetation biomass and spring flower
area data and are shown here.
17
A. B.
C.
Figure 3. Relationship between thyme (Coridothymus capitatus) and grazing intensity. A.
Relationship between dung mass and thyme bush area follows a quadratic distribution
(y=14.089+0.879x-0.04x2; R²=0.514, p=0.019). B. Relationship between stocking rate and
thyme bush area also follows a quadratic distribution (y=16.782+0.187x-0.002x2; R²=0.530,
p=0.016). C. Relationship between stocking rate and thyme flower area follows a gamma
distribution (y=e1.056-0.012x*x0.134; R²=0.431, p=0.045).

18
Figure 4. Hive weight gain over the course of the main spring/summer flowering season. Dotted
lines signify beekeepers on Paros (ungrazed) and solid lines signify beekeepers on Naxos
(grazed).

19
Figure 5. Flowering phenology and relative importance of melliferous flora in Paros and Naxos.
Relative importance of each species to honeybees is indicated by coloration, with darker colors
representing species of greater importance.
PLANT SPECIES Jan Feb Mar Apr May Jun Jul Aug Sep Oct Nov Dec
Citrus spp.
Asphodelus fistulosus
Tamarix parviflora
Centaurea spinosa
Calicotome villosa
Erica arborea
Ruta graveolens
Convolvulvus elegantissimus
Pistacia terebinthus
Salvia fruticosa
Phlomis fruticosa
Lonicera sp.
Mandragora oficcinarum
Satureja thymbra
Scolymus maculatus
Myrtus communis
Heliotropium spp.
Anthyllis vulneraria
Helichrysum stoechas
Ballota acetabularia
Onoperdum argolicum
Cistus creticus
Origanum onites
Teucrium polium
Cuscuta sp.
Genista acanthoclada
Eucalyptus camaldulensis
Coridothymus capitatus
Limonium sinuatum
Cichorium intybus
Carlina sp.
Asphodelus B.
Urginea maritima
Asparagus sp.
Ceratonia siliquatrum
Erica manipuliflora
Tamarix smyrnensis
Oxalis pes-caprae
Citrus spp.
BLOOM PERIOD
20
A. B.
C. D.
Figure 6. Relationship between grazing intensity and apicultural inputs and costs, derived from
survey responses by beekeepers. A. Relationship between grazing level and feed weight
(r=0.603, p=0.008) B. Relationship between grazing level and drug cost (r=0.710, p=0.001). C.
Relationship between grazing level total cost of doing apiculture, including food, drugs, and
labor (r=0.519, p=0.027). D. Level of grazing was not related to total profits (revenue minus
costs). (r=0.078, p=0.758).

21
Figure 7. Average income, costs, and profits for the beekeepers surveyed on Naxos and Paros

22
Tables
Table 1. Study plots on Naxos Isl., with summary data.
Name Latitude Longitude Elevation (m) Aspect Primary Vegetation Secondary Vegetation
Stocking Rate
(livestock/ha)
Livestock Dung
Biomass (g/m2)
Kokimas Galanadou N37°04.463' E025°25.348' 180 N Genista /Calicotome /Cistus phrygana Quercus 0 0.0
Agios Dimitrios Galanadou N37°04.758' E025°25.378' 66 E Cistus /Calicotome phrygana Pistacea 0 0.0
Lofos Galanadou N37°04.682' E025°25.256' 151 S Cistus /Calicotome phrygana Quercus 1 0.3
Agios Nikolaos Galanadou N37°05.023' E025°25.161' 55 W Genista phrygana Pistacea 1.5 0.0
Upper Agiassos N36°58.819' E025°25.999' 33 S Coridothymus phrygana Juniperus 2.5 3.1
Upper Bazeos Tower N37°02.026' E025°26.963' 197 W Coridothymus /Genista phrygana Quercus/Juniperus 3.5 1.3
Stavropigi Vivlou N37°02.360' E025°24.593' 170 E Cistus /Calicotome phrygana Pistacea 3.6 1.0
Koutsouria Filotiou N37°02.457' E025°29.137' 326 E Coridothymus /Genista phrygana Quercus 7.5 2.9
Gialous Agiassou N36°57.625' E025°26.374' 55 S Coridothymus phrygana Juniperus 9.4 5.8
Lower Agiassos N36°58.375' E025°25.751' 55 W Coridothymus phrygana Juniperus 35 6.2
Platia Rachi N37°00.794' E025°24.470' 140 E Coridothymus /Genista phrygana Juniperus 36.1 2.4
Lower Bazeos Tower N37°02.067' E025°26.875' 207 W Coridothymus phrygana Juniperus 140 14.7
Apaliros Castle N37°01.079' E025°27.044' 207 N Coridothymus /Genista phrygana None 160 16.7
Hohlidia Agiassou N36°57.554' E025°25.949' 62 N Sparse Coridothymus None 200 39.5

23
Dependent Variable : Beehive productivity (kg/day/hive) (n=53)
Model Log Likelihood AICC ΔAICC
Thyme Flower Area * Days 767.017 771.114 0
Stocking Rate * Days 781.441 785.538 14.424
Thyme Bush Area * Days 784.169 788.266 17.152
Canopy Gap * Days 784.451 788.549 17.435
Basal Gap * Days 788.18 792.277 21.163
Table 2. Mixed model results relating beehive productivity to canopy gap, thyme flower area,
basal gap, thyme bush area, vegetation height, and species richness per transect. Each variable is
multiplied by the number of days since the first hive weight was taken, in order to account for
the effect of time.

24
References
Alissandrakis, E., Tarantilis, P. A., Harizanis, P. C., & Polissiou, M. (2007). Comparison of the
volatile composition in thyme honeys from several origins in Greece. Journal of
Agricultural and Food Chemistry, 55(20), 8152-8157.
Amiri, F., Shariff, A. B. M., & Arekhi, S. (2011). An approach for rangeland suitability analysis
to apiculture planning in Gharah Aghach Region, Isfahan-Iran. World Applied Sciences
Journal, 12(7), 962-972.
Bacandritsos, N., Granato, A., Budge, G., Papanastasiou, I., Roinioti, E., Caldon, M., Falcaro, C.,
Gallina, A. & Mutinelli, F. (2010). Sudden deaths and colony population decline in Greek
honey bee colonies. Journal of Invertebrate Pathology, 105(3), 335-340.
Bagella, S., Satta, A., Floris, I., Caria, M. C., Rossetti, I., & Podani, J. (2013). Effects of plant
community composition and flowering phenology on honeybee foraging in
Mediterranean sylvo‐pastoral systems. Applied Vegetation Science, 16(4), 689-697.
Beekman, M., & Ratnieks, F. L. W. (2000). Long‐range foraging by the honey‐bee, Apis
mellifera L., Functional Ecology, 14(4), 490-496.
Brodschneider, R., & Crailsheim, K. (2010). Nutrition and health in honey bees.
Apidologie, 41(3), 278-294.
Burnham, K., and D. Anderson. 1998. Model selection and multimodel inference: a practical
information-theoretic approach. 1st ed. Springer Verlag, New York.
Decourtye, A., Mader, E., & Desneux, N. (2010). Landscape enhancement of floral resources for
honey bees in agro-ecosystems. Apidologie, 41(3), 264-277.
De Rancourt, M., Fois, N., Lavin, M. P., Tchakérian, E., & Vallerand, F. (2006). Mediterranean
sheep and goat production: An uncertain future. Small Ruminant Research, 62(3), 167-
179.
Di Pasquale, G., Salignon, M., Le Conte, Y., Belzunces, L. P., Decourtye, A., Kretzschmar, A.,
Suchail, S., Brunet, J. & Alaux, C. (2013). Influence of pollen nutrition on honey bee
health: do pollen quality and diversity matter? PloS ONE, 8(8), e72016.
Enne, G., Zucca, C., Montoldi, A., & Noè, L. (2004). The role of grazing in agropastoral systems
in the Mediterranean region and their environmental sustainability.
Farrar, C. L. (1937). The influence of colony populations on honey production. Journal of
Agricultural Research, 54(12), 945-954.

25
Garibaldi, L. A., Steffan‐Dewenter, I., Kremen, C., Morales, J. M., Bommarco, R., Cunningham,
S. A., Carvalheiro, L. G., Chacoff, N. P., Dudenhöffer, J. H., Greenleaf, S.S., Holzschuh,
A., Isaacs, R., Krewenka, K., Mandelik, Y., Mayfield, M. M., Morandin, L.A., Potts,
S.G., Ricketts, T. H., Szentgyörgyi, H., Viana, B. F., Westphal, C., Winfree, R. & Klein,
A. M. (2011). Stability of pollination services decreases with isolation from natural areas
despite honey bee visits. Ecology Letters, 14(10), 1062-1072.
Grove, A.T., & O. Rackham (2001) The Nature of Mediterranean Europe: An ecological
history. Yale University Press, New Haven, CT, USA.
Hadar, L., Noy‐Meir, I., & Perevolotsky, A. (1999). The effect of shrub clearing and grazing on
the composition of a Mediterranean plant community: functional groups versus
species. Journal of Vegetation Science, 10(5), 673-682.
Hagler, J. R., Mueller, S., Teuber, L. R., Machtley, S. A., & Van Deynze, A. (2011). Foraging
range of honey bees, Apis mellifera, in alfalfa seed production fields. Journal of Insect
Science, 11(1), 144.
Herrick, J. E., Van Zee, J. W., Havstad, K. M., Burkett, L. M., & Whitford, W. G.
(2005). Monitoring manual for grassland, shrubland and savanna ecosystems. Volume I:
Quick Start. Volume II: Design, supplementary methods and interpretation. USDA-ARS
Jornada Experimental Range.
Kaltsas, D., Trichas, A., Kougioumoutzis, K., & Chatzaki, M. (2013). Ground beetles respond to
grazing at assemblage level, rather than species-specifically: the case of Cretan
shrublands. Journal of Insect Conservation, 17(4), 681-697.
Keller, I., Fluri, P., & Imdorf, A. (2005). Pollen nutrition and colony development in honey bees:
part I. Bee World, 86(1), 3-10.
Kizos, T., Plieninger, T., & Schaich, H. (2013). “Instead of 40 Sheep there are 400”: Traditional
Grazing Practices and Landscape Change in Western Lesvos, Greece. Landscape
Research, 38(4), 476-498.
Koniak, G., Noy-Meir, I., & Perevolotsky, A. (2009). Estimating multiple benefits from
vegetation in Mediterranean ecosystems. Biodiversity and Conservation, 18(13), 3483-
3501.
Kremen, C., Williams, N. M., Aizen, M. A., Gemmill‐Herren, B., LeBuhn, G., Minckley, R.,
Packer, L., Potts, S. G., Roulston, T., Steffan-Dewenter, I., Vázquez, D. P., Winfree, R.,
Adams, L., Crone, E. E., Greenleaf, S. S., Keitt, T. H., Klein, A., Regetz, J. & Ricketts,

26
T. H. (2007). Pollination and other ecosystem services produced by mobile organisms: a
conceptual framework for the effects of land‐use change. Ecology Letters, 10(4), 299-
314.
Lorent, H., Sonnenschein, R., Tsiourlis, G. M., Hostert, P., & Lambin, E. (2009). Livestock
subsidies and rangeland degradation in central Crete. Ecology and Society, 14(2), 41.
Naug, D. (2009). Nutritional stress due to habitat loss may explain recent honeybee colony
collapses. Biological Conservation, 142(10), 2369-2372.
Nombré, I., Schweitzer, P., Sawadogo, M., Issaka Boussim, J., & Millogo‐Rasolodimby, J.
(2009). Assessment of melliferous plant potentialities in Burkina Faso. African Journal of
Ecology, 47(4), 622-629.
Perevolotsky, A., & Seligman, N. A. G. (1998). Role of grazing in Mediterranean rangeland
ecosystems. Bioscience, 1007-1017.
Petanidou, T., Smets, E. (1995). The potential of marginal lands for bees and apiculture: nectar
secretion in Mediterranean shrublands. Apidologie, 26(1), 39-52.
Potts, S. G., Vulliamy, B., Dafni, A., Ne'eman, G., & Willmer, P. (2003). Linking bees and
flowers: how do floral communities structure pollinator communities? Ecology, 84(10),
2628-2642.
Potts, S. G., Vulliamy, B., Roberts, S., O'Toole, C., Dafni, A., Ne'eman, G., & Willmer, P. G.
(2004). Nectar resource diversity organises flower‐visitor community
structure. Entomologia Experimentalis et Applicata, 113(2), 103-107.
Russo, L., DeBarros, N., Yang, S., Shea, K., & Mortensen, D. (2013). Supporting crop
pollinators with floral resources: network‐based phenological matching. Ecology and
Evolution, 3(9), 3125-3140.
Steffan-Dewenter, I., & Kuhn, A. (2003). Honeybee foraging in differentially structured
landscapes. Proceedings of the Royal Society of London. Series B: Biological
Sciences, 270(1515), 569-575.
Szabo, T. I., & Lefkovitch, L. P. (1989). Effect of brood production and population size on
honey production of honeybee colonies in Alberta, Canada. Apidologie, 20(2), 157-163.
Thompson, K., & Gilbert, F. (2013). The effects of grazing on the endangered Sinai Thyme
(Thymus decussatus) in a hyper-arid environment. Journal of Arid Environments, 99, 14-
22.

27
Vulliamy, B., G Potts, S., & G Willmer, P. (2006). The effects of cattle grazing on plant‐ pollinator communities in a fragmented Mediterranean landscape. Oikos, 114(3), 529-
543.
Winfree, R., Williams, N. M., Gaines, H., Ascher, J. S., & Kremen, C. (2008). Wild bee
pollinators provide the majority of crop visitation across land‐use gradients in New Jersey
and Pennsylvania, USA. Journal of Applied Ecology, 45(3), 793-802.

28
Appendix A
Summary data for study plots on Naxos Isl.
Site
Stocking Rate
(livestock/ha)
Dung Mass
(g/m2)
Vegetation
Biomass (kg/m2)
Thyme Flower
Area (m2)
Thyme Bush
Area (m2)
Spring Flower
Coverage (m2)
Average Canopy
Gap (cm)
Average Basal
Gap (cm)
Average Vegetation
Height (cm)
Plant Species
Richness
Kokimas Galanadou 0 0 7.4 1.2 3.1 4.2 16.0 25.7 98.5 14
Agios Dimitrios Galanadou 0 0 8.8 0.2 1.0 7.0 9.0 34.7 100.9 13
Lofos Galanadou 1 0.3 3.9 0.1 1.7 3.7 16.2 25.3 73.8 12
Agios Nikolaos Galanadou 1.5 0 4.3 1.2 6.6 15.6 5.1 30.7 101.6 10
Upper Agiassos 2.5 3.1 1.4 0.1 4.7 1.6 56.8 85.9 45.9 8
Upper Bazeos Tower 3.5 1.3 3.0 0.0 3.8 5.0 47.9 68.5 78.2 13
Stavropigi Vivlou 3.57 1 9.7 0.0 0.3 7.6 18.4 27.3 71.8 9
Koutsouria Filotiou 7.5 2.9 3.0 1.3 5.5 6.9 35.1 59.3 52.9 9
Gialous Agiassou 9.4 5.8 1.5 1.3 16.0 0.9 27.5 48.4 43.5 4
Lower Agiassos 35 6.2 1.4 1.5 12.2 1.4 59.8 70.2 52.6 7
Platia Rachi 36.1 2.4 3.1 0.7 5.0 6.3 52.1 64.7 48.2 7
Lower Bazeos Tower 70 14.7 1.2 1.2 5.5 6.4 58.9 82.4 39.7 7
Apaliros Castle 160 16.7 0.9 1.2 2.8 2.9 66.3 79.7 41.9 6
Hohlidia Agiassou 200 39.5 1.2 0.2 0.9 1.6 95.8 95.2 6.4 2

29
Appendix B
Summary data for beehive sites on Naxos.
Beekeeper Transect
Average
Canopy
Gap (cm)
Average
Basal
Gap (cm)
Average
Vegetation
Height (cm)
Thyme
Flower
Area (m²)
Thyme
Bush
Area (m²)
Stocking Rate
(livestock/ha)
Naxos 1 1 59.9 97.3 83 2.5 8.6 141.5
Naxos 1 2 69.6 69.6 55.3 2.8 4.6 141.5
Naxos 1 3 72.6 99.2 97.9 1.4 2.2 141.5
Naxos 1 4 61.9 82.9 78.8 0.7 1.2 141.5
Naxos 1 5 63.9 97 56.4 1.7 2.5 141.5
Naxos 1 6 57.4 81.4 77.1 - - 141.5
Naxos 1 7 61.1 89.6 75.0 - - 141.5
Naxos 1 8 60.3 81.9 89.9 - - 141.5
Naxos 1 9 77.6 99.4 57.6 - - 141.5
Naxos 1 10 25.4 84.5 94.8 - - 141.5
Naxos 1 Average / Total 61 88.3 76.5 9 19 141.5
Naxos 2 1 40.3 64.8 38.9 1.1 5.7 106.1
Naxos 2 2 54.1 64.8 41.9 4.6 7.7 106.1
Naxos 2 3 32.5 66.3 64.5 5.2 8.4 106.1
Naxos 2 4 31.2 63.9 44.9 3.4 14.9 106.1
Naxos 2 5 73.3 93.9 44.5 7.3 15.7 106.1
Naxos 2 6 26 90.1 69.1 - - 106.1
Naxos 2 7 50.9 89.5 43.9 - - 106.1
Naxos 2 8 60.3 88.7 72.2 - - 106.1
Naxos 2 9 31.6 83.6 42.4 - - 106.1
Naxos 2 10 46.9 87.7 67.9 - - 106.1
Naxos 2 Average / Total 44.7 79.3 53 21.6 52.4 106.1
Naxos 3 1 71.8 92.5 22.7 3.6 6.2 106.1
Naxos 3 2 72.9 92.3 27.2 4.9 7.4 106.1
Naxos 3 3 52.9 83.2 48.7 1.8 3.9 106.1
Naxos 3 4 72.5 92.6 39.5 2.4 3.5 106.1
Naxos 3 5 75.1 96.4 55.2 4.8 6.7 106.1
Naxos 3 Average / Total 69 91.4 38.6 17.5 27.8 106.1

30
Appendix C
Summary data for beehive sites on Paros.
Beekeeper Transect
Average
Canopy
Gap (cm)
Average
Basal
Gap (cm)
Average
Vegetation
Height (cm)
Thyme
Flower
Area (m²)
Thyme
Bush
Area (m²)
Stocking
Rate
(livestock/ha)
Paros 1 1 34.6 59.6 50.4 0.4 1.2 6.4
Paros 1 2 29.2 71.5 49 0 3.8 6.4
Paros 1 3 62.7 87.2 41 0 1.8 6.4
Paros 1 4 33.6 58.8 50.5 0 4.1 6.4
Paros 1 5 37.5 52.4 61.8 0 0.8 6.4
Paros 1 6 34.2 55 67.2 - - 6.4
Paros 1 7 64.1 79.4 43.9 - - 6.4
Paros 1 8 27.7 74.8 41.4 - - 6.4
Paros 1 9 57.8 79.3 61.2 - - 6.4
Paros 1 10 49 62.9 64.1 - - 6.4
Paros 1 Average / Total 43 68.1 53 0.4 11.5 6.4
Paros 2 1 44.6 94.7 80.2 0.3 0.6 1.4
Paros 2 2 43.3 98.2 71.2 4.7 7.3 1.4
Paros 2 3 42.7 86 66.4 2.2 3.9 1.4
Paros 2 4 51.3 83.6 79.3 0.7 1.4 1.4
Paros 2 5 36.3 88.8 93.3 0.1 0.3 1.4
Paros 2 Average / Total 43.6 90.3 78.1 8 13.5 1.4

31
Appendix D
Hive weight summary data for Naxos beekeepers.
Beekeeper Beehive
Grazing
Status Weight 1 (kg)
Day Number
for Weight 1 Weight 2 (kg)
Day Number
for Weight 2 Weight 3 (kg)
Day Number
for Weight 3 Weight 4 (kg)
Day Number
for Weight 4
Naxos 1 1 Grazed 22.4 0 29.6 14 32.4 31 35.7 46
Naxos 1 2 Grazed 27.7 0 33.8 14 39.1 31 42.7 46
Naxos 1 3 Grazed 23.3 0 26.6 14 30.9 31 34.4 46
Naxos 1 4 Grazed 24.1 0 28.7 14 33 31 36.5 46
Naxos 1 5 Grazed 26.5 0 28.9 14 31.9 31 35.6 46
Naxos 1 6 Grazed 26.1 0 30.3 14 35.7 31 38.7 46
Naxos 1 7 Grazed 29 0 37.4 14 42 31 47.3 46
Naxos 1 8 Grazed 30.9 0 40.1 14 44.6 31 48.9 46
Naxos 1 9 Grazed 26.5 0 31.4 14 36.4 31 39.3 46
Naxos 1 10 Grazed 25.5 0 30.1 14 35.8 31 40.1 46
Naxos 1 Average Grazed 26.2 0 31.7 14 36.2 31 39.9 46
Naxos 2 1 Grazed 40 0 44.2 13 47.9 31 52.9 41
Naxos 2 2 Grazed 42.4 0 45.9 13 47.2 31 47.3 41
Naxos 2 3 Grazed 37.5 0 39.7 13 39.8 31 - 41
Naxos 2 4 Grazed 38.1 0 47.2 13 56 31 56.5 41
Naxos 2 5 Grazed 43.5 0 48.8 13 59.2 31 60 41
Naxos 2 6 Grazed 36.9 0 41.7 13 52.3 31 52.9 41
Naxos 2 7 Grazed 42.3 0 49.5 13 56.5 31 52.1 41
Naxos 2 8 Grazed 39.4 0 47.5 13 58.6 31 57.4 41
Naxos 2 9 Grazed 33 0 37.5 13 47.4 31 53.2 41
Naxos 2 10 Grazed 42.3 0 44.2 13 50.8 31 51.2 41
Naxos 2 Average Grazed 39.5 0 44.6 13 51.6 31 53.7 41
Naxos 3 1 Grazed 37.1 0 43.6 13 55 31 - -
Naxos 3 2 Grazed 33.2 0 42.5 13 41.6 31 - -
Naxos 3 3 Grazed 35.8 0 46.3 13 50.1 31 - -
Naxos 3 4 Grazed 37.3 0 46.9 13 53.7 31 - -
Naxos 3 5 Grazed 35.6 0 39.1 13 56.5 31 - -
Naxos 3 6 Grazed 36.4 0 40.6 13 47 31 - -
Naxos 3 7 Grazed 32.5 0 40.9 13 43 31 - -
Naxos 3 8 Grazed 38.2 0 47.7 13 55.9 31 - -
Naxos 3 9 Grazed 32.1 0 40.6 13 50.6 31 - -
Naxos 3 10 Grazed 33.1 0 43.2 13 50.7 31 - -
Naxos 3 Average Grazed 35.1 0 43.1 13 50.4 31 - -

32
Appendix E
Hive weight summary data for Paros beekeepers.
Beekeeper Beehive
Grazing
Status Weight 1 (kg)
Day Number
for Weight 1 Weight 2 (kg)
Day Number
for Weight 2 Weight 3 (kg)
Day Number
for Weight 3
Paros 1 1 Ungrazed 36 0 40.6 14 41.3 35
Paros 1 2 Ungrazed 37.2 0 41.9 14 41.5 35
Paros 1 3 Ungrazed 34.9 0 40.2 14 42.5 35
Paros 1 4 Ungrazed 38.1 0 42.9 14 45.2 35
Paros 1 5 Ungrazed 35.6 0 39.3 14 40.3 35
Paros 1 6 Ungrazed 40.9 0 43.2 14 45.8 35
Paros 1 7 Ungrazed 28.4 0 30.7 14 - 35
Paros 1 8 Ungrazed 30.4 0 35 14 36.3 35
Paros 1 9 Ungrazed 32.9 0 38.1 14 38.8 35
Paros 1 10 Ungrazed 34.4 0 40.3 14 47.3 35
Paros 1 11 Ungrazed 28.8 0 31.5 14 35.2 35
Paros 1 12 Ungrazed 34.8 0 40.3 14 39.6 35
Paros 1 13 Ungrazed 39.8 0 46.7 14 46.8 35
Paros 1 14 Ungrazed 35.2 0 37.2 14 38.7 35
Paros 1 15 Ungrazed 33.2 0 36.9 14 37.2 35
Paros 1 16 Ungrazed 38.7 0 43.1 14 43.9 35
Paros 1 17 Ungrazed 36.4 0 43.3 14 42.9 35
Paros 1 18 Ungrazed 33.1 0 34.9 14 33.4 35
Paros 1 19 Ungrazed 37.7 0 41 14 40.3 35
Paros 1 20 Ungrazed 35.8 0 40 14 39.2 35
Paros 1 21 Ungrazed 31.8 0 35.8 14 33.6 35
Paros 1 22 Ungrazed 39.5 0 41.8 14 34.2 35
Paros 1 Average Ungrazed 35.2 0 39.3 14 40.2 35
Paros 2 1 Ungrazed 34.4 0 38.3 17 41.8 35
Paros 2 2 Ungrazed 29.2 0 31.5 17 37.2 35
Paros 2 3 Ungrazed 32.1 0 36.8 17 30.2 35
Paros 2 Average Ungrazed 31.9 0 35.5 17 36.4 35

33
Appendix F
Summary data for the surveys conducted with beekeepers on Naxos and Paros.
Beekeeper Island
Number
of Hives
Annual Honey
Production (kg)
Annual
Income from
Honey (€)
Annual Food and
Drug Cost (€)
Drug
Cost (€)
Duration
of Feeding
(months)
Feed
Weight (kg)
Feed
Cost (€)
Grazing
Level
Labor
Hours
(monthly)
Labor
Cost
(monthly)
Food, Drug, and
Labor Cost
(monthly)
Average
Colony Loss
Rate
Annual
Profits
P1 Paros 40 10 160 12.50 2.50 5 0 10.00 1.5 5.25 26.25 38.75 7.88 121.25
P2 Paros 60 5 80 7.00 4.00 3 2 3.00 0 4 20.00 27.00 7.88 53.00
P3 Paros 70 8 128 8.00 2.00 6 0 6.00 1 2.5 12.50 20.50 7.88 107.50
P4 Paros 80 10 160 9.80 3.50 1 7 6.30 4 1.67 8.35 18.15 7.88 141.85
P5 Paros 35 5 80 5.50 1.50 2 0 4.00 .5 5 25.00 30.50 7.88 49.50
P6 Paros 70 10 160 3.50 3.00 2 0 .50 5 3.9 19.50 23.00 7.88 137.00
P7 Paros 50 5 86 8.00 4.00 0 3 4.00 3 6 30.00 38.00 7.88 48.40
P8 Paros 100 7 112 18.00 .00 7 0 18.00 2 5.5 27.50 45.50 7.88 66.50
P9 Paros 200 7 112 30.67 .67 5 0 30.00 4 6.25 31.25 61.92 7.88 50.08
P10 Paros 20 15 240 10.50 .50 6 0 10.00 1 6.86 34.30 44.80 7.88 195.20
P11 Paros 100 10 160 10.00 .00 5 0 10.00 1 1.46 7.30 17.30 7.88 142.70
P12 Paros 20 15 240 8.50 2.50 4 8 6.00 0 5 25.00 33.50 7.88 206.50
S1 Naxos 200 10 160 13.50 6.00 6 6 7.50 9 3.46 17.28 30.78 26.19 129.22
S2 Naxos 15 15 240 30.00 5.00 8 20 25.00 8 5 25.00 55.00 26.19 185.00
S3 Naxos 15 15 240 30.00 5.00 8 20 25.00 8 2.7 13.50 43.50 26.19 196.50
S4 Naxos 40 8 128 31.00 6.00 8 20 25.00 8 2.5 12.50 43.50 26.19 84.50
S5 Naxos 25 0 0 20.00 15.00 3 4 5.00 4 6 30.00 50.00 26.19 -50.00
S6 Naxos 15 10 160 7.00 4.00 3 3 3.00 10 15 75.00 82.00 26.19 78.00

1