Embed Size (px)
Citation preview

Research Article
Effects of Livestock Grazing on NestingSage-Grouse in Central Montana
JOSEPH T. SMITH ,1 Wildlife Biology Program, University of Montana, 32 Campus Drive, Missoula, MT 59812, USA
JASON D. TACK, Habitat and Population Evaluation Team, U.S. Fish and Wildlife Service, 32 Campus Drive, Missoula, MT 59812, USA
LORELLE I. BERKELEY, Montana Department of Fish, Wildlife, and Parks, Helena, MT 59620, USA
MARK SZCZYPINSKI, Montana Department of Fish, Wildlife, and Parks, Roundup, MT 59072, USA
DAVID E. NAUGLE, Wildlife Biology Program, University of Montana, 32 Campus Drive, Missoula, MT 59812, USA
ABSTRACT Grazing by domestic livestock is ubiquitous in the sagebrush (Artemisia spp.) biome of westernNorth America. Widespread, long-term population declines in greater sage-grouse (Centrocercusurophasianus) have elicited concern about negative effects of livestock grazing on sage-grouse populations.Hypothesized relationships, mostly untested, between livestock and sage-grouse nesting ecology have playeda prominent role in shaping public land livestock grazing policy and broader discussions about managementof grazing in sagebrush ecosystems. We tested predictions arising from several commonly hypothesizedmechanisms by which livestock may affect nesting habitat quality for sage-grouse in a grazed landscape incentral Montana, USA. We employed Bayesian variable selection methods to identify factors related to bothnest site selection and nest success, focusing on indices of livestock use at local and pasture scales andincluding other factors known to influence nesting ecology such as anthropogenic features and weather. Inspite of some evidence nest survival was positively associated with senesced vegetation height, evidence foreffects of livestock presence and indices of local livestock use on nest site selection and survival was equivocalat best. In contrast, we found strong evidence that females selected nest sites based on relatively static featuressuch as sagebrush cover and distance from gravel and paved roads, whereas nest failure was driven primarily byextended periods of heavy precipitation. Management of sage-grouse nesting habitat in this region shouldfocus on conserving areas of adequate shrub cover and preventing further fragmentation by roads. � 2018The Wildlife Society.
KEYWORDS Centrocercus urophasianus, greater sage-grouse, habitat selection, livestock, nest survival, northern GreatPlains, roads, weather.
Greater sage-grouse (Centrocercus urophasianus), ground-nesting sagebrush (Artemisia spp.)-obligate birds of thewestern United States and Canada, have declined inabundance since population surveys began in the mid-20th century (Connelly and Braun 1997, Schroeder et al.2004). Historical and ongoing loss and fragmentation ofsagebrush-dominated landscapes from conifer encroach-ment, invasive annual grasses and fire, sagebrush eradication,cropland conversion, urbanization, and infrastructure arelargely responsible for reducing the occupied range by nearly50% (Knick et al. 2003, Schroeder et al. 2004, Aldridge et al.2008,Miller et al. 2011,Wisdom et al. 2011). However, evenpopulations in relatively intact landscapes have declined(Nielson et al. 2015, Edmunds et al. 2017), suggestingfactors such as disease and fine-scale habitat degradation maystill pose widespread threats. Though sparsely populated by
humans, sage-grouse habitats nonetheless contain economi-cally important resources including renewable and non-renewable energy sources and livestock forage. Identifyingcauses of reduced reproduction or survival will help managersimplement steps to reverse population declines and obviatethe need for protections under the Endangered Species Actthat could trigger broad restrictions on land use.Domestic livestock grazing occurs throughout the range of
sage-grouse and has been suggested as a potential contributorto declines (Connelly and Braun 1997, Monroe et al. 2017).Historically, poorly managed livestock grazing contributedto widespread changes in sagebrush vegetation communitieswith negative implications for sage-grouse habitat quality,including spread of exotic annual grasses, decreased perennialgrass cover, and increased dominance of shrubs (Mack 1981,Chambers et al. 2007, Boyd et al. 2014). However, greaterunderstanding of rangeland ecology in conjunction withenvironmental laws guiding administration of public landsgrazing have improved range condition throughout thewestern United States (Holechek 2011), and evidencesuggests complete removal of grazing is unlikely to reverse
Received: 19 December 2017; Accepted: 20 April 2018
1E-mail: [email protected]
The Journal of Wildlife Management; DOI: 10.1002/jwmg.21500
Smith et al. � Livestock Grazing and Nesting Sage-Grouse 1

legacies of historical overuse (West et al. 1984; Manier andHobbs 2006; Davies et al. 2009, 2016). Thus, relevantdiscussions of contemporary effects of livestock grazing onsage-grouse focus on shorter-term impacts of herbivory andpresence of grazing animals on sage-grouse behavior andvital rates. For example, positive associations between theheight of grass surrounding the nest and nest success haveindirectly implicated livestock grazing as a potential cause ofincreased nest predation (Gregg et al. 1994, Connelly et al.2000, Doherty et al. 2014). Further, it has been suggestedthat the presence of livestock near nests may increase nestabandonment (Rasmussen and Griner 1938, Patterson 1952,Coates et al. 2008) and that presence of cattle attractscommon ravens (Corvus corax), a major nest predator of sage-grouse, and may thereby increase nest predation (Coateset al. 2016).However, few studies have directly tested for links between
grazing and sage-grouse demographic rates (Dettenmaieret al. 2017). A recent study found a broad-scale associationbetween reported levels of early season grazing and sage-grouse population growth and suggested grazing before orduring the nesting and brood rearing seasons may reducehiding cover critical for successful reproduction (Monroeet al. 2017). Other recent studies, however, suggest theassociation between herbaceous hiding cover and nest successin sage-grouse may have been overestimated in previousanalyses, as many used methods susceptible to producingspurious inference (Gibson et al. 2016, McConnell et al.2017, Smith et al. 2018b). Others have found that forageutilization levels far beyond what is generally observed insagebrush ecosystems would be required to substantiallyreduce hiding cover available to birds nesting beneath shrubs(France et al. 2008). Thus, additional tests for effects oflivestock grazing on nest success at meaningful scales areneeded to inform management.We studied sage-grouse nests in a grazed landscape in
central Montana, USA, to test for effects of livestock grazingon nest success, a key demographic rate for populationgrowth (Taylor et al. 2012) that is the focus of severalhypothesized relationships between livestock grazing andsage-grouse demography (Beck and Mitchell 2000). Ourobjectives were to quantify evidence for the followinghypotheses: livestock use is negatively associated with nestsite selection, herbaceous vegetation height and cover ispositively associated with nest site selection and nest success,and livestock use within pastures or in close proximity tonests during the nesting season is negatively associated withnest success. We also tested for effects of anthropogenicdisturbance, primarily roads and cropland in our study area,and weather to facilitate comparison of effect sizes amonggrazing variables and other factors related to sage-grousenesting ecology.
STUDY AREAOur study area in central Montana (46.4488N, 108.5438W,�3,500 km2; Fig. 1) is characterized by rolling topographyand elevations ranging from 975m to 1,250m. Climate inthe region was cold semi-arid, with average maximum daily
temperature in Roundup, Montana (1981–2010) rangingfrom 2.88C in December to 30.88C in July and annualprecipitation averaging 359mm (National Centers forEnvironmental Information 2017). Annual precipitationduring the study ranged from 265mm in 2012 to 485mm in2014 (Fig. S1, available online in Supporting Information).Vegetation was characterized by Wyoming big sagebrush(Artemisia tridentata wyomingensis) and silver sagebrush (A.cana) co-dominant with a mix of rhizomatous and caespitoseperennial grasses. Dominant grazers included domestic cattle(Bos taurus) and sheep (Ovis aries), pronghorn (Antilocapraamericana), desert cottontails (Sylvilagus audubonii), white-tailed jackrabbits (Lepus townsendii), meadow voles (Microtuspennsylvanicus), and grasshoppers (order Orthoptera). Com-mon predators of sage-grouse or their nests included coyotes(Canis latrans), bobcats (Lynx rufus), badgers (Taxidea taxus),red fox (Vulpes vulpes), and common ravens. OtherGalliformes included sharp-tailed grouse (Tympanuchusphasianellus) and grey partridge (Perdix perdix). The studyarea encompassed 30 sage-grouse leks with >1 displayingmale recorded in �1 year between 2011 and 2016 andspanned portions of 2 state-designated core areas of highsage-grouse abundance. Median high male counts on arealeks ranged from 7 in 2014 to 25 in 2016.Primary land uses in the study area were livestock grazing
and dryland farming. Rotational grazing systems wereimplemented on 10 area ranches during the study (detailsin Smith et al. 2018a). These grazing systems, administeredthrough the United States Department of Agriculture’sNatural Resources Conservation Service (NRCS), weredesigned to increase hiding cover and food availability forsage-grouse and adhered to a set of common standards.Stocking rates were set to achieve <50% utilization ofcurrent year’s growth of key forage plants, duration ofgrazing was limited to <45 days, and season of use waschanged each year such that there was at least 20 daysbetween the current year’s turn-in and the previous year’sturn-out dates if season of use was delayed or between thecurrent year’s turn-out and the previous year’s turn-in dates ifseason of use was advanced. Most participating rancheselected to rest �20% of identified sage-grouse nestinghabitat on an annually rotating basis. Rested pastures wereleft ungrazed for 2 full nesting seasons. Non-participatingranches used a variety of management strategies but ingeneral were managed less intensively (i.e., with a season-long grazing strategy or slower rotations through largerpastures, usually without annual changes in season of use).Two ranches in the study area grazed cattle and sheep and therest grazed cattle exclusively; our study is therefore mostrelevant to cattle grazing. Ten percent of the study area wasin cropland. The data presented here were collected fromApril 2011 to August 2016.
METHODS
Field MethodsWe captured female sage-grouse using spotlights and hoopnetting from all-terrain vehicles (Wakkinen et al. 1992) from
2 The Journal of Wildlife Management � 9999()

March to April in 2011–2016 and August to September in2012–2015 and affixed 25-g necklace-style very highfrequency (VHF) transmitters (Advanced Telemetry Sys-tems, Isanti, MN, USA) to captured females. We monitoredpre-nesting females at least twice weekly until they began tomake localized movements indicative of nesting behavior, atwhich point we reduced our monitoring interval to daily ifpossible. We attempted to locate nests from a distance of�10m without flushing females. We marked nests withinconspicuous natural materials at a distance of approxi-mately 10m and thereafter monitored nests every 2–3 daysfrom a distance of �100m. We classified nests as successful(�1 hatched egg with membrane detached) or failed (all eggsdestroyed or missing) once the female moved away from thenest. All animal handling was approved under University ofMontana’s Institutional Animal Care and Use Committee(Protocol 011-14DNWB-031914).We returned to nests following cessation of incubation
activity to measure vegetation, grazing, and anthropogenicdisturbance attributes. We made identical measurements atlocations randomly generated in a geographic informationsystem (GIS) to quantify resources available to nestingfemales. In drawing these samples, we imposed severalcriteria relevant to the behavior of female sage-grouseselecting a nest site (third and fourth order; Johnson 1980).We generated available points within 6.4 km of leks fromwhich we captured females because other studies haveshown the large majority of nests are placed within thisdistance (Holloran and Anderson 2005, Coates et al. 2013).We further constrained available points to areas with �5%visually-estimated sagebrush canopy cover at the plot scale
(30m) because the importance of sagebrush as a nest substrateand sagebrush cover surrounding nests have been firmlyestablished by numerous studies of nest site selection in sage-grouse (Hagen et al. 2007). At points meeting these criteria,we selected the nearest sagebrush shrub �30 cm in height todesignate the nest shrub (Connelly et al. 2000).We sampled 2available points for each nest.
Model CovariatesWe examined covariates falling into 4 categories: local-scalevegetation surrounding the nest, livestock grazing variables,anthropogenic disturbance, and weather (Table 1). Wescreened candidate variables for collinearity using conditionindices (Belsley et al. 1980). If we observed a condition index>30, we examined the variables implicated by high (>0.5)variance decomposition proportions and removed them oneat a time, retaining the variable with the simplest biologicalinterpretation, until all condition indices were <30 (Belsleyet al. 1980). Because one of our primary goals was to elucidatethe relative effect sizes of variables across categories, we scaledand centered all variables to 0 mean and unit variance beforefitting models.Local-scale vegetation.—We established vegetation plots at
nests and available points with 2, perpendicular 30-m tapesintersecting at the nest shrub. We estimated canopy cover ofsagebrush and other shrubs with the line intercept methodalong both tapes (Canfield 1941, Wambolt et al. 2006). Weestimated cover of understory vegetation, height of live andsenesced grasses, and height of shrubs with measurementstaken at 8 points located 3m and 6m from the plot center ineach cardinal direction. We estimated understory cover and
Figure 1. Study area in centralMontana, USA. Greater sage-grouse core areas are indicated by gray polygons and leks are indicated by black circles, with size ofcircles proportional to the highest male count recorded from 2011–2016. Inset map shows location of study area (star) within the current range of sage-grouse(gray shading), and isopleths indicate the average proportion of annual rainfall occurring between 1 April and 31 June.
Smith et al. � Livestock Grazing and Nesting Sage-Grouse 3

height at this scale because previous research foundrelationships between herbaceous vegetation structure andnest site selection and success were strongest at a similar scale(7.5m; Aldridge 2005). At each of these 8 points, we used a20� 50-cm quadrat (Daubenmire 1959) to estimate absolutepercent cover of understory herbaceous vegetation, litter, andbare ground. We made absolute cover estimates beneath theshrub canopy and included only the uppermost canopy whenoverlapping canopies occurred. We recorded the maximumvertical height, excluding inflorescences, of undisturbed liveand senesced material on the nearest grass plant, and thetallest live portion, excluding inflorescences, of the nearestshrub. A single lead observer trained all technicians toestimate cover each year and periodically checked throughoutthe season for consistency (i.e., individual estimates within�5% for all cover classes). We estimated visual obstructionwith a Robel pole (Robel et al. 1970) placed in the nest bowland at points 1m, 3m, and 5m from the nest shrub in eachcardinal direction, taking readings from 4m at a height of1m above the ground facing toward the nest bowl (modifiedfrom Martin et al. 1997). We averaged the 4 readings fromeach direction at the nest bowl to quantify visual obstructionat the nest, and averaged the 12 readings 1–5m from the nestto quantify visual obstruction at the plot. We measured the
maximum height (h), maximum width (m), and greatestwidth perpendicular to the axis of the maximum width (p) ofthe nest shrub to calculate nest shrub volume using theformula for the volume of a half-ellipsoid (23p
m2p2 h). When
the nest was located beneath >1 shrub with a contiguouscanopy, we treated the shrubs as a single shrub formeasurement purposes.Livestock grazing.—To quantify intensity of livestock
presence and grazing during the nesting season, we countedcattle dung pats and estimated the proportion of herbaceousplants grazed within a 15-m radius of each nest shrub oravailable point. Density of dung pats may be indicative ofpatterns of forage utilization and vegetation structure in areasgrazed by livestock (Bailey and Welling 1999, Roche et al.2012) but also contains information about livestock presenceindependent of grazing. We recorded the total number ofdung pats and categorized them as current year or previousyears, which we distinguished by the level of degradation andoxidation. We used dung pats from the current year to indexlocal use by livestock during the current nesting seasonbecause livestock turn-out dates in our study area coincidedclosely with the beginning of the nesting season. We usedcounts of dung pats from previous years to index intensity ofprevious years’ livestock use, which we used as a candidate
Table 1. Candidate variables for models relating local vegetation, livestock grazing, anthropogenic disturbance, and weather to nest site selection and nestsurvival of greater sage-grouse in central Montana, USA, 2011–2016.
Category Variable Sourcea Selectionb Survivalb
Local vegetation Nest shrub volume 1 yes yesVisual obstruction at the nest shrub 1 yes yesVisual obstruction at the plot 1 yes yesShrub cover 1 yes yesHerbaceous cover 1 yesc yesd
Shrub height 1 yesc yesd
Live grass height 1 yesc yesd
Senesced grass height 1 yes yesGrazing Cow pat density (previous grazing seasons) 1 yes no
Cow pat density (current grazing season) 1 yes yesProportion of plants grazed 1 yes yesLivestock presence in pasture 1 no yes
Anthropogenic disturbance Distance to major road 2 yes yesln(distance to major road) 2 yes yesDistance to 2-track 1,2 yes yesln(distance to 2-track) 1,2 yes yesDistance to cropland 3 yes yesln(distance to cropland) 3 yes yesCumulative disturbance footprint 4 yes yes
Weather Precipitation (daily) 5 no yesPrecipitation (previous day) 5 no yesPrecipitation (2-day sum) 5 no yesPrecipitation (3-day sum) 5 no yesPrecipitation (4-day sum) 5 no yesPrecipitation (5-day sum) 5 no yesMin temperature (daily) 5 no yesMax temperature (daily) 5 no yes
a Sources: 1¼field measurement; 2¼U.S. Census Bureau Tiger/LINE shapefile (https://www.census.gov/geo/maps-data/data/tiger.html); 3¼U.S.Department of Agriculture National Agricultural Statistics Service Cropland Data Layer (USDA-NASS 2016); 4¼U.S. Geological Survey humanfootprint (Carr et al. 2017); 5¼DAYMET gridded meteorological data (Thornton et al. 2014).
b Was variable a candidate in nest site selection or survival analysis?c Herbaceous cover, live grass heights, and shrub heights were corrected to year-specific median nest initiation date for selection analysis.d Herbaceous cover, live grass heights, and shrub heights were corrected to expected hatch date for survival analysis.
4 The Journal of Wildlife Management � 9999()

variable in nest site selection models to test whether femalesavoided signs of heavy livestock use when selecting a nestsite. Cattle dung pats may persist in arid ecosystems for up to6 years (Lussenhop et al. 1982); therefore, previous years’dung pat density represented a relative index of useintegrated over the past several grazing seasons (Milchunaset al. 1989). Because dung pats reflect presence of livestockbut not necessarily grazing, we also recorded the number ofplants exhibiting evidence of grazing during the current yearfrom a sample of 100 randomly selected herbaceous plants,25 from each quadrant of the plot. Finally, we obtainedgrazing records from most landowners to determine whetherlivestock had been present in the pasture at any time duringnesting, and observers recorded livestock presence or absencein the pasture at each visit to the nest. Where grazing recordswere lacking or disagreed with field observations, we usedfield observations.Anthropogenic disturbance.—At nests and available points,
field technicians recorded distance to the nearest visible2-track (primitive dirt) road. We used a GIS coverage toestimate distance from each nest or available point to thenearest major (gravel or paved) road and to the nearest2-track road when field estimates were unavailable. Weestimated distance to the nearest crop field, excludingalfalfa, using the Cropland Data Layer (U.S. Departmentof Agriculture National Agricultural Statistics Service[USDA-NASS] 2016) and parcel boundaries from theMontana Cadastral Mapping Project (Montana StateLibrary 2016). We first built a binary cropland rasterindicating all 30-m cells classified as cropland in >1 yearbetween 2008 and 2016. We then determined the area ofeach parcel classified as cropland and masked out pixels fromthe binary cropland raster that were located in parcels with<4 ha of cropland. This eliminated small fragments ofcropland that likely arose frommisclassification of other landcover classes in the Cropland Data Layer.We then estimatedthe distance from each nest or available point to the nearestcropland pixel in the cleaned cropland raster. Finally, we useda disturbance footprint raster (Carr et al. 2017) to estimatethe cumulative amount of anthropogenic disturbance in thelandscape surrounding each nest or available point. We tookthe mean percent disturbed from all 90-m pixels within 1 kmof the nest or available point.Weather.—We estimated daily weather conditions experi-
enced by nesting females using the DAYMET daily griddedmeteorological dataset (Thornton et al. 2014). For each nest-day, we extracted total precipitation, minimum temperature,and maximum temperature from the DAYMET dataset,estimating values at nest locations using bilinear interpola-tion from the 1-km resolution rasters. We subsequently usedthese daily precipitation estimates to derive the previousday’s precipitation and temporal moving window variablesindicating the total precipitation that fell at a given locationin the preceding 2, 3, 4, or 5 days, inclusive.
Model Selection and FittingWe used Bayesian methods to implement a 2-step modelselection and fitting procedure, first selecting from among
candidate variables within categories (local vegetation,grazing, anthropogenic features, and weather; Table 1),then bringing supported variables across categories togetherto assess their support and estimate effect sizes. In both steps,regression coefficients bj for each variable j were the productof binary indicator variables wj and continuous effect sizeparameters uj (Kuo and Mallick 1997, O’Hara and Sillanp€a€a2009). We used the joint posterior distribution of the vectorw to identify the model with the greatest posteriorprobability—akin to a top model using an informationcriterion (e.g., Akaike’s Information Criterion; Akaike1973). Specifically, we used the vector w appearing mostoften acrossMarkov chainMonte Carlo (MCMC) iterationsto identify variables in the top model (Converse et al. 2013).We included variables in the top model from each category inthe final, combined-category model fitting step. We placedBernoulli(0.5) prior distributions on indicator variables,representing no prior information about individual variableimportance (O’Hara and Sillanp€a€a 2009). Lastly, wequantified support for variables in the combined-categorymodel using Bayes factors (BF), where we calculated BFj
using the prior inclusion probability (0.5) and posterior mean
inclusion probability (�wposteriorj ) as BFj ¼ �wposterior
j = 1��wposteriorjð Þ
0:5= 1�0:5ð Þ(Smith et al. 2011). The BF is therefore a measure of theratio of posterior model weight to prior model weight. A BFof 1 indicates that the data provided no evidence for an effectof a variable, a BF �3.2 is indicative of a variable withsubstantial support, and a BF >10 indicates strong support(Kass and Raftery 1995). We report Bayes factors and 95%credible intervals (CRI) for all model parameters in thecombined-category models, conditional on the top model.We scaled effect size priors according to the number of
parameters in the model at each MCMC iteration such thatwe held total model uncertainty constant across candidatemodels. Thus, priors for all ujwere distributed Normal(0, (V/M)�1) where M was the number of non-zero indicatorvariables and V�Gamma(3.29,7.8) such that the marginalprior distributions on nest-site selection probability or dailynest survival probability were approximately Uniform[0,1](Link and Barker 2006, Smith et al. 2011).We fit models using JAGS (version 4.2.0, mcmc-jags.
sourceforge.net, accessed 19 Feb 2016) implemented via therunjags package (Denwood 2016) in program R (version3.3.0, www.r-project.org, accessed 3May 2016). For the firststep, we identified top models within each category from100,000 samples from 2 independent chains after discardingthe first 20,000 samples from each chain. We based ourinference from the combined-category model on a total of400,000 samples from 2 independent chains after discardingthe first 50,000 samples from each chain. We visuallyassessed convergence and mixing and calculated Gelman-Rubin convergence statistics (Gelman and Rubin 1992,Brooks and Gelman 1997) for all parameters.
Accounting for PhenologyRecently, the importance of timing of vegetation measure-ment at nests has received considerable attention (Gibson
Smith et al. � Livestock Grazing and Nesting Sage-Grouse 5

et al. 2016,McConnell et al. 2017, Smith et al. 2018b). From2011 to 2015, we sampled vegetation soon after wedetermined nest fate (i.e., hatch or failure), which induceda significant bias in timing of vegetation sampling betweensuccessful and failed nests. In 2016, we changed our fieldprotocol to sample vegetation at expected hatch dateregardless of nest fate. Moreover, timing of vegetationmeasurement at available points was typically later, onaverage, than at nests. We therefore used an approachfrom Gibson et al. (2016) to correct for timing-induceddifferences in vegetation that could produce misleadinginference regarding either selection for or fitness con-sequences of vegetation structure. Specifically, we fit linearmodels relating all measured vegetation variables to ordinaldate of measurement to identify variables that changedthroughout the nesting season because of phenology. Forvariables displaying a significant trend (P< 0.05 in �1 yr),we used a fitted linear mixed effects model, with randomintercepts and slopes grouped by year to account for annualvariation in phenology, to estimate covariate values atexpected hatch date (survival analysis) or median ordinal dateof nest initiation for first nests (selection analysis) as inGibson et al. (2016). We used these phenologicallystandardized covariate values in model fitting.
Nest Site Selection ModelWe fit used-available resource selection function (RSF;Manly et al. 2002, Johnson et al. 2006) models using thelogit-link to relate measured covariates to used (y¼ 1) oravailable sites (y¼ 0).We included only first nests in the usedsample because birds may alter nest site selection followingnest predation (Marzluff 1988, Chalfoun and Martin 2010).We enforced separate intercepts b0,k for each breeding seasonk to account for varying prevalence of used nests across yearsbecause prevalence was a design parameter rather than arandom variable. For each site, i:
yi � Benoulli pið Þ
and we modeled pi as a function of P covariates xi,j for j¼ 1,2, . . . P:
logit pið Þ ¼ b0;k i½ � þXPj¼1
bj xi;j þ dr i½ �
dr � N 0;srð Þ
where bj¼wjuj and dr are ranch-level random effects toaccount for unmeasured factors affecting suitability oraccessibility of ranches for nesting. We placed a flatUniform[0,50] prior on sr.
Nest Survival ModelNest encounter histories consisted of observed nest states yfor each day t of observation, where yi,t¼ 1 if nest i wasobserved alive on day t, yi,t¼ 0 if nest i was observed to havefailed (female absent and some or all eggs destroyed), andyi,t¼NA on days when nest state was not observed.Beginning on the first day after the nest was detected,
yi;t � Bernoulli yi;t�1Si;t� �
:
We modeled daily survival probability Si,t as a function ofP nest- and time-varying covariates using a logit link:
logit Si;t� � ¼ b0 þ
XPj¼1
bj xi;j;t þ ak i½ � þ dr i½ �
ak � N 0;skð Þ
dr � N 0;srð Þ
where bj¼wjuj and ak and dr are year- and ranch-levelrandom effects included to account for unmeasured temporaland spatial variation in factors associated with nest predationrisk. We placed flat Uniform[0,50] priors on sk and sr. Wepreviously determined that survival did not vary with nestage or date in this dataset (Smith et al. 2018a); therefore, wedid not consider these variables. We derived an estimateof annual nest success by exponentiating estimated dailysurvival rate from the full model by 37, the typical length ofexposure of sage-grouse nests during laying and incubation(Schroeder et al. 1999).
Assessing Model FitWe performed posterior predictive checks (Gelman et al.1996, 2014) of our final nest site selection and nest survivalmodels to determine whether the models could faithfullyreproduce our observed data. Also called Bayesian P-values,posterior predictive checks are essentially goodness-of-fittests for Bayesian models that compare an attribute of theobserved data to that of data generated by the model. Weused the model deviance, D, as a test statistic to assess fit ofthe nest site selection model (Broms et al. 2016). Wecalculated the proportion of MCMC samples (s) for whichthe observed deviance,
Ds ¼ �2XNi¼1
logðyijw; uÞ
was greater than the deviance calculated from new datapredicted by the model (
�y):
�Ds ¼ �2
XNi¼1
logð �yi jw; uÞ
We used the number of hatched nests to assess fit of thenest survival model. Drawing from the joint posteriordistribution, we calculated daily survival probabilities Si,t foreach observed nest i on day t from the first date of observationto 27 days after the estimated incubation initiation date,reflecting the typical incubation period. We predicted theoutcome, hatchi, of each nest by taking successive Bernoullidraws of nest state yi,t from Si,t until yi,t¼ 0 (failed nest) oruntil t¼ estimated hatch date (hatched nest). We thencalculated the proportion of MCMC samples for which theobserved number of hatched nests was greater than thepredicted number. Values near 0.5 indicate the model
6 The Journal of Wildlife Management � 9999()

generated data similar to our observations, whereas values<0.05 or >0.95 suggest a poor fit (Broms et al. 2016).
RESULTSWe located and determined the fate of 501 nests from 256captured females from 2011–2016.We removed 4 nests fromthe survival analysis because of early, likely observer-inducedabandonment (Gibson et al. 2015) and removed 2 nestsbecause we found them after predation had occurred. Of theremaining 495 nests, 2 nests (0.4%) were abandonedfollowing predation of the female while off the nest, 10nests (2.0%) were abandoned for unknown reasons, 229(46.3%) hatched at least 1 egg and were classified assuccessful, and predators destroyed 254 nests (51.3%).Median clutch size was 8 eggs for first nest attempts and7 for second and third nest attempts.When fitting local-scalevegetation models, we excluded 2011 data because ofextremely delayed vegetation measurement.
Nest Site SelectionAfter excluding renests, we used 353 nests and 710 availablepoints for the nest site selection analysis (see Table S3,available online in Supporting Information for means andSDs of variables). Live grass height, herbaceous cover, andshrub height displayed significant temporal trends in �1year, so we made corrections to these variables before modelfitting. All condition indices were <5, indicating multi-collinearity was not problematic. Nest shrub volume, visualobstruction at the nest, shrub cover, and live grass heightappeared in the top local vegetation model (Table S1,available online in Supporting Information. The top grazingmodel contained only previous years’ cow pat density. Thetop anthropogenic disturbance model contained ln(distanceto major road), and ln(distance to 2-track). The topcombined-category model included all variables from topcategorical models, but Bayes factors indicated mixedsupport (Table 2). Females selected larger nest shrubswith less visual obstruction, surrounded by greater shrub
cover, farther from major roads but closer to 2-track roadsrelative to available points (BF> 3.2; Table 2 and Fig. 2).Avoidance of high densities of previous years’ cow patsreceived weak support (BF¼ 2.5; Fig. 2), and evidence forselection for greater live grass height was equivocal(BF¼ 1.4). The posterior predictive check of the top nestsite selection model indicated good model fit (P¼ 0.52).
Nest SurvivalAll condition indices were <5, so we did not remove anycandidate variables before model fitting. The top localvegetation model contained effects of nest shrub volume andsenesced grass height. The top anthropogenic disturbancemodel contained only ln(distance to major road). The topgrazing model contained only the proportion of plantsgrazed. The top weather model included total rainfall over a5-day period. Delayed measurement of vegetation in 2011was not a major concern because the only herbaceousvegetation covariate in the local vegetation model wassenesced grass height, which should be largely unaffected byphenology. Thus, we used all nests (n¼ 495) to fit thecombined-category model.We included visual obstruction atthe nest shrub because it appeared in 2 local vegetationmodels with model weights nearly equal to the top model(Table S2, available online in Supporting Information) andhad a mean posterior inclusion probability >0.5. The topcombined-category model included nest shrub volume,senesced grass height, proportion of plants grazed, ln(distance to major road), and total rainfall over a 5-dayperiod. Daily nest survival was positively associated withgreater distance from major roads and negatively associatedwith precipitation over a 5-day period, whereas evidence forthe effect of taller senesced grass, nest shrub volume, andproportion of plants grazed was weak (BF< 3.2; Table 3).Variation in daily survival rates among years (sk¼ 0.34, 95%CRI¼ 0.11–1.06) was approximately 5 times greater thanvariation among ranches (sr¼ 0.07, 95% CRI¼ 0.00–0.24).Holding all covariates at their mean value, mean daily
Table 2. Coefficient estimates and Bayes factors from a logistic regression model describing effects of local vegetation, livestock grazing, and anthropogenicdisturbance on nest site selection of greater sage-grouse in central Montana, USA, 2011–2016.
Posterior distributionb
Category Variable BFa Lower 95% CRI Median Upper 95% CRI
Intercept[2012] �1.45 �1.01 �0.57Intercept[2013] �0.84 �0.36 0.12Intercept[2014] �1.32 �0.85 �0.40Intercept[2015] �1.58 �1.12 �0.68Intercept[2016] �1.00 �0.54 �0.08sr (ranch-level variation) 0.44 0.89 1.51
Local vegetation Nest shrub volume 18,180.8 0.25 0.41 0.58Visual obstruction at the nest shrub 4.6 �0.36 �0.20 �0.04Shrub cover >200,000 0.30 0.44 0.60Live grass height 1.4 �0.01 0.16 0.32
Grazing Cow pat density (previous years) 2.5 �0.33 �0.17 �0.02Anthropogenic disturbance ln(distance to major road) 778.7 0.16 0.33 0.50
ln(distance to 2-track) 56.3 �0.38 �0.24 �0.10
a BF¼Bayes factor; BF values with an asterisk indicate variables appearing in the top model.b Median, lower, and upper credible intervals (CRI) are conditional on the top model.
Smith et al. � Livestock Grazing and Nesting Sage-Grouse 7

survival rate of nests was 0.971 (95% CRI¼ 0.953–0.979).Nest success, assuming 37 days of exposure (Schroeder et al.1999), was 33.3% (95% CRI¼ 16.7–46.1%). When weremoved the anomalous 2011 data (Fig. S1) from the meanof the precipitation covariate, estimated daily survival rateand nest success were 0.972 (95% CRI¼ 0.955–0.980)and 34.6% (95% CRI¼ 18.3–47.0%), respectively. The topcombined nest survival model had a Bayesian P-value of 0.46,indicating good model fit.
DISCUSSIONWe found little evidence for the hypothesized indirect anddirect effects of livestock grazing that were the primary focus
of our study. Considered alongside our finding that spatialvariation in nest survival among ranches was minor comparedto annual variation (Table 3 and see Smith et al. 2018a),variation in grazing management in our study area appears tohave only minor effects on sage-grouse nesting ecology.Rather, structural characteristics of the shrub community andanthropogenic features were the primary drivers of nest siteselection, whereas periods of prolonged heavy rainfall andproximity to gravel and paved roads had the largest effect ondaily nest survival.We found little evidence that variation in livestock grazing
or its effects on herbaceous vegetation was associated withnest site selection. There was weak support for avoidance of
Figure 2. Predicted relative probability of use and 95% credible intervals among factors influencing nest site selection in greater sage-grouse in centralMontana,USA, 2011–2016. Histograms represent covariate values measured at available sites (n¼ 710).
Table 3. Coefficient estimates and Bayes factors from a logistic regression model describing effects of local vegetation, livestock grazing, anthropogenicdisturbance, and weather on daily survival rates of greater sage-grouse nests in central Montana, USA, 2011–2016.
Posterior distributionb
Category Variable BFa Lower 95% CRI Median Upper 95% CRI
Intercept 3.00 3.50 3.86sk (year-level variation) 0.11 0.34 1.06sr (ranch-level variation) 0.00 0.07 0.24
Local vegetation Nest shrub volume 1.6 �0.01 0.12 0.27Senesced grass height 2.8 �0.00 0.14 0.29Visual obstruction at the nest shrub 0.3
Grazing Proportion of plants grazed 1.6 �0.20 �0.10 0.01Weather Precipitation (5-day sum) 220.0 �0.30 �0.20 �0.09Anthropogenic disturbance ln(distance to major road) 7.9 0.03 0.16 0.28
a BF¼Bayes factor; BF values with an asterisk indicate variables appearing in the top model.b Median, lower, and upper credible intervals (CRI) are conditional on the top model.
8 The Journal of Wildlife Management � 9999()

sites with a high density of previous years’ cow pats, but theeffect size was small. Though such an association might arisethrough avoidance of areas of reduced height of senescedvegetation from previous grazing, we considered height ofsenesced grass as a candidate variable in the nest site selectionmodel and it was unsupported. Regardless of the mechanismunderlying this association, preferred sites do not appear tobe limiting; we counted zero previous years’ cow pats at 60%of available sites (Fig. 2). Furthermore, cattle likely avoidedareas characteristic of nesting habitat; cow pat counts andshrub cover were negatively correlated at available points(r¼�0.16, P< 0.001). Although selection of sites withgreater live grass height appeared in the top combinedselection model, a BF of 1.4 was well under the threshold of3 that Kass and Raftery (1995:777) consider evidentialstrength “not worth more than a bare mention.”Similarly, none of the proposed grazing variables were
strongly associated with nest success. Proportion of plantswith evidence of grazing appeared in the top combinedsurvival model, but support for the effect was equivocal(BF¼ 1.6; Table 3). Though initial model fitting withoutcorrecting for phenologically induced differences in grassheight (Gibson et al. 2016, McConnell et al. 2017) pointedto a strong, positive association between the height of grassesaround the nest and nest survival, this association brokedown once we made appropriate corrections (Smith et al.2018b). We did, however, find some support for a positiveassociation between senesced vegetation height and dailynest survival (Fig. 3). Although evidence for this associationwas weak (BF¼ 2.8), this suggests senesced herbaceousvegetation may play some role in concealing nests frompredators. A closer examination of the estimated effect sizefor this parameter may explain why we failed to detect effectsof local grazing indices in spite of this. The standarddeviation in senesced grass height among nests was 5.8 cm;thus, the estimated coefficient for senesced grass heightindicates a 1-cm increase in height was associated with a2.4% increase in the odds of daily nest survival. Given thatthe difference in senesced grass height between nests ingrazed pastures and nests in pastures without evidence ofcurrent year’s grazing was <1 cm (Fig. 4), we would notexpect grazing to measurably affect nest outcomes throughits effects on vegetation height. The apparent lack of
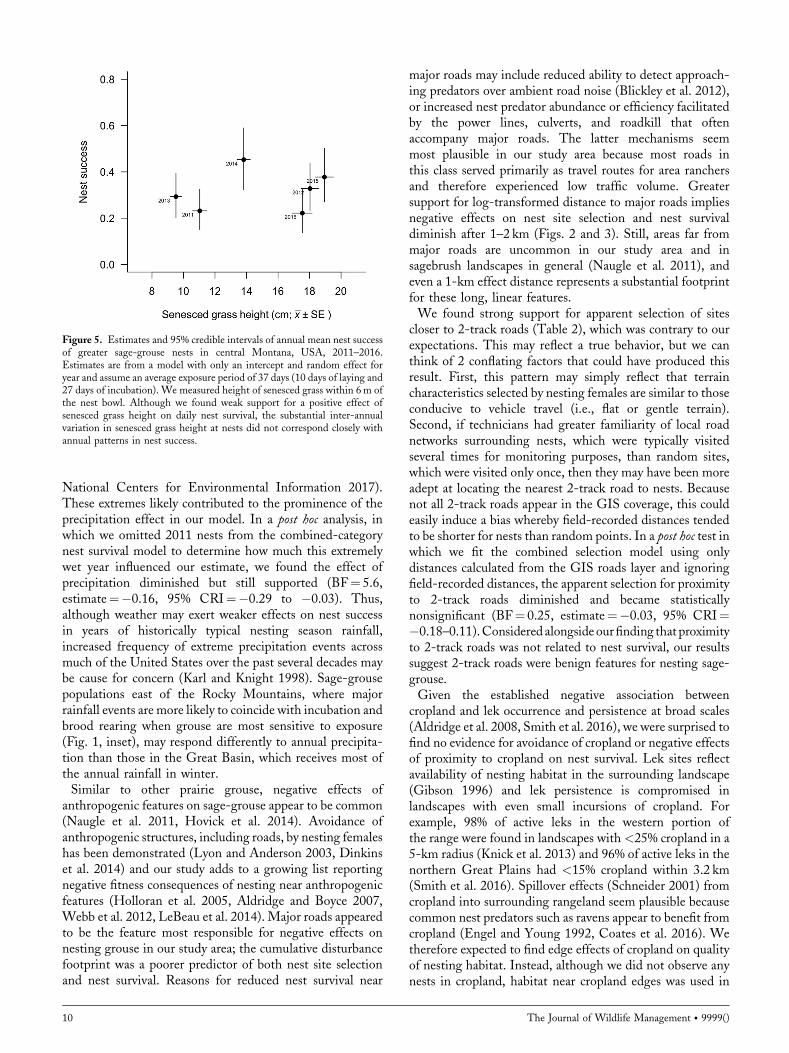
correlation between annual mean nest survival and annualmean senesced grass height at nests (Fig. 5) is furtherevidence of the biological insignificance of this effect.Overall, hypothesized links between grazing, hiding cover,and nest success were largely unsupported. Livestockgrazing, as conducted across our study area, appears to becompatible with maintaining nest success rates typical of astable population (Taylor et al. 2012). This conclusion iscorroborated by the observation that median high malecounts on area leks more than tripled during a stretch ofyears, 2014–2016, characterized by favorable weather.Though precipitation has been positively linked to
population growth in sage-grouse in the Great Basin(Blomberg et al. 2012), we found extended periods of heavyprecipitation strongly reduced nest success (Fig. 3). Ourstudy area experienced large precipitation anomalies duringthe first 2 years, with 2011 (wet) and 2012 (dry) rivaling orbreaking precipitation records dating to the 1940s (Fig. S1;
Figure 3. Predicted daily nest survival and 95% credible intervals among factors influencing daily survival rate of greater sage-grouse nests in central Montana,USA, 2011–2016. Histograms represent frequency of covariate values in the dataset.
Figure 4. Height of senesced grasses measured within 6m of greater sage-grouse nests in grazed (n¼ 273) and deferred or rested pastures (n¼ 221) incentral Montana, USA, 2011–2016. Inter-annual variation, driven primarilyby precipitation, was substantially greater than the effect of grazing.
Smith et al. � Livestock Grazing and Nesting Sage-Grouse 9
National Centers for Environmental Information 2017).These extremes likely contributed to the prominence of theprecipitation effect in our model. In a post hoc analysis, inwhich we omitted 2011 nests from the combined-categorynest survival model to determine how much this extremelywet year influenced our estimate, we found the effect ofprecipitation diminished but still supported (BF¼ 5.6,estimate¼�0.16, 95% CRI¼�0.29 to �0.03). Thus,although weather may exert weaker effects on nest successin years of historically typical nesting season rainfall,increased frequency of extreme precipitation events acrossmuch of the United States over the past several decades maybe cause for concern (Karl and Knight 1998). Sage-grousepopulations east of the Rocky Mountains, where majorrainfall events are more likely to coincide with incubation andbrood rearing when grouse are most sensitive to exposure(Fig. 1, inset), may respond differently to annual precipita-tion than those in the Great Basin, which receives most ofthe annual rainfall in winter.Similar to other prairie grouse, negative effects of
anthropogenic features on sage-grouse appear to be common(Naugle et al. 2011, Hovick et al. 2014). Avoidance ofanthropogenic structures, including roads, by nesting femaleshas been demonstrated (Lyon and Anderson 2003, Dinkinset al. 2014) and our study adds to a growing list reportingnegative fitness consequences of nesting near anthropogenicfeatures (Holloran et al. 2005, Aldridge and Boyce 2007,Webb et al. 2012, LeBeau et al. 2014). Major roads appearedto be the feature most responsible for negative effects onnesting grouse in our study area; the cumulative disturbancefootprint was a poorer predictor of both nest site selectionand nest survival. Reasons for reduced nest survival near
major roads may include reduced ability to detect approach-ing predators over ambient road noise (Blickley et al. 2012),or increased nest predator abundance or efficiency facilitatedby the power lines, culverts, and roadkill that oftenaccompany major roads. The latter mechanisms seemmost plausible in our study area because most roads inthis class served primarily as travel routes for area ranchersand therefore experienced low traffic volume. Greatersupport for log-transformed distance to major roads impliesnegative effects on nest site selection and nest survivaldiminish after 1–2 km (Figs. 2 and 3). Still, areas far frommajor roads are uncommon in our study area and insagebrush landscapes in general (Naugle et al. 2011), andeven a 1-km effect distance represents a substantial footprintfor these long, linear features.We found strong support for apparent selection of sites
closer to 2-track roads (Table 2), which was contrary to ourexpectations. This may reflect a true behavior, but we canthink of 2 conflating factors that could have produced thisresult. First, this pattern may simply reflect that terraincharacteristics selected by nesting females are similar to thoseconducive to vehicle travel (i.e., flat or gentle terrain).Second, if technicians had greater familiarity of local roadnetworks surrounding nests, which were typically visitedseveral times for monitoring purposes, than random sites,which were visited only once, then they may have been moreadept at locating the nearest 2-track road to nests. Becausenot all 2-track roads appear in the GIS coverage, this couldeasily induce a bias whereby field-recorded distances tendedto be shorter for nests than random points. In a post hoc test inwhich we fit the combined selection model using onlydistances calculated from the GIS roads layer and ignoringfield-recorded distances, the apparent selection for proximityto 2-track roads diminished and became statisticallynonsignificant (BF¼ 0.25, estimate¼�0.03, 95% CRI¼�0.18–0.11).Considered alongsideourfinding that proximityto 2-track roads was not related to nest survival, our resultssuggest 2-track roads were benign features for nesting sage-grouse.Given the established negative association between
cropland and lek occurrence and persistence at broad scales(Aldridge et al. 2008, Smith et al. 2016), we were surprised tofind no evidence for avoidance of cropland or negative effectsof proximity to cropland on nest survival. Lek sites reflectavailability of nesting habitat in the surrounding landscape(Gibson 1996) and lek persistence is compromised inlandscapes with even small incursions of cropland. Forexample, 98% of active leks in the western portion ofthe range were found in landscapes with <25% cropland in a5-km radius (Knick et al. 2013) and 96% of active leks in thenorthern Great Plains had <15% cropland within 3.2 km(Smith et al. 2016). Spillover effects (Schneider 2001) fromcropland into surrounding rangeland seem plausible becausecommon nest predators such as ravens appear to benefit fromcropland (Engel and Young 1992, Coates et al. 2016). Wetherefore expected to find edge effects of cropland on qualityof nesting habitat. Instead, although we did not observe anynests in cropland, habitat near cropland edges was used in
Figure 5. Estimates and 95% credible intervals of annual mean nest successof greater sage-grouse nests in central Montana, USA, 2011–2016.Estimates are from a model with only an intercept and random effect foryear and assume an average exposure period of 37 days (10 days of laying and27 days of incubation). We measured height of senesced grass within 6m ofthe nest bowl. Although we found weak support for a positive effect ofsenesced grass height on daily nest survival, the substantial inter-annualvariation in senesced grass height at nests did not correspond closely withannual patterns in nest success.
10 The Journal of Wildlife Management � 9999()

proportion to its availability and afforded nest success ratessimilar to interior habitat. The mechanisms responsible forthe broad-scale effect of cropland on sage-grouse distribu-tion are still poorly understood, but our findings do notsupport the hypothesis that edge effects reduce nestinghabitat quality in areas fragmented by cropland. Nonetheless,cropland conversion amounts to loss of nesting habitat,which no doubt contributes to the broad-scale sensitivity ofpopulations to cropland.
MANAGEMENT IMPLICATIONSWe found little indication of short-term negative effects oflivestock grazing, as conducted in our study area, on nestinghabitat quality. Management interventions such as rest,destocking, or delaying turnout until after the nesting seasontherefore appear unlikely to increase nest success in thisregion.We urge caution in extrapolating our findings outsidethe northern Great Plains, however, as vegetation in otherregions occupied by sage-grouse, such as the Great Basin,may respond differently to grazing. Our findings regardingthe importance of shrub cover to nesting sage-grouse alignwith other research from across the range (Hagen et al. 2007)and suggest that shrub control (e.g., to increase forageproduction or accessibility) is likely to reduce preferrednesting habitat. Among common economic activities insagebrush ecosystems, ranching is associated with the lowestdensity of anthropogenic features such as roads (Naugle et al.2011). In this region, where land is predominantly underprivate ownership and cropland conversion poses an ongoingthreat to populations (Smith et al. 2016), land uses thatmaintain intact, minimally-roaded native shrublands shouldbe encouraged to ensure the long-term conservation ofproductive nesting habitat for sage-grouse.
ACKNOWLEDGMENTSThe findings and conclusions in this article are those of theauthors and do not necessarily represent the views of the U.S.Fish andWildlife Service. Earlier versions of this manuscriptwere improved by comments from V. J. Dreitz, J. A. Gude,M. Hebblewhite, P. M. Lukacs, J. D. Maestas, J. J. Nowak,and 2 anonymous reviewers. Funding was provided by grantsfrom the U.S. Department of Agriculture Natural ResourcesConservation Service’s Conservation Effects AssessmentProject and Conservation Innovation Grant Program; thesale of hunting and fishing licenses in Montana; Federal Aidin Wildlife Restoration grant W-158-R; Montana Fish,Wildlife & Parks Upland Game Bird EnhancementProgram; U.S. Bureau of Land Management CooperativeAgreement L15AC00097; U.S. Fish and Wildlife ServiceCooperative Agreement Award F14AC01224; Safari ClubInternational Foundation, and the Big Sky Upland BirdAssociation.
LITERATURE CITEDAkaike, H. 1973. Information theory and an extension of the maximumlikelihood principle. Pages 267–281 in B. N. Petrov and B. F. Csaki,editors. Second International Symposium on Information Theory.Academiai Kiado, Budapest, Hungary.
Aldridge, C. 2005. Identifying habitats for persistence of greater sage-grouse(Centrocercus urophasianus) in Alberta, Canada. Dissertation, Environ-mental Biology and Ecology, University of Alberta, Edmonton, Canada.
Aldridge, C. L., and M. S. Boyce. 2007. Linking occurrence and fitness topersistence: habitat-based approach for endangered greater sage-grouse.Ecological Applications 17:508–526.
Aldridge, C. L., S. E. Nielsen, H. L. Beyer, M. S. Boyce, J. W. Connelly,S. T. Knick, and M. A. Schroeder. 2008. Range-wide patterns of greatersage-grouse persistence. Diversity and Distributions 14:983–994.
Bailey, D. W., and G. R. Welling. 1999. Modification of cattle grazingdistribution with dehydrated molasses supplement. Journal of RangeManagement 52:575–582.
Beck, J. L., and D. L. Mitchell. 2000. Influences of livestock grazing on sagegrouse habitat. Wildlife Society Bulletin 28:993–1002.
Belsley, D. A., E. Kuh, and R. E. Welsch. 1980. Regression diagnostics.Wiley, New York, New York, USA.
Blickley, J. L., D. Blackwood, and G. L. Patricelli. 2012. Experimentalevidence for the effects of chronic anthropogenic noise on abundance ofgreater sage-grouse at leks. Conservation Biology 26:461–471.
Blomberg, E. J., J. S. Sedinger, M. T. Atamian, and D. V. Nonne. 2012.Characteristics of climate and landscape disturbance influence thedynamics of greater sage-grouse populations. Ecosphere 3(6):1–20.
Boyd, C. S., J. L. Beck, and J. A. Tanaka. 2014. Livestock grazing and sage-grouse habitat: impacts and opportunities. Journal of RangelandApplications1:58–77.
Broms, K. M., M. B. Hooten, and R. M. Fitzpatrick. 2016. Model selectionand assessment for multi-species occupancy models. Ecology 97:1759–1770.
Brooks, S. P., and A. Gelman. 1997. General methods for monitoringconvergence of iterative simulations. Journal of Computational andGraphical Statistics 7:434–455.
Canfield, R. H. 1941. Application of the line-intercept method in samplingrange vegetation. Journal of Forestry 39:388–394.
Carr, N. B., I. I. F. Leinwand, and D. J. A. Wood. 2017. A multiscale indexof landscape intactness for the western United States: U.S. GeologicalSurvey data release. https://dx.doi.org/10.5066/F75H7DCW. Accessed10 Aug 2017.
Chalfoun, A. D., and T. E. Martin. 2010. Facultative nest patch shiftsin response to nest predation risk in the Brewer’s sparrow: a “win-stay,lose-switch” strategy? Oecologia 163:885–892.
Chambers, J. C., B. A. Roundy, R. R. Blank, S. E.Meyer, and A.Whittaker.2007. What makes Great Basin sagebrush ecosystems invasible by Bromustectorum? Ecological Monographs 77:117–145.
Coates, P. S., B. E. Brussee, K. B. Howe, K. B. Gustafson, M. L. Casazza,and D. J. Delehanty. 2016. Landscape characteristics and livestockpresence influence common ravens: relevance to greater sage-grouseconservation. Ecosphere 7:e01203.
Coates, P. S., M. L. Casazza, E. J. Blomberg, S. C. Gardner, S. P. Espinosa,J. L. Yee, L.Wiechman, and B. J. Halstead. 2013. Evaluating greater sage-grouse seasonal space use relative to leks: implications for surface usedesignations in sagebrush ecosystems. Journal of Wildlife Management77:1598–1609.
Coates, P. S., J. W. Connelly, and D. J. Delehanty. 2008. Predators ofgreater sage-grouse nests identified by video monitoring. Journal of FieldOrnithology 79:421–428.
Connelly, J. W., and C. E. Braun. 1997. Long-term changes in sage grouseCentrocercus urophasianus populations in western North America. WildlifeBiology 3:229–234.
Connelly, J. W., M. A. Schroeder, A. R. Sands, and C. E. Braun. 2000.Guidelines to manage sage grouse populations and their habitats. WildlifeSociety Bulletin 28:967–985.
Converse, S. J., J. A. Royle, P. H. Adler, R. P. Urbanek, and J. A. Barzen.2013. A hierarchical nest survival model integrating incomplete temporallyvarying covariates. Ecology and Evolution 3:4439–4447.
Daubenmire, R. 1959. A canopy-coverage method of vegetational analysis.Northwest Science 33:43–64.
Davies, K. W., J. D. Bates, and C. S. Boyd. 2016. Effects of intermediate-term grazing rest on sagebrush communities with depleted understories:evidence of a threshold. Rangeland Ecology & Management 69:173–178.
Davies, K. W., T. J. Svejcar, and J. D. Bates. 2009. Interaction of historicaland nonhistorical disturbances maintains native plant communities.Ecological Applications 19:1536–1545.
Smith et al. � Livestock Grazing and Nesting Sage-Grouse 11

Denwood, M. J. 2016. runjags: An R package providing interface utilities,model templates, parallel computing methods and additional distributionsfor MCMC models in JAGS. Journal of Statistical Software 71:1–25.
Dettenmaier, S. J., T. A. Messmer, T. J. Hovick, and D. K. Dahlgren. 2017.Effects of livestock grazing on rangeland biodiversity: A meta-analysis ofgrouse populations. Ecology and Evolution 7:7620–7627.
Dinkins, J. B., M. R. Conover, C. P. Kirol, J. L. Beck, and S. N. Frey. 2014.Greater sage-grouse (Centrocercus urophasianus) select habitat based onavian predators, landscape composition, and anthropogenic features.Condor 116:629–642.
Doherty, K. E., D. E. Naugle, J. D. Tack, B. L. Walker, J. M. Graham, andJ. L. Beck. 2014. Linking conservation actions to demography: grassheight explains variation in greater sage-grouse nest survival. WildlifeBiology 20:320–325.
Edmunds, D. R., C. L. Aldridge,M. S. O’Donnell, and A. P.Monroe. 2017.Greater sage-grouse population trends across Wyoming. Journal ofWildlife Management 82:397–412.
Engel, K. A., and L. S. Young. 1992. Movements and habitat use bycommon ravens from roost sites in southwestern Idaho. Journal ofWildlifeManagement 56:596–602.
France, K. A., D. C. Ganskopp, and C. S. Boyd. 2008. Interspace/undercanopy foraging patterns of beef cattle in sagebrush habitats.Rangeland Ecology & Management 61:389–393.
Gelman, A., J. B. Carlin, H. S. Stern, and D. B. Rubin. 2014. Bayesian dataanalysis. Volume 2. Chapman & Hall/CRC Boca Raton, Florida, USA.
Gelman, A., X. L. Meng, and H. Stern. 1996. Posterior predictiveassessment of model fitness via realized discrepancies. Statistica Sinica6:733–760.
Gelman, A., and D. B. Rubin. 1992. Inference from iterative simulationusing multiple sequences. Statistical Science 7:457–511.
Gibson, D., E. J. Blomberg, M. T. Atamian, and J. S. Sedinger. 2015.Observer effects strongly influence estimates of daily nest survivalprobability but do not substantially increase rates of nest failure in greatersage-grouse. Auk 132:397–407.
Gibson, D., E. J. Blomberg, and J. S. Sedinger. 2016. Evaluating vegetationeffects on animal demographics: the role of plant phenology and samplingbias. Ecology and Evolution 6:3621–3631.
Gibson, R. M. 1996. A re-evaluation of hotspot settlement in lekking sagegrouse. Animal Behaviour 52:993–1005.
Gregg, M. A., J. A. Crawford, M. S. Drut, and A. K. DeLong. 1994.Vegetational cover and predation of sage grouse nests in Oregon. Journalof Wildlife Management 58:162–166.
Hagen, C. A., J. W. Connelly, and M. A. Schroeder. 2007. A meta-analysisof greater sage-grouse Centrocercus urophasianus nesting and brood-rearinghabitats. Wildlife Biology 13:42–50.
Holechek, J. 2011. Rangemanagement: principles and practices. 6th edition.Prentice Hall, Boston, Massachusetts, USA.
Holloran, M. J., and S. H. Anderson. 2005. Spatial distribution of greatersage-grouse nests in relatively contiguous sagebrush habitats. Condor107:742–752.
Holloran,M. J., B. J. Heath, A. G. Lyon, S. J. Slater, J. L. Kuipers, and S. H.Anderson. 2005. Greater sage-grouse nesting habitat selection and successin Wyoming. Journal of Wildlife Management 69:638–649.
Hovick, T. J., R. D. Elmore, D. K. Dahlgren, S. D. Fuhlendorf, and D. M.Engle. 2014. Evidence of negative effects of anthropogenic structures onwildlife: a review of grouse survival and behaviour. Journal of AppliedEcology 51:1680–1689.
Johnson, C. J., S. E. Nielsen, E. H. Merrill, T. L. McDonald, and M. S.Boyce. 2006. Resource selection functions based on use-availability data:theoretical motivation and evaluation methods. Journal of WildlifeManagement 70:347–357.
Johnson, D. H. 1980. The comparison of usage and availability measure-ments for evaluating resource preference. Ecology 61:65–71.
Karl, T. R., and R.W. Knight. 1998. Secular trends of precipitation amount,frequency, and intensity in the United States. Bulletin of the AmericanMeteorological Society 79:231–241.
Kass, R. E., and A. E. Raftery. 1995. Bayes factors. Journal of the AmericanStatistical Association 90:773–795.
Knick, S. T., D. S. Dobkin, J. T. Rotenberry, M. A. Schroeder, W. M. V.Haegen, and C. van Riper III. 2003. Teetering on the edge or too late?Conservation and research issues for avifauna of sagebrush habitats.Condor 105:611–634.
Knick, S. T., S. E. Hanser, and K. L. Preston. 2013. Modeling ecologicalminimum requirements for distribution of greater sage-grouse leks:implications for population connectivity across their western range, USA.Ecology and Evolution 3:1539–1551.
Kuo, L., and B. Mallick. 1997. Bayesian semiparametric inference for theaccelerated failure-time model. Canadian Journal of Statistics-RevueCanadienne De Statistique 25:457–472.
LeBeau, C.W., J. L. Beck, G. D. Johnson, andM. J. Holloran. 2014. Short-term impacts of wind energy development on greater sage-grouse fitness.Journal of Wildlife Management 78:522–530.
Link, W. A., and R. J. Barker. 2006. Model weights and the foundations ofmultimodel inference. Ecology 87:2626–2635.
Lussenhop, J., D. T. Wicklow, R. Kumar, and J. E. Lloyd. 1982. Increasingthe rate of cattle dung decomposition by nitrogen-fertilization. Journal ofRange Management 35:249–250.
Lyon, A. G., and S. H. Anderson. 2003. Potential gas development impactson sage grouse nest initiation and movement. Wildlife Society Bulletin31:486–491.
Mack, R. N. 1981. Invasion of Bromus tectorum L. into western NorthAmerica: an ecological chronicle. Agro-Ecosystems 7:145–165.
Manier, D. J., and N. T. Hobbs. 2006. Large herbivores influence thecomposition and diversity of shrub-steppe communities in the RockyMountains, USA. Oecologia 146:641–651.
Manly, B. F. J., L. L. McDonald, D. L. Thomas, T. L. McDonald, andW. P. Erickson. 2002. Resource selection by animals: statistical analysisand design for field studies. Second edition. Kluwer, Boston, Massachu-setts, USA.
Martin, T. E., C. R. Paine, C. J. Conway, W. M. Hochachka, P. Allen, andW. Jenkins. 1997. BBIRD field protocol. Montana Cooperative WildlifeResearch Unit, University of Montana, Missoula, USA. http://www.umt.edu/bbird/protocol/. Accessed 28 Feb 2011.
Marzluff, J. M. 1988. Do pinyon jays alter nest placement based on priorexperience? Animal Behaviour 36:1–10.
McConnell, M. D., A. P. Monroe, L. W. Burger, and J. A. Martin. 2017.Timing of nest vegetation measurement may obscure adaptive significanceof nest-site characteristics: a simulation study. Ecology and Evolution7:1259–1270.
Milchunas, D. G., W. K. Lauenroth, P. L. Chapman, and M. K.Kazempour. 1989. Effects of grazing, topography, and precipitation on thestructure of a semiarid grassland. Vegetatio 80:11–23.
Miller, R. F., S. T. Knick, D. A. Pyke, C. W. Meinke, S. E. Hanser, M. J.Wisdom, and A. L. Hild. 2011. Characteristics of sagebrush habitats andlimitations to long-term conservation. Pages 145–184 in S. T. Knick andJ. W. Connelly, editors. Greater sage-grouse: ecology and conservation ofa landscape species and its habitats. Studies in Avian Biology 38.University of California Press, Berkeley, USA.
Monroe, A. P., C. L. Aldridge, T. J. Assal, K. E. Veblen, D. A. Pyke, andM. L. Casazza. 2017. Patterns in greater sage-grouse population dynamicscorrespond with public grazing records at broad scales. EcologicalApplications 27:1096–1107.
Montana State Library. 2016. Montana Cadastral Mapping Project. http://svc.mt.gov/msl/mtcadastral/. Accessed 5 Oct 2016.
National Centers for Environmental Information. 2017. Climate at a glance.National Oceanic and Atmospheric Association, Asheville, NorthCarolina, USA.
Naugle, D. E., K. E. Doherty, B. L. Walker, M. J. Holloran, and H. E.Copeland. 2011. Energy development and greater sage-grouse. Pages489–503 in S. T. Knick and J. W. Connelly, editors. Greater sage-grouse:ecology and conservation of a landscape species and its habitats. Studies inAvian Biology 38. University of California Press, Berkeley, USA.
Nielson, R. M., L. L. McDonald, J. Mitchell, S. Howlin, and C. LeBeau.2015. Analysis of greater sage-grouse lek data: trends in peak male counts1965-2015. Western Association of Fish and Wildlife Agencies,Cheyenne, Wyoming, USA. http://www.wafwa.org/Documents%20and%20Settings/37/Site%20Documents/News/GRSG%20Report%20for%20WAFWA.pdf.
O’Hara, R. B., and M. J. Sillanp€a€a. 2009. A review of Bayesian variableselection methods: what, how and which. Bayesian Analysis 4:85–117.
Patterson, R. L. 1952. The sage grouse in Wyoming. Sage Books, Denver,Colorado, USA.
Rasmussen, D. L., and L. A. Griner. 1938. Life history and managementstudies of the sage grouse in Utah, with special reference to nesting and
12 The Journal of Wildlife Management � 9999()

feeding habits. Transactions of the North American Wildlife and NaturalResources Conference 3:852–864.
Robel, R. I., J. N. Briggs, A. D. Dayton, and L. C. Hulbert. 1970.Relationships between visual obstruction measurements and weight ofgrassland vegetation. Journal of Range Management 23:295–297.
Roche, L. M., A. M. Latimer, D. J. Eastburn, and K. W. Tate. 2012. Cattlegrazing and conservation of a meadow-dependent amphibian species inthe Sierra Nevada. PLoS ONE 7:e35734.
Schneider, M. F. 2001. Habitat loss, fragmentation and predator impact:spatial implications for prey conservation. Journal of Applied Ecology38:720–735.
Schroeder, M. A., C. L. Aldridge, A. D. Apa, J. R. Bohne, C. E. Braun,S. D. Bunnell, J. W. Connelly, P. A. Deibert, S. C. Gardner, M. A.Hilliard, G. D. Kobriger, S. M. McAdam, C. W. McCarthy, J. J.McCarthy, D. L. Mitchell, E. V. Rickerson, and S. J. Stiver. 2004.Distribution of sage-grouse in North America. Condor 106:363–376.
Schroeder, M. A., J. R. Young, and C. E. Braun. 1999. Sage-grouse(Centrocercus urophasianus). Account 425 in A. Poole and F. Gill,editors. The birds of North America. The Academy of Natural Sciences,Philadelphia, Pennsylvania, and the American Ornithologists’ Union,Washington, D.C., USA.
Smith, D. H. V., S. J. Converse, K. W. Gibson, A. Moehrenschlager, W. A.Link, G. H. Olsen, and K. Maguire. 2011. Decision analysis forconservation breeding: Maximizing production for reintroduction ofwhooping cranes. Journal of Wildlife Management 75:501–508.
Smith, J. T., J. S. Evans, B. H. Martin, S. Baruch-Mordo, J. M. Kiesecker,and D. E. Naugle. 2016. Reducing cultivation risk for at-risk species:predicting outcomes of conservation easements for sage-grouse. BiologicalConservation 201:10–19.
Smith, J. T., J. D. Tack, L. I. Berkeley, M. Szczypinski, and D. E. Naugle.2018a. Effects of rotational grazing management on nesting greatersage-grouse. Journal of Wildlife Management 82:103–112.
Smith, J. T., J. D. Tack, K. E. Doherty, B. W. Allred, J. D. Maestas, L. I.Berkeley, S. J. Dettenmaier, T. A. Messmer, and D. E. Naugle. 2018b.Phenology largely explains taller grass at successful nests in greater sage-grouse. Ecology and Evolution 8:356–364.
Taylor, R. L., B. L. Walker, D. E. Naugle, and L. S. Mills. 2012. Managingmultiple vital rates to maximize greater sage-grouse population growth.Journal of Wildlife Management 76:336–347.
Thornton, P. E., M. M. Thornton, B. W. Mayer, N. Wilhelmi, Y. Wei, R.Devarakonda, and R. B. Cook. 2014. Daymet: daily surface weather dataon a 1-km grid for North America, Version 2. Oak Ridge NationalLaboratory Distributed Active Archive Center, Oak Ridge, Tennessee,USA. https://doi.org/10.3334/ORNLDAAC/1219.
U.S. Department of Agriculture National Agricultural Statistics Service[USDA-NASS]. 2016. Cropland Data Layer. http://nassgeodata.gmu.edu/CropScape/. Accessed 01 May 2017.
Wakkinen,W. L., K. P. Reese, J. W. Connelly, and R. A. Fischer. 1992. Animproved spotlighting technique for capturing sage grouse. WildlifeSociety Bulletin 20:425–426.
Wambolt, C. L., M. R. Frisina, S. J. Knapp, and R. M. Frisina. 2006. Effectof method, site, and taxon on line-intercept estimates of sagebrush cover.Wildlife Society Bulletin 34:440–445.
Webb, S. L., C. V. Olson, M. R. Dzialak, S. M. Harju, J. B. Winstead, andD. Lockman. 2012. Landscape features and weather influence nest survivalof a ground-nesting bird of conservation concern, the greater sage-grouse,in human-altered environments. Ecological Processes 1:1–15.
West, N. E., F. D. Provenza, P. S. Johnson, and M. K. Owens. 1984.Vegetation change after 13 years of livestock grazing exclusion on sagebrushsemidesert inwest centralUtah. Journal ofRangeManagement 37:262–264.
Wisdom, M. J., C. W. Meinke, S. T. Knick, and M. A. Schroeder. 2011.Factors associated with extirpation of sage-grouse. Pages 451–472 in S. T.Knick and J. W. Connelly, editors. Greater sage-grouse: ecology andconservation of a landscape species and its habitats. Studies in AvianBiology 38. University of California Press, Berkeley, USA.
Associate Editor: Timothy Fulbright.
SUPPORTING INFORMATIONAdditional supporting information may be found in theonline version of this article at the publisher’s website.
Smith et al. � Livestock Grazing and Nesting Sage-Grouse 13