Embed Size (px)
Citation preview

Effective radium-226 concentration in rocks, soils, plants and bones
FREDERIC PERRIER*, FREDERIC GIRAULT & HELENE BOUQUEREL
Institut de Physique du Globe de Paris, Sorbonne Paris Cite,
Universite Paris Diderot, CNRS, F-75005 Paris, France
*Correspondence: [email protected]
Abstract: Effective radium-226 concentration, ECRa, is the product of radium activity concentra-tion, CRa, multiplied by the emanation coefficient, E, which is probability of producing a radon-222atom in the pore spaces. It is measured by accumulation experiments in the laboratory, achievedroutinely for a sample mass .50 g using scintillation flasks to measure the radon concentration.We report on 3370 ECRa values obtained from more than 11 800 such experiments. Rocks(n ¼ 1351) have a mean ECRa value of 1.9 + 0.1 Bq kg21 (90% of data in the range 0.11–35 Bq kg21), while soils (n ¼ 1524) have a mean ECRa value of 7.5 + 0.2 Bq kg21 (90% ofdata between 1.4 and 28 Bq kg21). Using this large dataset, we establish that the spatial structureof ECRa is meaningful in geology or sedimentology. For plants (n ¼ 85), ECRa is generally,1 Bq kg21, but values of larger than 10 Bq kg21 are also observed. Dedicated experimentswere performed to measure emanation, E, in plants, and we obtained values of 0.86 + 0.04 com-pared with 0.24 + 0.04 for sands, which leads to estimates of the radium-226 soil-to-plant transferratio. For most measured animal bones (n ¼ 26), ECRa is .1 Bq kg21. Therefore, ECRa appearsessential for radon modelling, health hazard assessment and also in evaluating the transfer ofradium-226 to the biosphere.
Radon-222, a radioactive noble gas with a half-lifeof 3.8 days and a decay product of radium-226 inthe uranium-238 chain, is ubiquitous in the environ-ment (Tanner 1964). Migrating from the ground intoliving spaces, it constitutes half the radiation dose tothe general population (Porstendorfer 1994) and is amajor cause of lung cancer (Darby et al. 2005).Radon-222 is a health hazard, especially in under-ground and poorly ventilated spaces (Gillmoreet al. 2011) or above uranium mine tailings (Ferryet al. 2001; Pereira et al. 2010; Barbosa et al.2015). It receives also a lot of attention because itis a powerful tracer of the transport of shallowgroundwater (Przylibski 2011) or deep geologicalfluids: for example, around geothermal systems(Weinlich et al. 2013; Girault et al. 2014a), volca-noes (Cigolini et al. 2009) and active faults (Waliaet al. 2005, 2008; Cigolini et al. 2015). Further pro-gress in radon health hazard assessment and theuse of radon to quantify environmental and geolog-ical processes requires better modelling of the radonsignatures in groundwater and ground gases, which,first of all, needs a better understanding of the radonsource.
The radon-222 exhalation from any porousmedium is proportional to the activity concentrationof radium-226, CRa, and to the probability of aradium atom emitting its radioactive product radoninto the pore space, this is called the emanation coef-ficient, E (Tanner 1964; Adler & Perrier 2009;Sakoda et al. 2011). Thus, to quantify the radonsource, the relevant quantity to consider is the
product ECRa, referred to as the effective radiumconcentration (Stoulos et al. 2004; Girault & Perrier2012a). This quantity can be measured by accumu-lation experiments in the laboratory, placing vary-ing masses of sample material (usually 100 g, butcan be .1 kg) in a closed container, with theradon concentration being measured by continuousradon monitors (Ferry et al. 2002; Sakoda et al.2008; Nicolas et al. 2014; Menon et al. 2015), inte-grating devices (Stoulos et al. 2004; Girault & Per-rier 2012a; Menon et al. 2015) or scintillation flasks(Stoulos et al. 2003; Meslin et al. 2011; Girault &Perrier 2012a).
To process large numbers of samples, the mostefficient and reliable method was found to bethe use of scintillation flasks (Girault & Perrier2012a), a method that could also be extended tosample masses smaller than 5 g (Perrier & Girault2012). In the present paper, we review and updatethe major results for ECRa obtained using this stan-dardized method with rocks and soils, and presentnew results, in particular using natural materialsrarely investigated before. Some perspectives forthe use of ECRa in heuristic geological and environ-mental problems are then presented.
Experimental method and uncertainties
The experimental method has been presented before(Girault & Perrier 2012a) and is only briefly sum-marized here. A sample of mass m was installed in
From: Gillmore, G. K., Perrier, F. E. & Crockett, R. G. M. (eds) Radon, Health and Natural Hazards.Geological Society, London, Special Publications, 451, https://doi.org/10.1144/SP451.8# 2016 The Author(s). Published by The Geological Society of London. All rights reserved.For permissions: http://www.geolsoc.org.uk/permissions. Publishing disclaimer: www.geolsoc.org.uk/pub_ethics
by guest on November 22, 2016http://sp.lyellcollection.org/Downloaded from

a sealed container of volume V0 that is initially freeof radon. After an accumulation time t, the radonconcentration in the container had grown toCRn(t). In a perfectly sealed container with impervi-ous walls and when diffusion effects of radon-222 inthe sample can be ignored, we have (Girault & Per-rier 2012a):
ECRa =Va
m
CRn(t)
1 − e−lt(1)
where l is the decay constant of radon-222(2.1 × 1026 s21), ECRa is expressed in Bq kg21
and Va is the total air volume available in the con-tainer, including the sample-connected pore space.To estimate Va, the total volume of the containerwas reduced by the volume of the solid matrix ofthe sample. A rough estimate of the average mineraldensity was sufficient to obtain a sufficiently accu-rate estimate of Va. In our case (Fig. 1a), we mea-sured CRn(t) by sampling the container air usingpreviously evacuated 125 ml scintillation flasks(Algade, France), using a valve equipped with a fil-ter and syringe needles (Fig. 1a), and we correctedfor dilution during sampling (Girault & Perrier2012a). The radon concentration in the containerwas then inferred after the scintillating flasks had
been inserted (Fig. 1b) and counted twice in CAL-ENTM photomultiplier counters (Algade, France).The background counts of the flasks is determinedbefore sampling, and subtracted to obtain the netsignal. For the levels of ECRa reported in the presentpaper, the initial radon concentration due to the lab-oratory room was negligible compared with theradon concentration produced by the samples inthe accumulation containers. In the standard proce-dure reported here, we used a sample mass, m, largerthan 50 g, and counting times of 5 and 10 min. Werepeated each accumulation experiment three orfour times, using different accumulation times, t,that varied between 5 days and 3 weeks, and thefinal value of ECRa was obtained by averagingthe results.
To achieve optimal detection, the accumulationcontainer was chosen so that the radon concen-tration was maximized in the container and in thescintillation flask. The radon concentration in thecontainer was larger for a smaller air volume, Va.However, Va could not be too small as: first, itcould not be smaller than the scintillation flaskvolume, otherwise the benefit of an increased con-centration in the container was lost by dilution dur-ing sampling in the flask; and, second, Va should notbe smaller than about half of the container volume
Fig. 1. (a) View of the various instruments used for the sampling of the air in an accumulation bottle using ascintillation flask. The scintillation flasks are evacuated using a hand pump and sampling is performed using asyringe and needle assembly equipped with a valve and a filter. (b) View of a typical counting session usingphotomultipliers after sampling 24 accumulation containers.
F. PERRIER ET AL.
by guest on November 22, 2016http://sp.lyellcollection.org/Downloaded from

in order to avoid back-diffusion complications(Sakoda et al. 2008). As the method was developedfurther after its initial testing phase (Girault & Per-rier 2012a), different containers were considered(Fig. 2) and less practical containers that resultedin occasional leakage were eliminated. It was some-times difficult to find air-tight containers for smallor large samples, and, for sampling with syringeneedles (as shown in Fig. 1a), we preferred to uselarge pre-perforated natural rubber stoppers ratherthan lids equipped with stoppers. The bottlesshown in Figure 2 (No. 7 with V0 ¼ 262 ml, No. 4with V0 ¼ 518 ml and No. 3 with V0 ¼ 1022 ml)turned out to be the best containers for routine use,with no case of leakage detected, but these couldonly be used for crushed samples or samples thatoccurred naturally in small pieces. Large samplesor precious samples that had to be returned intactneeded to be installed in containers with largeropenings, for which variants are being constantlyinvestigated.
Each new type of container was systematicallytested with a set of known materials, which weremostly crushed granite samples. For example, thelarge glass container labelled No. 1 in Figure 2, witha volume of V0 ¼ 1574 ml, gave a ECRa value of30.1 + 0.9 Bq kg21 for a granite powder that hada value of 30.5 + 0.5 Bq kg21 in bottle No. 7 (seeFig. 2) with a volume of V0 ¼ 262 ml. Referencesamples have been measured repeatedly since2008 to ensure the continuity of the results and totest the consistency of the method. For example,one reference container (No. 4 type in Fig. 2) witha Permian schist sample (Salagou Ruffe, France)
gave a ECRa value of 12.42 + 0.27 Bq kg21 inJune 2013 and 11.29 + 0.25 Bq kg21 in April 2015.Another reference soil sample gave 40.6 +1.3 Bq kg21 in March 2011, in one Erlenmeyerflask, and 38.12 + 0.58 Bq kg21 in April 2015, ina 262 ml bottle. The efficiency of the detectionchain has been monitored since 2009 using radium-doped scintillation flasks. No systematic aging ofthe scintillation flask detection level or of the photo-multipliers efficiencies, possible in principle, havebeen noticed so far.
Experimental uncertainties were dominatedby the photomultiplier counting statistics, whichdecreased for larger radon concentration, and theuncertainty of the dilution correction, which in-creased for smaller air volumes. The resultingrelative uncertainty, shown in Figure 3 v. ECRa val-ues, varied, on average, from about 10% forECRa ¼ 1 Bq kg21 to 3% for ECRa ¼ 30 Bq kg21.When a sample mass larger than 200 g was used,then the uncertainty was reduced to 7% for ECRa ¼1 Bq kg21 and to 20% for ECRa ¼ 0.1 Bq kg21.Sample masses, m, of the order of 50 g gave suffi-ciently accurate values (uncertainty ,5%) forECRa . 10 Bq kg21, which was also the case formost granites and soil samples with a high radiumconcentration. To this uncertainty, which is statisti-cally independent for the two independent mea-surements, an overall systematic uncertainty of 5%,due to the absolute calibration of the method, mustbe added quadratically when relevant.
Detection limit depends on m, Va and on thecounting time used. Routine counting time was5 min, but 10 min was used for lower ECRa values.
Fig. 2. A view of various containers used in recent accumulation experiments.
ECRa IN ROCKS, SOILS, PLANTS AND BONES
by guest on November 22, 2016http://sp.lyellcollection.org/Downloaded from

For a counting time of 10 min, the detection limitfor the radon concentration in the accumulationcontainer was CRnDL ¼ 13 Bq m23 (Girault & Per-rier 2012a). The corresponding detection limit interms of ECRa was then: ECRaDL ¼ CRnDL Va/m.For 50 g in a 262 ml bottle, we had ECRaDL ¼0.068 Bq kg21, which covered almost all of thesamples of interest in most applications. For 800 gin a 1 l container, we could reduce the detectionlimit to ECRaDL ¼ 0.016 Bq kg21, sufficient for allapplications considered here.
The quantity ECRa depends on the temperatureand water content. The slight increase in ECRa
with temperature (Girault & Perrier 2011, 2012b)is interesting to consider in the case of hydrothermaland volcanic systems, but still remains insufficientlyknown for volcanic rocks. The dependence on watercontent (Sakoda et al. 2010; Meslin et al. 2011; Gir-ault & Perrier 2012b) is moderate as long as residualwater remains in the pore space, in agreement withnumerical models (Adler & Perrier 2009). Conse-quently, samples for ECRa measurement are notoven-dried, but left in their original condition.When necessary (e.g. in the case of soaked soil sam-ples), they were only gently dried on the laboratorybench without heating.
General results in rocks and soils
A total of 3370 measurements of ECRa have beencarried out so far with this method, correspondingto more than 11 800 accumulation experiments.The majority of samples were collected during our
fieldwork in Nepal, France and other Europeancountries. We also borrowed a few samples fromcolleagues and reference rock archives. Identifica-tion was performed according to the available geo-logical maps, and discussed with local geologistswhen confirmation was needed. Detailed resultsfor specific sites have been presented (Girault et al.2011, 2012, 2014b) and will be presented in furtherdedicated papers. In the following, we concentrateon general results. All average values mentionedare geometric means.
Effective radium concentration in rocks
A total of 1351 rock samples have been studied,from numerous different contexts, and provide areasonable coverage of rock types. The ECRa val-ues for rocks vary over more than six orders ofmagnitude (Fig. 4a), with a mean value of 1.9 +0.1 Bq kg21, and with 90% of the values fallingbetween 0.11 and 35 Bq kg21. The largest ECRa val-ues observed so far, in excess of 106 Bq kg21, weremeasured for pitchblende uranium ore from theFrench La Crouzille mine (Limousin), while uranif-erous granites usually had ECRa . 1000 Bq kg21.These anomalously high values were not consid-ered when giving the above estimate of the aver-age value.
The ECRa values, on average, are according toexpectations for various types of rocks: graniticrocks give larger values than other rocks; but the dis-tributions are wider than might be expected for thesame type of rock (Fig. 5). The average value for
Fig. 3. Relative uncertainty of the ECRa v. ECRa value, for three different domains of sample mass (m).
F. PERRIER ET AL.
by guest on November 22, 2016http://sp.lyellcollection.org/Downloaded from

granites was about 17 Bq kg21, but the distribution(Fig. 5a) was wide. Various Variscan granites fromFrance (South Cevennes and Limousin), Germanyand Poland had similar and relatively large ECRa
values (Table 1), of around 22 Bq kg21, while asmaller value was measured in Mont Lozere(16.0 + 5.1 Bq kg21) in the Northern Cevennesrange, and an even smaller value (6.9 + 0.2Bq kg21) in Ballon d’Alsace granite. The value forMont Lozere, however, was similar to that of theUlleri gneiss (15.7 + 1.5 Bq kg21) in Nepal (Gir-ault et al. 2012). This suggests that, more thanlocal variability, the value of ECRa is more depen-dent on anatexis (partial melting) or other mecha-nisms occurring during metamorphism.
Volcanic rocks, with a mean of the order of1 Bq kg21, covered a large range of ECRa values,from ,0.1 Bq kg21, for Stromboli lavas, to .5Bq kg21, for some Azores lavas. Other rocks withsmall ECRa values were calcareous rocks, whichthus far have given an average value of about0.34 Bq kg21. Some limestone samples, however,had ECRa values of .2 Bq kg21, which are largerthan most volcanic rocks, and even larger thansome rocks labelled as granites. For example, one
Jurassic massive black limestone from the Cevennesfront and one Lutetian limestone sample from aquarry in Paris gave values of ECRa ¼ 3.26 +0.21and 3.20 + 0.29 Bq kg21, respectively.By con-trast, one so-called granite from Cotentin (France)has ECRa ¼ 1.50 + 0.13 Bq kg21, and one fromHaute-Vienne (France) has a value of ECRa ¼0.63 + 0.04 Bq kg21. In both cases, one may raisesome doubts on the accuracy of the sampling or ofthe available geological mapping, but this mayalso just reflect the ambiguity of some geologicalterms to account for local geological complexity.In this instance, low values suggest gneisses ratherthan granites, since they are characterized by lowvalues, as was established in the case of the GreaterHimalaya gneisses (Girault et al. 2012). These datareflect the complex history of uranium and radiumover geological time, and suggest that cautionshould definitely remain mandatory when assumingpotential radon exhalation levels without havingperformed any measurement of ECRa.
The current dataset indicates that ECRa, whenactually measured or not just estimated from indi-rect arguments, is a useful geological index forrock classification and geological interpretation.
(a)
(b)
Fig. 4. Distribution, with logarithmic scales, of ECRa for rocks and soils. The entire available dataset using ourexperimental method, measured between 2007 and 2015, is shown. Vertical dashed lines represent thegeometric means.
ECRa IN ROCKS, SOILS, PLANTS AND BONES
by guest on November 22, 2016http://sp.lyellcollection.org/Downloaded from

One important question to be addressed in eachcase, however, is whether the experimental valueobtained from a given rock sample is representativeof the geological formation, and whether some dis-persion must be expected and at which spatial scale.This question has been discussed previously ingeneral terms (Girault & Perrier 2012b), and hasbeen also investigated in detail for selected outcropsin Nepal (Girault et al. 2012; Girault & Perrier2014). Dispersion should be investigated at sample
level (decimetre scale), scarp level (metre scale)and formation level (decametre scale). The casesinvestigated so far showed that dispersion increasedfrom the decimetre scale to the decametre scale, butthat ECRa values remained specific at the level of thegeological formation (lithostratigraphic unit). Infact, not only is the average value of interest for agiven outcrop or geological formation, but also theshape of the distribution of values. The shape ofgeological distributions, indeed, contains important
(a)
(b)
(c)
Fig. 5. Distribution of ECRa for (a) granites, (b) volcanic rocks and (c) limestones. Vertical dashed lines representthe geometric means.
Table 1. Comparison of ECRa results from some granitic rocks. Average refers to thegeometric mean
Pluton Average(Bq kg21)
n Range (minimum/maximum) (Bq kg21)
South Cevennes granite, France 26.2 + 2.3 32 4.6/56.4Mont Lozere, France 16.0 + 5.1 6 6.5/27.3Limousin granite, France 21.2 + 3.7 21 5.6/65.0Ballon d’Alsace, France 6.9 + 0.2 6 4.9/8.2Erzgebirge granite, Germany 22.2 + 0.44 1Sudetes granite, Poland 24.1 + 7.8 4 14.6/48.9Ulleri gneiss, Nepal 15.7 + 1.5 29 4.1/30.1
F. PERRIER ET AL.
by guest on November 22, 2016http://sp.lyellcollection.org/Downloaded from

information on the nature of grain mixing (Fielleret al. 1990) or on the underlying processes (Allegre& Lewin 1995; Buccianti 2015). While the log-normal distribution seems a reasonable approxima-tion in numerous cases, in particular for radonconcentration distributions (Bossew 2010), it doesnot account for the large tails often observed in prac-tice, which are not representation artefacts, but realgeological fluctuations, and is unable to account forthe rich multimodal distribution observed in Figure4a. In this respect, it is also interesting that ECRa
values of the Variscan granites in Table 1 have sim-ilar average values and similar ranges. In additionto dispersion, smooth coherent variations in ECRa
within a formation are possible, but cases stillremain insufficiently studied in this regard.
The large potential variations in ECRa from for-mation to formation, even, for example, amonggranites of similar mineral composition but differentgeological histories, combined with usually rela-tively small dispersion, are particularly useful inthe context of geological contacts or fault zones.Profiles of ECRa across such geological discontinu-ities are then particularly useful. One interestingcase has been reported across the Penninic Frontin the French Alps (Girault & Perrier 2012b). Themost extensive and exemplary study, however, andthe first systematic study of ECRa in relation to geo-logical formation remains, to date, the study acrossthe Main Central Thrust (MCT) in the Nepal Hima-layas (Girault et al. 2012). This work showed clearevidence of a large reduction in ECRa amongrocks of similar fabric (gneisses and schists) acrossthe MCT, a fault whose position remains controver-sial and which could be refined accurately usingECRa data. These pioneering and promising resultssuggest that large-scale mapping of ECRa could bean essential and cost-effective tool in geologicallycomplex areas, beyond the interest in the radonsource term, complementing other tools such as neo-dymium isotope ratios.
Effective radium concentration in soils
A total of 1524 soil samples have been studied, col-lected during our work in different geographicalcontexts, mostly Nepal and France, providing a rea-sonable coverage of numerous soil types, as well asthe underlying rock types. In this study, all types ofunconsolidated surface deposits were referred to assoils. The ECRa values for soils varied over onlyabout three orders of magnitude (Fig. 4b), with amean value of 7.5 + 0.2 Bq kg21, with 90% of thevalues of soils between 1.4 and 28 Bq kg21. Thelargest ECRa value observed so far for soils(8770 + 200 Bq kg21) was measured for iron-richsoil deposits around a cold spring in the High Hima-layas of Nepal (Girault & Perrier 2014). Two other
exceptional values (1249 + 14 and 1181 + 59 Bqkg21) were reported at a CO2 release zone aroundthe Chilime hot spring in central Nepal (Giraultet al. 2014a). Other large and rather rare valuesabove 100 Bq kg21 were observed for soils in for-mer uranium mining zones in Limousin, France.By contrast, values of ,2 Bq kg21 were observedfor sands (Fig. 4b), which were characterized by amean value of 0.42 + 0.06 Bq kg21, but variedfrom 0.109 + 0.078 to 2.03 + 0.18 Bq kg21.
Measuring ECRa could also be an interestingmethod of revealing separation processes of radioel-ements during pedogenesis. Now that we have a sig-nificant database of experimental values, we canstudy the relationship between the effective radiumconcentration of a soil (ECRaS) and the effectiveradium concentration (ECRaR) of the closest avail-able rock (Fig. 6), where the closest measuredrock must be at a distance of less than 250 m. Thisdistance is arbitrary, and must be reasonable giventhe local conditions. From the 226 soils that satisfiedthis condition, interesting structures emerged (Fig.6). For ECRaR values of ,3 Bq kg21, ECRaS isalways larger than ECRaR, but the range spannedby ECRaS increases for smaller ECRaR values. Thissuggests that rocks with smaller ECRa values aremore prone to alteration, with mechanisms produc-ing soils that can be either radium-enriched orradium-depleted, and probably both types beingseparated by the erosion process. Soils with moreorganic matter and finer fractions, characterizedby larger ECRa values, are deposited further awaythan the quartz-rich and heavy fractions. This pro-cess is probably very different for aerial and watererosion processes. For ECRaR values of .3 Bq kg21,ECRaS can be either larger or smaller than ECRaR.Data points with ECRaS smaller than ECRaR inFigure 6 corresponded to soils over Variscangranites, which can also produce ECRaS slightlylarger than ECRaR, when ECRaR is .10 Bq kg21.Some points in Figure 6 also showed ECRaS val-ues of .100 Bq kg21, when ECRaR was close to10 Bq kg21. These points systematically corre-sponded to soils developed in the vicinity of a par-ticular mica-schist outcrop near MCT in the upperTrisuli Valley in central Nepal (Girault et al.2012). The relationship between ECRaS and ECRaR
appears to be a promising tool that should be studiedsystematically in natural sites where the current andpast alteration processes are well constrained.
As in the case of rocks, the question as towhether the ECRa value of a given soil sample is rep-resentative of a given context must be raised.Sample-scale dispersion of ECRa of soils tends tobe very small, with soils separated by less than10 cm giving similar ECRa values within the exper-imental uncertainties. Thus, ECRa appears as a par-ticularly stable index to correlate sedimentary
ECRa IN ROCKS, SOILS, PLANTS AND BONES
by guest on November 22, 2016http://sp.lyellcollection.org/Downloaded from

profiles (Girault et al. 2011a). In the case of riverterrace deposits, we also observed a remarkablestability of values on a given level, with differentterraces characterized by specific ECRa values(Girault et al. 2011b), allowing the possibility oflong-distance correlation, possibly due to large-scale consistency of soil particle size and composi-tion. The variations in soil ECRa over distanceslarger than 1 km have not yet been studied, but
this offers a nice possibility of soil characterizationor site mapping.
Vertical variations in soil ECRa were studied atsmall scale using terrace scarps in the KathmanduValley (Girault et al. 2011a). Smooth variations inECRa were observed within sediment layers, withlarge variations over a few centimetres across lay-ers. Vertical variations over larger distances werestudied at the site of the French National Magnetic
Fig. 6. Soil ECRa v. ECRa of the closest rock sample in place, when one rock sample is available at a distance ofless than 250 m.
Fig. 7. Location of the trenches and boreholes investigated at the French Magnetic Observatory site atChambon-la-Foret (CLF).
F. PERRIER ET AL.
by guest on November 22, 2016http://sp.lyellcollection.org/Downloaded from

Observatory, located in the Orleans Forest at thesouthern edge of the Parisian Basin (Fig. 7). Thelocal geology is dominated by more than 50 m ofQuaternary sediments above Burdigalian Miocenemarls and Aquitanian limestone. In the compoundof the observatory, three 1 m-deep trenches (1 ×1 × 1 m holes) were excavated at points O, E andM, separated by about 132–187 m (Fig. 7), eachcomplemented with a 10 m-deep borehole. Small-scale horizontal variations in ECRa were studied intrench O (Fig. 8) at 20 cm (sandy soil) and 65 cmdepth (clay-rich dark soil). Significant horizontalvariations were observed, probably organized assmooth structures; we observed 25% RMS (standarddeviation) at 20 cm depth and 8.5% RMS at 65 cmdepth. However, the ECRa values, at the two differ-ent depths, were statistically different, with an aver-age ECRa value of 3.31 + 0.25 Bq kg21 at 20 cmdepth and 14.0 + 0.36 Bq kg21 at 65 cm depth,two typical low and high values of soils in the refer-ence distribution shown in Figure 4b.
Results from the vertical profiles in the trenchesand boreholes (Fig. 9) spanned the whole range ofECRa values from soils (Fig. 4b), ranging in thiscase from 2.32 + 0.15 to 39.79 + 0.89 Bq kg21,with an overall average of 10.05 + 0.74 Bq kg21.Significant smooth and, sometimes, large variationsin ECRa were observed with depth. At the surface,significant variations were observed between thesites O, E and M, but large variations (47% RMS)were observed locally from sample to sample col-lected in the forest (grey points in Fig. 9). For allthree sites, the value at 1 m depth in the trench
coincided well with the value at 1 m depth in theborehole, located 1 m away laterally from thetrench. Two sites (O and M) showed remarkablysimilar ECRa values over the whole availabledepth range. Site E, however, was different. Thisresult is interesting because it illustrates the caseof possible large horizontal discrepancies in a con-text of homogeneity. Thus, over distances of theorder of 100 m and at a depth of 10 m, spatial scalesrelevant for most subsurface environmental prob-lems and soil contamination studies, a tabular back-ground can coexist with extended lateral anomalies.While a 1D approximation must be rejected,selected 3D pockets scattered within a 1D back-ground probably provide a good conceptual modelfor a tabular sedimentary domain. The measurementof ECRa provides a straightforward and effectivemethod to support or reject such conceptualschemes for a given natural site.
General results in biosphere matter
While measurements in living matter are morelimited, we report here on the initial results obtainedwith 111 selected materials from the biosphere(Fig. 10). Various plant materials (n ¼ 50) suchas dried vegetables and fruits (n ¼ 21), seeds(n ¼ 6), mushrooms (n ¼ 4), and grass and moss(n ¼ 12) have been considered. While ECRa valuesin plant samples tended to be low, with an aver-age of 0.72 + 0.17 Bq kg21, the covered rangeof values extended from 0.020 + 0.0014 to
Fig. 8. Horizontal profiles of ECRa in trench O at CLF (see Fig. 7).
ECRa IN ROCKS, SOILS, PLANTS AND BONES
by guest on November 22, 2016http://sp.lyellcollection.org/Downloaded from

Fig. 9. Vertical profiles of ECRa in trenches and boreholes at the E, O and M locations at CLF (see Fig. 7). Greypoints refer to soil samples collected at various locations in the compound or in its vicinity.
(a)
(b)
(c)
Fig. 10. Distributions of ECRa for (a) plants, (b) tree samples (bark, branches and leaves) and (c) bones. Verticaldashed lines represent the geometric means.
F. PERRIER ET AL.
by guest on November 22, 2016http://sp.lyellcollection.org/Downloaded from
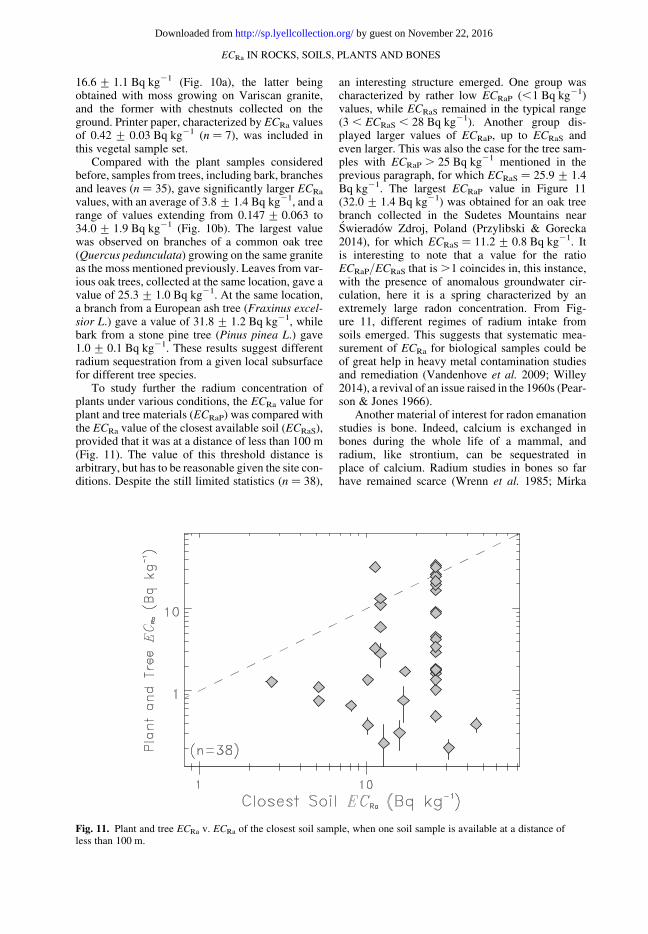
16.6 + 1.1 Bq kg21 (Fig. 10a), the latter beingobtained with moss growing on Variscan granite,and the former with chestnuts collected on theground. Printer paper, characterized by ECRa valuesof 0.42 + 0.03 Bq kg21 (n ¼ 7), was included inthis vegetal sample set.
Compared with the plant samples consideredbefore, samples from trees, including bark, branchesand leaves (n ¼ 35), gave significantly larger ECRa
values, with an average of 3.8 + 1.4 Bq kg21, and arange of values extending from 0.147 + 0.063 to34.0 + 1.9 Bq kg21 (Fig. 10b). The largest valuewas observed on branches of a common oak tree(Quercus pedunculata) growing on the same graniteas the moss mentioned previously. Leaves from var-ious oak trees, collected at the same location, gave avalue of 25.3 + 1.0 Bq kg21. At the same location,a branch from a European ash tree (Fraxinus excel-sior L.) gave a value of 31.8 + 1.2 Bq kg21, whilebark from a stone pine tree (Pinus pinea L.) gave1.0 + 0.1 Bq kg21. These results suggest differentradium sequestration from a given local subsurfacefor different tree species.
To study further the radium concentration ofplants under various conditions, the ECRa value forplant and tree materials (ECRaP) was compared withthe ECRa value of the closest available soil (ECRaS),provided that it was at a distance of less than 100 m(Fig. 11). The value of this threshold distance isarbitrary, but has to be reasonable given the site con-ditions. Despite the still limited statistics (n ¼ 38),
an interesting structure emerged. One group wascharacterized by rather low ECRaP (,1 Bq kg21)values, while ECRaS remained in the typical range(3 , ECRaS , 28 Bq kg21). Another group dis-played larger values of ECRaP, up to ECRaS andeven larger. This was also the case for the tree sam-ples with ECRaP . 25 Bq kg21 mentioned in theprevious paragraph, for which ECRaS ¼ 25.9 + 1.4Bq kg21. The largest ECRaP value in Figure 11(32.0 + 1.4 Bq kg21) was obtained for an oak treebranch collected in the Sudetes Mountains nearSwieradow Zdroj, Poland (Przylibski & Gorecka2014), for which ECRaS ¼ 11.2 + 0.8 Bq kg21. Itis interesting to note that a value for the ratioECRaP/ECRaS that is .1 coincides in, this instance,with the presence of anomalous groundwater cir-culation, here it is a spring characterized by anextremely large radon concentration. From Fig-ure 11, different regimes of radium intake fromsoils emerged. This suggests that systematic mea-surement of ECRa for biological samples could beof great help in heavy metal contamination studiesand remediation (Vandenhove et al. 2009; Willey2014), a revival of an issue raised in the 1960s (Pear-son & Jones 1966).
Another material of interest for radon emanationstudies is bone. Indeed, calcium is exchanged inbones during the whole life of a mammal, andradium, like strontium, can be sequestrated inplace of calcium. Radium studies in bones so farhave remained scarce (Wrenn et al. 1985; Mirka
Fig. 11. Plant and tree ECRa v. ECRa of the closest soil sample, when one soil sample is available at a distance ofless than 100 m.
ECRa IN ROCKS, SOILS, PLANTS AND BONES
by guest on November 22, 2016http://sp.lyellcollection.org/Downloaded from

et al. 1996), but a renewed interest has recently beennoticed (Solecki et al. 2015). Here, we report on 26animal bone samples, obtained from local shops,and, surprisingly, all samples were easy to measureusing the standard method. The average ECRa valuefor our bone samples was significant, at2.7 + 0.7 Bq kg21, and the range of valuesextended from 0.21 + 0.17 to 19.4 + 1.2 Bq kg21
(Fig. 10c). The smaller ECRa value was obtainedfor pork rib bones, and the larger value for beeftibia pieces sold for bone marrow. These beefbones were obtained from a commercial food dis-tributor, which did not enable individual animalsto be tracked, and so, consequently, were of anunknown origin. One given batch of samples wascharacterized by similar ECRa values, suggest-ing that one animal may have been characterizedby a specific ECRa value. All pieces of beef bonesdefinitely gave ECRa values of .1 Bq kg21, whilehuman teeth were characterized by ECRa ¼0.255 + 0.067 Bq kg21. Why some beef bonesshowed such high radium concentration remainsunclear at this stage, except the fact that these ani-mals must have consumed either grass or meat-and-bone meal or groundwater with a high radiumcontent, or all of the above. Bone composition canbe rather diverse, but one major component ishydroxyapatite, which may offer an interesting ana-logue, at least with respect to radium chemistry, forcarbonate precipitation.
Direct measurement of radon emanation
coefficient
When concerned only with the radon source term,then ECRa is the relevant quantity. However, wheninvestigating the geological or biological meaningof ECRa results, it can be helpful to separate theradium concentration, CRa, which is a purely chem-ical component, from the emanation coefficient, E, aquantity (defined between 0 and 1) that reflects thetexture and microstructure of the porous medium(Tanner 1964; Adler & Perrier 2009). Radium con-centration, CRa, can be separately measured bygamma spectroscopy (Pereira et al. 2012), thevalue of E can then be inferred once ECRa is mea-sured (Ferry et al. 2002). This is actually the stan-dard method to measure E (Sakoda et al. 2011).However, measuring with gamma spectroscopyrequires destruction of the original rock sample, toproduce fine powders, which obviously has to beavoided in the case of precious samples. In suchcases, conversely, CRa can be inferred from ECRa
using some knowledge of E. In the following, wepresent such an alternative method that can beused in some cases, when a sufficiently reliableknowledge of E can be obtained from a similar
sample. Thus, once ECRa of a given precious sampleis measured, CRa is derived using the E value esti-mated for this sample type.
To estimate E, the following method is proposed.First, the effective activity ECRaI of some sample ofa given material of mass m is measured, and thenthis porous sample is soaked with a known quantityof a radium-rich solution of known concentration,corresponding to some injected radium activity,ARa. The water is then evaporated, and the measure-ment of the effective activity ECRaF is repeated. Topreserve the sample, the water is evaporated pas-sively at ambient room temperature. The inferredvalue, Emeas, of the emanation coefficient in thepresence of the injected radium is then:
Emeas = mECRaF − ECRaI
ARa
(2)
Two types of such measurements have been per-formed. In the first type of experiments, we selectedcrystals that are soluble in water. First, their ECRa
was measured, and then we dissolved the crystalsin the reference radium solution. The crystals, nowincorporating radium, were then recreated whencrystallization occurred during evaporation. In thiscase, the radium was distributed over the wholesolid material, more or less homogeneously. Oneexperiment was performed using common salt(NaCl) and one with baking sugar (saccharose).The results (Table 2) were similar, giving an emana-tion coefficient, E, of about 0.1, illustrating the lossof radon when radium gets incorporated within acrystal lattice. This is compatible with measure-ments with mineral crystals, which, however, tend
Table 2. Determination of the radon-222 emanationcoefficient by doping experiments with radium-226solution and subsequent measurements of ECRa
Material E n
Crystallization experimentsSugar (saccharose) 0.145 + 0.011 1Salt (NaCl) 0.081 + 0.009 1Sands 0.242 + 0.035 6Measurements with plantsOak tree leaves 0.95 + 0.08 2Broccoli 0.828 + 0.082 1Oak tree core wood 0.82 + 0.07 2Average all plant samples 0.862 + 0.044 5Artificial fibre materialsFilter paper 0.74 + 0.05 2Vegetal sponges 0.69 + 0.04 9Printer paper 0.63 + 0.03 6Soaking tissue 0.52 + 0.03 6Blotting paper 0.72 + 0.06 4Average of all fibre materials 0.626 + 0.017 27
F. PERRIER ET AL.
by guest on November 22, 2016http://sp.lyellcollection.org/Downloaded from

to give values that can sometimes be as small as 1 or0.1% (Sakoda et al. 2011).
In the second type of experiments, the porousmaterial was soaked by the reference radium solu-tion without disturbing the structure of the initialsolid material. A total of 32 such experimentswere performed (Table 2). For sands, we obtaineda mean value of ES ¼ 0.242 + 0.035, in agreementwith the commonly accepted value of 0.25 for soils(Sakoda et al. 2011). This comparatively large valuesuggests that, in most soils, radium is accumulatedon the surface of mineral grains, with a negligiblefraction incorporated inside them (Adler & Perrier2009). Thus, radon emanation from soils wouldmainly result from secondary radium deposition.
With dry plant materials, we have obtained(Table 2) rather large values of E, with an averageof EP ¼ 0.862 + 0.044. Large values were, in fact,expected because, in a cellular biological material,it is unlikely that a radon atom, emitted after radiumdecay, can be trapped within a closed mineral net-work. The obtained value of E, which is slightlyless than 1, suggests, instead, the presence ofradon adsorption, which is enhanced in the absenceof water (Meslin et al. 2011). Values are signifi-cantly smaller for artificial fibre materials than forplants (Table 2), with an average value of0.626 + 0.017. Such values can probably also beinterpreted as representing a more significant contri-bution of radon adsorption.
Taking the mean values of E determined fromplants (EP) and sands (ES), we derived experimental
values of the soil-to-plant transfer ratio, RSP, fromthe previously determined ratio ECRaP/ECRaS:
RSP = ES
EP
ECRaP
ECRaS
(3)
The values varied from 0.002, and even smaller, to 1(Fig. 12). The statistics remain limited (n ¼ 39), butsome values clustered around 0.02 and around 0.3. Itis too early to draw conclusions on the differencesbetween tree and plant species in a given soil con-text, but the method appears definitely to be a pow-erful and cost-effective means of studying radiumaccumulation in plants, which could be of impor-tance for the remediation of polluted sites (Soudeket al. 2007, 2010).
Conclusion and perspectives
In this paper, we have presented general results ofthe radon emanation potential of various naturalmaterials, such as rocks, soils, plants and bones.While the measurement methods have been knownfor decades, the efforts have been concentrated onmethodological issues with a limited numbers ofsamples, such as granites and rocks considered forgeological waste storage (Ferry et al. 2002).Recently, a reliable and efficient method using scin-tillation flasks (Girault & Perrier 2012a) has beendeveloped, and more than 11 000 accumulationexperiments have been carried out and more than
Fig. 12. Distribution of the soil-to-plant radium-226 transfer ratio, inferred from the measurements of ECRa and theemanation coefficients obtained from doping experiments.
ECRa IN ROCKS, SOILS, PLANTS AND BONES
by guest on November 22, 2016http://sp.lyellcollection.org/Downloaded from

3300 samples have been studied systematically. Themeasurement of ECRa, interesting in itself for radontransport modelling (Girault & Perrier 2014) orhealth hazard assessment (Girault & Perrier 2012c;Perrier & Girault 2013), also appears as an interest-ing parameter, considerably easier to measure thanradium concentration, with the additional, some-times crucial, advantage of keeping the sample inits original condition.
In the case of rocks, a significant number ofresults allowing statistical analysis is already avail-able, with 1351 measured rock samples and ECRa
values that cover several orders of magnitude fromthe detection level, on average 0.03 Bq kg21 withour standard technique, to more than 103 Bq kg21,excluding uranium ore minerals characterized byvalues larger than 106 Bq kg21. Smaller variationswithin rock groups are also of great significance.Indeed, the geological potential of ECRa has nowbeen clearly demonstrated to distinguish rocktypes or to reveal geological processes. It might beimportant, for future applications, to study in detailthe differences that are sometimes observedbetween ECRa values of intact and crushed samples.
Geological applications can now be consideredbroadly in a systematic fashion. The availableresults suggest that promising contributions maybe made to a number of geological questions. Inthe case of granites, which are particularly easy tomeasure, a promising systematic study of Variscangranites is suggested. The tentatively impressivecorrelations at large distances (.3000 km) need tobe confirmed. Furthermore, in a given region, itmight be possible to distinguish different graniticbodies using specific ECRa properties. The factthat ECRa contains one purely chemical part (CRa)and one textural part (E) resulting from the porousmedium, thus, appears as an asset rather than alimitation.
While more difficult to study because of theirlower radium content, the measurement of ECRa inmantellic components might have powerful appli-cations: for example, in the case of lavas. Differentlava flows are, indeed, characterized by specificradioelements (Allegre & Condomines 1982). Asystematic investigation of known and dated lavaflows might indicate that ECRa measurements wouldhave a wider application in volcanology.
Applications of ECRa to calcareous rocks havealso barely started. Potential applications, however,are of great interest and should be given sufficientattention in the future. Limestones, indeed, arehosts to important sites, such as painted caves andprecious underground ecosystems. In such sites,the radon concentration has been measured exten-sively to study the microclimatic conditions, whichare essential to understand when considering pre-servation (Bourges et al. 2014). Radon transport,
however, needs a better understanding of the sourceterm from the encasing rocks, which, especially insuch sites, competes with radon released fromgroundwater.
In the case of soils, more than 1500 samples havenow been measured and, in this case too, the disper-sion of values is a major question to address whenattempting detailed interpretations. However, theECRa values of common soils tend to be less variablethan the ECRa of rocks, with most values fallingbetween 4 and 20 Bq kg21. Dark soils rich in ironoxides or organic matter were characterized by val-ues ranging commonly up to 20 Bq kg21 (Giraultet al. 2011a). The relevance of ECRa for sedimen-tary studies, demonstrated in the Kathmandu Valley(Girault et al. 2011a), can now be applied in a moreextensive manner in Quaternary geology. With largenumbers of samples processed routinely, 2D map-ping can now be attempted in dedicated cases.
Further interesting applications can be consid-ered using samples from the biosphere. Measure-ments of ECRa of plants are for the moment lessnumerous than for rocks and soils, with a total of85 ECRa values available. Contrary to expectations,such samples were actually easy to measure and therange of values extended from the detection limit tomore than 30 Bq kg21. Large values were observedfor moss and tree samples growing on a graniticdomain, suggesting that significant radium transportand, consequently, ECRa could be a proxy for heavymetal transfer from soil to the biosphere – essentialknowledge in contamination and remediation stud-ies. Our initial results raised new questions. Forexample, is there a characteristic value for a giventree, and for its fruits, seeds, roots, sap wood, bark,branches and leaves? Are there significant and sys-tematic differences between tree species in a givensoil condition?
The value of the emanation coefficient for soilsremains a difficult problem (Tanner 1964). Whilethere is consensus for a typical average value ofaround 0.25 (Sakoda et al. 2011), values can varyfrom a few per cent up to 50%. By contrast, we mea-sured that emanation coefficient values for plantsamples clustered around 0.86. Tentatively, wedetermined values of the radium-226 soil-to-planttransfer ratio from our ECRa measurements, butthe answer to the question concerning different treespecies in a given soil condition needs to be deter-mined from dedicated investigations.
The fact that ECRa was found to be relativelylarge for all tree branch samples suggests anotherdomain of application. Indeed, radon emanationfrom wood artefacts could be investigated usingaccumulation experiments, as already successfullyapplied in the case of dial watches (Gillmore et al.2012). The advantage of radon emanation is that itdoes not affect the sample in any manner: pieces
F. PERRIER ET AL.
by guest on November 22, 2016http://sp.lyellcollection.org/Downloaded from

of furniture, statues, weapons or other precious sam-ples of historical or archaeological interest can beinvestigated without any risk of damage.
Similarly, our initial measurements with bonesopen up numerous unexpected perspectives. Thestatistics remains limited (n ¼ 26), but all sampleswere measured without difficulty and values of.2 Bq kg21 were observed for most beef bone sam-ples. These initial results suggest that there is tre-mendous interest in studying in detail the radonemanation from animal samples. Human boneshave not yet been studied, except for teeth.
Further improvements of the ECRa measurementtechnique could lead to significant improvements inthe detection limit (e.g. using longer counting ses-sions). Such improvements could open up novel per-spectives such as high-sensitivity measurements ofsamples with low radium content (e.g. some gneiss,limestone, lava or extraterrestrial samples). Effec-tive radium concentration, beyond the recentlyrenewed interest, could then become one of themost significant indices to characterize porousmaterials. This could then open up a new age forradon emanation studies for geological applicationsor for the investigation of the biosphere as part of anew generation of methods to be developed for thepreservation of the environment and for understand-ing the critical zone.
Benoit Heumez, Eric Parmentier, and Xavier Lalanne arethanked for their help in the sampling of soils and sedi-ments in the compound of the National Magnetic Observa-tory at Chambon-La-Foret, France. Gavin Gillmore isthanked for reference samples from Kingston University.The original manuscript was greatly improved thanks tothe outstanding detailed work of two reviewers. This isIPGP contribution No. 3731.
References
Adler, P.M. & Perrier, F. 2009. Radon emanation in par-tially saturated porous media. Transport in PorousMedia, 78, 149–159.
Allegre, C.J. & Condomines, M. 1982. Basalt genesisand mantle structure studied through Th-isotopes geo-chemistry. Nature, 299, 21–24.
Allegre, C.J. & Lewin, E. 1995. Scaling laws and geo-chemical distributions. Earth and Planetary ScienceLetters, 132, 1–13.
Barbosa, S.M., Lopes, F., Correia, A.D., Barbosa, S.,Pereira, A.C. & Neves, L.F. 2015. Temporal variabil-ity of radon in a remediated tailing of uranium ore pro-cessing – the case of Urgeirica (central Portugal).Journal of Environmental Radioactivity, 142, 14–23.
Bossew, P. 2010. Radon: exploring the log-normal mys-tery. Journal of Environmental Radioactivity, 101,826–834.
Bourges, F., Genthon, P., Genty, D., Lorblanchet,M., Mauduit, E. & D’Hulst, D. 2014. Conservationof prehistoric caves and stability of their inner climate:
lessons from Chauvet and other French caves. Scienceof the Total Environnement, 493, 79–91.
Buccianti, A. 2015. Frequency distributions of geochem-ical data, scaling laws, and properties of compositions.Pure and Applied Geophysics, 172, 1851–1863.
Cigolini, C., Poggi, P. et al. 2009. Radon surveys andreal-time monitoring at Stromboli volcano: influenceof soil temperature, atmospheric pressure and tidalforces on 222Rn degassing. Journal of Volcanologyand Geothermal Research, 184, 381–388.
Cigolini, C., Laiolo, M. & Coppola, D. 2015. The LVDsignals during the early-mid stages of the L’Aquilaseismic sequence and the radon signature of someaftershocks of moderate magnitude. Journal of Envi-ronmental Radioactivity, 139, 56–65.
Darby, S., Hill, D. et al. 2005. Radon in homes and riskof lung cancer: collaborative analysis of individualdata from 13 European case-control studies. BritishMedical Journal, 330, 223–228.
Ferry, C., Richon, P., Beneito, A. & Robe, M.C. 2001.Radon exhalation from uranium mill tailings: experi-mental validation of a 1-D model. Journal of Environ-mental Radioactivity, 54, 99–108.
Ferry, C., Richon, P., Beneito, A., Cabrera, J. &Sabroux, J.-C. 2002. An experimental method formeasuring the radon-222 emanation factor in rocks.Radiation Measurements, 35, 579–583.
Fieller, N.R.J., Flenley, E.C., Gilbertson, D.D. &Thomas, D.S.G. 1990. Dumb-bells: a plotting conven-tion for ‘mixed’ grain size populations. SedimentaryGeology, 69, 7–12.
Gillmore, G., Alizadeh Gharib, H., Denman, A., Phil-
lips, P. & Bridge, D. 2011. Radon concentration inabandoned mines, Cumbria, UK: safety implicationsfor industrial archaeologists. Natural Hazards andEarth System Sciences, 11, 1311–1318.
Gillmore, G.K., Crockett, R., Denman, T., Flowers,A. & Harris, R. 2012. Radium dial watches, a poten-tially hazardous legacy? Environment International,45, 91–98.
Girault, F. & Perrier, F. 2011. Heterogeneous tempera-ture sensitivity of effective radium concentration withvarious rock and soil samples. Natural Hazards andEarth System Sciences, 11, 1619–1626.
Girault, F. & Perrier, F. 2012a. Measuring effec-tive radium concentration with large numbers ofsamples Part I – Experimental method and uncertain-ties. Journal of Environmental Radioactivity, 113,177–188.
Girault, F. & Perrier, F. 2012b. Measuring effectiveradium concentration with large numbers of samplesPart II – General properties and representativity. Jour-nal of Environmental Radioactivity, 113, 189–202.
Girault, F. & Perrier, F. 2012c. Estimating the impor-tance of factors influencing the radon-222 flux frombuilding walls. Science of the Total Environment,433, 247–263.
Girault, F., Bollinger, L. et al. 2014a. Large-scaleorganization of carbon dioxide discharge in theNepal Himalayas. Geophysical Research Letters, 41,6358–6366, https://doi.org/10.1002/2014GL060873
Girault, F., Perrier, F. et al. 2014b. The Syabru-Bensihydrothermal system in central Nepal: 1. Characteriza-tion of carbon dioxide and radon fluxes. Journal of
ECRa IN ROCKS, SOILS, PLANTS AND BONES
by guest on November 22, 2016http://sp.lyellcollection.org/Downloaded from

Geophysical Research Solid Earth, 119, 4017–4055,https://doi.org/10.1002/2013JB010301
Girault, F. & Perrier, F. 2014. The Syabru-Bensihydrothermal system in central Nepal: 2. Modelingand significance of the radon signature. Journal ofGeophysical Research Solid Earth, 119, 4056–4089.
Girault, F., Gajurel, A.P., Perrier, F., Upreti, B.N. &Richon, P. 2011a. Radon emanation of heterogeneousbasin deposits in Kathmandu Valley, Nepal. Journal ofAsian Earth Sciences, 40, 595–610.
Girault, F., Poitou, C., Perrier, F., Koirala, B.P. &Bhattarai, M. 2011b. Soil characterization usingpatterns of magnetic susceptibility versus effectiveradium concentration. Natural Hazards and Earth Sys-tem Sciences, 11, 2285–2293.
Girault, F., Perrier, F. et al. 2012. Effective radiumconcentration across the Main Central Thrust in theNepal Himalayas. Geochimica et CosmochimicaActa, 98, 203–227.
Girault, F., Perrier, F. et al. 2014. The Syabru-Bensihydrothermal system in central Nepal: 1. Characteriza-tion of carbon dioxide and radon fluxes. Journal ofGeophysical Research, 119, 4017–4055.
Menon, S.R., Sahoo, B.K., Balasundar, S., Gaware,J.J., Jose, M.T., Venkatraman, B. & Mayya, V.S.2015. A comparative study between the dynamicmethod and passive can technique of radon exhalationmeasurements from samples. Applied Radiation Iso-topes, 99, 175–178.
Meslin, P.Y., Sabroux, J.-C., Bassot, S. & Chasse-
fiere, E. 2011. Experimental study of radon produc-tion and transport in an absolute analogue for theMartian regolith. Geochimica et Cosmochimica Acta,75, 2256–2270.
Mirka, M.A., Clulow, F.V., Dave, N.K. & Lim, T.P.1996. Radium-226 in cattails, Typha latifolia, andbone of muskat, Ondatra zibethica (L.), from a water-shed with uranium tailings near the city of Elliot Lake,Canada. Environmental Pollution, 91, 41–51.
Nicolas, A., Girault, F., Schubnel, A., Pili, E., Passe-
legue, F., Fortin, J. & Deldicque, D. 2014. Radonemanation from brittle fracturing in granites underupper crustal conditions. Geophysical Research Let-ters, 41, 5436–5443.
Pearson, J.E. & Jones, G.G. 1966. Soil concentrationof “emanating radium-226” and the emanation ofradon-222 from soils and plants. Tellus, 18, 655–662.
Pereira, A.J.S.C., Godinho, M.M. & Neves, L.J.P.F.2010. On the influence of faulting on small-scale soil-gas radon variability: a case study in the IberianUranium Province. Journal of Environmental Radioac-tivity, 101, 875–882.
Pereira, D., Neves, L., Pereira, A., Peinado, M.,Blanco, J.A. & Tejado, J.J. 2012. A radiologicalstudy of some ornamental stones: the bluish granitefrom Extremadura (Spain). Natural Hazards andEarth System Sciences, 12, 395–401.
Perrier, F. & Girault, F. 2012. Measuring effectiveradium concentration with less than 5 g of rock or soil.Journal of Environmental Radioactivity, 113, 45–56.
Perrier, F. & Girault, F. 2013. Harmonic response ofsoil radon-222 flux and concentration induced by baro-metric oscillations. Geophysical Journal International,195, 945–971.
Porstendorfer, J. 1994. Properties and behaviour ofradon and thoron and their decay products in the air.Journal of Aerosol Sciences, 25, 219–263.
Przylibski, T.A. 2011. Shallow circulation groundwater –The main type of water containing hazardous radonconcentration. Natural Hazards and Earth System Sci-ences, 11, 1695–1703.
Przylibski, T.A. & Gorecka, J. 2014. 222Rn activity con-centration differences in groundwaters of three Varis-can granitoid massifs of the Sudetes (NE BohemianMassif, SW Poland). Journal of Environmental Radio-activity, 134, 43–53.
Sakoda, A., Hanamoto, K., Ishimori, Y., Nagamatsu,T. & Yamaoka, K. 2008. Radioactivity and radon ema-nation fraction of the granites sampled at Misasa andBadgastein. Applied Radiation and Isotopes, 66,648–652.
Sakoda, A., Ishimori, Y., Hanamoto, K., Kataoka, T.,Kawabe, A. & Yamaoka, K. 2010. Experimentaland modeling studies of grain size and moisture con-tent effects on radon emanation. Radiation Measure-ments, 45, 204–210.
Sakoda, A., Ishimori, Y. & Yamaoka, K. 2011. A com-prehensive review of radon emanation measurementsfor mineral, rock, soil, mill tailing and fly ash. AppliedRadiation and Isotopes, 69, 1422–1435.
Solecki, J., Misztal, M., Skupinski, S. & Solecki, M.2015. Determination of radionuclides in samples ofmiddle-aged and older human femurs. Journal of Envi-ronmental Radioactivity, 143, 85–90.
Soudek, P., Petrik, P., Vagner, M., Tykva, R., Plojhar,V., Petrova, S. & Vanek, T. 2007. Botanical surveyand screening of plant species which accumulate226Ra from contaminated soil of uranium wastedepot. European Journal of Soil Biology, 43, 251–261.
Soudek, P., Petrova, S., Benesova, D., Kotyza, J.,Vagner, M., Vankova, R. & Vanek, T. 2010. Studyof soil–plant transfer of 226Ra under greenhouse condi-tions. Journal of Environmental Radioactivity, 101,446–450.
Stoulos, S., Manolopoulou, M. & Papastefanou, C.2003. Assessment of natural radiation exposure andradon exhalation from building materials in Greece.Journal of Environmental Radioactivity, 69, 225–240.
Stoulos, S., Manolopoulou, M. & Papastefanou, C.2004. Measurement of radon emanation factor fromgranular samples: effects of additives in cement.Applied Radiation and Isotopes, 60, 49–54.
Tanner, A.B. 1964. Radon migration in the ground: areview. In: Adams, J.A.S. & Lowder, W.M. (eds)The Natural Radiation Environment. University ofChicago Press, Chicago, IL, USA, 161–190.
Vandenhove, H., Olyslaegers, G., Sanzharova, N.,Shubina, O., Reed, E., Shang, Z. & Velasco, H.2009. Proposal for new best estimates of the soil-to-plant transfer factor for U, Th, Ra, Pb and Po. Journalof Environmental Radioactivity, 100, 721–732.
Walia, V., Su, T.C., Fu, C.C. & Yang, T.F. 2005. Spatialvariations of radon and helium concentrations in soil-gas across the Shan-Chiao fault, Northern Taiwan.Radiation Measurements, 40, 513–516.
Walia, V., Mahajan, S., Kumar, A., Singh, S., Bajwa,B.S., Dhar, S. & Yang, T.F. 2008. Fault delineationstudy using soil-gas method in the Dharamsala area,
F. PERRIER ET AL.
by guest on November 22, 2016http://sp.lyellcollection.org/Downloaded from

NW Himalayas, India. Radiation Measurements, 43,S337–S342.
Weinlich, F.H., Stejskal, V., Teschner, M. & Poggen-
burg, J. 2013. Geodynamic processes in the NWBohemian swarm earthquake region, Czech Republic,identified by continuous gas monitoring. Geofluids,13, 305–330.
Willey, N.J. 2014. Soil to plant transfer of radionuclides:predicting the fate of multiple radioisotopes in plants.Journal of Environmental Radioactivity, 133, 31–34.
Wrenn, M.E., Durbin, P.W., Howard, B., Lipsztein, J.,Rundo, J., Still, E.T. & Willis, D.L. 1985. Metabo-lism of ingested U and Ra. Health Physics 48,601–633.
ECRa IN ROCKS, SOILS, PLANTS AND BONES
by guest on November 22, 2016http://sp.lyellcollection.org/Downloaded from

![Resort Municipality Initiative - Radium Hot Springs 2014 Annual RMI... · Resort nicipal Initiative Report for Year 2014 - Village of Radium Hot Springs - [1] Radium Resort Municipality](https://img.dokumen.tips/doc/110x75/5b880db67f8b9a3d028c72be/resort-municipality-initiative-radium-hot-2014-annual-rmi-resort-nicipal.jpg)