Embed Size (px)
Citation preview

British Journal of Marketing Studies
Vol.3, No.6, pp.43-62, July 2015
Published by European Centre for Research Training and Development UK (www.eajournals.org)
43
ISSN 2053-4043(Print), ISSN 2053-4051(Online)
EFFECT OF SERVICE QUALITY DIMENSIONS ON CUSTOMER SATISFACTION:A
COMPARATIVE ANALYSIS OF PAKISTAN TELECOM SECTOR
Muhammad Arslan1
M.Phil Scholar
Bahria University Islamabad, Pakistan
PO box 44000, E-8, Islamabad, Pakistan
Maria Iftikhar2 (Corresponding Author)
M.Phil Scholar
Bahria University Islamabad, Pakistan
PO box 44000, E-8, Islamabad, Pakistan
Tel: 00923017230506
Rashid Zaman3
M.Phil Scholar
Bahria University Islamabad, Pakistan
PO box 44000, E-8, Islamabad, Pakistan
ABSTRACT: The purpose of this study is to establish the relationship between service quality
and customer satisfaction. Two main dimensions of service quality were taken i.e. reliability and
empathy. This is a quantitative analysis and the data was collected in the form of communication-
based questionnaires. The sample size was 400 respondents and four main telecom service
providers were considered for the study. The results were calculated by analytical software SPSS-
20. It was concluded that service reliability and service empathy both have an effect on customer
satisfaction. It was also determined that some factors were more satisfactory than the others. The
findings of study reveal that percentages of customer satisfaction change with the service quality
dimensions of reliability and empathy. Overall, it can be established that there is a significant
relationship between customer satisfaction and service quality dimensions of empathy and
reliability.
KEYWORDS: Service Quality, Empathy, Reliability, Customer satisfaction.
INTRODUCTION
The purpose of this study is to establish a relationship between service quality dimensions and
customer satisfaction for telecom sector of Pakistan. Two of the service quality dimensions based
on SERVQUAL model are taken as independent variables while customer satisfaction is the
dependent variable for this research. Telecom sector of Pakistan has been taken as a unit of analysis
and four major telecom service providers are taken for comparative study. The telecom sector of
Pakistan has flourished rapidly within past few years and has made big contribution to Pakistan’s

British Journal of Marketing Studies
Vol.3, No.6, pp.43-62, July 2015
Published by European Centre for Research Training and Development UK (www.eajournals.org)
44
ISSN 2053-4043(Print), ISSN 2053-4051(Online)
economy. In 2007, telecom industry grew by approximately 80% whereas average growth after
2007 has observed to be more than 100 percent. About 98 million people are found to be mobile
customers in Pakistan as of 2010. Telecom industry has been the source for generating about 327.8
billion rupees in the economy and is currently one of the most greatly taxed sectors of the country.
People now are relying on cell phones more than anything else. The telecom service providers are
continuously coming up with different call, messaging, internet and other packages to generate
better revenues for their respective companies. However, more revenues can be generated only
when the demands of target market are met. Customer satisfaction is the key to success for any
company dealing with products and services.
Service quality is said to be one of the major contributors of customer satisfaction and therefore it
is given importance in service sector. A lot of research has been taking place for the past two
decades which has thrown light on the link between customer satisfaction and service quality.
Various theories and frameworks have been presented but the work by Zeithaml, Parasuraman and
Berry (1988) is of prime importance. They introduced SERVQUAL model for analyzing and
improving the quality for service organizations. SERVQUAL model has been used a lot in the
service sector especially in the restaurants (Parasuraman, et al., 1988). Empirical work on service
quality and customer satisfaction has been done by various researchers including Spreng and
Mackoy (1996), Jones and Suh (2000), Coyles and Gokey (2002) and Choi et al., 2004. A lot of
literature can be found on these variables from countries like USA, UK, Canada or China; however
there is a dearth of literature on service quality and service satisfaction in Pakistan. A limited work
has been done to establish the link between these two variables. Therefore, the aim of this study is
to cover the gap by presenting empirical evidence for the telecom sector of Pakistan.
This is a quantitative research based on positivist philosophy and a deductive research approached
is followed. Primary data is collected via questionnaires distributed among the mobile service
customers. As this is a comparative analysis of four telecom companies, the sample size is kept
large. The questionnaire is adapted from study of Zeithaml et al. (1996) and Stevens (1995) and
reveals the service quality dimensions of empathy and reliability and customer satisfaction. The
next section of the paper gives a comprehensive review of literature about the (Jones & Su (Taylor
& Baker,, 1994)h,, 2000) (Coyles & Gokey,, 2002) theories and models already established by
previous researchers. The third section gives the theoretical framework representing the variables
and proposed link between them. Also the research methodology would be incorporates in it. The
fourth section gives analysis of data, results and interpretation finally followed by last section of
the paper which will present limitations and implications for future research.
LITERATURE REVIEW
A number of studies have been conducted to explore the link between service quality and customer
satisfaction. A recent Nigerian study by Ojo (2010) says that in order to maintain high levels of
customer satisfaction, it is mandatory for the organization to update its services according to the
expectations of customers. Not only the goal should be meeting the demands, but competitive
advantage comes with exceeding the demands of the customer (Ojo, 2010). This derives customer
satisfaction for long-term customer retention. Also it has been found that the costs to attract new

British Journal of Marketing Studies
Vol.3, No.6, pp.43-62, July 2015
Published by European Centre for Research Training and Development UK (www.eajournals.org)
45
ISSN 2053-4043(Print), ISSN 2053-4051(Online)
customers and retain the existing ones, there should be an appropriate method to register the
feedback of the customers so that the suggestions can be implemented upon. As customer focused
strategy is now considered a means of attaining competitive edge (Taylor and Baker, 1994), the
measurement of quality is particularly essential to devise and implement a customer oriented
service (MacStravic, 1977). However, if a service constantly fails to satisfy the customer, its
existence is severely threatened. This is because customer who experiences a bad service will most
probably relate this experience to others (Griffin, 1995). An average Asian company has a chance
of losing about 20% of its customers every year (Ojo, 2010). Also cost of acquiring new customers
is far more than retaining the already existing customers (Gitomer, 1998).
Customer Satisfaction
Customer satisfaction is key to any organization’s success means that this success is directly
associated with the demands of the customer. Tremendous methods have been applied to enhance
the customer experiences and most of the monitoring and controlling activities have a link with
marketing measures. Satisfaction can be termed as a short lived emotional condition that occurs
from an intrapersonal assessment of the customer’s perception with any service incident (Oliver,
1981, Brady and Robertson, 2001; Lovelock (2001). Furthermore, the customer satisfaction can
be rationalized as the person’s emotion of contentment or disappointment as a result of comparison
of his expectation to the experience. Service satisfaction further has two general conceptualizations
1) transaction specific satisfaction and 2) cumulative satisfaction (Jones and Suh, 2000; Yi and
Lia, 2004). Transaction-specific satisfaction can be referred to the customer’s assessment of the
service encounter he has and the resultant reaction because of this encounter (Boshoff and Gray,
2004). Whereas cumulative satisfaction according to Cook (2008) can be defined as customer’s
assessment of the overall service experience to the date. Customer satisfaction is an intensively
researched area which has been subject to discussions for more than 2 decades. Currently, this
phenomenon has shifted from transactional marketing to relationship marketing (Martin, Adrian
and David, 2002) which means that all marketing measures are now aiming towards creating,
developing and adhering to successful relational exchanges with the customers (Yi and La, 2004).
According to Thomas and Getty, 1994), quality is also based on intrinsic expectation standard of
an individual and as it is a self-motivated construct; more and more customer perceptions bring
modifications in it.
Service Quality
Service quality does cannot have one specific definition as this phenomenon is with respect to
whether expectations of the customers are fulfilled or not (Zeithaml, Berry and Parasuraman,
1993). There are however, clear conceptualizations given by various researchers about the quality
of service (Holbrook, 1994). For instance in operational management, quality is been explained in
terms of reliability and fitness whereas service quality is measured in terms of product attributes
in terms of economics. When talking about service quality, whole service experience is taken into
account which generates service satisfaction or dissatisfaction (Parasuraman et al., 1985).
Zeithaml, Parasuaman and Berry (1988) defined service quality as a level and extent of difference
between the perceptions that customer has and his expectations. In order words, it is about
conforming to the expectations of customers (Mevvis and Janiszewski, 2002). By measuring the
quality of service, a company is able to analyze its position among the competitors to maintain

British Journal of Marketing Studies
Vol.3, No.6, pp.43-62, July 2015
Published by European Centre for Research Training and Development UK (www.eajournals.org)
46
ISSN 2053-4043(Print), ISSN 2053-4051(Online)
strategic edge. Assessing the service quality means knowing the strengths and weaknesses of
service which will help to devise new techniques to eliminate those weaknesses. The quality of
service can (Dabholkar, 1995) (Soderlund & Ohman,, 2003)be maintained by following the total
quality management techniques but most effective way is to take frequent customer feedback and
make necessary adjustments in the service to avoid discomfort (Lovelock, Patterson and Walker,
2001).
A detailed research on the service quality was conducted by Parasuraman, Zeithaml and Berry
(1988) who distributed formal surveys among the customers related to different focus groups. They
came up with the model of SERVQUAL used for measuring five dimensions of service quality
namely reliability, assurance, tangibility, responsiveness, and empathy. These researchers
afterwards examined the service quality through a 22 items scale made to measure customer
perception based on five dimensions used for assessing the service quality. SERVQUAL is said to
be an appropriate measure to gear up a company for quality improvement by specifying the areas
which need attention (Berry et al., 1994). These areas most likely would categorize under one or
more of the five service quality dimensions and hence are measurable through the SERVQUAL
scale.
SERVQUAL Instrument
The objective measure of service quality is difficult to be exactly suitable for all services because
each service is a set of distinctive characteristics. But SERVQUAL so far has been able to meet
the requirements if various industries and countries and has been used for a variety of services
(Cronin & Taylor, 1994; Babakus & Boller, 1992; Brown & Swartz, 1989). A few researchers are
against the use of SERVQUAL because of its use of gap score, perception measuring, negative
words used, positive and negative worded questions, generalizability of service quality dimensions
and restricting the service quality to a baseline standard good for all (Lai et al., 2007). Once more
critique on SERVQUAL is that some of the minute cultural issues which are not transparent or
easily understandable do effect the customer expectation about the service quality (Kettinger et al.,
1994; Mattila, 1999). In order to improve the reliability aspect of this scale, various studies have
used adjusted this measure in such a way that expectations and perceptions are combined and have
produced good results with the help of this. Andaleeb & Basu (1994) and Dabholkar et al., (2000)
have used this method of adjusting the SERQUAL.
In case of telecommunication industry, the use of SERVQUAL has been found very reliable in
various cultures and business environments (Chen and Aritejo, 2008; Sureschander et al., 2003;
Ojo, 2010; Ayapong, 2011). However, the scale has to be modified for the according to the
requirements of the business environment. For example, in a study by Ward and Mullee (1997),
they added some more quality dimension into the SERVQUAL scale and argued that based on a
customer’s viewpoint it is inappropriate not to consider network quality among other quality
dimensions. Service quality needs to be adjusted according to the mobile network client’s
perspective so that it can be properly measured. A variety of studies have been conducted in which
the quality dimensions have incorporated those aspects which suit the requirements of that country
or industry’s customers. Some of these would be discussed in the next paragraph.

British Journal of Marketing Studies
Vol.3, No.6, pp.43-62, July 2015
Published by European Centre for Research Training and Development UK (www.eajournals.org)
47
ISSN 2053-4043(Print), ISSN 2053-4051(Online)
The quality of mobile services on the global level is measured by GSM, Global System for Mobile
Communication which has presented a number of indicators for the mobile phone service quality.
According to Sutherland (2007) these indicators are 1) access to network, 2) service ease of access,
3) service reliability and 4) service retainability. Service quality dimensions for telecommunication
industry are different than that of restaurant or other services. For example, a Canadian research
in 2007 conducted on a sample of 6000 mobile service users showed that important aspects of
service quality includes the quality of call, billing, prices and bundled packages (Customer
Satisfaction, 2007). A study conducted in 2007 by Organization of Economic Cooperation and
Development (OECD) elicited that the unavailability of correct information about quality and lack
of clear knowledge about the international roaming charges affected the customer’s behavior
adversely. This research highlighted that ‘price’ and ‘quality’ are two leading factors which are
responsible for switching over to new services. Furthermore, it was determined that key factors
which played a role in customers’ dissatisfaction were lack of proper information sharing,
inappropriate pricing, unsolicited calls and not exceeding the customer’s requirements which
means no value addition (DSTI, 2007).
Another study was undertaken by Finland in 2006 and other Scandinavian countries. It was found
out that the imperative drivers of customer’s observation of quality integrated image of the service
and its personnel and the value-added services. Also pricing was considered to be one of the most
important quality aspects (EPSI, 2006). According to Ozher and Aydin (2005), the service quality
features that were responsible for customer satisfaction included fulfilling customers’ pre-
purchase expectations, empathy which means responsiveness to customer’s complaints, value-
added services, effective promotional techniques as well as complaint management.
Through a Greek study by Sigala (2006), it was found that pleasant interaction between customers
and staff, company’s reputation, personalization and customization played a significant role in
setting dimensions of service quality in telecom sector. Consumer surveys conducted by McKinsey
Quarterly (2004), Cap Gemini (2005) and Consumer Reports (2005) established that quality of
network based on data and voice services greatly affect the consumer contentment and loyalty with
respect to the service users. Sube (2012) through a research in Bangladesh instigated that service
quality in the company if more than adequate implies those customers who are exceedingly
satisfied and subscribers that are loyal and contented with the services are ready to recommend
others. Also indulging in new techniques to increase satisfaction and develop strong reputation
entails studying of the correlation among all the variables of service quality which would assist
mobile service providers to uncover the appropriate measures which must be implemented to attain
fidelity of customers (Sube, 2012). This will ultimately lead to increased market share.
Based on the studies conducted by previous researchers, it has been deduced that network quality,
pricing and employee-customer interaction are three dominating factors which contribute to the
service quality in the telecommunication industry. However there is a very limited amount of work
done on service quality in telecommunication in Pakistan’s context. Therefore, the purpose this
paper is to have a detailed analysis of service quality factors in telecom sector. Four major
providers 1) Mobilink 2) Telenor 3) Zong and 4) Ufone would be selected for comparative study.
The next section incorporate the theoretical framework and methodology for the study.

British Journal of Marketing Studies
Vol.3, No.6, pp.43-62, July 2015
Published by European Centre for Research Training and Development UK (www.eajournals.org)
48
ISSN 2053-4043(Print), ISSN 2053-4051(Online)
THEORETICAL FRAMEWORK
In this section, theoretical framework, hypothesis and methodology for the current research is
presented. After the thorough review and analysis of literature, two major variables of service
quality are taken 1) Reliability and 2) Empathy. The theoretical framework is adapted by a study
conducted by Zeithaml, Parasuraman and Berry (1993). The reason of chosing these two service
quality variables is that both reliability and empathy are the most important factors for the
telecommunication service. The unit of analysis is the telecom industry from which 4 main mobile
phone service providers would be tested (Ufone, Zong, Mobilink and Telenor).
The theoretical framework given in figure 1 represents the dependent and independent variables
adapted from a study of Parasuraman, Zeithaml and Berry (1993) and Stevens et al (1995).
Customer satisfaction
Reliability
Empathy
Customer satisfaction has been taken as dependent variable whereas reliability and empathy are
taken as independent variables which are responsible for enhancing customer satisfaction.
Fig 1: Theoretical Framework for the Effect of Service Quality Dimensions on Customer
Satisfaction: A Comparative Analysis of Pakistan Telecom Industry
Independent Variable Dependent Variable
Source: Adapted from Ziethaml, Berry and Parasuranam (1993) and Hennig-Thurau and Klee
(1998).
Hypothesis Formulation
After a detailed literature review, it has been found that reliability and empathy play a major role
in customer satisfaction
Reliability
Reliability is the most important aspect of the service quality. According to Singh (2012),
reliability refers to three important factors 1) accessibility 2) continuity and 3) performance.
Accessibility is the most important aspect which means that the service is available whenever it is
required and desired. In the case of telecom services, it is that the service must be provided
Service Quality
(Reliability,
Empathy)
Customer
Satisfaction

British Journal of Marketing Studies
Vol.3, No.6, pp.43-62, July 2015
Published by European Centre for Research Training and Development UK (www.eajournals.org)
49
ISSN 2053-4043(Print), ISSN 2053-4051(Online)
whenever the customer wants to use it. Calling facility, signals and accessibility to all the options
including the accessibility of service personnel is essential to fulfill the reliability factor of the
service. The second important thing is continuity which means that the service continues to be
available and up to the required standard. Maintenance of standard is imperative for adhering to
the continuity factor. If the service is not continuously reliable, there is a chance that customer will
not trust its reliability and will switch to the other service providers (Zeithaml, 2009). The third
factor refers to performance. It includes high quality service delivery and exceeding the customers’
satisfaction thus gaining their loyalty for longer time. Another factor which contributes strongly
to liability in case of telecom service is the network connection. Strong network connection and
its availability at all times is significant to maintain the high reputation of service (Sutherland,
2007; Sube, 2012).
Empathy
Empathy refers to the attitude of the employees towards the customer. For a service like telecom,
the employees need to maintain good relationship with the customers because much interaction is
involved between the two. The employees need to welcome the customer whenever they call for
any query or complaint. The pleasant behavior of the employees enhances the customer experience
and helps in acquiring good will for the company (Vertugo, 2009). Also timely complaint
management and informing the customers about new packages or service comes under this
category. Empathy brings extra value to the customers and they feel more sense of ownership for
the service.
Both of these dimensions contribute towards the customer satisfaction and competitive advantage
for the company. Following are the hypotheses which are derived from the dependent and
independent variables.
H1: There is a significant relationship between reliability dimension of service quality and
customer satisfaction in telecom sector of Pakistan.
H2: There is a significant relationship between empathy dimension of service quality and customer
satisfaction in telecom sector of Pakistan.
METHODOLOGY
The study is conducted by taking Pakistan as the unit of analysis and four network service
providers are taken for comparative analysis 1) Mobilink 2) Telenor 3) Zong 4) Ufone. This is a
quantitative study followed with a positivist philosophy and deductive research approach. Time
dimension is cross-sectional. The primary data is conducted by distributing the communication
based questionnaires amongst a sample of 440 mobile services users from Pakistan out of 401 were
filled. A sample of 100 individuals has been assigned for each of the telecom company. The
questionnaire used is adapted from a study of Zeithaml, Parasuraman and Berry (1993) and
Hennig-Thurau and Klee (1998). The data was collected in the duration of 4 weeks from the
telecom service users in university, workplace and acquaintances. For the data analysis,
multivariate analysis software SPSS 20 was considered for analysis of multiple response
questionnaires.

British Journal of Marketing Studies
Vol.3, No.6, pp.43-62, July 2015
Published by European Centre for Research Training and Development UK (www.eajournals.org)
50
ISSN 2053-4043(Print), ISSN 2053-4051(Online)
The Cronbach alpha for each of the questionnaire items have been already determined with a few
adjustments according to country’s telecom services. Cronbach alpha is considered to measure the
reliability of the questionnaire instruments (Cronbach, 1951). If the value for Cronbach Alpha is
greater than 0.7 then the instrument is credible for the analysis. As in this study, the Cronbach
alpha for each factor is above 0.6; hence it is used for further study. Each of the questionnaire
items are given in the Appendix.
Table 1: Reliability Analysis
Variables Value of Cronbach Alpha
Reliability 0.801
Empathy 0.874
Customer satisfaction 0.828
RESULTS AND DISCUSSION
Frequency Analysis of Service Reliability
Service reliability is the first independent variable of this study. The frequency analysis for service
reliability is given in Table 2. The entries related to the service reliability were inquired about with
the help of communication based questionnaires (multiple response options) are presented below
The signals are clear
The voice quality is clear and there is no distortion
The service quality is up to my expectations
The service quality can be made better
The call packages are appropriately priced
The sms packages are appropriately priced
Internet service is appropriately priced
Other facilities like caller tunes/sms bundles are appropriately priced
Performs services right the first time
Provides services at the promised time
Keeps customers informed about when services will be performed
Keeps its packages and services up to date

British Journal of Marketing Studies
Vol.3, No.6, pp.43-62, July 2015
Published by European Centre for Research Training and Development UK (www.eajournals.org)
51
ISSN 2053-4043(Print), ISSN 2053-4051(Online)
The frequency analysis for reliability variable is given below
Table 2.1: Frequency Analysis for Service Reliability
Responses Percent of
Cases N Percent
Reliabilitya
Signals are clear 90 4.5% 22.5%
Voice is clear 140 7.0% 35.0%
Service as expected 260 13.1% 65.0%
Service can be better 293 14.7% 73.2%
Call package price 137 6.9% 34.2%
Sms package price 259 13.0% 64.8%
Internet price 99 5.0% 24.8%
Bundles price 187 9.4% 46.8%
Service performance 187 9.4% 46.8%
Service at promised time 181 9.1% 45.2%
Keep customers informed 110 5.5% 27.5%
Packages updated 46 2.3% 11.5%
Total 1989 100.0% 497.2%
The above table shows that out of 1987 responses 293 which is the highest rated option says that
the service can be made better, and second highest rated option of 260 responses say that service
is given as expected. This means that although the respondents are satisfied with the services
provided by their telecom networks yet most say that service can be further made better. 90
responses report that the signal quality is excellent means they never face any signal problems.
Call packages price are reported to be appropriate for 137 responses which means is an average
number means that some are satisfied with prices and some are not. 256 responses are in the favor
of sms packages that is a high number, means that a lot of people are happy with the sms packages.
The responses for internet are just 99 and it needs improvement. 187 responses agree that sms/call
bundles are reliable. 110 responses say that the customers are informed on regular bases about the
service updates.
Frequency Analysis of Service Empathy
The second independent variable taken for this study is service empathy. Figure 2.2 shows the
frequency analysis of service empathy. The multiple response questionnaire items related to the
service empathy are presented below
My call is answered as soon as I call
The managers/employees always have my best at heart
Employees show care and concern while talking to me
The managers/employees give individual attention to my problems and interests
Service personnel always carefully listen to my complains and requests
Complain process is convenient to use
My feedback and suggestions are implemented when possible

British Journal of Marketing Studies
Vol.3, No.6, pp.43-62, July 2015
Published by European Centre for Research Training and Development UK (www.eajournals.org)
52
ISSN 2053-4043(Print), ISSN 2053-4051(Online)
My queries are resolved within time
I get an immediate solution for my complains
The frequency analysis for service is given below:
Table 2.2: Frequency Analysis for Service Empathy and Customer Satisfaction
Responses Percent of Cases
N Percent
Empathya
Call answered immediately 127 7.7% 32.0%
Managers have goodwill 197 11.9% 49.6%
Care and concern 161 9.7% 40.6%
Individual attention 167 10.1% 42.1%
Complains/requests
handled 210 12.7% 52.9%
complain process
convenience 207 12.5% 52.1%
Feedback and suggestions 202 12.2% 50.9%
Queries resolved in time 172 10.4% 43.3%
Immediate solution for
complains 211 12.8% 53.1%
Total 1654 100.0% 416.6%
The frequency analysis for service empathy shows total of 1654 responses. It shows that 211
responses favor that they receive immediate responses at the when they complain. 127 responses
say that the employees answer the call humbly and 197 responses support that managers have good
will for the customers. The responses for care and concern and individual attention are
comparatively low i.e. 161 and 167% respectively which means that these areas need more
attention. 207 responses say that the complain process is convenient to use. 202 responses support
that they have been asked for giving feedback and suggestions when in encounter with service
personnel.
Frequency Analysis of Customer Satisfaction
The frequency analysis for customer satisfaction is given in table 2.3 which is the dependent
variable for the study. The multiple response questionnaire items for customer satisfaction are
given below:
The sms packages satisfaction
The call packages satisfaction
The quality of voice call satisfaction
Signals satisfaction
The speed of messaging satisfaction
The attitude of the employees satisfaction
The pricing satisfaction
The internet bundles satisfaction

British Journal of Marketing Studies
Vol.3, No.6, pp.43-62, July 2015
Published by European Centre for Research Training and Development UK (www.eajournals.org)
53
ISSN 2053-4043(Print), ISSN 2053-4051(Online)
Sms/call international bundles satisfaction
Customer support centre satisfaction Table 2.3: Frequency Analysis for Customer Satisfaction
Responses Percent of Cases
N Percent
Satisfactiona
Sms package is satisfactory 198 6.1% 49.9%
Call package is satisfactory 197 10.3% 49.6%
Voice quality is satisfactory 187 9.8% 47.1%
The signals are satisfactory 210 11.0% 52.9%
Speed of messaging is
satisfactory 190 9.9% 47.9%
Employee attitude is
satisfactory 197 10.3% 49.6%
Pricing satisfaction 193 10.1% 48.6%
Internet bundle satisfaction 116 10.3% 29.2%
International call bundles
satisfaction 21 10.6% 5.3%
Customer support
satisfaction 204 10.6% 51.4%
Recommendation to others 204 1.1% 51.4%
Total 1917 100.0% 482.9%
The above table shows total of 1917 responses for customer satisfaction. Overall 210 reponses
report that the signals are satisfactory. 198 responses have favored that they are satisfied from the
sms packages whereas 197 responses report that call packages are good.197 cases report that the
employee attitude is satisfactory.
Cross tabulation – Hypothesis 1 The purpose of this research is to determine the relationship between the service quality and
customer satisfaction. Service quality dimensions reliability and empathy were chosen as
independent variables. Following is that first hypothesis.
H1: There is a significant relationship between reliability dimension of service quality and
customer satisfaction in telecom sector of Pakistan.
In the first hypothesis service reliability is the independent variable the effect of which is studied
on customer satisfaction that is the dependent variable. This effect is scrutinized through the cross
tabulation of these variables which is presented in the following table.
The cross tabulation has for reliability and satisfaction is divided into table 3.1 and table 3.2.

British Journal of Marketing Studies
Vol.3, No.6, pp.43-62, July 2015
Published by European Centre for Research Training and Development UK (www.eajournals.org)
54
ISSN 2053-4043(Print), ISSN 2053-4051(Online)
Table 3.1: Crosstabulation between Reliability and Customer Satisfaction Satisfactiona
Sms package is
satisfactory
Call package is
satisfactory
Voice quality is
satisfactory
Signal quality is
satisfactory
Speed of
messaging is
satisfactory
Reliabilitya
Signals are clear
Count 28 47 34 37.8%
48 53.3%
36 40.0% % within
$Reliblty 31.1% 52.2%
Voice is clear
Count 35 68 60
43.2%
77
55.4%
64
46.0% % within $Reliblty
25.2% 48.9%
Service as expected
Count 74 127 129
49.8%
143
55.2%
125
48.3% % within
$Reliblty 28.6% 49.0%
Service can be better
Count 78 142 133 45.7%
151 51.9%
141 48.5% % within
$Reliblty 26.8% 48.8%
Call package price
Count 47 76 55
40.4%
67
49.3%
69
50.7% % within $Reliblty
34.6% 55.9%
Sms package price
Count 38 63 40
40.4%
56
56.6%
49
49.5% % within
$Reliblty 38.4% 63.6%
Internet price
Count 86 125 126 48.8%
135 52.3%
121 46.9% % within
$Reliblty 33.3% 48.4%
Bundles price
Count 61 99 90
48.6%
100
54.1%
94
50.8% % within $Reliblty
33.0% 53.5%
Service performance
Count 61 99 90
48.6%
100
54.1%
94
50.8% % within
$Reliblty 33.0% 53.5%
Service at promised time
Count 61 94 84 47.2%
98 55.1%
88 49.4% % within
$Reliblty 34.3% 52.8%
Keep customers
informed
Count 32 50 54
49.5%
61
56.0%
52
47.7% % within $Reliblty
29.4% 45.9%
Packages updated
Count 22 20 24
52.2%
28
60.9%
16
34.8% % within $Reliblty
47.8% 43.5%
Total Count 116 197
187 210 190
The above cross tabulation shows the increasing trend for the call and sms package with respect
to the reliability aspect. This means that service is termed more reliable in terms of call “call
package” instead of “sms packages”. Further talking about the quality again the trend seems to
increase which means that “signal quality” is observed to be more reliable than the “voice quality”.
However, the trend starts decreasing for the sms speed which means that is far less reliable than
both voice and signal quality. Similar kind of trend runs for the remaining table. The trend for
internet prices is also observed to be increasing. It can be seen that the sms packages are least
expected to have any improvements which means that most respondents find sms packages of all
four networks more reliable than any other aspect. Service performance for the call packages is

British Journal of Marketing Studies
Vol.3, No.6, pp.43-62, July 2015
Published by European Centre for Research Training and Development UK (www.eajournals.org)
55
ISSN 2053-4043(Print), ISSN 2053-4051(Online)
observed to be more reliable than for the sms packages; similarly the service performance is found
to be more reliable for the signal as compared to the voice quality. The same decreasing to
increasing trend for “sms packages” and “call and packages” and “voice quality” and “signal
quality” is observed in the entire table, which then decreases in every case for the “speed of
messaging” in all service reliability items.
Table 3.2: Crosstabulation between Reliability and Customer Satisfaction Satisfactiona
Employee
attitude is satisfactry
Pricing
satisfaction
Internet bundle
satisfaction
International call
bundles satisfaction
Customer
support satisfaction
Recommend to
others
Total
Reliabilitya
Signals are clear
Count 49 47
46
51.1%
53
58.9%
44
48.9%
1
1.1%
90
139 % within
$Reliblty 54.4% 52.2%
Voice is clear
Count 74 72 69
49.6%
73
52.5%
69
49.6%
9
6.5%
22
% within $Reliblty
53.2% 51.8%
Service as
expected
Count 131 114 110
43.3%
132
51.0%
136
52.5%
17
6.6%
259
% within
$Reliblty 50.6% 44.0%
Service can be better
Count 146 137 146 50.2%
150 51.5%
146 50.2%
13 4.5%
291 % within
$Reliblty 50.2% 47.1%
Call package
price
Count 63 71 66
48.5%
67
49.3%
73
53.7%
9
6.6%
136
% within $Reliblty
46.3% 52.2%
Sms package
price
Count 45 46 47
47.5%
53
53.5%
47
47.5%
6
6.1%
99
% within
$Reliblty 45.5% 46.5%
Internet price
Count 133 125 121 46.9%
130 50.4%
130 50.4%
14 5.4%
258 % within
$Reliblty 51.6% 48.4%
Bundles price
Count 93 89 87 47.0%
91 49.2%
105 56.8%
10 5.4%
185 % within
$Reliblty 50.3% 48.1%
Service
performance
Count 93 89 87
47.0%
91
49.2%
105
56.8%
10
5.4%
185
% within $Reliblty
50.3% 48.1%
Service at
promised time
Count 92 89 81
45.5%
89
50.0%
95
53.4%
8
4.5%
178
% within
$Reliblty 51.7% 50.0%
Keep customers informed
Count 60 52 57 52.3%
53 48.6%
54 49.5%
7 6.4%
109 % within
$Reliblty 55.0% 47.7%
Package updated
Count 24 22 22
47.8%
26
56.5%
24
52.2%
2
4.3% 46 % within
$Reliblty 52.2% 47.8%
Total Count 199 191
168 204 204 21 397
The above table shows the cross tabulation results for remaining reliability and remaining customer
satisfaction indicators. The above trend shows increase from the employee attitude to pricing for
service reliability. This means that the respondents have favored the employee attitude more over
British Journal of Marketing Studies
Vol.3, No.6, pp.43-62, July 2015
Published by European Centre for Research Training and Development UK (www.eajournals.org)
56
ISSN 2053-4043(Print), ISSN 2053-4051(Online)
the pricing of the packages. The reliability for pricing satisfaction is therefore shown to be less
than reliability for employee attitude dimension. The trend shows sudden decrease for the cases
when coming to the internet prices which means that the reliability for internet prices is found out
to be comparatively less than pricing of employee attitude. Similarly it is less for the customer
support satisfaction and international call bundles but still these values are more than internet
prices. Service for all the cases is said to be performed as expected but it has been reported each
time that it can be further improved.Overall trend goes best for the employees’ attitude and lowest
for the internet bundles. Service reliability in the cases of all four networks has been reported to
be more satisfactory for employee attitude and pricing and least satisfactory for internet services
and international bundles.
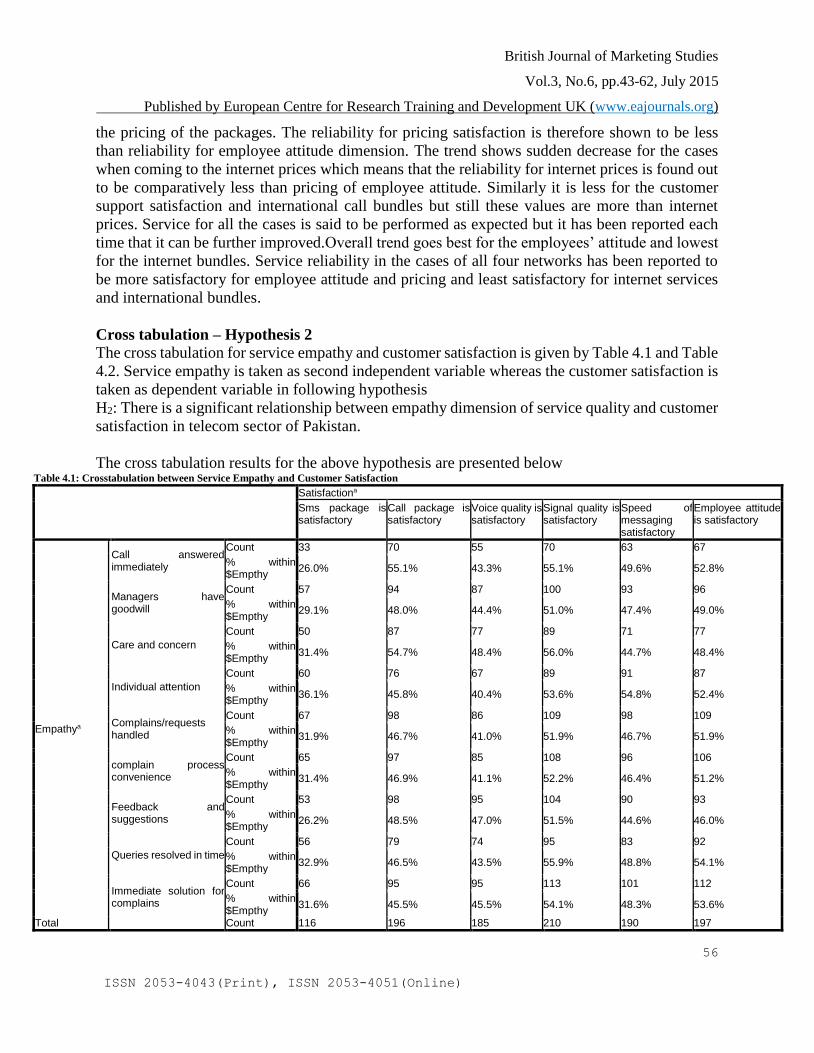
Cross tabulation – Hypothesis 2
The cross tabulation for service empathy and customer satisfaction is given by Table 4.1 and Table
4.2. Service empathy is taken as second independent variable whereas the customer satisfaction is
taken as dependent variable in following hypothesis
H2: There is a significant relationship between empathy dimension of service quality and customer
satisfaction in telecom sector of Pakistan.
The cross tabulation results for the above hypothesis are presented below Table 4.1: Crosstabulation between Service Empathy and Customer Satisfaction
Satisfactiona
Sms package is satisfactory
Call package is satisfactory
Voice quality is satisfactory
Signal quality is satisfactory
Speed of messaging satisfactory
Employee attitude is satisfactory
Empathya
Call answered immediately
Count 33 70 55 70 63 67
% within $Empthy
26.0% 55.1% 43.3% 55.1% 49.6% 52.8%
Managers have goodwill
Count 57 94 87 100 93 96
% within $Empthy
29.1% 48.0% 44.4% 51.0% 47.4% 49.0%
Care and concern
Count 50 87 77 89 71 77
% within $Empthy
31.4% 54.7% 48.4% 56.0% 44.7% 48.4%
Individual attention
Count 60 76 67 89 91 87
% within $Empthy
36.1% 45.8% 40.4% 53.6% 54.8% 52.4%
Complains/requests handled
Count 67 98 86 109 98 109
% within $Empthy
31.9% 46.7% 41.0% 51.9% 46.7% 51.9%
complain process convenience
Count 65 97 85 108 96 106
% within $Empthy
31.4% 46.9% 41.1% 52.2% 46.4% 51.2%
Feedback and suggestions
Count 53 98 95 104 90 93
% within $Empthy
26.2% 48.5% 47.0% 51.5% 44.6% 46.0%
Queries resolved in time
Count 56 79 74 95 83 92
% within $Empthy
32.9% 46.5% 43.5% 55.9% 48.8% 54.1%
Immediate solution for complains
Count 66 95 95 113 101 112
% within $Empthy
31.6% 45.5% 45.5% 54.1% 48.3% 53.6%
Total Count 116 196 185 210 190 197

British Journal of Marketing Studies
Vol.3, No.6, pp.43-62, July 2015
Published by European Centre for Research Training and Development UK (www.eajournals.org)
57
ISSN 2053-4043(Print), ISSN 2053-4051(Online)
The trend for the above table 4.1 can be seen in a same pattern for all the indicators of empathy
and customer satisfaction. It can be seen to increase from decrease and then decrease from
increasing for all the horizontal values.
As the sum of all cases of empathy variable are given at the end of table 4.2, it has been reported
that the most of the respondents are satisfied with the handling of complain and requests (total =
210) which also means that they are in encounter with employee mostly at the time of complains.
Also the trend for “individual attention” is observed to be more than the other indicators of service
empathy. Least is observed in all cases for the feedback and suggestions which means that
customers’ feedbacks and suggestions are not as much asked for during their encounter with
telecom personnel. Also most of the responses have supported that managers have goodwill for
customers and show care and concern.
The following table 4.2 is the continuation of Table 4.1 which again shows the cross tabulation for
service empathy and customer satisfaction.
Table 4.2: Crosstabulation between Service Empathy and Customer Satisfaction
Satisfaction
Pricing is satisfactory
Internet bundle is satisfactory
International call bundles satisfaction
Customer support satisfaction
Recommendation to others
Total
Empathya
Call answered immediately
Count 99 101 99 96 13 196
% within $Empthy
50.5% 49.6% 50.5% 49.0% 9.4%
Managers have goodwill
Count 67 63 68 66 12 127
% within $Empthy
51.2% 51.5% 53.5% 52.0% 6.6%
Care and concern
Count 79 80 81 82 15 159
% within $Empthy
49.7% 50.3% 50.9% 51.6% 9.4%
Individual attention
Count 92 84 92 79 8 166
% within $Empthy
55.4% 50.6% 55.4% 47.6% 4.8%
Complains/requests handled
Count 103 106 115 108 12 210
% within $Empthy
49.0% 50.5% 54.8% 51.4% 5.7%
complain process convenience
Count 100 106 113 107 10 207
% within $Empthy
48.3% 51.2% 54.6% 51.7% 4.8%
Feedback and suggestions
Count 98 102 100 106 9 202
% within $Empthy
48.5% 50.5% 49.5% 52.5% 4.5%
Queries resolved in time
Count 83 76 89 77 5 170
% within $Empthy
48.8% 44.7% 52.4% 45.3% 2.9%
Immediate solution for complains
Count 96 111 99 102 11 209
% within $Empthy
45.9% 53.1% 47.4% 48.8% 5.3%
Total Count 193 197 203 203 21 395

British Journal of Marketing Studies
Vol.3, No.6, pp.43-62, July 2015
Published by European Centre for Research Training and Development UK (www.eajournals.org)
58
ISSN 2053-4043(Print), ISSN 2053-4051(Online)
The trend for the above table 4.2 can be seen in a same pattern for all the indicators of empathy
and customer satisfaction. It can also be seen to decrease from increase and then again increase to
decrease for all the indicators of customer satisfaction.
The least responses for all the cases can be seen for the immediate call answer which means that
customers are not satisfied with the call answering efficiency of service reliability. Also the
feedback and suggestions do not seem to have a high response which shows that it decreases
customer satisfaction. The table also present average responses for convenience of complaint
process and resolving of queries in time.
DISCUSSION
Overall, the results have established some main points to focus. First of all for the reliability
dimensions of the service quality, it can be clearly observed that the sms packages are more
satisfactory as compared to the call packages. Also the signals are observed to be more satisfactory
compared to the voice quality. This means that the network providers need to focus more on the
call packages than the sms packages as most of the providers are already offering a lot of cheap
sms bundles. Also lowest values have been recorded for the internet bundles and also the
international call rates. The reliability of these two factors for customer satisfaction is observed to
be the lowest compared to other results. For every case these values are observed to be
comparatively low which deduces that network providers need to make the international calling
packages as well as internet bundles more reliable (which constitutes price, network quality and
other factors) in order to enhance customer satisfaction. Also it can be seen that most of the
responses have favored that the services is up to the expectations but more responses favor that
they still have a chance to become better than they are.
The results for empathy dimension overall elicit that most responses are in support that the
employees give individual attention and also that the complains and requests are carefully handled
. This means that the customers usually contact the service personnel when they are facing any
problem and they do get individual attention. However, lowest rates are observed to be for the
immediate answer to the call. This means that customers do not immediately get in touch with the
service employees and have to wait for their answer. This causes dissatisfaction which means that
this aspect of empathy dimension needs to improve. Average responses are recorded for
convenience of complaint process which means that there is a chance for improvement here too.
However, good responses are observed for managers’ care and concern. Less number of responses
are supporting that the feedback and suggestions gets implemented which means there is a chance
of improvement here as well.
Both the hypotheses are supported as the percentages of customer satisfaction change with the
service quality dimensions of reliability and empathy. Overall it can be established the there is a
significant relationship between customer satisfaction and service quality dimensions of empathy
and reliability.

British Journal of Marketing Studies
Vol.3, No.6, pp.43-62, July 2015
Published by European Centre for Research Training and Development UK (www.eajournals.org)
59
ISSN 2053-4043(Print), ISSN 2053-4051(Online)
CONCLUSION, LIMITATIONS AND IMPLICATIONS FOR FUTURE RESEARCH
This study has been conducted to establish a link between service quality dimensions of reliability
and empathy and customer satisfaction in telecom sector of Pakistan. Reliability and empathy
dimensions have been selected because they cover almost all major features of telecom services.
The primary data was collected from 400 respondents that were users for 4 main mobile networks
of Pakistan (i.e. mobilink, zong, telenor and ufone). It has been established that there is a
significant relationship between service quality and customer satisfaction.
The first limitation of this result is the unit of Analysis which is Rawalpindi and Islamabad. The
responses from all over Pakistan would better help in eliciting the clear results. Also this study
does not cover all the dimensions of service quality. In future, research can be done by taking a
wider unit of analysis and measuring all service dimensions for any other place like internet
services and educational institutes where this kind of research has not yet been conducted in
Pakistan.
REFERENCES
Appiah-Adu, K. (1999). Marketing Effectiveness and Customer Retention in the Service Sector.
The
Service Industries Journal, 19(3), 26-41.
Athanassopoulos, A., Gounaris, S. & Stathakopoulos, V. (2001). Behavioral Responses to
Customer Satisfaction: An Empirical Study. European Journal of Marketing, 35 (6), 687-
707.
Boshoff, C., & G. B. (2004). The Relationships between Service Quality, Customer Satisfaction
and Buying Intentions In the Private Hospital Industry. South African Journal of Business
Management, 35(4), 27-37.
Brady, M. K., & R. C. (2001). Searching for a consensus on the antecedent role of service quality
and satisfaction: An exploratory cross-national study. Journal of Business Research, 51(1),
53-60.
C., M., A. P., & D. B. (2002). Relationship marketing: Creating Customer Value,.
Choi, K. S., C. W., L. S., L. H., & K. C. (2004). The Relationships among Quality, Value,
Satisfaction and Behavioral Intention in Health Care Provider Choice: A South Korean
Study. Journal of Business Research, 58(8), 913-921.
Coyles, S., & G. T. (2002). Customer Retention is Not Enough. The McKinsey Quarterly.
Dabholkar, P. A. (1995). A Contingency Framework for Predicting Causality between Customer
Satisfaction and Service quality. Advances in Consumer Research, 22(1), 101-108.
Gitomer, J. (1998). Customer satisfaction is worthless, customer loyalty is priceless: How to make
customers love you, keep them coming back, and tell everyone they know. Austin: TX: Bard
Press.
Griffin, J. (1995). Customer loyalty: How to earn it, how to keep it. New York: Lexington Books.
Jones, M. A., & S. J. (2000). Transaction-Specific Satisfaction and Overall Satisfaction: An
Empirical Analysis. Journal of Services Marketing, 14(2), 147-159.

British Journal of Marketing Studies
Vol.3, No.6, pp.43-62, July 2015
Published by European Centre for Research Training and Development UK (www.eajournals.org)
60
ISSN 2053-4043(Print), ISSN 2053-4051(Online)
Lovelock, C. H., P. P., & W. R. (2001). Services Marketing: An Asia-Pacific Perspective (2nd
ed.). Australia: Prentice Hall.
MacStravic, R. E. (1977). Marketing Health Care. Gaithersburg, MD: Aspen.
Ojo, O. (2010). The Relationship Between Service Quality and Customer Satisfaction in the
Telecommunication Industry: Evidence From Nigeria. BRAND. Broad Research in
Accounting, Negotiation, and Distribution, 1(1).
Oliver, R. L. (1981). Measurement and Evaluation of Satisfaction Processes in Retail Settings.
Journal of Retailing, 57(3), 25-48.
Parasuraman, Zeithaml, & Berry,. (1988). SERVQUAL: A Multiple-Item Scale for Measuring
Customer Perceptions of Service Quality. Journal of Retailing, 12-40.
Soderlund, M., & O. N. (2003). Behavioral Intentions in Satisfaction Research Revisited. Journal
of Consumer Satisfaction, Dissatisfaction and Complaining Behavior, 16, 53-66.
Spreng, R. A., & Mackoy, R. (1996). An empirical examination of a model of perceived serviced.
Journal of Retailing, 72(2), 201-2014.
Taylor, S. A., & B. T. (1994). An Assessment of the Relationship between Service Quality and
Customer Satisfaction in the Formation of Consumers’ Purchase Intentions. Journal of
Retailing, 70(2), 163-178.
Thompson, K. N., & G. J. (1994). The Relationship between Quality, Satisfaction, and
Recommending Behaviour in Lodging Decisions. Journal of Hospitality & Leisure
Marketing, 2(3), 3-22.
Yi, Y. J., & L. S. (2004). What Influences the Relationship between Customer Satisfaction and
Repurchase Intention? Investigating the Effect of Adjusted Expectations and Customer
Loyalty. Psychology and Marketing, 21(5), 351-373.
Zeithaml, V. A., B. L., & P. A. (1996). The Behavioral Consequences of Service Quality. Journal
of Marketing, 60(2), 31-47.
Questionnaire
Section A
BACKGROUND INFORMATION OF RESPONDENT
(Please tick where applicable)
A1. Would you please tick which age bracket you fall in?
1) 18 - 25 years
2) 25-32 years
3) 32 - 38 years
4) 38 – 45 years
A2. Gender
1) Male
2) Female
A3. Which of the following mobile networks are you using?
1) Mobilink
2) Zong

British Journal of Marketing Studies
Vol.3, No.6, pp.43-62, July 2015
Published by European Centre for Research Training and Development UK (www.eajournals.org)
61
ISSN 2053-4043(Print), ISSN 2053-4051(Online)
3) Telenor
4) Warid
Section B
For this section, choose the option which seems most. Respondents are encouraged to tick
more than one option if applicable.
Reliability
How reliable do you think is the service?
Quality
The signals are clear
The voice quality is clear and there is no distortion
The service quality is up to my expectations
The service quality can be made better
Price
The call packages are appropriately priced
The sms packages are appropriately priced
Internet service is appropriately priced
Other facilities like caller tunes/sms bundles are appropriately priced
Time
Performs services right the first time
Provides services at the promised time
Keeps customers informed about when services will be performed
Keeps its packages and services up to date
Empathy
How empathic are the managers and employees of your telecom service?
Employees Attitude
My call is answered soon as I call
The managers/employees always have my best at heart
Employees show care and concern while talking to me
The managers/employees give individual attention to my problems and interests
Complain process
Service personnel always carefully listen to my complains and requests
Complain process is convenient to use
My feedback and suggestions are implemented when possible
My queries are resolved within time
I get an immediate response for my complains
Section C
Satisfaction
You are satisfied with:
The sms packages
The call packages

British Journal of Marketing Studies
Vol.3, No.6, pp.43-62, July 2015
Published by European Centre for Research Training and Development UK (www.eajournals.org)
62
ISSN 2053-4043(Print), ISSN 2053-4051(Online)
The quality of voice call
Signals
The speed of messaging
The attitude of the employees
The pricing
The internet bundles
Sms/call international bundles
Customer support centre
You will like to recommend others to use this package
I. Yes
II. No