Embed Size (px)
Citation preview

International Journal of Scientific & Engineering Research, Volume 7, Issue 8, August-2016 215 ISSN 2229-5518
IJSER © 2016 http://www.ijser.org
Measuring the Effect of Retail Service Quality Dimensions on Customer
Satisfaction and Loyalty: The study on the Super Shop in Bangladesh
Mohammad Jahirul Islam1, Mohitul Ameen Ahmed Mustafi2, Tarana Azmi3,Firoz Ahmed4 1. Senior Lecturer, Department of Business Administration, Uttara University, Bangladesh 2. *Senior Lecturer, Department of Business Administration, Uttara University, Bangladesh 2. Senior Lecturer, Department of Business Administration, Uttara University, Bangladesh
4. Lecturer, Department of Business Administration, Uttara University, Bangladesh
Abstract: The number and size of supermarkets in Bangladesh has increased recently. Despite, the level of customer satisfaction has not increased that much compared to supermarket growth. The aim of this study is to measure factors of retail service quality that has impact on customer satisfaction and also on the increased earnings in terms of generating store loyalty among urban customers.The primary data has been used for this study. The primary data were collected through personal interview while respondents were getting service in their super shop. It has covered the opinion of customer of different super shop like as Shwapno, Agura, Mina Bazar in Dhaka city. A total of 400 respondents were taken as sample based on probability sampling technique. Simple random sampling technique was used for selecting sample.A structured questionnaire has been formulated to collect data on customers’ satisfaction with the retail service quality. Both descriptive and inferential statistics were used for explaining the demographic data and measuring factors of retail service quality of the customers.Partial Least Squares (PLS) method was used to do structural equation modeling for doing the path model. The SEM results show that only one factor (Physical Aspects) has a significant relationship with Customer Satisfaction. Another factor named as store loyalty has positive relationship with customer satisfaction and that is positively linked to store loyalty.
Keywords: Super shop, Service Quality, Satisfaction, Loyalty, Structural Equation Model (SEM)
—————————— —————————— INTRODUCTION
The existing market condition is becoming more competitive because customers continuously
expect retailers to value their expectations (Wong and Sohal, 2003).To maintain a growing
degree of similarities between retail offerings of merchandising, super-shops are trying to deliver
effectively the customer services to make a competitive advantage (Ellram et al, 1999).It is vital
for such retailers to maintain customer satisfaction because they execute in a very competitive
world (Fonseca, 2009).Bangladesh supermarket sector includes large super-shops which
dominate the local retailing sector. In this respect, Meena Bazar, Showpna, Agora is treated as
the controller of supermarket business in Bangladesh.Store loyalty is tremendously an important
financial consideration for all supermarkets (Knox and Denison, 2000), as gaining new
customers is costly because of advertisement, promotion, and establishment operating expenses.
Similarly, loyal customers show better repurchase intentions, a reduction in price sensitivity, and
IJSER

International Journal of Scientific & Engineering Research, Volume 7, Issue 8, August-2016 216 ISSN 2229-5518
IJSER © 2016 http://www.ijser.org
positive oral communications (Varela-Neira et al, 2010). Therefore, it is more reasonable to
serve existing customers (Tepeci, 1999). In Bangladesh, dissemination in the grocery sector
means that the struggle for customers is mostly furious. As scope for natural growth scatters,
these retailers are forcing to roll their consideration harshly towards promoting goodwill and
customer loyalty (Martinez-Ruiz et al. 2010). Even though, the relationship among retail service
quality, customer satisfaction and loyalty are deemed to be well understood in some eras, there is
still more extent for further research in this aspect (Bodet, 2008).
LITERATURE REVIEW
Customer Satisfaction choice
Customer satisfaction was defined by the early customer satisfaction research as a post-selection
evaluative judgment regarding a particular purchase decision (Homburg and Giering, 2001).
Other research on customer satisfaction argues that satisfaction should be observed as a decision
based on collective experience with a particular product or service rather a transaction specific
meet (Anderson et al., 1994).It was recommended by Tse and Wilton (1988) that satisfaction is a
normal emotional fact, explaining the psychological condition that is resulting from an
assessment of the perceived difference between previous expectations and actual performance
obtained from the product of service.Customer satisfaction was monitored on a continual basis
by several individual companies, industries, and even countries (Fornell, 1992).Since satisfaction
is a serious measure of an organization’s success, customer satisfaction is treated as an important
construct for that (Fonseca, 2009). The level of customer satisfaction was shown to affect
attitude and oral communication (Sivadas and Baker-Prewitt, 2000); to take as a good indicator
of future purchase behavior (Garbarino and Johnson, 1999; Kasper, 1988); to influence profit
(Anderson et al., 1994); and, ultimately to lead to store loyalty (Oliver, 2010).Moreover, satisfied
customers are ready to pay premium prices and their appearance also to be continuous interest in
customer satisfaction as a way of assessing performance (Huber et al. 2001). Koter and Keller
(2001) argue that, lofty customer satisfaction scores are broadly accepted as a key indicator of a
firm’s financial growth. A lot of organizations apply customer satisfaction to be criteria of
identifying product or service performance and yet bind customer satisfaction ratings for
compensating the executives and employees (Anderson and Sullivan, 1993).However, customer
satisfaction is recognized by retailers as main criteria of successful business strategy (Gomez et
IJSER

International Journal of Scientific & Engineering Research, Volume 7, Issue 8, August-2016 217 ISSN 2229-5518
IJSER © 2016 http://www.ijser.org
al, 2004) and it is also important for management to realize what leads customer satisfaction
(Martinez-Ruiz et al, 2010).
Customer Satisfaction versus Perceived Service Quality
Researchers usually terms service quality and customer satisfaction exchangeable (Caruana,
2002). There are some distinctions can be identified between customer satisfaction and perceived
service quality. These indicate that satisfaction is an after-decision customer experience, whereas
service quality is not (Caruana, 2002; Oliver, 1993). Expectations are also stated in another way
for satisfaction and perceived service quality. Boulding et al (1993) stated, expectations reveal
anticipated performance in satisfaction literature, where in service quality literature, expectations
are categorized as a normative standard of future needs. Zeithamal and Bitner (2006) believe
service quality and customer satisfaction have some common things, but normally satisfaction is
affected by service quality. Churchill and Suprenant (1982) first recognized the direct
relationship between perceived service quality and customer satisfaction. Modeling perceived
service performance as direct forecaster satisfaction trails directly from the idea of a value-
percept assortment (Szymanski and Henard, 2005). A huge number of studies have discovered
this relationship, with many (e.g. Tse and Wilton, 1988 and Halstead et al, 1994) reaching the
conclusion that the direct relationship between perceived service quality and satisfaction is not
essentially strong.
Retail Service Quality Dimensions
Retail stores have developed from serving only substantial products that fulfill consumers’ needs
(Pan and Zinkhan, 2006) to offer a solution center that integrate the sale of both substantial
products and value-added services to obtain competitive advantages (Davies et al, 2006).
Speeding this system can lead to higher levels of customer retention, increased sales volume, as a
result improved profits (Parasuraman, 1988).Many studies, such as Long and McMellon (2004),
Kim and Jin (2002), Siu and Cheung (2001), Sweeney et al (1997) and Dabholkar et al (1996),
have discovered significant dimensions of service quality within the retail sector. Particularly,
within the supermarket sector, Vazquez et al (2001) and Huang (2009) stated Physical Aspects,
Reliability, Personal Interaction, Problem Solving and Policy as important. These dimensions are
stated below and have been adopted for the purpose of this study.
IJSER

International Journal of Scientific & Engineering Research, Volume 7, Issue 8, August-2016 218 ISSN 2229-5518
IJSER © 2016 http://www.ijser.org
Physical Aspects
Physical Aspects: The concept of physical aspects is explained as the retail store appearance and
store design (Huang, 2009 and Vazquez et al, 2001). The store environment, conveniences and
even descriptions are also factors which retailers can apply to get the competitive frame and
affect customer satisfaction (Dabholkar et al, 1996). Physical environment plays a crucial role in
service providing of the retail sector (Keillor et al, 2004) and perfect retailers emphasize on store
cleanliness and design that allows customer orientation and product detection (Vazquez et al,
2001).
As said by Abu (2004), a well structured store layout that is convenient to find the way will
reduce a customer’s search time. Moreover, Fisher et al. (2006) argue that due to poor store
layout customers often do not find the products they look for, although these products are still in
the store and this turns to poor perceptions and the customer turning to another shop for
solutions.Perceptions of store layout provide real signs about service quality (Yan et al. 2011;
Dholakia & Zhao, 2010; Binter, 1990) and it was stated by Dabholkar et al. (1996) that the
layout of the store is commonly accepted as an essential determinant of the shopping experience.
H1: Physical aspects have a direct effect on customer satisfaction within the supermarket sector.
Reliability
The construct of reliability measures the store’s capability to provide the service that was
committed to customers exactly, and without any fault (Huang, 2009 & Vazquez et al, 2001).
This means that the store must follow an attitude of getting it right first time, and all the time. It
must be capable to fulfill its commitments, meet deadlines and disseminate timely and exact
information to customers (Newman, 2001).Exact information includes unambiguous product
pricing and proper and specific information concerning the product (Vazquez et al. 2001).
Moreover, reliability also refers the stores’ ability to have goods available when required.
Interviews run by Dabholkar et al, (1996) exposed that, customers think reliability as
combination of keeping commitment and ‘doing it exact’. In the supermarket environment,
unavailability of stock or long line for the cash register indicates a lack of reliability of the
retailer. It was shown that lengthy waits for the cash register can result in consumer negative
perceptions and dissatisfaction (Rigopoulou et al, 2008; Grewal 2003).Zinn and Liu (2001)
IJSER

International Journal of Scientific & Engineering Research, Volume 7, Issue 8, August-2016 219 ISSN 2229-5518
IJSER © 2016 http://www.ijser.org
stated that, an inventory shortage can result in the consumer exit the store and go without
purchase to search for the product in a different place. Moreover, in the long run, frequent stock
outages will cause a harmful effect on future loyalty, and result in damaging perceptions and
negative talking (Grant &Fernie, 2008).
H2: Reliability has a direct impact on customer satisfaction within the supermarket sector.
Personal Interaction
Personal Interaction: Sales persons play a vital role in customer service position, with the most
significant aspects being store staff attitude and handling of customers (Gounaris, 2008;
Gagliano, 1994). The service offered by sales persons to customers is possibly the most highly
noticeable attribute of the service requirement. It was stated by Darian et al. (2001) that, sales
personnel’s awareness concerning new goods, prices, and other variations of store services is
significant, and it is also vital to treat the customers with admiration. Sales personnel are
frequently treated as facilitators of the sales process because they have an important role in
improving the process. Moreover, salesmen also serve the customers with help in navigating
store ways and choosing complementary substances when required (Jamal and Adelwore, 2008;
Henning-Thurau, 2004; Sweeney et al, 1997).
H3: Personal interaction has a direct effect on customer satisfaction within the supermarket
sector.
Problem Solving and Policy
Problem solving means the store’s ability to manage the returns and alterations and dealing
customers’ problems and objections. It involves the store’s capability of sincere and gentle
interest in solving the customer’s problem and also the aptitude of employee to deal objections
honestly and instantly (Swanson and Kelley, 2001; Vazquez et al, 2001).If the problem solving
process is not effective, service failures will cause dissatisfaction and annoyance that will lead to
devastating consequences for the store (Chang et al, 2008).This can be supported by evidence
that customers have more positive perceptions of stores where efficient problem solving
processes exist (Huang, 2009).Lewis and Spyrakopoulos (2001) stated that, an efficient problem
solving procedure can detect and solve the problems, avoid dissatisfaction, as well as encourage
IJSER

International Journal of Scientific & Engineering Research, Volume 7, Issue 8, August-2016 220 ISSN 2229-5518
IJSER © 2016 http://www.ijser.org
objections. It was found by Michel (2001), Halstead and Page (1992), and Singh and Widing
(1981) that, dissatisfied customers were more likely to repurchase if their objections were solved
satisfactorily. It can be the best attention of the stores to ensure the adequacy and efficiency of
measures in the problem solving facilitation. These measures can be customer care hot-lines,
customer service desks, cooperative sales staffs or even a website. Furthermore, it was observed
that the post-sales service of the store create a trustworthiness and affect in creating customer’s
favorable perception in the future (Lindquist, 1974).Store policy means a store’s verdict (policy)
regarding the top to bottom of their merchandise, their trustworthy programs and credit facilities,
service hours, parking facilities and other customer services offered. It is also found that stores
capable with excellent services most probably ensure a favorable consumer perception (Thang
and Tan, 2003). Customers expect stores to be supportive to them, and service system that
propose sympathy and understanding because favorable perceived service quality and
satisfaction (Dabholkar et al, 1996).Brady and Cronin (2001) noted that the assessment of
service quality is to include performance appraisal of the goods offered to customers and they are
in accordance with policy. When customers recognize that the store has a wide range of product
variation and also offer superior value, they experience positive sensation as happiness, thrilling,
satisfaction, arrogance, and pleasure (Yoo, 1998).Stores that are supposed to have better
merchandising are to be preferred by the customers (Thang and Tan, 2003). The performance of
the products offered also includes the store’s capability to stock variety of products; freshness of
meat, fruit and vegetables; the collection of fresh goods available as well as excellent quality of
brands products (Vazquez et al, 2001). If the store fails to meet the consumer expectations
regarding the above areas, there will be high consumer dissatisfaction. It was noted that frequent
objections of lower quality product result in pessimistic perception about the store (Bruhn and
Grebitus, 2007) and that’s why satisfaction levels reduce.
H4: Problem solving and Store policy has a direct effect on customer satisfaction within the
supermarket sector.
Store Loyalty
Store loyalty offers the base of an organization’s continuous competitive advantage, and is a vital
indicator of the company’s development and performance (Lee and Cunningham, 2001;
Reichheld, 1996). It was argued by researchers that store loyalty is a vital aspect in explaining
IJSER

International Journal of Scientific & Engineering Research, Volume 7, Issue 8, August-2016 221 ISSN 2229-5518
IJSER © 2016 http://www.ijser.org
customer withholding (Pritchard and Howard, 1997) and is specified by a combination of again
purchase level and a general level of affection (Bodet, 2008 & Dick and Basu, 1994).The last
one relates to an individual customer’s approach on a product, service or organization
(Hallowell, 1996). Other researchers stated that store loyalty is a behavioral aspect. Here,
customer retention, repeat purchases and positive oral communication are included (Hallowell,
1996; Liu and Wu, 2007). Since there is a little difference, store loyalty and retention will be
taken into consideration as synonymous for this study.
H5: Customer satisfaction has a direct effect on store loyalty within the supermarket sector.
METHODOLOGY
The primary data has been used for this study. The primary data were collected through personal interview while respondents were getting service in their super shop. It has covered the opinion of customer of different super shop like as Shwapno, Agura, Mina Bazar in Dhaka city. A total of 400 respondents were taken as sample based on probability sampling technique. Simple random sampling technique was used for selecting sample.To determine the sample size of customer, published formula of University of Florida was used as a reference. According to this table, the sample size for the more than 10 lac population size with 95% confidence level and ±5% precision level are approximately 400 using the formula
n= N(1+Ne2)
; where n is sample size, N is the population size, and e is the level of precision. Respondents were asked to respond about their perceptions of the quality of services provided by private hospital in Bangladesh in terms of the above mentioned six services quality dimensions. To confirmation the responses of the sample respondents, a structured questionnaire was used. In the questionnaire, seven statements were completed: six for the above mentioned six factors or service quality dimensions and one for the overall service quality of the private hospitals. Five point Likert scale ranging from 1 (strongly disagree) to 5 (strongly agree) was used to collect data from respondents. Four demographic variables, namely, age, gender, education level, and occupation were taken to determine the variability of six dimensions across those variables. For analysis of the demographic information, we used SPSS software. The factor analysis adopted to determine the influential factors of the perceived service quality factors by using SmartPLS software.
3.2 Results and Data Analysis
The current study used smartPLS (Ringle, Wende& Will, 2005) partial least square structural equation modelling (PLS-SEM) tool to evaluate the manner in which the constructs presented in Figure 1 might relate to each other. The PLS-SEM method is a statistical method that has been developed for the analysis of latent variable structural models involving various constructs with multiple indicators. PLS-SEMs have a number of potential strengths, including the ability for the testing of the psychometric properties of the scales used to measure a variable, as well as the strength and the path of relationships among the variables (Akteret al., 2011).
IJSER

International Journal of Scientific & Engineering Research, Volume 7, Issue 8, August-2016 222 ISSN 2229-5518
IJSER © 2016 http://www.ijser.org
The present study used smartPLS (Ringle, Wende& Will, 2005) partial least square structural equation modeling (PLS-SEM) device to measure the manner in which the constructs presented in Figure 1 might relate to each other. The PLS-SEM method is a statistical method that has been developed for the analysis of latent variable structural models involving various constructs with multiple indicators. PLS-SEMs have a number of potential strengths, including the ability for the difficult of the psychometric properties of the scales that used to measure a variable, as well as the strength and the path of relationships among the variables (Akter et al., 2011).
The PLS-SEM consisted of two sets of testing equations: First, the assessment of measurement model, and the second, the assessment of the structural model (Hair, Ringle&Sarstedt, 2011). The measurement model which is the process of calculating the item reliability and validity; and the structural model which is the method of determining the appropriate nature of the relationships (paths) between the measures and constructs (Hair etal. 1998). The estimated path coefficients indicate the sign and the power of the relationships while loadings indicate the strength of the measures (Hair et al., 2011). The confirmatory factor analysis was first conducted to assess the measurement model; then, the structural relationships were examined (Anderson &Gerbing 1988; Hair et al. 1998).
3.3 Measurement Model
The two main criteria used for testing the measurement model are reliability or internal consistency and validity. The reliability of a research instrument concerns the extent to which the instrument produces consistent results in repeated measurements, whereas validity is the degree to which a test of how well an instrument that is developed measures and what is supposed to measure (Sekaran&Bougie, 2010). To validate our measurement model, two basic approaches to validity were assessed: convergent validity, and discriminant validity.
3.4 Reliability Analysis
To analyze the reliability/internal consistency of the items, we used the Cronbach’s alpha coefficient and composite reliability (CR) value. Table 2shows all Cronbach’s alpha values are above 0.6 cutoff values as suggested by Nunnally and Berstein (1994). Another way to determine internal consistency is by looking at composite reliability values. The composite reliability (CR) values also ranged from 0.794 to 0.867 (Table-6). According to Fornell and Larcker (1981) a composite reliability value of 0.70 or greater is considered acceptable. As such we concluded that the measurement model were reliable.
3.5 Convergent Validity
When multiple items are used to measure an individual construct, the item (indicator) convergent validity should be one of the main concerns to the researcher. The measurement model was tested for convergent validity which is the extent to which multiple items to measure the same concept are in agreement (MacKinnon, 2008).
Anderson and Gerbing (1988) stated that convergent validity is established if all factor loadings for the items measuring the same construct are statistically significant. According to Hair et al. (1998) convergent validity could be accessed through factor loadings, composite reliability and the average variance extracted. The results of the measurement model (Table 6) show that the loadings for all items exceeded the recommended value of 0.5 (Hair et al. 1998). Composite
IJSER

International Journal of Scientific & Engineering Research, Volume 7, Issue 8, August-2016 223 ISSN 2229-5518
IJSER © 2016 http://www.ijser.org
reliability (CR) values ranged from 0.794 to 0.867 which exceeded the recommended value of 0.7 (Hair et al. 1998).
All values of the average variance extracted (AVE) which measures the variance captured by the indicators relative to measurement error were greater than 0.50 to indicate acceptability of the constructs (Fornell&Larcker, 1981; Henseler, Ringle, &Sinkovics, 2009). The table indicates that these indicators satisfied the convergent validity of the constructs.
2.5 Conceptual Framework:
The objective of this study is to investigate the impact of service quality factors like as physical aspect, reliability, personal interaction, problem solving and policy on customer satisfaction of super shop. In the literature, the related studies suggest that the types of factors in SERVQUAL model applications in different super shop are physical aspect, reliability, personal interaction, problem solving and policy. The theoretical model is presented in Figure 1.We will look at the theoretical model for each of the hypotheses in the following bellow.
Reliability Analysis
In order to test the internal reliability of the constructs that were used, a series of Item Reliability tests were conducted. Cronbach Alphas of 0.6 and above are deemed acceptable in emerging markets (Burgess & Steenkamp, 2006) although the researchers used their discretion and included the Reliability construct (0.58) as it only marginally missed the critical threshold. The respective Cronbach Alphas are reflected in Table 3.
Table 3: Item Reliability Analysis Results
Average Variance Extracted (AVE)
Composite Reliability
Cronbach's Alpha
R Square Adjusted R Square
Physical Aspect 0.547 0.783 0.717 Reliability 0.547 0.775 0.715 Personal Interaction 0.623 0.831 0.705
Problem Solving & Policy
0.517 0.672 0.708
Customer Satisfaction 0.584 0.812 0.749 0.279 0.248
Store 0.570 0.816 0.717 0.358 0.35
IJSER

International Journal of Scientific & Engineering Research, Volume 7, Issue 8, August-2016 224 ISSN 2229-5518
IJSER © 2016 http://www.ijser.org
Loyalty Note: AVE>0.50 (Fornell&Larcker, 1981); Henseler, Ringle, &Sinkovics, 2009),Composite Reliability>0.70(Hair et al. 1998), Cronbach’s alpha> 0.60(Nunnally and Berstein (1994))
4.1 Exploratory Factor Analysis
Exploratory Factor Analysis (EFA) is a widely utilized and broadly applied statistical technique in social science. A total of 400 usable survey responses were analyzed in this section. The factor analysis technique has been applied to examine the relationship between different factors in service quality and patient satisfaction. The five factors that are found from the rotated factor matrix are given below:
Factor-1 (Physical Aspect): This includes three variables like: convenient shopping environment attractiveness of appearance, desired products are found easilyto customers. So, it provides a basis for conceptualization of a dimension which may be identified as physical aspect factor.
Factor-2 (Reliability: This includes three variables like: visible product price, stock of products is available, updated sales promotion information is availablehas the principal factors. So, it provides a basis for conceptualization of a dimension which may be identified as reliability factor.
Factor-3 (Personal Interaction): This includes three variables like: staffs’ willingness to help, staffs’ friendliness and politeness, and staffs are knowledgeable has the principal factors. So, it provides a basis for conceptualization of a dimension which may be identified as personal interaction factor.
Factor-4 (Problem Solving & Policy): This includes three variables like: authority’s professional response to queries, safe and convenient parking facilities, and customer convenient operating hours has the principal factors. So, it provides a basis for conceptualization of a dimension which may be identified as problem solving and policy factor.
Table 04: Factor Analysis
Physical Aspect
Reliability
Personal Interaction
Problem Solving and Policy
Attractiveness of appearance 0.756 Convenient shopping environment 0.908 Desired products are found easily 0.526 Updated sales promotion information are available 0.576
Stock of products is available 0.707 Visible product price 0.891 Staffs are knowledgeable 0.671 Staffs’ friendliness and politeness 0.837 Staffs’ willingness to help 0.848 Authority’s professional response to queries 0.862 Customer convenient operating hours 0.511
IJSER

International Journal of Scientific & Engineering Research, Volume 7, Issue 8, August-2016 225 ISSN 2229-5518
IJSER © 2016 http://www.ijser.org
Safe and convenient parking facilities 0.513 Measurement Model - Convergent & Discriminant Validity Convergent and discriminant validity were ascertained through Confirmatory Factor Analysis (detailed in Table 5) and the Fornell-Larcker test, respectively. In the case of the CFA, only one item (“Difficult to Reach”) was removed as it failed to load on the factor (i.e. Store Loyalty). Table 5: Confirmatory Factor Analysis including Scale Items
Physical Aspect
Reliability Personal Interaction
Problem Solving and Policy
Customer Satisfaction
Store Loyalty
PA2 6.08 PA2 21.026 PA4 2.267 REL1 2.387 REL3 4.905 REL4 12.436 PI1 6.145 PI2 9.916 PI3 11.977 PSPO1 4.257 PSPO4 1.826 PSPO6 2.021 SAT2 11.582 SAT3 9.699 SAT4 20.525 SL1 5.340 SL2 6.966 SL3 14.391 SL4 10.398 SL5 12.049
From table-5 shows that, all of the T-Statistic are larger than 1.96 at 5% level of significance, we can say that the outer model loadings are highly significant. So, our SEM model is accepted for above evidence in this study.
Resulted Path Diagram of Superb Shop:
IJSER

International Journal of Scientific & Engineering Research, Volume 7, Issue 8, August-2016 226 ISSN 2229-5518
IJSER © 2016 http://www.ijser.org
Structural Model
The structural model is made up of the main constructs being tested and the relationships between them. Table 6, below, tabulates the PLS output generated for the direct relationships.
Table 06: PLS output testing the relationships
Original Sample
Sample Mean
Standard Deviation
T Statistics P Values
Physical Aspect-Customer Satisfaction 0.367 0.366 0.104 3.536 0.000***
ReliabilityCustomer Satisfaction 0.148 0.154 0.141 0.983 0.326
Personal InteractionCustomer Satisfaction 0.129 0.142 0.151 0.919 0.359
Problem Solving & PolicyCustomer Satisfaction 0.004 0.028 0.116 0.032 0.974
Customer Satisfaction Store Loyalty 0.598 0.586 0.108 9.367 0.000***
Assessment of the Structural Model
Once all the constructs in the measurement model were validated, structural model was then to be tested. The bootstrapping technique was conducted to generate t-value for each of the hypothesized relationship and the potential impact of covariates. The researcher conducted the bootstrapping approach with 500 samples, with 0 cases per sample to test the path coefficient (β) and proposed hypotheses. Table 6 and Figure 1 presented the results of the hypotheses testing. The findings revealed that physical aspect (β= 0.367; t = 3.536, reliability (β = 0.148, t = 0.983), personal interaction (β = 0.129; t = 0.919), and Problem solving & policy (β = 0. 004; t = 0.032), were found to be related to customer satisfaction, with the evidence that only one formulated hypotheses is accepted at 1% level of significance but the remaining three hypotheses are not significantly accepted because the value of t are less than 1.96 at 5% level of significance. hence, H1, was supported H2, H3, and H4, were not supported.
IJSER
International Journal of Scientific & Engineering Research, Volume 7, Issue 8, August-2016 227 ISSN 2229-5518
IJSER © 2016 http://www.ijser.org
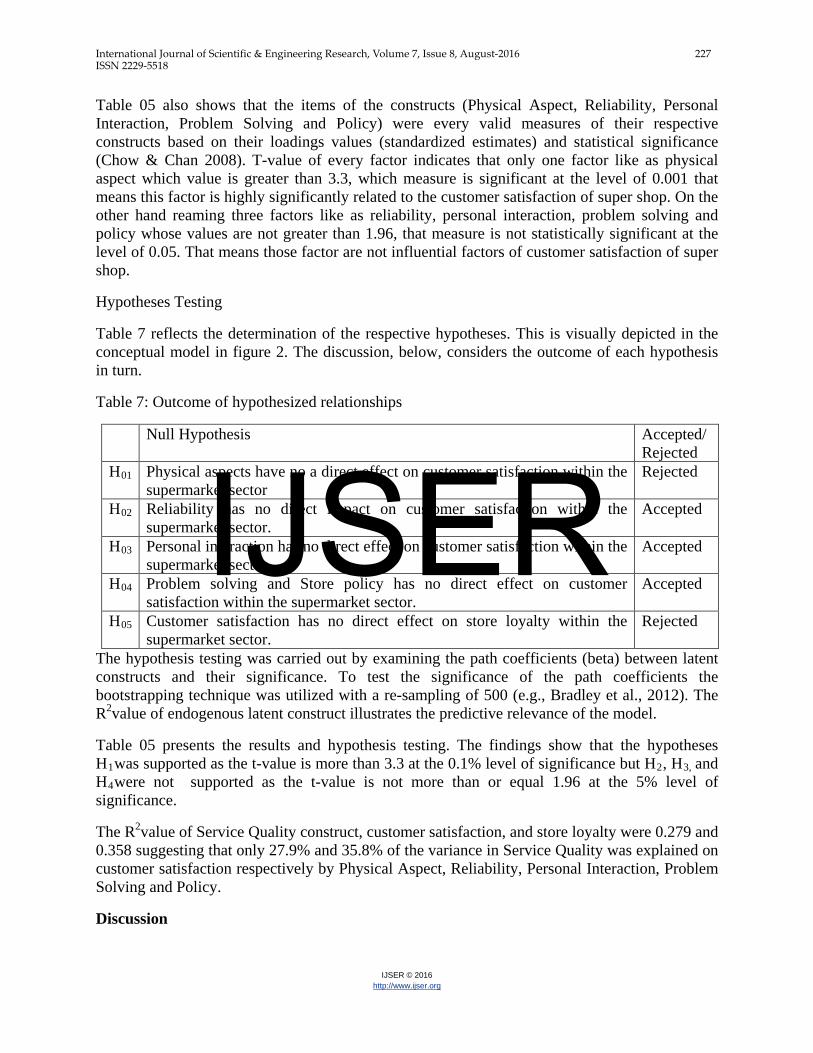
Table 05 also shows that the items of the constructs (Physical Aspect, Reliability, Personal Interaction, Problem Solving and Policy) were every valid measures of their respective constructs based on their loadings values (standardized estimates) and statistical significance (Chow & Chan 2008). T-value of every factor indicates that only one factor like as physical aspect which value is greater than 3.3, which measure is significant at the level of 0.001 that means this factor is highly significantly related to the customer satisfaction of super shop. On the other hand reaming three factors like as reliability, personal interaction, problem solving and policy whose values are not greater than 1.96, that measure is not statistically significant at the level of 0.05. That means those factor are not influential factors of customer satisfaction of super shop.
Hypotheses Testing
Table 7 reflects the determination of the respective hypotheses. This is visually depicted in the conceptual model in figure 2. The discussion, below, considers the outcome of each hypothesis in turn.
Table 7: Outcome of hypothesized relationships
Null Hypothesis Accepted/ Rejected
H01 Physical aspects have no a direct effect on customer satisfaction within the supermarket sector
Rejected
H02 Reliability has no direct impact on customer satisfaction within the supermarket sector.
Accepted
H03 Personal interaction has no direct effect on customer satisfaction within the supermarket sector.
Accepted
H04 Problem solving and Store policy has no direct effect on customer satisfaction within the supermarket sector.
Accepted
H05 Customer satisfaction has no direct effect on store loyalty within the supermarket sector.
Rejected
The hypothesis testing was carried out by examining the path coefficients (beta) between latent constructs and their significance. To test the significance of the path coefficients the bootstrapping technique was utilized with a re-sampling of 500 (e.g., Bradley et al., 2012). The R2value of endogenous latent construct illustrates the predictive relevance of the model.
Table 05 presents the results and hypothesis testing. The findings show that the hypotheses H1was supported as the t-value is more than 3.3 at the 0.1% level of significance but H2, H3, and H4were not supported as the t-value is not more than or equal 1.96 at the 5% level of significance.
The R2value of Service Quality construct, customer satisfaction, and store loyalty were 0.279 and 0.358 suggesting that only 27.9% and 35.8% of the variance in Service Quality was explained on customer satisfaction respectively by Physical Aspect, Reliability, Personal Interaction, Problem Solving and Policy.
Discussion
IJSER

International Journal of Scientific & Engineering Research, Volume 7, Issue 8, August-2016 228 ISSN 2229-5518
IJSER © 2016 http://www.ijser.org
The PLS analysis results into the path model indicate that only one of the five Retail Service Quality Dimensions and Satisfaction has statistically significant relationship at or below 5% significance level. This is Physical Appearance/aspect factor. The rest of three factors as Reliability, Personal Interaction, and Problem Solving and Policy showed insignificant effect on satisfaction.
As predicted, the analysis exposed that Customer Satisfaction and Loyalty has a strong relationship, although, this is not surprising at all because the previous studies also documented this relationship.
Physical Aspects was discovered as the most important predictor of Customer Satisfaction. The result was significantly stronger than any of the other relationship exposed. This emphasizes the view that, clean, well-structured and adequate physical environment should be maintained. As the grocery sale is supermarket’s core activity, regarding this customers like to have a safe and healthy environment. In addition, to maximize convenience the design should be optimized. As grocery shopping is perceived as unglamorous by many purchasers, it is expected by customers to have a harassment free experience.
Conclusion:
Reliability: A customer with his intellectual ability decides to do transaction in a super-shop which is fully reliable. So that, customers expect a super-shop where the sales promotional information is updated and available, sufficient stocks of products are available, and the price list is publicly hanged and clearly noticeable. This study reveals that absence of the above criteria in a super-shop causes the customers uncertainty in their decisions of shopping transactions.
Personal Interaction (PI): Regarding any business PI is an important way of attracting the customers. For example- knowledgably answering the questions asked by the customers by the staff members, friendly behavior of staff members with customers, helping attitude of staff members to the customers, etc. This study exposed that lacking in the above aspects cause a negative sense among the customers about the super-shop.
Problem solving and Policy (PSPO): In a business organization problem is an important issue. Customers always seek solutions of the problems. So that some problem-related questions are introduced in this study such as – skill of store authority regarding response to customer objections and queries, store open at customers’ convenient time, and sufficient and secured parking facility etc. This study discovers that absence of the above issues cause negligence among customers to do shopping in the super-shop.
Recommendation:
People go to market with their earnings to do shopping from a reliable place where staffs are friendly & co-operative. The staff members of the super shop are to be sincere to solve any kind of problem of the customers so that, customers will be appreciated to purchase from that shop. Regarding this some recommendations are given below:
IJSER

International Journal of Scientific & Engineering Research, Volume 7, Issue 8, August-2016 229 ISSN 2229-5518
IJSER © 2016 http://www.ijser.org
1. The super shop should keep accurate and up-to-date information regarding their sales promotion activities.
2. The demanded products should have sufficient stock. 3. The price list should be noticeably hanged. 4. The queries or questions asked by the customers should be answered by the staff
members with knowledge and sincerity. The staff members should help the customers professionally.
5. The store should be opened at the time convenient to customers. The store should have sufficient and secured car parking facilities.
REFERENCES
1. Abu, N. K. (2004). Service quality dimensions: A study on various sizes of grocery retailers–A conceptual paper. Proceeding of IBBC, 633-642.
2. Anderson, E. W., Fornell, C., & Lehmann, D. R. (1994). Customer satisfaction, market share, and profitability: Findings from Sweden. The Journal of Marketing, 53-66.
3. Anderson, E. W., & Sullivan, M. W. (1993). The antecedents and consequences of customer satisfaction for firms. Marketing science, 12(2), 125-143.
4. Bitner, M. J. (1990). Evaluating service encounters: the effects of physical surroundings and employee responses. the Journal of Marketing, 69-82.
5. Bodet, G. (2008). Customer satisfaction and loyalty in service: Two concepts, four constructs, several relationships. Journal of retailing and consumer services, 15(3), 156-162.
6. Boulding, W., Kalra, A., Staelin, R., & Zeithaml, V. A. (1993). A dynamic process model of service quality: from expectations to behavioral intentions. Journal of marketing research, 30(1), 7.
7. Brady, M. K., & Cronin, J. J. (2001). Customer orientation effects on customer service perceptions and outcome behaviors. Journal of service Research, 3(3), 241-251.
8. Bruhn, M., & Grebitus, C. (2007). Food quality from a consumer‘s perspective. Quality management in food chains. Wageningen Academic Publishers, Wageningen, 243-254.
9. Caruana, A. (2002). Service loyalty: The effects of service quality and the mediating role of customer satisfaction. European journal of marketing, 36(7/8), 811-828.
10. Chang, H. S., Lee, J. C., & Tseng, C. M. (2008). The influence of service recovery on perceived justice under different involvement level-an evidence of retail industry. Contemporary Management Research, 4(1).
11. Churchill Jr, G. A., & Surprenant, C. (1982). An investigation into the determinants of customer satisfaction. Journal of marketing research, 491-504.
12. Dabholkar, P. A., Thorpe, D. I., & Rentz, J. O. (1995). A measure of service quality for retail stores: scale development and validation. Journal of the Academy of marketing Science, 24(1), 3-16.
13. Darian, J. C., Tucci, L. A., & Wiman, A. R. (2001). Perceived salesperson service attributes and retail patronage intentions. International Journal of Retail & Distribution Management, 29(5), 205-213.
14. Davies, A., Brady, T., & Hobday, M. (2006). Charting a path toward integrated solutions. MIT Sloan Management Review, 47(3), 39.
IJSER

International Journal of Scientific & Engineering Research, Volume 7, Issue 8, August-2016 230 ISSN 2229-5518
IJSER © 2016 http://www.ijser.org
15. Roy Dholakia, R., & Zhao, M. (2010). Effects of online store attributes on customer satisfaction and repurchase intentions. International Journal of Retail & Distribution Management, 38(7), 482-496.
16. Dick, A. S., & Basu, K. (1994). Customer loyalty: toward an integrated conceptual framework. Journal of the academy of marketing science, 22(2), 99-113.
17. Ellram, L. M., La Londe, B. J., & Weber, M. M. (2013). Retail logistics. International Journal of Physical Distribution & Logistics Management.
18. Fisher, M., Krishnan, J., & Netessine, S. (2006). Retail store execution: An empirical study. Available at SSRN 2319839.
19. Fonseca, J. R. (2009). Customer satisfaction study via a latent segment model. Journal of Retailing and Consumer Services, 16(5), 352-359.
20. Fornell, C. (1992). A national customer satisfaction barometer: The Swedish experience. the Journal of Marketing, 6-21.
21. Bishop Gagliano, K., & Hathcote, J. (1994). Customer expectations and perceptions of service quality in retail apparel specialty stores. Journal of Services Marketing, 8(1), 60-69.
22. Garbarino, E., & Johnson, M. S. (1999). The different roles of satisfaction, trust, and commitment in customer relationships. the Journal of Marketing, 70-87.
23. Gomez, M. I., McLaughlin, E. W., & Wittink, D. R. (2004). Customer satisfaction and retail sales performance: an empirical investigation. Journal of retailing, 80(4), 265-278.
24. Gounaris, S. (2008). Antecedents of internal marketing practice: some preliminary empirical evidence. International Journal of Service Industry Management, 19(3), 400-434.
25. Grant, D. B., & Fernie, J. (2008). Research note: exploring out-of-stock and on-shelf availability in non-grocery, high street retailing. International Journal of Retail & Distribution Management, 36(8), 661-672.
26. Grewal, D., Baker, J., Levy, M., & Voss, G. B. (2003). The effects of wait expectations and store atmosphere evaluations on patronage intentions in service-intensive retail stores. Journal of retailing, 79(4), 259-268.
27. Hair, J., Black, W., Babin, B. and Anderson, R. (2010). Multivariate Data Analysis, 7th edition. New Jersey: Prentice Hall.
28. Hallowell, R. (1996). The relationships of customer satisfaction, customer loyalty, and profitability: an empirical study. International journal of service industry management, 7(4), 27-42.
29. Haistead, D., Hartman, D., & Schmidt, S. L. (1994). Multisource effects on the satisfaction formation process. Journal of the Academy of Marketing Science, 22(2), 114-129.
30. Halstead, D., & Page, T. J. (1992). The effects of satisfaction and complaining behavior on consumer repurchase intentions. Journal of Consumer Satisfaction, Dissatisfaction and Complaining Behavior, 5(1), 1-11.
31. Hennig-Thurau, T. (2004). Customer orientation of service employees: Its impact on customer satisfaction, commitment, and retention. International Journal of Service Industry Management, 15(5), 460-478.
32. Henseler, J., Ringle, C. M., & Sinkovics, R. R. (2009). The use of partial least squares path modeling in international marketing. Advances in international marketing, 20(1), 277-319.
33. Homburg, C., & Giering, A. (2001). Personal characteristics as moderators of the relationship between customer satisfaction and loyalty—an empirical analysis. Psychology & Marketing, 18(1), 43-66.
IJSER

International Journal of Scientific & Engineering Research, Volume 7, Issue 8, August-2016 231 ISSN 2229-5518
IJSER © 2016 http://www.ijser.org
34. Huang, M. H. (2009). Using service quality to enhance the perceived quality of store brands. Total Quality Management, 20(2), 241-252.
35. Huber, F., Herrmann, A., & Wricke, M. (2001). Customer satisfaction as an antecedent of price acceptance: results of an empirical study. Journal of Product & Brand Management, 10(3), 160-169.
36. Jamal, A., & Adelowore, A. (2008). Customer-employee relationship: The role of self-employee congruence. European Journal of Marketing, 42(11/12), 1316-1345.
37. Keillor, B. D., Hult, G. T. M., & Kandemir, D. (2004). A study of the service encounter in eight countries. Journal of International Marketing, 12(1), 9-35.
38. Kim, S., & Jin, B. (2002). Validating the retail service quality scale for US and Korean customers of discount stores: an exploratory study. Journal of Services Marketing, 16(3), 223-237.
39. Knox, S. D., & Denison, T. J. (2000). Store loyalty: its impact on retail revenue. An empirical study of purchasing behaviour in the UK. Journal of retailing and consumer services, 7(1), 33-45.
40. Kotler, P., Keller, K. L., Ancarani, F., & Costabile, M. (2014). Marketing management 14/e. Pearson.
41. Lee, M., & Cunningham, L. F. (2001). A cost/benefit approach to understanding service loyalty. Journal of services Marketing, 15(2), 113-130.
42. Lewis, B. R., & Spyrakopoulos, S. (2001). Service failures and recovery in retail banking: the customers' perspective. International Journal of Bank Marketing, 19(1), 37-48.
43. Lindqvist, J. D. (1974). Meaning of image: A survey of empirical hypothetical evidence. Journal of Retailing, 50(4), 29-38.
44. Liu, T. C., & Wu, L. W. (2007). Customer retention and cross-buying in the banking industry: An integration of service attributes, satisfaction and trust. Journal of Financial Services Marketing, 12(2), 132-145.
45. Long, M., & McMellon, C. (2004). Exploring the determinants of retail service quality on the Internet. Journal of services marketing, 18(1), 78-90.
46. Martínez-Ruiz, M. P., Jiménez-Zarco, A. I., & Izquierdo-Yusta, A. (2010). Customer satisfaction's key factors in Spanish grocery stores: Evidence from hypermarkets and supermarkets. Journal of Retailing and Consumer Services, 17(4), 278-285.
47. Michel, S. (2001). Analyzing service failures and recoveries: a process approach. International journal of service industry management, 12(1), 20-33.
48. Newman, K. (2001). Interrogating SERVQUAL: a critical assessment of service quality measurement in a high street retail bank. International journal of bank marketing, 19(3), 126-139.
49. Oliver, R. L. (1993). A conceptual model of service quality and service satisfaction: compatible goals, different concepts. Advances in services marketing and management, 2(4), 65-85.
50. Oliver, R. L. (2010). Satisfaction: a behavioral perspective on the consumer. new york: me sharpe.
51. Pan, Y., & Zinkhan, G. M. (2006). Determinants of retail patronage: a meta-analytical perspective. Journal of retailing, 82(3), 229-243.
52. Parasuraman, A., Zeithaml, V. A., & Berry, L. L. (1988). Servqual. Journal of retailing, 64(1), 12-40.
IJSER

International Journal of Scientific & Engineering Research, Volume 7, Issue 8, August-2016 232 ISSN 2229-5518
IJSER © 2016 http://www.ijser.org
53. Reichheld, F. F., & Teal, T. (2001). The loyalty effect: The hidden force behind growth, profits, and lasting value. Harvard Business Press.
54. Rigopoulou, I. D., Tsiotsou, R. H., & Kehagias, J. D. (2008). Shopping orientation-defined segments based on store-choice criteria and satisfaction: an empirical investigation. Journal of Marketing Management, 24(9-10), 979-995.
55. Singh, J., & Widing, R. E. (1991). What occurs once consumers complain? A theoretical model for understanding satisfaction/dissatisfaction outcomes of complaint responses. European Journal of Marketing, 25(5), 30-46.
56. Siu, N. Y., & Tak-Hing Cheung, J. (2001). A measure of retail service quality. Marketing Intelligence & Planning, 19(2), 88-96.
57. Sivadas, E., & Baker-Prewitt, J. L. (2000). An examination of the relationship between service quality, customer satisfaction, and store loyalty. International Journal of Retail & Distribution Management, 28(2), 73-82.
58. Swanson, S. R., & Kelley, S. W. (2001). Service recovery attributions and word-of-mouth intentions. European Journal of Marketing, 35(1/2), 194-211.
59. Tepeci, M. (1999). Increasing brand loyalty in the hospitality industry. International Journal of Contemporary Hospitality Management, 11(5), 223-230.
60. Thang, D. C. L., & Tan, B. L. B. (2003). Linking consumer perception to preference of retail stores: an empirical assessment of the multi-attributes of store image. Journal of retailing and consumer services, 10(4), 193-200.
61. Tse, D. K., & Wilton, P. C. (1988). Models of consumer satisfaction formation: An extension. Journal of marketing research, 204-212.
62. Varela-Neira, C., Vázquez-Casielles, R., & Iglesias, V. (2010). Explaining customer satisfaction with complaint handling. International Journal of Bank Marketing, 28(2), 88-112.
63. Vazquez, R., Rodrı́guez-Del Bosque , I. A., Dı́az, A. M., & Ruiz, A. V. (2001). Service quality in supermarket retailing: identifying critical service experiences. Journal of retailing and consumer services, 8(1), 1-14.
64. Wong, A., & Sohal, A. (2003). Service quality and customer loyalty perspectives on two levels of retail relationships. Journal of services marketing, 17(5), 495-513.
65. Yan, R. N., Yurchisin, J., & Watchravesringkan, K. (2011). Does formality matter? Effects of employee clothing formality on consumers' service quality expectations and store image perceptions. International Journal of Retail & Distribution Management, 39(5), 346-362.
66. Yoo, C., Park, J., & MacInnis, D. J. (1998). Effects of store characteristics and in-store emotional experiences on store attitude. Journal of Business Research, 42(3), 253-263.
67. Zeithaml, V. A., Bitner, M. J., & Gremler, D. D.(2006), Services Marketing: Integrating Customer Focus across the Firm.
68. Zinn, W., & Liu, P. C. (2001). Consumer response to retail stockouts. Journal of Business Logistics, 22(1), 49-71.
IJSER

International Journal of Scientific & Engineering Research, Volume 7, Issue 8, August-2016 233 ISSN 2229-5518
IJSER © 2016 http://www.ijser.org
IJSER