Embed Size (px)
Citation preview

Adv Ther (2013) 30(2):190–202.DOI 10.1007/s12325-013-0003-x
ORIGINAL RESEARCH
Effect of Pioglitazone Versus Metformin on Cardiovascular Risk Markers in Type 2 Diabetes
Stefano Genovese · Giorgia De Berardis · Antonio Nicolucci · Edoardo Mannucci · Virgilio Evangelista ·
Licia Totani · Fabio Pellegrini · Antonio Ceriello
To view enhanced content go to www.advancesintherapy.comReceived: October 31, 2012 / Published online: January 22, 2013© Springer Healthcare 2013
ABSTRACT
Introduction: Besides its critical role in metabolic
homeostasis, peroxisome proliferator-activated
receptor (PPAR)-γ modulates several cellular
responses involved in atherothrombosis. This
multicenter, double-blind, randomized study
investigated the effects of two oral hypoglycemic
agents on markers of inflammation, platelet
activation, thrombogenesis, and oxidative stress
in patients with type 2 diabetes.
Methods and Results: The primary objective of
this study was to evaluate the effect on C-reactive
protein (CRP) after a 16-week treatment
period with either pioglitazone or metformin.
Additionally, markers of vascular inflammatory
response, platelet activation, thrombogenesis,
oxidative stress, glucose, and lipid metabolism,
as well as liver function, were measured. In total,
50 patients completed the study. Pioglitazone-
treated patients were found to have statistically
significantly larger decreases in mean CRP levels
(–0.4 mg/dL) compared to those treated with
metformin (–0.2 mg/dL) (P = 0.04), as well as
greater reductions in levels of mean fasting
plasma glucose (–27 vs. –9 mg/dL; P = 0.01),
serum insulin (–2 vs. –1.9 mU/L; P = 0.014),
homeostatic model assessment (HOMA) (–1.2
vs. –0.9; P = 0.015), and E-selectin (–12.4 vs.
+3.4 µg/mL; P = 0.01). Mean glycated hemoglobin
(HbA1c) levels decreased in both treatment
groups from baseline to week 16 (–0.4% in the
pioglitazone group, –0.2% in the metformin
On behalf of the PRISCA Study Group.
Australian New Zealand Clinical Trials Registry: ACTRN12608000534381.
S. Genovese Cardiovascular and Metabolic Department, IRCCS MultiMedica Sesto San Giovanni, Milan, Italy
G. De Berardis · A. Nicolucci (*) · F. Pellegrini Department of Clinical Pharmacology and Epidemiology, Consorzio Mario Negri Sud – Via Nazionale 8/A, 66030 S. Maria Imbaro (CH), Italy e-mail: [email protected]
E. Mannucci Diabetes Agency, Careggi Hospital, Florence, Italy
V. Evangelista · L. Totani Department of Translational Pharmacology, Consorzio Mario Negri Sud, S. Maria Imbaro (CH), Italy
A. Ceriello Institut d’Investigacions Biomèdiques August Pi i Sunyer – IDIBAPS, Barcelona, Spain
Enhanced content for Advances in Therapy articles is available on the journal web site: www.advancesintherapy.com

Adv Ther (2013) 30(2):190–202. 191
vascular cell adhesion molecule 1 [VCAM-1])
and the selectin family (P-selectin, E-selectin),
which are upregulated during atherogenesis [6]
and elevated in type 2 diabetes [7]. A growing
body of evidence suggests that inflammatory
pathways could also be involved in
microvascular damage, participating in the
pathogenesis of diabetes complications, such
as retinopathy and nephropathy [8–9].
Thiazolidinediones (TZDs) can reduce CD40
ligand (CD40L) serum levels, suggesting an anti-
inflammatory mechanism [10] and a possible
modulation of platelet aggregation [11]. TZDs
regulate not only the activity of genes involved
in glucidic or lipidic metabolism, but also that
of genes regulating the inflammatory response
of endothelium, vascular smooth muscle
cells, T-cells, and monocytes/macrophages [7].
Furthermore, peroxisome proliferator-activated
receptor (PPAR) activation reduces the
production of inflammatory cytokines and the
expression and release of metallo-proteases from
macrophages [12], while in animal models an
effect of TZDs on oxidative stress production has
also been reported [13, 14].
The anti-inflammatory effect of TZDs
in patients with type 2 diabetes has been
reported in several trials [14–20]. However,
all these studies were designed with different
endpoints (usually glycemic control), and
the anti-inflammatory actions of TZD were
observed only as a secondary outcome. To our
knowledge, this is the first trial to date designed
to assess the effect of repeated doses of the TZD,
pioglitazone, on inflammation, having CRP as
its principal endpoint. Pioglitazone was studied
as monotherapy in order to avoid the possible
interference of other drugs; metformin was
chosen as a comparator because it is not a TZD
agent but it does have a profile of action on
blood glucose and insulin resistance that is as
similar as possible to that of pioglitazone.
group; P = 0.36). Pioglitazone treatment was
also found to be associated with a statistically
significant increase in total cholesterol levels
(+10 mg/dL in the pioglitazone arm, –3 mg/dL in
the metformin arm; P = 0.05) and a decrease in
liver enzyme levels.
Conclusions: The favorable changes in markers
of systemic and vascular inflammatory response
with pioglitazone suggest that it may positively
influence the atherothrombotic process in
type 2 diabetes.
K e y w o r d s : C a r d i o v a s c u l a r d i s e a s e ;
Cardiovascular risk factors; Metformin; Oral
pharmacologic agents; Pioglitazone; Type 2
diabetes
INTRODUCTION
Mechanisms underlying the association
between diabetes and cardiovascular disease
(CVD) are complex, and include hyperglycemia
with increased levels of glycosylation
products, enhanced oxidative stress, and
inflammation, combined with insulin
resistance and alterations of lipid metabolism
[1]. Experimental and epidemiologic evidence
has highlighted the role of the inflammatory
cascade in the pathogenesis of atherosclerosis;
in particular, C-reactive protein (CRP), a
marker of inflammation, is also a predictor
of cardiovascular events [2–4]. Considering
that CRP has a direct proatherogenic effect
through upregulation of angiotensin II type 1
receptors and through the stimulation of other
proinflammatory factors, it is possible that a
reduction in this parameter obtained either
through lifestyle changes or drug therapy has
clinical benefits [5]. Other nonconventional
markers of cardiovascular risk include adhesion
molecules of the immunoglobulin superfamily
(intercellular adhesion molecule 1 [ICAM-1],

192 Adv Ther (2013) 30(2):190–202.
past medical history of myocardial infarction,
transient ischemic attacks, or stroke; congestive
heart failure (New York Heart Association
class I–IV); significant liver (alanine transaminase
[ALT] >2.5 upper limit of normal range) or renal
(serum creatinine >1.2 mg/dL) impairment;
anemia of any etiology (defined as hemoglobin
level <10.5 g/dL) or any other clinically relevant
hematologic disease; diagnosis or suspicion
of any neoplastic disease; history of chronic
alcohol or drug/substance abuse, or presence of
other conditions potentially able to affect study
subjects’ compliance; concomitant therapy with
statins, antioxidant drugs (e.g., vitamins, Q10
coenzyme), beta-blockers, nonsteroidal anti-
inflammatory drugs, aspirin, corticosteroids;
known allergy, sensitivity, or intolerance to
study drugs and/or study drugs’ formulation
ingredients; and participation in another trial
in the 3 months preceding study entry.
Treatment Interventions
Patients were randomly assigned to receive
either pioglitazone or metformin. Treatment was
assigned centrally via telephone after verification
of the inclusion criteria. The first patient was
randomly allocated; for each subsequent patient,
treatment allocation was identified through
the minimization method, which minimizes
the imbalance between groups at that time
according to patient characteristics (center, use
of angiotensin-converting enzyme inhibitors or
angiotensin II receptor antagonists).
Pioglitazone 30 mg was taken once daily as a
starting dose and up-titrated to 45 mg once daily
in later visits in the case of poor response. The
control group was treated with metformin, with
a starting dose of 850 mg/day and up-titrated
to 850 mg twice or three times a day in later
visits depending on the glycemic response.
Study drugs were titrated to higher doses when
MATERIALS AND METHODS
Study Design
The study was designed as a 16-week, double-
blind, randomized, comparative, multicenter,
parallel-group trial. After a maximum 1-week
run-in period, which was necessary to receive
the results of screening laboratory tests for
inclusion and exclusion criteria, eligible patients
were assigned to pioglitazone or metformin. The
overall treatment period was 16 weeks. In total,
five clinic visits took place at the start and end of
the run-in period, and after 4, 8, and 16 weeks
following randomization. Evaluable patients
were those who completed at least 8 weeks of
treatment. The protocol was approved by the
Ethics Committees of all the participating centers.
Study Participants
The study was conducted in 10 diabetes clinics.
Patients of either sex were enrolled, provided they
met all the following inclusion criteria: diagnosis
of type 2 diabetes mellitus (defined using the
American Diabetes Association criteria [21]);
age 35 and 75 years; glycated hemoglobin
(HbA1c) levels ≤9.0%; no pharmacologic
treatment for hyperglycemia in the previous
3 months; negative response to pregnancy test
for female patients of childbearing potential;
cooperative attitude and ability to be trained to
use the investigational drugs correctly and to
attain the study procedures; written informed
consent provided.
Patients were considered not to be eligible if
they met one or more of the following exclusion
criteria: treatment with other oral antidiabetic
drugs or insulin in the 3 months preceding study
entry; pregnant or lactating females; presence
of any disease with malabsorption; acute or
chronic pancreatitis; familiar polyposis coli;

Adv Ther (2013) 30(2):190–202. 193
fasting plasma glucose (FPG) was >140 mg/dL;
in order to maintain the double blind design,
in the case of up-titration, pioglitazone placebo
was administered once or twice a day in addition
to the active pioglitazone tablet. Tablets of each
investigational study drug, as well as pioglitazone
placebo, were encapsulated and packed in bottles
and boxes by the manufacturing contractor
(Farma Resa S.R.L., Cantù, Italy), according to
Good Manufacturing Practices.
Efficacy Parameters
The primary efficacy variable was the change
from baseline in CRP level measured after
a 16-week treatment period. The secondary
efficacy variables were the changes from baseline
in levels of the following parameters: markers
of inflammatory response (adhesion proteins
[P-selectin, E-selectin, ICAM-1], interleukin [IL]-6,
and CD40L); markers of platelet activation and
thrombogenesis (urinary levels of 11-dehydro
thromboxaneB2 [TXB2], circulating levels of tissue
factor (TF), plasminogen activator inhibitor-1;
markers of oxidative stress (nitrotyrosine);
standard metabolic (blood glucose, HbA1c, serum
insulin) and lipidic (total cholesterol, high-
density lipoprotein cholesterol [HDL-C], low-
density lipoprotein cholesterol [LDL-C], very
low-density lipoprotein cholesterol, triglycerides,
nonesterified fatty acids) parameters.
All the parameters were centrally measured at
baseline, and 8 and 16 weeks after randomization,
with the exception of lipid profile, which was
evaluated only at baseline and 16 weeks.
Analytical Methods
CRP was measured with a high sensitivity
nefelometric assay (normal range 0–3 mg/L). The
soluble forms of CD40L and the endothelium-
derived adhesive molecules, P-selectin, E-selectin,
ICAM-1, and VCAM-1 were measured in plasma
using commercially available specific enzyme-
linked immunoassay (ELISA) kits (RD Systems
and Bender Med Systems, Prodotti Gianni,
Milano, Italy). The circulating soluble form of TF
was also measured using a commercial ELISA kit
(IMUBIND® Tissue Factor, American Diagnostica,
Intrumentation Laboratory, Milano, Italy).
TXB2 and 8-iso-prostaglandin F2α markers
of platelet activation and oxidative stress,
respectively, were measured in urine collected
over 24 h. Urinary metabolites were purified
through sequential extraction on Sep-Pak®
C18 cartridges (Waters Associates and Sep-
Pak® silica cartridges, Waters Associates Waters
S.p.A., Milano, Italy). The eluates from the
second extraction were dried, reconstituted in
phosphate buffer, and frozen at –70°C until
analysis by specific ELISA (Cayman Chemicals,
Vinci Biochem, Florence, Italy).
Sample Size
The sample size calculation was based on the
primary objective of demonstrating a reduction
in CRP levels induced by pioglitazone as
opposed to metformin. Based on previous
evidence on troglitazone [22], the sample size
was calculated to detect a reduction of 3 mg/L in
CRP levels in patients treated with pioglitazone
compared to those receiving metformin, with
a statistical power of 90% (α = 0.05), and
assuming a standard deviation in CRP levels of
3 mg/L. Given these assumptions, a minimum
of 20 subjects in each arm were needed. It was
planned to enroll at least 50 individuals to allow
for a 20% dropout rate.
Statistical Methods
Baseline demographic and background
data were summarized as percentages for
194 Adv Ther (2013) 30(2):190–202.
qualitative variables and mean and standard
deviations or median and interquartile ranges
for quantitative variables. Categorical variables
were compared using the Chi-square test.
Student’s t-test or Mann-Whitney U-test were
used to compare continuous variables between
treatment arms.
Within-group changes were tested using
the paired t-test or the signed rank Wilcoxon
test. For the assessment of differences between
treatment groups with respect to primary and
secondary endpoints, a repeated measures
analysis of variance (ANOVA) of the change
from baseline to the end of the study was
applied using PROC MIXED software (SAS,
release 9.1; SAS Institute, Cary, NC, USA).
Continuous variables with substantial
deviations from the normality assumption were
mathematically transformed.
Statistical analyses were performed on
the intention-to-treat population, i.e., all
randomized patients who received at least one
dose of study medication and who completed at
least 8 weeks of treatment.
RESULTS
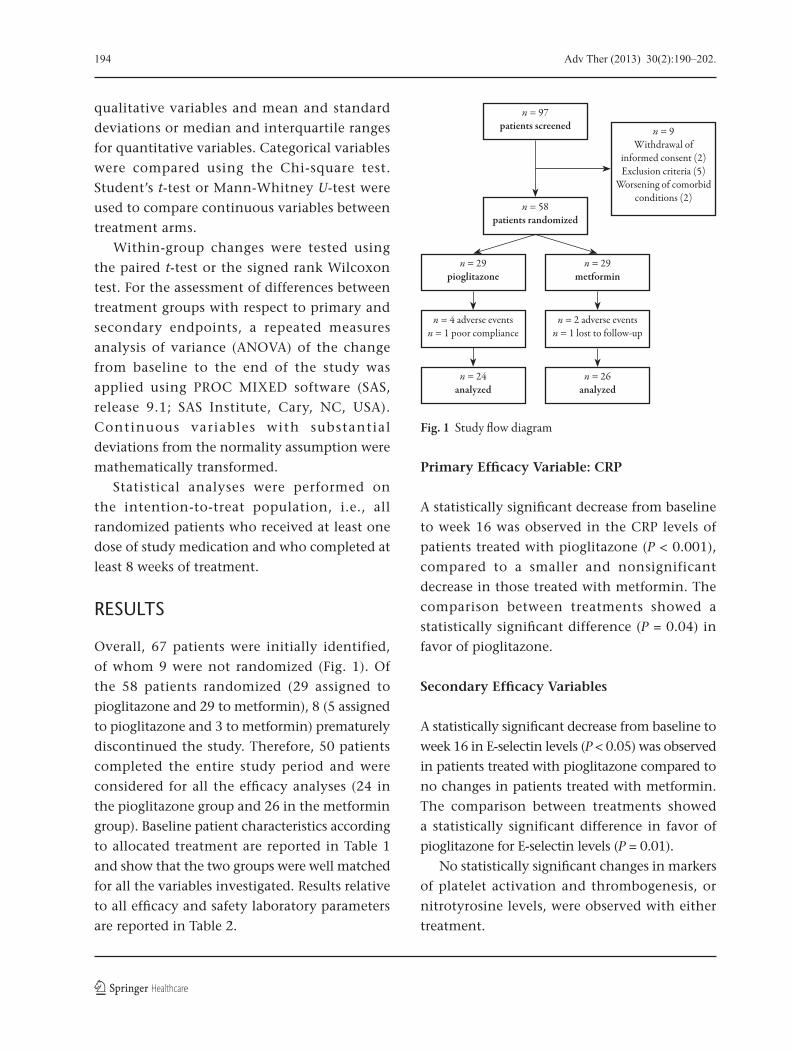
Overall, 67 patients were initially identified,
of whom 9 were not randomized (Fig. 1). Of
the 58 patients randomized (29 assigned to
pioglitazone and 29 to metformin), 8 (5 assigned
to pioglitazone and 3 to metformin) prematurely
discontinued the study. Therefore, 50 patients
completed the entire study period and were
considered for all the efficacy analyses (24 in
the pioglitazone group and 26 in the metformin
group). Baseline patient characteristics according
to allocated treatment are reported in Table 1
and show that the two groups were well matched
for all the variables investigated. Results relative
to all efficacy and safety laboratory parameters
are reported in Table 2.
Primary Efficacy Variable: CRP
A statistically significant decrease from baseline
to week 16 was observed in the CRP levels of
patients treated with pioglitazone (P < 0.001),
compared to a smaller and nonsignificant
decrease in those treated with metformin. The
comparison between treatments showed a
statistically significant difference (P = 0.04) in
favor of pioglitazone.
Secondary Efficacy Variables
A statistically significant decrease from baseline to
week 16 in E-selectin levels (P < 0.05) was observed
in patients treated with pioglitazone compared to
no changes in patients treated with metformin.
The comparison between treatments showed
a statistically significant difference in favor of
pioglitazone for E-selectin levels (P = 0.01).
No statistically significant changes in markers
of platelet activation and thrombogenesis, or
nitrotyrosine levels, were observed with either
treatment.
Fig. 1 Study �ow diagram
n = 4 adverse eventsn = 1 poor compliance
n = 29pioglitazone
n = 24analyzed
n = 2 adverse eventsn = 1 lost to follow-up
n = 29metformin
n = 26analyzed
n = 58patients randomized
n = 97patients screened n = 9
Withdrawal of informed consent (2)Exclusion criteria (5)
Worsening of comorbid conditions (2)

Adv Ther (2013) 30(2):190–202. 195
Table 1 Patient baseline characteristics according to study group
Characteristic Pioglitazone Metformin P value
Number of patients 29 29
Age (years) 59.1±6.8 56.4±7.9 0.17
Gender:
Males 14 (48.3%) 19 (65.5%) 0.18
Females 15 (51.7%) 10 (34.5%) –
BMI (kg/m2) 31.1±3.2 31.7±3.6 0.52
Weight (kg) 84.1±12.5 87.8±11.5 0.24
Smoking (cigarettes/day): 24 (82.8%) 22 (75.9%) 0.70
0
<10 1 (3.4%) 2 (6.9%) –
10–20 2 (6.9%) 1 (3.4%) –
>20 2 (6.9%) 4 (13.8%) –
Diabetes duration (years) 4.4±3.2 3.9±2.2 0.50
CRP (mg/L) 1.9 (1.1–5.3) 2.2 (1.4–3.0) 0.86
FPG (mg/dL) 152±38 146±46 0.55
HbA1c (%) 6.9±0.8 6.8±0.7 0.42
Insulin (mU/L) 9.1 (6.9–14.3) 10.4 (6.7–12.9) 0.96
HOMA index 3.3 (2.4–5.4) 3.5 (2.0–4.7) 0.65
Total cholesterol (mg/dL) 215±24 214±34 0.89
HDL-C (mg/dL) 40±10 39±9 0.66
LDL-C (mg/dL) 145±27 144±29 0.93
VLDL-C (mg/dL) 23 (18–35) 28 (21–36) 0.45
FFA (mmol/L) 0.4 (0.3–0.5) 0.4 (0.3–0.5) 0.61
Triglycerides (mg/dL) 115 (90–167) 138 (104–182) 0.45
P-selectin (μg/mL) 38.9 (21.9–90.0) 41.8 (31.2–62.1) 0.96
E-selectin (μg/mL) 70.8 (53.9–79.6) 65.3 (59.1–82.7) 0.80
ICAM-1 (μg/mL) 290 (232–324) 253 (230–296) 0.42
CD40L (pg/mL) 1.5 (0.5–2.4) 1.2 (0.8–2.2) 0.70
TXB2 (pg/mg creatinine) 144 (75–207) 122 (85–284) 0.77
TF (pg/mL) 114 (102–149) 145 (108–180) 0.26
PAI-1 (ng/mL) 52.0 (24.5–78.6) 33.1 (24.7–81.7) 0.65
Nitrotyrosine (nM) 6.7±1.5 6.5±1.4 0.77
For continuous variables values are mean ± standard deviation or median and range BMI body mass index, CD40L CD40 ligand, CRP C-reactive protein, FFA free fatty acid, FPG fasting plasma glucose, HbA1c glycated hemoglobin, HDL-C high-density lipoprotein cholesterol, HOMA homeostatic model assessment, ICAM-1 intercellular adhesion molecule-1, LDL-C low-density lipoprotein cholesterol, PAI-1 plasminogen activator inhibitor-1, TF tissue factor, TXB2 11-dehydro thromboxaneB2, VLDL-C very low-density lipoprotein cholesterol

196 Adv Ther (2013) 30(2):190–202.
Table 2 Laboratory e�cacy and safety variables with pioglitazone versus metformin
Parameter PioglitazoneBaseline
PioglitazoneWeek 16
MetforminBaseline
MetforminWeek 16
P value
Number of patients 24 24 26 26 –Markers of in�ammatory response
CRP (mg/L) 1.8 (1.1–4.7) 1.4 (0.5–2.5)* 2.0 (1.1–2.9) 1.8 (0.8–3.7) 0.04P-selectin (μg/mL) 56.9 (26.7–140) 52.2 (29.3–126.8) 41.3 (31.2–68.1) 47.5 (29.2–74.1) 0.73E-selectin (μg/mL) 70.2 (52.6–81.5) 57.8 (53.7–83.8)** 65.1 (59.1–79.9) 68.5 (62.9–78.3) 0.01ICAM-1 (μg/mL) 292 (233–322) 269 (241–312) 251 (230–296) 252 (215–309) 0.87CD40L (pg/mL) 1.6 (0.5–2.9) 2.0 (0.4–3.6) 1.3 (0.8–2.5) 1.4 (0.8–2.4) 0.98
Markers of platelet activation and thrombogenesisTXB2 (pg/mg creatinine) 146 (82–221) 121 (87–198) 123 (85–304) 159 (106–191) 0.61TF (pg/mL) 113 (102–131) 139 (113–172) 141 (100–189) 145 (111–223) 0.23PAI-1 (ng/mL) 55.1 (21.0–82.4) 35.8 (23.8–66.1) 32.7 (24.3–81.7) 39.5 (31.7–46.2) 0.69
Markers of oxidative stressNitrotyrosine (nM) 6.7±1.5 6.6±1.6 6.5±1.4 6.3±1.0 0.82
Glucose parametersFPG (mg/dL) 153±40 126±25*** 144±47 135±48* 0.01HbA1c (%) 6.9±0.9 6.5±0.8** 6.7±0.7 6.5±0.7* 0.36Insulin (mU/L) 8.3 (6.7–14.7) 6.3 (4.7–9.2)*** 10.0 (5.3–12.8) 8.1 (5.6–10.6) 0.014HOMA index 3.2 (2.1–5.4) 2.0 (1.3–2.9)*** 3.2 (2.0–4.1) 2.3 (2.1–3.3) 0.015
Lipid parameters
Total cholesterol (mg/dL) 212±24 222±35** 215±35 212±35 0.05
HDL-C (mg/dL) 41±10 45±11* 40±9 42±9*** 0.19
LDL-C (mg/dL) 141±26 148±34 147±29 142±27 0.07
VLDL-C (mg/dL) 22.8 (18.2–33.5) 23.8 (16.0–32.2) 24.3 (17.4–36.4) 26.4 (17.8–37.2) 0.94
FFA (mmol/L) 0.4 (0.3–0.5) 0.4 (0.2–0.5) 0.4 (0.3–0.5) 0.4 (0.3–0.6) 0.07
Triglycerides (mg/dL) 114 (91–168) 119 (80–161) 122 (87–182) 132 (89–186) 0.94
Safety parameters
Hemoglobin (g/dL) 14.4±1.1 14.1±1.0 14.6±1.0 14.4±1.1 0.58
WBCs (109/L) 6.2±1.5 5.9±1.4** 6.5±1.9 6.3±1.7 0.60
Neutrophils (%) 51.4±8.0 50.2±7.2 53.5±7.8 53.7±9.3 0.72
ALT (U/L) 26.5 (20.5–33.0) 19.0 (17.0–23.5)*** 28.0 (23.0–48.0) 27.5 (23.0–46.0) <0.0001
AST (U/L) 20.0 (18.0–23.0) 18.5 (15.0–22.0)* 20.0 (17.0–24.0) 21.0 (16.0–26.0) 0.003
γGT (U/L) 28.0 (21.0–36.5) 19.5 (14.0–26.5)*** 35.5 (24.0–40.0) 32.0 (23.0–40.0) <0.0001
Values are mean ± standard deviation or median and rangeALT alanine transaminase, AST aspartate transaminase, CD40L CD40 ligand, CRP C-reactive protein, FFA free fatty acid, FPG fasting plasma glucose, γGT γ glutamyl transpeptidase, HbA1c glycated hemoglobin, HDL-C high-density lipoprotein cholesterol, HOMA homeostatic model assessment, ICAM-1 intercellular adhesion molecule-1, LDL-C low-density lipoprotein cholesterol, PAI-1 plasminogen activator inhibitor-1, TF tissue factor, TXB2 11-dehydro thromboxaneB2, VLDL-C very low-density lipoprotein cholesterol, WBCs white blood cells* P < 0.01 vs. baseline; ** P < 0.05 vs. baseline; *** P < 0.001 vs. baseline

Adv Ther (2013) 30(2):190–202. 197
A statistically significant decrease from baseline
to week 16 in levels of FPG (P < 0.001), HbA1c
(P < 0.05), insulin (P < 0.001), and homeostatic
model assessment (HOMA) index (P < 0.001) was
observed in patients treated with pioglitazone,
while patients on metformin had a significant
decrease from baseline to week 16 in levels of FPG
(P < 0.01) and HbA1c (P < 0.01). The comparison
between treatments showed a statistically
significant difference in favor of pioglitazone for
levels of FPG (P = 0.01), insulin (P = 0.014), and
HOMA index (P = 0.015), but not for HbA1c.
A statistically significant increase from
baseline to week 16 in levels of total cholesterol
(P < 0.05) and HDL-C (P < 0.01) was observed
in patients treated with pioglitazone, whereas
in those receiving metformin there was a
statistically significant increase from baseline
to week 16 in HDL-C levels (P < 0.001) without
any modification in total cholesterol levels.
The comparison between treatments showed
a statistically significant difference for total
cholesterol in favor of metformin (P = 0.05).
Safety
A total of 39 adverse events (AEs) were reported;
23 in patients treated with pioglitazone and
16 in patients treated with metformin. In total,
17 AEs (11 in patients treated with pioglitazone
and 6 in patients treated with metformin)
were considered to be adverse drug reactions,
i.e., those with a certain, probable, or possible
correlation with study drug. Four hypoglycemic
episodes were reported in the pioglitazone group
and none in the metformin group. No serious
AEs were reported with either treatment. Only
one AE (acute bronchitis) in a patient treated
with metformin was of severe intensity, but was
not considered to be related to study drug.
Six patients, four treated with pioglitazone
and two with metformin, discontinued the study
due to AEs. Causes of early discontinuations
in patients treated with pioglitazone were
hypoglycemia in two patients, general
discomfort, vomiting, and diarrhea in one
patient, and abdominal pain in another patient.
In the metformin group, myocardial ischemia
in one patient and flatulence in another were
responsible for discontinuations.
Laboratory Safety Parameters
The results of hematology tests at baseline and
week 16 showed a statistically significant decrease
from baseline in white blood cell counts (P < 0.05)
in patients treated with pioglitazone. No
substantial changes from baseline in hemoglobin
and neutrophil levels were observed with
either treatment. The comparison between
treatments in hematology parameters did
not show statistically significant differences for
any variable.
The results of liver function enzyme tests
at baseline and week 16 showed a statistically
significant decrease from baseline in levels of
ALT (P < 0.001), aspartate transaminase (AST)
(P < 0.01), and γ glutamyl transpeptidase (GT)
levels (P < 0.001) in patients treated with
pioglitazone, with no substantial changes in
any variable in patients treated with metformin.
The comparison between treatments showed
a statistically significant difference in favor of
pioglitazone for levels of ALT (P < 0.0001), AST
(P = 0.003), and γGT (P < 0.0001).
DISCUSSION
It is increasingly recognized that markers
of vascular inflammation play a role in the
pathogenesis of type 2 diabetes, insulin resistance,
and atherosclerosis [11, 23]; CRP in particular
is an independent predictor of both type 2
diabetes and CVD [4, 24]. The clinical relevance

198 Adv Ther (2013) 30(2):190–202.
of lowering CRP values in terms of reducing
major adverse cardiac events and mortality has
been clearly demonstrated in clinical trials of
statins [25, 26]. Previous studies have shown
that PPAR-γ agonists may affect inflammatory
pathways via transcriptional mechanisms, and
decreases in cytokines, chemokines, and matrix
metallo-proteinases have been demonstrated in
monocytes/macrophages, T-cells, and vascular
smooth muscle cells (VSMC) [27]. TZDs have
been associated with an antiatherogenic effect,
which cannot be completely accounted for by
the observed improvement in glycemic control.
In fact, in comparisons with sulfonylureas, the
TZD, pioglitazone, has shown beneficial effects
on intima-media thickness [28] and on the
progression of coronary atherosclerosis [29],
which are evident after a relatively short
follow-up. Based on these observations,
it can be speculated that the reduction in
major cardiovascular events reported in the
PROspective pioglitAzone Clinical Trial In
macroVascular Events (PROactive) study [30]
and confirmed by meta-analyses, including all
available pioglitazone trials [31–32], is partly due
to some extraglycemic action of the drug.
The anti-inflammatory effect of TZDs is a
good candidate as a potential antiatherogenic
mechanism independent of any glucose-
lowering action. A reduction in levels of markers
of inflammation induced by pioglitazone has
been reported in previous experimental studies
and clinical trials [10–20]. However, in previous
clinical observations, its anti-inflammatory
activity has been reported in comparisons with
placebo or other glucose-lowering, noninsulin-
sensitizing drugs. Therefore, on the basis of
available data, it was not possible to distinguish
between the specific effects of the drug and the
effects induced by the improvement in glucose
control and/or insulin sensitivity. The present
study is the first to consider inflammation
as the principal endpoint, excluding any
concomitant treatments capable of interfering
with the anti-inflammatory effects of the
experimental drug. Interestingly, pioglitazone
monotherapy produced a greater reduction
in CRP levels than did metformin, which also
has an insulin sensitizing effect despite sharing
a similar overall glycemic control. It should
be recognized that the effect of pioglitazone
on insulin sensitivity was greater than that of
metformin, meaning that theoretically, some
of the differences between the two treatments
could be related to the greater enhancement of
insulin action. A beneficial effect of pioglitazone
in reducing CRP in diabetic patients with high
levels of this protein and high cardiovascular
risk has been reported [33]. In the present
study, the authors were able to show that in
diabetic patients at low risk for cardiovascular
disease, this beneficial (CRP-lowering) effect
was superior to that achieved with metformin.
The lack of any significant effect of treatment
on platelet activity and on markers of platelet
activation and thrombogenesis is inconsistent
with previous studies [11, 34]. This result could
be explained by the fact that in the present trial,
the patients enrolled were drug-naïve and they
had relatively moderate hyperglycemia. It is
possible that some of the previously described
benefits of TZD treatment on these parameters
were related to the improvement in blood
glucose in patients with a greater degree of
impairment in metabolic control.
In this study, pioglitazone treatment was
found to be associated with a statistically
significant increase in total cholesterol and
HDL-C levels. It is well recognized that
pioglitazone positively affects the lipid profile
by increasing HDL-C and reducing trigycerides.
The effect on total cholesterol is less clear but
a recent meta-analysis reported that treatment
with this drug was associated with a significant

Adv Ther (2013) 30(2):190–202. 199
reduction in total cholesterol [35]. Furthermore,
it is known that pioglitazone modifies LDL
particle size, reducing its atherogenic effects [36].
Recently, a post-hoc analysis of the PROactive
study showed that the beneficial effect of
pioglitazone on cardiovascular outcome was
mainly due to an increase in HDL-C, rather than
an amelioration of HbA1c [37].
In our study, pioglitazone treatment
significantly decreased levels of liver enzymes.
The positive effect of pioglitazone on liver
enzymes and nonalcoholic fatty liver disease
(NAFLD) is well known and our results confirm
this effect. A recent meta-analysis showed
that in patients with NAFLD, pioglitazone
improved histologic disease activity, slowed
fibrosis progression, and extensively ameliorated
cardiometabolic endpoints [38].
Metformin is recognized by almost all available
guidelines and treatment recommendations
as the drug of choice for patients newly
diagnosed with type 2 diabetes [39–42].
Obviously, such a position, which is based
on an overall assessment of short- and long-
term efficacy, tolerability, safety, and cost data
cannot be modified by any single study showing
the superiority of another drug with respect
to a parameter other than a hard endpoint.
Furthermore, it is not possible to anticipate the
long-term effects associated with a reduction
in CRP levels of the magnitude detected in
our study, although the association between
the levels of this marker and cardiovascular
risk appears to be linear [43]. Only long-
term, large-scale trials specifically designed
for cardiovascular outcomes can provide
reliable information on the effects of drugs on
cardiovascular risk. However, such trials are
unavailable at the present time for most of the
agents currently used in the treatment of type 2
diabetes. This study suggests that alternative
parameters (other than glucose control), that
are diversely affected by glucose-lowering drugs,
should be considered in the overall assessment
of treatments. Moreover, the positive effects of
the two drugs investigated in the present trial
on inflammatory and metabolic parameters
could be regarded as useful consequences in the
treatment of type 2 diabetic patients. Recently,
a retrospective cohort study using data from the
UK-based General Practice Research Database
showed that a combination of metformin plus
pioglitazone appeared to provide superior clinical
outcomes compared with the most commonly
used regimen, represented by the association of
metformin with a sulfonylurea [44].
ACKNOWLEDGMENTS
Funding for this study was provided by Takeda
Italia Farmaceutici S.p.A., Rome, Italy. Antonio
Nicolucci is the guarantor for this article, and
takes responsibility for the integrity of the work
as a whole.
Conflicts of interest. Edoardo Mannucci has
received speaker fees, consultancy honoraria, and
research grants from Takeda Italia Farmaceutici
S.p.A; Antonio Nicolucci received research
grants from Takeda Italia Farmaceutici S.p.A;
and Stefano Genovese has received speaker fees
and consultancy honoraria from Takeda Italia
Farmaceutici S.p.A. The other authors have no
conflicts of interest to disclose.
APPENDIX
PRISCA (Pioglitazone e RISchio CArdiovascolare)
investigators: R. Anichini (Pistoia), A. Baldini
(Modena), A. Ceriello (Udine), A. Corsi
(Arenzano), S. Gambardella (Rome), A. Rossi
(Rozzano), C. B. Giorda (Chieri), R. Iannarelli
(L’Aquila), S. Rossini (Osimo), G. Testa (Rome).
Central laboratories: Consorzio Mario Negri
Sud, Chieti, Italy (L. Totani, G. Dell’Elba, C.

200 Adv Ther (2013) 30(2):190–202.
Amore, S. Manarini, R. Pecce); Exacta Central
Lab, Verona, Italy (A. Lomeo, L. Lomeo, A.
Bolner, W. Filippini); University of Udine, Udine,
Italy (L. Piconi).
Database management and randomization
center: Consorzio Mario Negri Sud, Chieti, Italy
(B. Di Nardo, S. Ferrari).
Statistical analysis: Consorzio Mario Negri
Sud, Chieti, Italy (F. Pellegrini).
REFERENCES
1. Ceriello A, Motz E. Is oxidative stress the pathogenic mechanism underlying insulin resistance, diabetes, and cardiovascular disease? The common soil hypothesis revisited. Arterioscler Thromb Vasc Biol. 2004;24:816–23.
2. Jokl R, Laimins M, Klein RL, Lyons TJ, Lopes-Virella MF, Colwell JA. Platelet plasminogen activator inhibitor 1 in patients with type II diabetes. Diabetes Care. 1994;17:818–23.
3. Imperatore G, Riccardi G, Iovine C, Rivellese AA, Vaccaro O. Plasma fibrinogen: a new factor of the metabolic syndrome. A population-based study. Diabetes Care. 1998;21:649–54.
4. Ridker PM, Hennekens CH, Buring JE, Rifai N. C-reactive protein and other markers of inflammation in the prediction of cardiovascular disease in women. N Engl J Med. 2000;342:836–43.
5. Dandona P. Effects of antidiabetic and antihyperlipidemic agents on C-reactive protein. Mayo Clin Proc. 2008;83:333–842.
6. Jang Y, Lincoff AM, Plow EF, Topol EJ. Cell adhesion molecules in coronary artery disease. J Am Coll Cardiol. 1994;24:1591–601.
7. Evangelista V, Totani L, Rotondo S, et al. Prevention of cardiovascular disease in type-2 diabetes: how to improve the clinical efficacy of aspirin. Thromb Haemost. 2005;93:8–16.
8. Kaul K, Hodgkinson A, Tarr JM, Kohner EM, Chibber R. Is inflammation a common retinal-renal-nerve pathogenic link in diabetes? Curr Diabetes Rev. 2010;6:294–303.
9. Goldberg RB. Cytokine and cytokine-like inflammation markers, endothelial dysfunction, and imbalanced coagulation in development of diabetes and its complications. J Clin Endocrinol Metab. 2009;94:3171–82.
10. Varo N, Vicent D, Libby P, et al. Elevated plasma levels of the atherogenic mediator soluble CD40 ligand in diabetic patients: a novel target of thiazolidinediones. Circulation. 2003;107:2664–9.
11. Akbiyik F, Ray DM, Gettings KF, Blumberg N, Francis CW, Phipps RP. Human bone marrow megakaryocytes and platelets express PPARgamma, and PPARgamma agonists blunt platelet release of CD40 ligand and thromboxanes. Blood. 2004;104:1361–8.
12. Hsueh WA, Law RE. PPARgamma and atherosclerosis: effects on cell growth and movement. Arterioscler Thromb Vasc Biol. 2001;21:1891–5.
13. Bagi Z, Koller A, Kaley G. PPARgamma activation, by reducing oxidative stress, increases NO bioavailability in coronary arterioles of mice with Type 2 diabetes. Am J Physiol Heart Circ Physiol. 2004;286:H742–8.
14. Ceriello A. Thiazolidinediones as anti-inflammatory and anti-atherogenic agents. Diabetes Metab Res Rev. 2008;24:14–26.
15. Isa SH, Najihah I, Nazaimoon WM, et al. Improvement in C-reactive protein and advanced glycosylation end-products in poorly controlled diabetics is independent of glucose control. Diabetes Res Clin Pract. 2006;72:48–52.
16. Goldstein BJ, Weissman PN, Wooddell MJ, Waterhouse BR, Cobitz AR. Reductions in biomarkers of cardiovascular risk in type 2 diabetes with rosiglitazone added to metformin compared with dose escalation of metformin: an EMPIRE trial sub-study. Curr Med Res Opin. 2006;22:1715–23.
17. Davidson JA, McMorn SO, Waterhouse BR, Cobitz AR. A 24-week, multicenter, randomized, double-blind, placebo-controlled, parallel-group study of the efficacy and tolerability of combination therapy with rosiglitazone and sulfonylurea in African American and Hispanic American patients with type 2 diabetes inadequately controlled with sulfonylurea monotherapy. Clin Ther. 2007;29:1900–14.
18. Kahn SE, Haffner SM, Viberti G, et al. Rosiglitazone decreases C-reactive protein to a greater extent relative to glyburide and metformin over 4 years despite greater weight gain: observations from a Diabetes Outcome Progression Trial (ADOPT). Diabetes Care. 2010;33:177–83.

Adv Ther (2013) 30(2):190–202. 201
19. Mattoo V, Eckland D, Widel M, et al. Metabolic effects of pioglitazone in combination with insulin in patients with type 2 diabetes mellitus whose disease is not adequately controlled with insulin therapy: results of a six-month, randomized, double-blind, prospective, multicenter, parallel-group study. Clin Ther. 2005;27:554–67.
20. Derosa G, Cicero AF, Fogari E, D’Angelo A, Bianchi L, Maffioli P. Pioglitazone compared to glibenclamide on lipid profile and inflammation markers in type 2 diabetic patients during an oral fat load. Horm Metab Res. 2011;43:505–12.
21. The Expert Committee on the Diagnosis and Classification of Diabetes Mellitus. Report of the Expert Committee on the Diagnosis and Classification of Diabetes Mellitus. Diabetes Care. 1997;20:1183–97.
22. Chu NV, Kong AP, Kim DD, et al. Differential effects of metformin and troglitazone on cardiovascular risk factors in patients with type 2 diabetes. Diabetes Care. 2002;25:542–9.
23. Saito I, Folsom AR, Brancati FL, Duncan BB, Chambless LE, McGovern PG. Nontraditional risk factors for coronary heart disease incidence among persons with diabetes: the Atherosclerosis Risk in Communities (ARIC) Study. Ann Intern Med. 2000;133:81–91.
24. Pradhan AD, Manson JE, Rifai N, Buring JE, Ridker PM. C-reactive protein, interleukin 6, and risk of developing type 2 diabetes mellitus. JAMA. 2001;286:327–34.
25. Ridker PM, Danielson E, Fonseca FA, et al. Reduction in C-reactive protein and LDL cholesterol and cardiovascular event rates after initiation of rosuvastatin: a prospective study of the JUPITER trial. Lancet. 2009;373:1175–82.
26. Morrow DA, de Lemos JA, Sabatine MS, et al. Clinical relevance of C-reactive protein during follow-up of patients with acute coronary syndromes in the Aggrastat-to-Zocor Trial. Circulation. 2006;114:281–8.
27. Marx N, Schönbeck U, Lazar MA, Libby P, Plutzky J. Peroxisome proliferator-activated receptor gamma activators inhibit gene expression and migration in human vascular smooth muscle cells. Circ Res. 1998;83:1097–103.
28. Mazzone T, Meyer PM, Feinstein SB, et al. Effect of pioglitazone compared with glimepiride on carotid intima-media thickness in type 2 diabetes: a randomized trial. JAMA. 2006;296:2572–81.
29. Nissen SE, Nicholls SJ, Wolski K, et al. Comparison of pioglitazone vs glimepiride on progression of coronary atherosclerosis in patients with type 2 diabetes: the PERISCOPE randomized controlled trial. JAMA. 2008;299:1561–73.
30. Dormandy JA, Charbonnel B, Eckland DJ, et al. Secondary prevention of macrovascular events in patients with type 2 diabetes in the PROactive Study (PROspective pioglitAzone Clinical Trial In macroVascular Events): a randomised controlled trial. Lancet. 2005;366:1279–89.
31. Lincoff AM, Wolski K, Nicholls SJ, Nissen SE. Pioglitazone and risk of cardiovascular events in patients with type 2 diabetes mellitus: a meta-analysis of randomized trials. JAMA. 2007;298:1180–8.
32. Mannucci E, Monami M, Lamanna C, Gensini GF, Marchionni N. Pioglitazone and cardiovascular risk. A comprehensive meta-analysis of randomized clinical trials. Diabetes Obes Metab. 2008;10:1221–38.
33. Karagiannis E, Pfützner A, Forst T, et al. The IRIS V study: pioglitazone improves systemic chronic inflammation in patients with type 2 diabetes under daily routine conditions. Diabetes Technol Ther. 2008;10:206–12.
34. De Jager J, Kooy A, Lehert P, et al. Effects of short-term treatment with metformin on markers of endothelial function and inflammatory activity in type 2 diabetes mellitus: a randomized, placebo-controlled trial. J Intern Med. 2005;257:100–9.
35. Monami M, Vitale V, Ambrosio ML, et al. Effects on lipid profile of dipeptidyl peptidase 4 inhibitors, pioglitazone, acarbose, and sulfonylureas: meta-analysis of placebo-controlled trials. Adv Ther. 2012;29:736–46.
36. Deeg MA, Buse JB, Goldberg RB, et al. GLAI Study Investigators. Pioglitazone and rosiglitazone have different effects on serum lipoprotein particle concentrations and sizes in patients with type 2 diabetes and dyslipidemia. Diabetes Care. 2007;30:2458–64.
37. Ferrannini E, Betteridge DJ, Dormandy JA, et al. High-density lipoprotein-cholesterol and not HbA1c was directly related to cardiovascular outcome in PROactive. Diabetes Obes Metab. 2011;13:759–64.
202 Adv Ther (2013) 30(2):190–202.
38. Musso G, Cassader M, Rosina F, Gambino R. Impact of current treatments on liver disease, glucose metabolism and cardiovascular risk in non-alcoholic fatty liver disease (NAFLD): a systematic review and meta-analysis of randomised trials. Diabetologia. 2012;55:885–904.
39. Nathan DM, Buse JB, Davidson MB, et al. Management of hyperglycemia in type 2 diabetes: a consensus algorithm for the initiation and adjustment of therapy: update regarding thiazolidinediones: a consensus statement from the American Diabetes Association and the European Association for the Study of Diabetes. Diabetes Care. 2008;31:173–5.
40. National Collaborating Centre for Chronic Conditions (UK). National Institute for Health and Clinical Excellence: Guidance. Type 2 Diabetes: National Clinical Guideline for Management in Primary and Secondary Care (Update). London: Royal College of Physicians (UK); 2008.
41. Handelsman Y, Mechanick JI, Blonde L, et al. American Association of Clinical Endocrinologists Medical Guidelines for Clinical Practice for developing a diabetes mellitus comprehensive care plan. Endocr Pract. 2011;17(Suppl. 2):1–53.
42. IDF Clinical Guidelines Task Force. Global Guideline for Type 2 Diabetes: recommendations for standard, comprehensive, and minimal care. Diabet Med. 2006;23:579–93.
43. Yeboah J, McClelland RL, Polonsky TS, et al. Comparison of novel risk markers for improvement in cardiovascular risk assessment in intermediate-risk individuals. JAMA. 2012;308:788–95.
44. Morgan CL, Poole CD, Evans M, Barnett AH, Jenkins-Jones S, Currie CJ. What next after metformin? A retrospective evaluation of the outcome of second-line, glucose-lowering therapies in people with type 2 diabetes. J Clin Endocrinol Metab. 2012;97:4605–12.