Embed Size (px)
Citation preview
Consult this publication on line at http://dx.doi.org/10.1787/eag_highlights-2013-en.
This work is published on the OECD iLibrary, which gathers all OECD books, periodicals and statistical databases.Visit www.oecd-ilibrary.org for more information.
Education at a Glance 2013HIGHLIGHTS
Education at a Glance 2013HIGHLIGHTS
Education at a Glance 2013: Highlights summarises the OECD’s fl agship compendium of education statistics, Education at a Glance. It provides easily accessible data on key topics in education today, including:
• Education levels and student numbers: How far have adults studied, and how does early childhood education affect student performance later on?
• Higher education and work: How many young people graduate from tertiary education, and how easily do they enter the world of work?
• Economic and social benefi ts of education: How does education affect people’s job prospects, and what is its impact on incomes?
• Paying for education: What share of public spending goes on education, and what is the role of private spending?
• The school environment: How many hours do teachers work, and how does class size vary?
• Each indicator is presented on a two-page spread. The left-hand page explains the signifi cance of the indicator, discusses the main fi ndings, examines key trends and provides readers with a roadmap for fi nding out more in the OECD education databases and in other OECD education publications. The right-hand page contains clearly presented charts and tables, accompanied by dynamic hyperlinks (StatLinks) that direct readers to the corresponding data in Excel™ format.
ISBN 978-92-64-20106-496 2013 04 1 P -:HSTCQE=WUVU[Y:
Ed
ucation at a G
lance 2013 HIG
HL
IGH
TS
2013
Education at a Glance2013
HIGHLIGHTS
This work is published on the responsibility of the Secretary-General of the OECD. The
opinions expressed and arguments employed herein do not necessarily reflect the official
views of the Organisation or of the governments of its member countries.
This document and any map included herein are without prejudice to the status of or
sovereignty over any territory, to the delimitation of international frontiers and boundaries
and to the name of any territory, city or area.
ISBN 978-92-64-20106-4 (print)ISBN 978-92-64-20107-1 (HTML)
Series: Education at a GlanceISSN 2076-2631 (print)ISSN 2076-264X (online)
The statistical data for Israel are supplied by and under the responsibility of the relevant Israeli authorities. The useof such data by the OECD is without prejudice to the status of the Golan Heights, East Jerusalem and Israelisettlements in the West Bank under the terms of international law.
Photo credits: Cover © Blue Jean images/Getty images.Images: Chapter 1 © Jeffrey Coolidge/The Image Bank/Getty Images.
Chapter 2 © Wavebreakmedia /Shutterstock.Chapter 3 © Tom Grill/Photographer’s Choice RF/Getty Images.Chapter 4 © Julia Smith/Riser/Getty Images.Chapter 5 © Image Source/Getty Images.
Corrigenda to OECD publications may be found on line at: www.oecd.org/publishing/corrigenda.
© OECD 2013
You can copy, download or print OECD content for your own use, and you can include excerpts from OECD publications, databases and
multimedia products in your own documents, presentations, blogs, websites and teaching materials, provided that suitable
acknowledgment of the source and copyright owner is given. All requests for public or commercial use and translation rights should be
submitted to [email protected]. Requests for permission to photocopy portions of this material for public or commercial use shall be
addressed directly to the Copyright Clearance Center (CCC) at [email protected] or the Centre français d'exploitation du droit de copie
(CFC) at [email protected].
Please cite this publication as:OECD (2013), Education at a Glance 2013: Highlights, OECD Publishing.http://dx.doi.org/10.1787/eag_highlights-2013-en
FOREWORD
Foreword
Education at a Glance 2013: Highlights offers a reader-friendly introduction to the OECD’s
collection of internationally comparable data on education.
As the name suggests, it is derived from Education at a Glance 2013, the OECD’s flagship
compendium of education statistics. However, it differs from that publication in a number of ways,
most significantly in its structure, which is made up of five sections that explore the following topics:
● Education levels and student numbers: This section looks at education levels and trends in
the general population, early childhood and secondary education systems.
● Higher education and work: This section looks at how many students enter and successfully
complete tertiary education, as well as young people’s transition from school to the world of work.
● The economic and social benefits of education: This section looks at the extent to which
education brings economic gains to individuals, in the form of higher incomes and lower
unemployment rates, and at how these benefits serve as an incentive for people and societies to
invest in education. It also examines the societal benefits related to having a highly educated
population.
● Paying for education: This section looks at how much countries spend on education, the role of
private spending, what education money is spent on and whether countries are getting value for
money.
● The school environment: This section looks at how much time teachers spend at work, and
how much of that time is spent teaching, class sizes and teachers’ salaries.
In general, this publication uses the terminology employed in Education at a Glance 2013.
However, in one or two places terminology has been simplified. Readers who want to find out more
should consult the Reader’s Guide.
Tables and charts in this volume are accompanied by a dynamic hyperlink, or StatLink, that will
direct readers to an Internet site where the corresponding data are available in ExcelTM format. In
addition, reference is sometimes made in the text to charts and tables that appear in Education at
a Glance 2013. This material can generally be accessed via the StatLinks accompanying the tables
and charts in the relevant indicator, or at www.oecd.org/edu/eag.htm.
Readers wishing to find out more about the OECD’s work on education should go to
www.oecd.org/edu.
EDUCATION AT A GLANCE 2013: HIGHLIGHTS © OECD 2013 3

TABLE OF CONTENTS
Table of contents
Executive summary . . . . . . . . . . . . . . . . . . . . . . . . . . . . . . . . . . . . . . . . . . . . . . . . . . . . . . . . . 7
Reader’s Guide . . . . . . . . . . . . . . . . . . . . . . . . . . . . . . . . . . . . . . . . . . . . . . . . . . . . . . . . . . . . . 9
1. Education levels and student numbers . . . . . . . . . . . . . . . . . . . . . . . . . . . . . . . . . . . . 13
To what level have adults studied? . . . . . . . . . . . . . . . . . . . . . . . . . . . . . . . . . . . . . . . . 14
Who participates in education? . . . . . . . . . . . . . . . . . . . . . . . . . . . . . . . . . . . . . . . . . . . 16
What is the role of early childhood education? . . . . . . . . . . . . . . . . . . . . . . . . . . . . . . 18
How many young people finish secondary education?. . . . . . . . . . . . . . . . . . . . . . . . 20
2. Higher education and work . . . . . . . . . . . . . . . . . . . . . . . . . . . . . . . . . . . . . . . . . . . . . . 23
How many young people enter tertiary education? . . . . . . . . . . . . . . . . . . . . . . . . . . 24
How many young people graduate from tertiary education?. . . . . . . . . . . . . . . . . . . 26
How many students fail to graduate? . . . . . . . . . . . . . . . . . . . . . . . . . . . . . . . . . . . . . . 28
How successful are students in moving from education to work? . . . . . . . . . . . . . . 30
How many students study abroad and where do they go?. . . . . . . . . . . . . . . . . . . . . 32
3. The economic and social benefits of education . . . . . . . . . . . . . . . . . . . . . . . . . . . . . 35
How much more do tertiary graduates earn? . . . . . . . . . . . . . . . . . . . . . . . . . . . . . . . . 36
How does education affect employment rates? . . . . . . . . . . . . . . . . . . . . . . . . . . . . . . 38
What are the incentives to invest in education? . . . . . . . . . . . . . . . . . . . . . . . . . . . . . 40
What are the health benefits of education? . . . . . . . . . . . . . . . . . . . . . . . . . . . . . . . . . 42
4. Paying for education . . . . . . . . . . . . . . . . . . . . . . . . . . . . . . . . . . . . . . . . . . . . . . . . . . . . 45
How much is spent per student? . . . . . . . . . . . . . . . . . . . . . . . . . . . . . . . . . . . . . . . . . . 46
What share of national wealth is spent on education? . . . . . . . . . . . . . . . . . . . . . . . 48
What share of public spending goes to education? . . . . . . . . . . . . . . . . . . . . . . . . . . . 50
What is the role of private spending? . . . . . . . . . . . . . . . . . . . . . . . . . . . . . . . . . . . . . . 52
How much do tertiary students pay?. . . . . . . . . . . . . . . . . . . . . . . . . . . . . . . . . . . . . . . 54
How much do teachers cost? . . . . . . . . . . . . . . . . . . . . . . . . . . . . . . . . . . . . . . . . . . . . . 56
5. The school environment . . . . . . . . . . . . . . . . . . . . . . . . . . . . . . . . . . . . . . . . . . . . . . . . . 59
How long do students spend in the classroom?. . . . . . . . . . . . . . . . . . . . . . . . . . . . . . 60
How many students are in each classroom? . . . . . . . . . . . . . . . . . . . . . . . . . . . . . . . . 62
How much are teachers paid?. . . . . . . . . . . . . . . . . . . . . . . . . . . . . . . . . . . . . . . . . . . . . 64
How much time do teachers spend teaching? . . . . . . . . . . . . . . . . . . . . . . . . . . . . . . . 66
Statistical note . . . . . . . . . . . . . . . . . . . . . . . . . . . . . . . . . . . . . . . . . . . . . . . . . . . . . . . . . . . . . 69
Glossary . . . . . . . . . . . . . . . . . . . . . . . . . . . . . . . . . . . . . . . . . . . . . . . . . . . . . . . . . . . . . . . . . . . 71
Further reading. . . . . . . . . . . . . . . . . . . . . . . . . . . . . . . . . . . . . . . . . . . . . . . . . . . . . . . . . . . . . 75
EDUCATION AT A GLANCE 2013: HIGHLIGHTS © OECD 2013 5
Look for the StatLinks2at the bottom of the tables or graphs in this book.
To download the matching Excel® spreadsheet, just type the link into your
Internet browser, starting with the http://dx.doi.org prefix, or click on the link from
the e-book edition.
Follow OECD Publications on:
This book has... StatLinks2A service that delivers Excel® files from the printed page!
http://twitter.com/OECD_Pubs
http://www.facebook.com/OECDPublications
http://www.linkedin.com/groups/OECD-Publications-4645871
http://www.youtube.com/oecdilibrary
http://www.oecd.org/oecddirect/ OECD
Alerts
EXECUTIVE SUMMARY: EDUCATION AND SKILLS IN THE MIDST OF THE CRISIS
Executive summary:Education and skills
in the midst of the crisis
Between 2008 and 2011 unemployment rates climbed steeply in most countries covered
in this edition of Education at a Glance: Highlights and have remained high ever since. Young
people have been particularly hard-hit by un- and underemployment as a result of the
global recession. In 2011, the average proportion of 15-29 year-olds neither in employment
nor in education or training (NEET) across the OECD was 16%; among 25-29 year-olds, 20%
were NEET. In some countries the figures are much higher, with more than one in three
people between the ages of 25 and 29 neither in education nor in work. These young people
are forced to pay a very high price for a crisis that was not of their making, with long-
lasting effects on their skills, work morale and social integration.
A good education is still valuable
Educational attainment has a huge impact on employability and the crisis only
strengthened this impact. On average across OECD countries, 4.8% of individuals with a
tertiary degree were unemployed in 2011, while 12.6% of those lacking a secondary
education were. Between 2008 and 2011 the unemployment gap between those with low
levels of education and those with high levels of education widened: across all age groups,
the unemployment rate for low-educated individuals increased by almost 3.8 percentage
points, while it increased by only 1.5 percentage points for highly educated individuals.
For young people, a good education provides valuable insurance against a lack of work
experience, even during a crisis: across OECD countries, an average of 18.1% of 25-34 year-
olds without secondary education were unemployed in 2011, compared with 8.8% of 55-64
year-olds. Among 25-34 year-olds with a tertiary qualification, 6.8%, on average, were
unemployed, compared with 4.0% of 55-64 year-olds with a similar level of education.
Though many factors play a role in a country’s capacity to contain the rise in youth
unemployment in times of crisis, the way institutional arrangements between education
and work facilitate transitions into employment is perhaps one of the most important.
Countries that have a higher-than-average (32%) proportion of graduates from vocational
programmes, such as Austria, the Czech Republic, Germany and Luxembourg, were all able
to keep the increases in unemployment rates among this age group to below 8 percentage
points. Conversely, countries such as Greece, Ireland and Spain, where less than 25% of
young adults graduate from vocational upper secondary education, saw increases in
unemployment rates of 12 percentage points or more among 25-34 year-olds with only
secondary education.
EDUCATION AT A GLANCE 2013: HIGHLIGHTS © OECD 2013 7
EXECUTIVE SUMMARY: EDUCATION AND SKILLS IN THE MIDST OF THE CRISIS
8
The link between education and earnings remainsstrong
Educational attainment not only affects employability, it also has an impact on income
from employment. On average, the relative earnings of tertiary-educated adults is over 1.5
times that of adults with upper secondary education, while individuals without an upper
secondary education earn 25% less, on average, than their peers who have attained that
level of education. The crisis has widened this wage gap: the average difference between
earnings from employment between low-educated and highly educated individuals was
75%, on average across OECD countries in 2008, and increased to 90% in 2011.
The wage gap between those with low and high levels of education tends to increase with
age – as does the wage premium for tertiary education. Without a secondary education,
25-34 year-olds earn 80% of what their colleagues with a secondary education earn, on
average, but 55-64 year-olds who have not attained a secondary education earn only 72% of
what their peers with a secondary education earn. Meanwhile, a 25-34 year-old with a
tertiary education earns 40% more, on average, than an adult of the same age who has only
a secondary education, while a 55-64 year-old earns 76% more. A degree from an institution
of higher education clearly pays off in the long run.
Other findings
● In 2011, 84% of 15-19 year-olds were enrolled in education on average across OECD
countries; and the proportion of 20-29 year-olds in education climbed from 22% in 2000
to 28% in 2011. As a consequence, the proportion of adults with a tertiary education
qualification rose by more than 10 percentage points between 2000 and 2011. Across
OECD countries, 39% of 25-34 year-olds had a tertiary level qualification in 2011.
● Teachers, too, were affected by the crisis. Between 2000 and 2011, teachers’ salaries rose,
in real terms, in most countries with available data. However, in some countries,
teachers’ salaries were either cut or frozen between 2009 and 2010, as a result of the
fiscal constraints imposed in response to the economic downturn. But even in the best
of times, most teachers’ salaries are not competitive with those of similarly educated
workers in other fields.
● Most children in OECD countries now begin their formal education well before they are
5 years old. Eight in ten 4-year-olds (82%) are enrolled in early childhood education
across OECD countries, while in Belgium, France, Iceland, Italy, Norway, Spain and
Sweden, education is universal (more than 90%) from 3 years old.
● Data also show the popularity of studying abroad, particularly among students from
Asia. In 2011, 4.3 million tertiary students were enrolled in programmes outside their
country of citizenship. Australia, the United Kingdom, Switzerland, New Zealand and
Austria have, in descending order, the highest percentages of international students
among their tertiary enrolments. The number of foreign students enrolled in tertiary
education in OECD countries was almost three times the number of citizens from an
OECD country studying abroad.
● For the first time, Education at a Glance 2013: Highlights considers the association between
education and two social outcomes: obesity and smoking. Perhaps not surprisingly, the
data suggest that more highly educated adults are less likely to be obese and to smoke
than those with lower levels of education.
EDUCATION AT A GLANCE 2013: HIGHLIGHTS © OECD 2013

READER’S GUIDE
Reader’s Guide
This section introduces some of the terminology used in this publication, and explains
how readers can use the links provided to get further information.
Levels of educationEducation systems vary considerably from country to country, including the ages at
which students typically begin and end each phase of schooling, the duration of courses,
and what students are taught and expected to learn. These variations greatly complicate
the compilation of internationally comparable statistics on education. In response, the
United Nations created an International Standard Classification of Education (ISCED),
which provides a basis for comparing different education systems and a standard
terminology.
The table below introduces this system of classification and explains what is meant by
each level of education. Readers should note that this publication uses slightly simplified
terminology, which differs from that used in both the ISCED classification and in Education
at a Glance 2013. The table shows the equivalent terms in the two publications, the ISCED
classifications and definitions of what it all means.
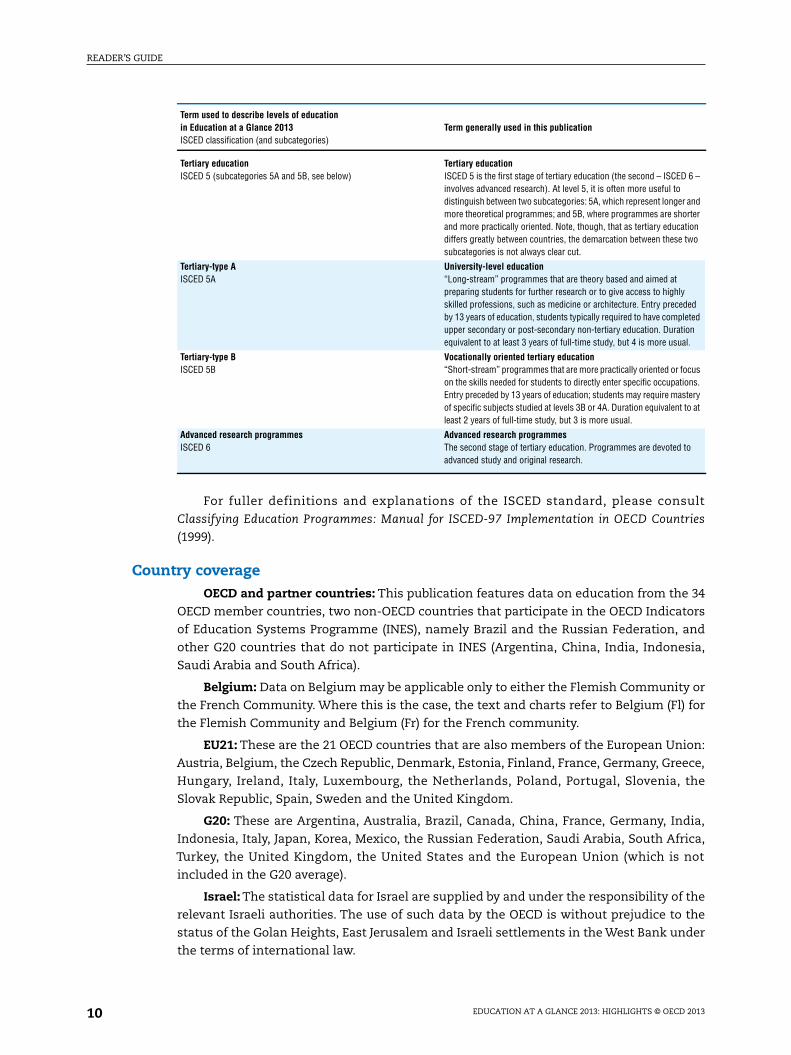
Term used to describe levels of educationin Education at a Glance 2013ISCED classification (and subcategories)
Term generally used in this publication
Pre-primary educationISCED 0
Pre-primary educationThe first stage of organised instruction designed to introduce veryyoung children to the school atmosphere. Minimum entry age of 3.
Primary educationISCED 1
Primary educationDesigned to provide a sound basic education in reading, writing andmathematics and a basic understanding of some other subjects. Entryage: between 5 and 7. Duration: 6 years.
Lower secondary educationISCED 2 (subcategories: 2A prepares students for continuing academiceducation, leading to 3A; 2B has stronger vocational focus, leadingto 3B; 2C offers preparation for entering workforce)
Lower secondary educationCompletes provision of basic education, usually in a more subject-oriented way with more specialist teachers. Entry follows 6 years ofprimary education; duration is 3 years. In some countries, the end ofthis level marks the end of compulsory education.
Upper secondary educationISCED 3 (subcategories: 3A prepares students for university-leveleducation at level 5A ; 3B for entry to vocationally oriented tertiaryeducation at level 5B; 3C prepares students for workforce or for post-secondary non tertiary education, ISCED 4)
Upper secondary educationEven stronger subject specialisation than at lower-secondary level, withteachers usually more qualified. Students typically expected to havecompleted 9 years of education or lower secondary schooling beforeentry and are generally around the age of 15 or 16.
Post-secondary non-tertiary educationISCED 4 (subcategories: 4A may prepare students for entry to tertiaryeducation, both university-level and vocationally oriented education;4B typically prepares students to enter the workforce)
Post-secondary non-tertiary educationProgrammes at this level may be regarded nationally as part of uppersecondary or post-secondary education, but in terms of internationalcomparison their status is less clear cut. Programme content may notbe much more advanced than in upper secondary, and is certainly lowerthan at tertiary level. Entry typically requires completion of an uppersecondary programme. Duration usually equivalent to between 6months and 2 years of full-time study.
EDUCATION AT A GLANCE 2013: HIGHLIGHTS © OECD 2013 9
READER’S GUIDE
10
For fuller definitions and explanations of the ISCED standard, please consult
Classifying Education Programmes: Manual for ISCED-97 Implementation in OECD Countries
(1999).
Country coverageOECD and partner countries: This publication features data on education from the 34
OECD member countries, two non-OECD countries that participate in the OECD Indicators
of Education Systems Programme (INES), namely Brazil and the Russian Federation, and
other G20 countries that do not participate in INES (Argentina, China, India, Indonesia,
Saudi Arabia and South Africa).
Belgium: Data on Belgium may be applicable only to either the Flemish Community or
the French Community. Where this is the case, the text and charts refer to Belgium (Fl) for
the Flemish Community and Belgium (Fr) for the French community.
EU21: These are the 21 OECD countries that are also members of the European Union:
Austria, Belgium, the Czech Republic, Denmark, Estonia, Finland, France, Germany, Greece,
Hungary, Ireland, Italy, Luxembourg, the Netherlands, Poland, Portugal, Slovenia, the
Slovak Republic, Spain, Sweden and the United Kingdom.
G20: These are Argentina, Australia, Brazil, Canada, China, France, Germany, India,
Indonesia, Italy, Japan, Korea, Mexico, the Russian Federation, Saudi Arabia, South Africa,
Turkey, the United Kingdom, the United States and the European Union (which is not
included in the G20 average).
Israel: The statistical data for Israel are supplied by and under the responsibility of the
relevant Israeli authorities. The use of such data by the OECD is without prejudice to the
status of the Golan Heights, East Jerusalem and Israeli settlements in the West Bank under
the terms of international law.
Tertiary educationISCED 5 (subcategories 5A and 5B, see below)
Tertiary educationISCED 5 is the first stage of tertiary education (the second – ISCED 6 –involves advanced research). At level 5, it is often more useful todistinguish between two subcategories: 5A, which represent longer andmore theoretical programmes; and 5B, where programmes are shorterand more practically oriented. Note, though, that as tertiary educationdiffers greatly between countries, the demarcation between these twosubcategories is not always clear cut.
Tertiary-type AISCED 5A
University-level education“Long-stream” programmes that are theory based and aimed atpreparing students for further research or to give access to highlyskilled professions, such as medicine or architecture. Entry precededby 13 years of education, students typically required to have completedupper secondary or post-secondary non-tertiary education. Durationequivalent to at least 3 years of full-time study, but 4 is more usual.
Tertiary-type BISCED 5B
Vocationally oriented tertiary education“Short-stream” programmes that are more practically oriented or focuson the skills needed for students to directly enter specific occupations.Entry preceded by 13 years of education; students may require masteryof specific subjects studied at levels 3B or 4A. Duration equivalent to atleast 2 years of full-time study, but 3 is more usual.
Advanced research programmesISCED 6
Advanced research programmesThe second stage of tertiary education. Programmes are devoted toadvanced study and original research.
Term used to describe levels of educationin Education at a Glance 2013ISCED classification (and subcategories)
Term generally used in this publication
EDUCATION AT A GLANCE 2013: HIGHLIGHTS © OECD 2013
READER’S GUIDE
Notes to tables and chartsFor further details on the data behind any figure, see the relevant indicator in the full
publication Education at a Glance 2013, or click the hyperlink in the figure’s source to
download the data and notes.
EDUCATION AT A GLANCE 2013: HIGHLIGHTS © OECD 2013 11

EDUCATION AT A GLANCE 2013: HIGHLIG
1. EDUCATION LEVELS AND STUDENTNUMBERS
To what level have adults studied?
Who participates in education?
What is the role of early childhood education?
How many young people finish secondary education?
HTS © OECD 2013 13
1. EDUCATION LEVELS AND STUDENT NUMBERS
To what level have adults studied?
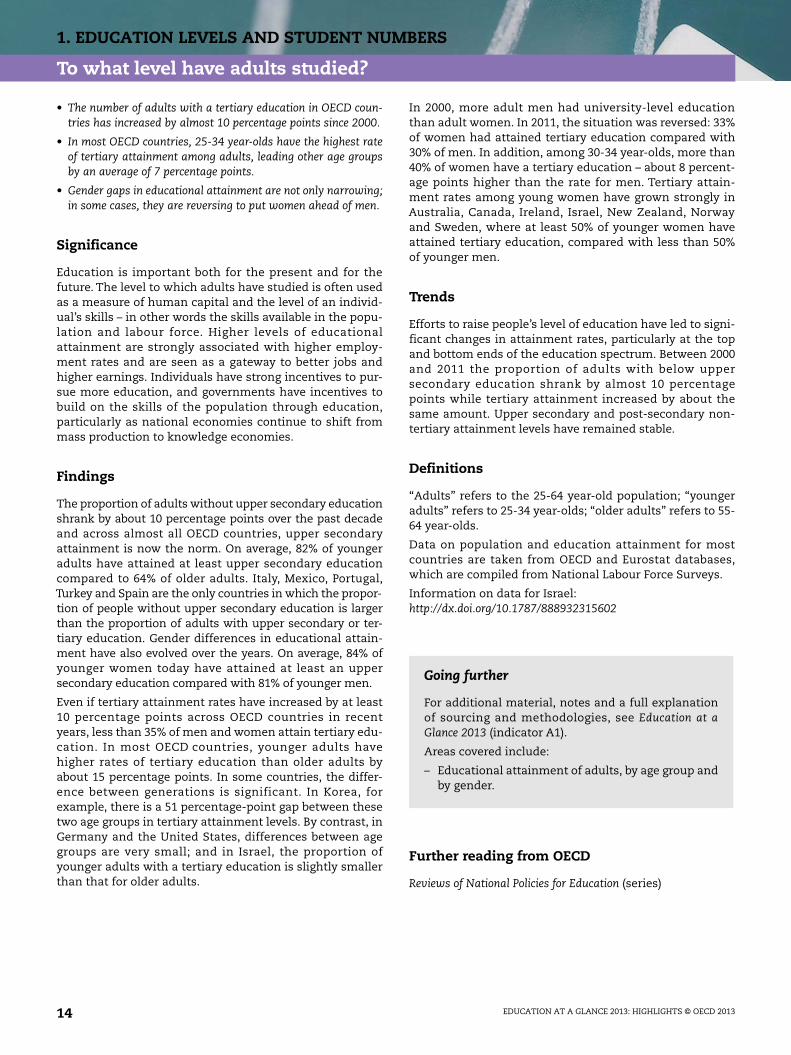
• The number of adults with a tertiary education in OECD coun-tries has increased by almost 10 percentage points since 2000.
• In most OECD countries, 25-34 year-olds have the highest rateof tertiary attainment among adults, leading other age groupsby an average of 7 percentage points.
• Gender gaps in educational attainment are not only narrowing;in some cases, they are reversing to put women ahead of men.
Significance
Education is important both for the present and for thefuture. The level to which adults have studied is often usedas a measure of human capital and the level of an individ-ual’s skills – in other words the skills available in the popu-lation and labour force. Higher levels of educationalattainment are strongly associated with higher employ-ment rates and are seen as a gateway to better jobs andhigher earnings. Individuals have strong incentives to pur-sue more education, and governments have incentives tobuild on the skills of the population through education,particularly as national economies continue to shift frommass production to knowledge economies.
Findings
The proportion of adults without upper secondary educationshrank by about 10 percentage points over the past decadeand across almost all OECD countries, upper secondaryattainment is now the norm. On average, 82% of youngeradults have attained at least upper secondary educationcompared to 64% of older adults. Italy, Mexico, Portugal,Turkey and Spain are the only countries in which the propor-tion of people without upper secondary education is largerthan the proportion of adults with upper secondary or ter-tiary education. Gender differences in educational attain-ment have also evolved over the years. On average, 84% ofyounger women today have attained at least an uppersecondary education compared with 81% of younger men.
Even if tertiary attainment rates have increased by at least10 percentage points across OECD countries in recentyears, less than 35% of men and women attain tertiary edu-cation. In most OECD countries, younger adults havehigher rates of tertiary education than older adults byabout 15 percentage points. In some countries, the differ-ence between generations is significant. In Korea, forexample, there is a 51 percentage-point gap between thesetwo age groups in tertiary attainment levels. By contrast, inGermany and the United States, differences between agegroups are very small; and in Israel, the proportion ofyounger adults with a tertiary education is slightly smallerthan that for older adults.
In 2000, more adult men had university-level educationthan adult women. In 2011, the situation was reversed: 33%of women had attained tertiary education compared with30% of men. In addition, among 30-34 year-olds, more than40% of women have a tertiary education – about 8 percent-age points higher than the rate for men. Tertiary attain-ment rates among young women have grown strongly inAustralia, Canada, Ireland, Israel, New Zealand, Norwayand Sweden, where at least 50% of younger women haveattained tertiary education, compared with less than 50%of younger men.
Trends
Efforts to raise people’s level of education have led to signi-ficant changes in attainment rates, particularly at the topand bottom ends of the education spectrum. Between 2000and 2011 the proportion of adults with below uppersecondary education shrank by almost 10 percentagepoints while tertiary attainment increased by about thesame amount. Upper secondary and post-secondary non-tertiary attainment levels have remained stable.
Definitions
“Adults” refers to the 25-64 year-old population; “youngeradults” refers to 25-34 year-olds; “older adults” refers to 55-64 year-olds.
Data on population and education attainment for mostcountries are taken from OECD and Eurostat databases,which are compiled from National Labour Force Surveys.
Information on data for Israel:http://dx.doi.org/10.1787/888932315602
Further reading from OECD
Reviews of National Policies for Education (series)
Going further
For additional material, notes and a full explanationof sourcing and methodologies, see Education at aGlance 2013 (indicator A1).
Areas covered include:
– Educational attainment of adults, by age group andby gender.
EDUCATION AT A GLANCE 2013: HIGHLIGHTS © OECD 201314
1. EDUCATION LEVELS AND STUDENT NUMBERS
To what level have adults studied?
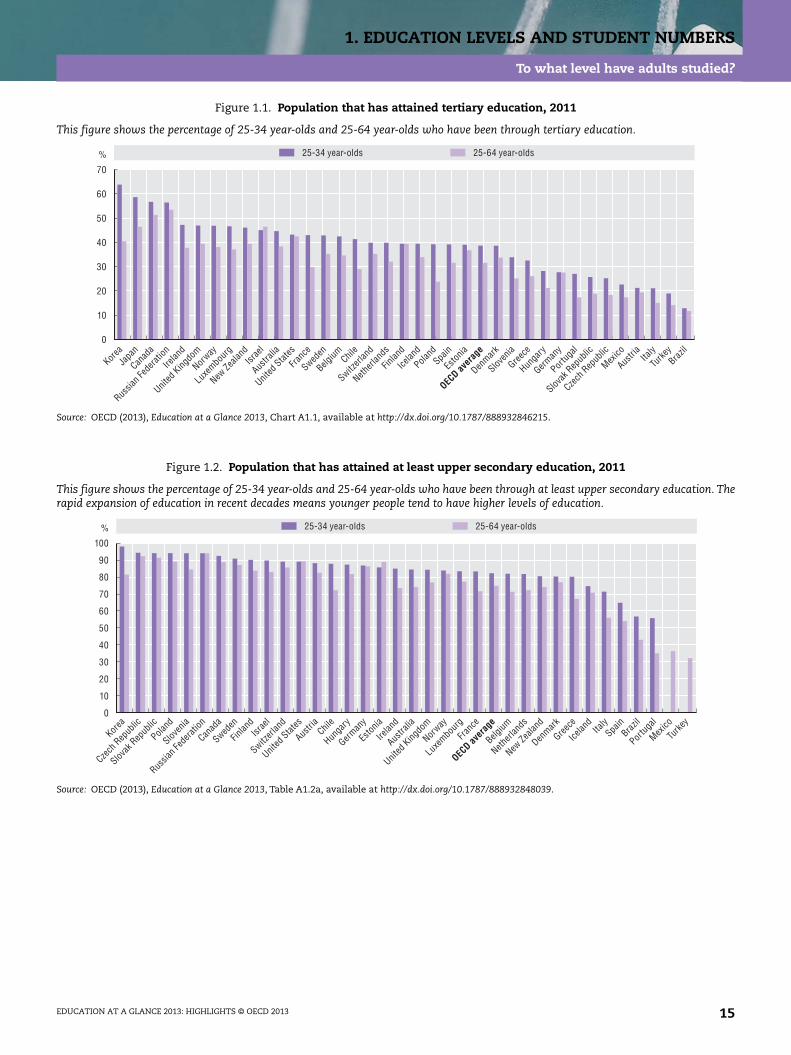
Figure 1.1. Population that has attained tertiary education, 2011
This figure shows the percentage of 25-34 year-olds and 25-64 year-olds who have been through tertiary education.
Source: OECD (2013), Education at a Glance 2013, Chart A1.1, available at http://dx.doi.org/10.1787/888932846215.
Figure 1.2. Population that has attained at least upper secondary education, 2011
This figure shows the percentage of 25-34 year-olds and 25-64 year-olds who have been through at least upper secondary education. Therapid expansion of education in recent decades means younger people tend to have higher levels of education.
Source: OECD (2013), Education at a Glance 2013, Table A1.2a, available at http://dx.doi.org/10.1787/888932848039.
0
10
20
30
40
50
60
70
% 25-34 year-olds 25-64 year-olds
Korea
Japa
n
Canad
a
Russia
n Fed
eratio
n
Irelan
d
United
Kingdo
m
Norway
Luxe
mbourg
New Ze
aland
Israe
l
Austra
lia
United
States
Franc
e
Sweden
Belgium Chil
e
Switzerl
and
Netherl
ands
Finlan
d
Icelan
d
Poland
Spain
Eston
ia
OECD av
erag
e
Denmark
Sloven
ia
Greece
Hunga
ry
German
y
Portug
al
Slovak
Rep
ublic
Czech
Rep
ublic
Mexico
Austri
aIta
ly
Turke
yBraz
il
0
10
20
30
40
50
60
70
80
90
100
% 25-34 year-olds 25-64 year-olds
Korea
Czech
Rep
ublic
Slovak
Rep
ublic
Poland
Sloven
ia
Russia
n Fed
eratio
n
Canad
a
Sweden
Finlan
dIsr
ael
Switzerl
and
United
States
Austri
aChil
e
Hunga
ry
German
y
Eston
ia
Irelan
d
Austra
lia
United
Kingdo
m
Norway
Luxe
mbour
g
Franc
e
OECD av
erag
e
Belgium
Netherl
ands
New Ze
aland
Denmark
Greece
Icelan
dIta
lySpa
inBraz
il
Portug
al
Mexico
Turke
y
EDUCATION AT A GLANCE 2013: HIGHLIGHTS © OECD 2013 15
1. EDUCATION LEVELS AND STUDENT NUMBERS
Who participates in education?
• Access to education for 5-14 year-olds is universal in all OECDand G20 countries with available data.
• Enrolment rates among 15-19 year-olds are above 75% in 31 ofthe 39 OECD and G20 countries with available data.
• Enrolment rates among 20-29 year-olds increased by more than10 percentage points on average between 1995 and 2011across OECD countries.
• More than 20% of 20-29 year-olds in all OECD countries, exceptMexico and the United Kingdom, were enrolled in educationin 2011.
Significance
A well-educated population is essential for economic andsocial development; societies therefore have a real interestin ensuring that children and adults have access to a widerange of educational opportunities. In times of economichardship, the advantage of education for labour-marketprospects becomes even clearer. This section examines theevolution in access to education from 1995 to 2011, focus-ing on the number of young people who continue studyingonce compulsory education has ended.
Findings
Virtually all people in OECD countries have access to atleast 13 years of formal education, and this is increasing – a5-year-old in an OECD country in 2011 could expect to par-ticipate in more than 17 years of education, on average,before reaching the age of 40. The expected duration ofeducation ranged from 14 years in Luxembourg to morethan 19 years in Denmark, Finland, Iceland and Sweden.Women can expect to be enrolled in full-time education for16.7 years while men can expect to be enrolled for 16.3years, on average.
Compulsory education comprises primary and lowersecondary programmes in all OECD countries, and uppersecondary education in most of these countries. Betweenages 5 and 14, enrolment rates are higher than 90%, i.e.there is universal coverage of basic education in all OECDand other G20 countries with available data.
Based on 2011 data, enrolment rates among 15-19 year-oldswere above 75% in most OECD and G20 countries withavailable data and higher than 90% in Belgium, the CzechRepublic, Germany, Hungary, Ireland, the Netherlands,Poland and Slovenia.
In 2011, an average of 28% of 20-29 year-olds in OECD coun-tries were enrolled in some type of education. The highestproportions of this age group enrolled in education (more
than 40%) are found in Denmark, Finland and Greece. Theonly OECD countries with less than 20% are Mexico and theUnited Kingdom. Among other G20 countries, in Indonesiaand Saudi Arabia, less than 15% of adults in this age groupwere enrolled. Among 20-29 year-olds, 29% of women and26% of men participate in education in OECD countries.
Trends
Between 2000 and 2011, enrolment rates for 15-19 year-oldsincreased steadily by around 8 percentage points, from anaverage 76% in 2000 to 84% in 2011, in nearly all OECDcountries. These increases may reveal the general aware-ness of the benefits of participating in education in arestricted labour market. France is the only exception, withan enrolment rate decreasing from 87% to 84% during thisperiod. There has been growth, too, in enrolment for 20-29year-olds. Over the past 16 years, the enrolment rate forthis segment of the population has grown by close to10 percentage points on average across OECD countries. Inthe Czech Republic, Greece, Hungary, Iceland, Korea andSweden, these rates have increased by more than 15 per-centage points, while they have grown by less than five per-centage points in Canada, France, Mexico, Norway andPortugal.
Definitions
Data for the 2010-11 school year are based on the UOE datacollection on education statistics, administered annuallyby the OECD. Except where otherwise noted, figures arebased on head counts and do not distinguish between full-time and part-time study.
Information on data for Israel:http://dx.doi.org/10.1787/888932315602.
Going further
For additional material, notes and a full explanationof sourcing and methodologies, see Education at aGlance 2013 (indicator C1).
Areas covered include:
– Students in primary, secondary and tertiary educa-tion, by type of institution or mode of enrolment.
– Proportion of young adults in education.
– Expected number of years in education.
EDUCATION AT A GLANCE 2013: HIGHLIGHTS © OECD 201316
1. EDUCATION LEVELS AND STUDENT NUMBERS
Who participates in education?
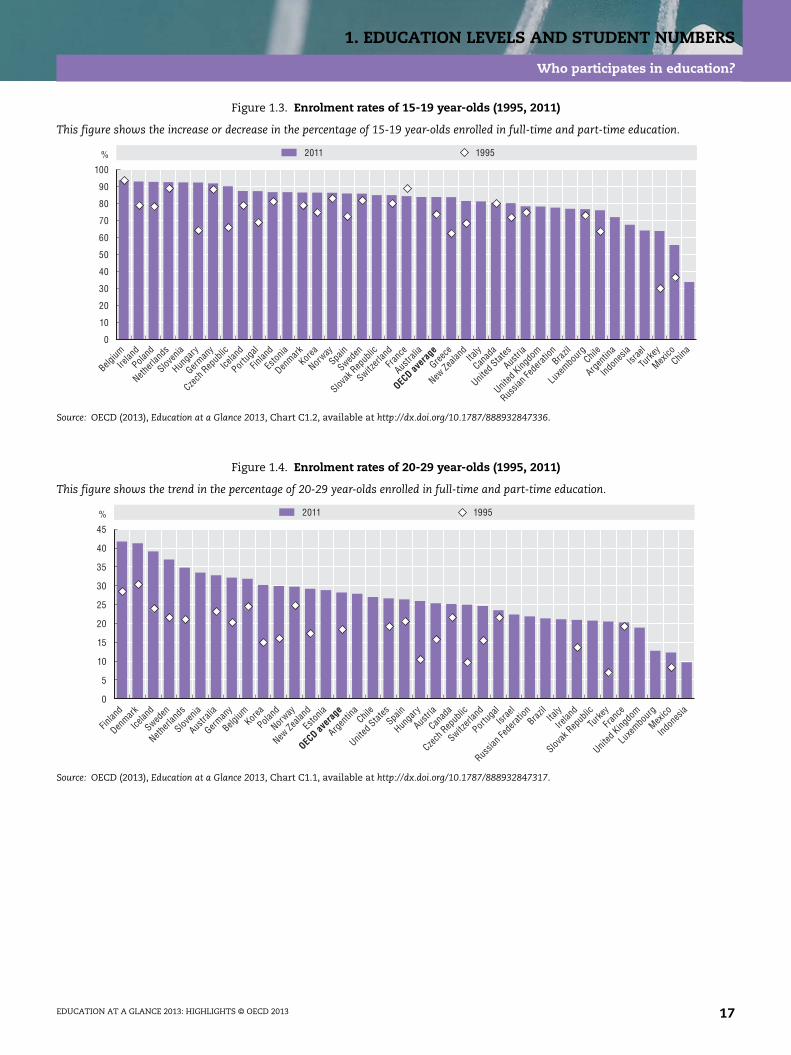
Figure 1.3. Enrolment rates of 15-19 year-olds (1995, 2011)
This figure shows the increase or decrease in the percentage of 15-19 year-olds enrolled in full-time and part-time education.
Source: OECD (2013), Education at a Glance 2013, Chart C1.2, available at http://dx.doi.org/10.1787/888932847336.
Figure 1.4. Enrolment rates of 20-29 year-olds (1995, 2011)
This figure shows the trend in the percentage of 20-29 year-olds enrolled in full-time and part-time education.
Source: OECD (2013), Education at a Glance 2013, Chart C1.1, available at http://dx.doi.org/10.1787/888932847317.
0
10
20
30
40
50
60
70
80
90
100
% 2011 1995
Belgium
Irelan
d
Poland
Netherl
ands
Sloven
ia
Hunga
ry
German
y
Czech
Rep
ublic
Icelan
d
Portug
al
Finlan
d
Eston
ia
Denmark
Korea
Norway
Spain
Sweden
Slovak
Rep
ublic
Switzerl
and
Franc
e
Austra
lia
OECD av
erag
e
Greece
New Ze
aland Ita
ly
Canad
a
United
States
Austri
a
United
Kingdo
m
Russia
n Fed
eratio
nBraz
il
Luxe
mbour
gChil
e
Argen
tina
Indon
esiaIsr
ael
Turke
y
Mexico
China
0
5
10
15
20
25
30
35
40
45
% 2011 1995
Finlan
d
Denmark
Icelan
d
Sweden
Netherl
ands
Sloven
ia
Austra
lia
German
y
BelgiumKor
ea
Poland
Norway
New Ze
aland
Eston
ia
OECD av
erag
e
Argen
tina
Chile
United
States
Spain
Hunga
ry
Austri
a
Canad
a
Czech
Rep
ublic
Switzerl
and
Portug
alIsr
ael
Russia
n Fed
eratio
nBraz
ilIta
ly
Irelan
d
Slovak
Rep
ublic
Turke
y
Franc
e
United
Kingdo
m
Luxe
mbour
g
Mexico
Indon
esia
EDUCATION AT A GLANCE 2013: HIGHLIGHTS © OECD 2013 17
1. EDUCATION LEVELS AND STUDENT NUMBERS
What is the role of early childhood education?
• Fifteen-year-olds who had at least one year of pre-primary edu-cation tend to perform better at school.
• Early childhood education has grown alongside the increase inwomen working in many OECD countries, but improvingaccess without improving the quality of these services will notensure good results.
• Education now begins for most children in OECD countries wellbefore they are 5 years old. In Belgium, France, Iceland, Italy,Norway, Spain and Sweden, more than 90% of 3-year-olds areenrolled in early childhood education.
• More than three-quarters of 4-year-olds (82%) are enrolled inearly childhood education across OECD countries; the figure is86% for OECD countries that are part of the European Union.
Significance
Early childhood education plays a key role in the cognitiveand emotional development of the young. Enrolling pupilsin early childhood education can also mitigate socialinequalities. As a result, ensuring the quality of early child-hood education and care has become a policy priority inmany countries.
As countries continue to expand their early childhood pro-grammes,they need to consider parents’ needs and expec-tations regarding accessibility, cost, programme and staffquality and accountability.
Findings
Results from the OECD’s PISA assessment of students atage 15 show that in most countries pupils who haveattended pre-primary education programmes tend to per-form better than those who have not.
An increase in women working outside the home, and hav-ing children later in life, have gone hand in hand with anincrease in early childhood education. The average age atwhich mothers have their first child has risen across allOECD countries over the past 40 years. In Germany and theUnited Kingdom the average age at first birth is 30 years. Incontrast, Mexico has the lowest average age at just over21 years.
Spending on pre-primary education accounts for an aver-age of 0.6% of gross domestic product (GDP) in OECD coun-tries, although there are significant differences betweencountries. While 0.1% or less of GDP is spent on pre-pri-mary education in Australia and Turkey, 0.8% or more isspent in Denmark, Iceland, Israel, Luxembourg, theRussian Federation and Spain.
Publicly-funded pre-primary education tends to be morestrongly developed in the European countries than else-where in the OECD. Private funding varies widely betweencountries, ranging from 5% or less in Belgium, Estonia,Luxembourg and Sweden, to 25% or more in Argentina,Australia, Austria, Japan, Korea, Spain and the United States.
Public spending on pre-primary education is mainly used tosupport public institutions, but it also funds private institu-tions. On average across OECD countries, the level of publicexpenditure on public pre-primary institutions, at USD 6 275per pupil, is around twice the level of public spending on pri-vate pre-primary institutions (USD 3 494).
The ratio of pupils to teaching staff is also an important indi-cator of the resources devoted to pre-primary education. Thepupil-teacher ratio excluding non-professional staff(e.g. teachers’ aides) ranges from more than 20 pupils perteacher in Chile, China, France, Israel, Mexico and Turkey, tofewer than 10 in Estonia, Iceland, New Zealand, Slovenia andSweden.
Trends
Enrolment in early childhood education programmes rosefrom 64% of 3-year-olds in 2005 to 70% in 2011 on average forOECD countries, and from 78% of 4-year-olds in 2005 to 84% in2011. In Brazil, Mexico and Poland, enrolment rates of 4-year-olds increased by 20 percentage points during this period.
Definitions
Early childhood education, or pre-primary education, isdefined as the initial stage of organised instruction,designed primarily to introduce very young children to aschool-like environment.
Information on data for Israel:http://dx.doi.org/10.1787/888932315602.
Further reading from OECD
PISA Volume II.
Starting Strong II and III: Early Childhood Education and Care,2006, and 2011.
Going further
For additional material, notes and a full explanationof sourcing and methodologies, see Education at aGlance 2013 (Indicator C2).
Areas covered include:
– Enrolment rates in pre-primary programmes
– Public and private spending on pre-primary educa-tion
– Influence of pre-primary education policies on Pro-gramme for International Student Assessment(PISA) results
EDUCATION AT A GLANCE 2013: HIGHLIGHTS © OECD 201318

1. EDUCATION LEVELS AND STUDENT NUMBERS
What is the role of early childhood education?
Figure 1.5. Enrolment rates at age 4 in education (2005, 2011)
This figure compares the 2005 and 2011 enrolment rates of full-time and part-time pupils aged 4 in public and private institutions.
Source: OECD (2013), Education at a glance 2013. Chart C2.1 available at http://dx.doi.org/10.1787/888932847393.
Figure 1.6. Ratio of pupils to teaching staff in early childhood education, 2011
This figure shows the number of pupils per teacher in early childhood education.
Note: The figures should be interpreted with some caution because the indicator compares the teacher/pupil ratios in countries with “education-only”and “integrated education and daycare” programmes. In some countries, the staff requirements in these two types of provision are very different.Source: OECD (2013), Education at a glance 2013. Chart C2.4 available at http://dx.doi.org/10.1787/888932847450.
0
10
20
30
40
50
60
70
80
90
100
% 2011 2005
Spain
Mexico
Netherl
ands
Franc
e
Belgium
Denmark
United
Kingdo
m
Norway
Icelan
dIta
ly
German
y
New Ze
aland
Irelan
d
Luxe
mbourg
Sweden
Israe
l
Hunga
ryJa
pan
Austri
a
Eston
ia
Sloven
ia
Portug
al
Czech
Rep
ublic
OECD av
erag
eKor
ea
United
States
Chile
Russia
n Fed
eratio
n
Argen
tina
Slovak
Rep
ublic
Austra
lia
Poland
Finlan
dBraz
il
Canad
a
Switzerl
and
Turke
y
02
10864
1214161820222426
Mexico
Israe
lChin
a
Turke
yChil
e
Franc
e
Indon
esia
United
Kingdo
mBraz
ilKor
ea
Belgium
Poland
Portug
al
Japa
n
Netherl
ands
OECD av
erag
e
Austri
a
Czech
Rep
ublic
United
States
Spain
German
y
Slovak
Rep
ublic Ita
ly
Luxe
mbour
g
Hunga
ry
Saudi
Arabia
Finlan
d
Sloven
ia
New Ze
aland
Eston
ia
Sweden
Icelan
d
Pupils per teacher
EDUCATION AT A GLANCE 2013: HIGHLIGHTS © OECD 2013 19
1. EDUCATION LEVELS AND STUDENT NUMBERS
How many young people finish secondary education?
• It is estimated that an average of 83% of today’s young peoplein OECD countries will complete upper secondary educationover their lifetimes, based on current patterns of graduation.For G20 countries, the level is 79%.
• Young women are now more likely than young men to graduatefrom upper secondary programmes in almost all OECD coun-tries, a reversal of the historical pattern.
• Around 10% of upper secondary graduates in Denmark, Finland,the Netherlands and Norway are 25 or older while in Iceland theproportion is almost 20% and in Portugal it is almost 30%.
Significance
This section shows how many students are expected tofinish secondary education. Upper secondary educationaims to equip students with the basic skills and knowledgenecessary to enter the labour market or tertiary educationand to become engaged citizens. Graduating from uppersecondary education has become increasingly important inall countries, as the skills needed in the labour market arebecoming more knowledge-based and as workers are pro-gressively required to adapt to the uncertainties of arapidly changing global economy. Young people in OECDcountries who do not finish secondary education facesevere difficulties when it comes to finding work. Policymakers are examining ways to reduce the number of earlyschool-leavers, defined as those students who do not com-plete their upper secondary education. Internationallycomparable measures of how many students successfullycomplete upper secondary programmes – which also showhow many students are not completing these programmes– can assist efforts to that end.
Findings
First-time upper secondary graduation rates equal or exceed75% in 23 of 29 countries with available data. In Denmark,Finland, Germany, Japan, Korea, the Netherlands, Norway,Slovenia and the United Kingdom, graduation rates equal orexceed 90%. Graduation rates for women now average 86%compared with 79% for men.
On average across OECD countries, students graduate for thefirst time at upper secondary level at the age of 20. However,this age varies between countries: from 17 years-old inIsrael, Turkey and the United States to 22 or older in Finland,Iceland, Norway and Portugal.
Traditionally, more men have graduated from pre-vocationaland vocational programmes than women and this is stilltrue today. On average, graduation rates from these pro-
grammes are higher for men than for women by 4 percent-age points with a graduation rate of 49% for men comparedwith 45% for women. Yet, more young women are gradu-ating from vocational programmes than ever before. InAustralia, Belgium, Brazil, Chile, China, Finland, Iceland,Ireland, the Netherlands, Portugal and Spain, graduationrates for women are now higher than those for men.
Gender differences are also apparent in young people’schoice of field of study when pursuing vocational educa-tion. Engineering, manufacturing and construction are byfar the most popular fields of study for boys, as 49% of boysin vocational programmes at the upper secondary levelchoose these topics; this figure reaches 70% in the CzechRepublic, Estonia, Hungary and Norway. Girls on the otherhand tend to be more dispersed among social sciences,business and law (26% all together), health and welfare(17%) and services (17%)
Trends
Since 1995, upper secondary graduation rates haveincreased by an average of eight percentage points amongOECD countries with comparable data. The greatestincrease occurred in Mexico, which showed an annualgrowth rate of 4% between 2000 and 2011.
Definitions
Data refer to the 2010-11 academic year and are based onthe UOE data collection on education statistics adminis-tered by the OECD in 2012.
Data on trends in graduation rates at upper secondary levelfor the years 1995 and 2000 through 2004 are based on aspecial survey carried out in January 2007.
Information on data for Israel:http://dx.doi.org/10.1787/888932315602.
Going further
For additional material, notes and a full explanationof sourcing and methodologies, see Education at aGlance 2013 (indicator A2).
Areas covered include:
– Current upper secondary graduation rates andtrends.
EDUCATION AT A GLANCE 2013: HIGHLIGHTS © OECD 201320
1. EDUCATION LEVELS AND STUDENT NUMBERS
How many young people finish secondary education?
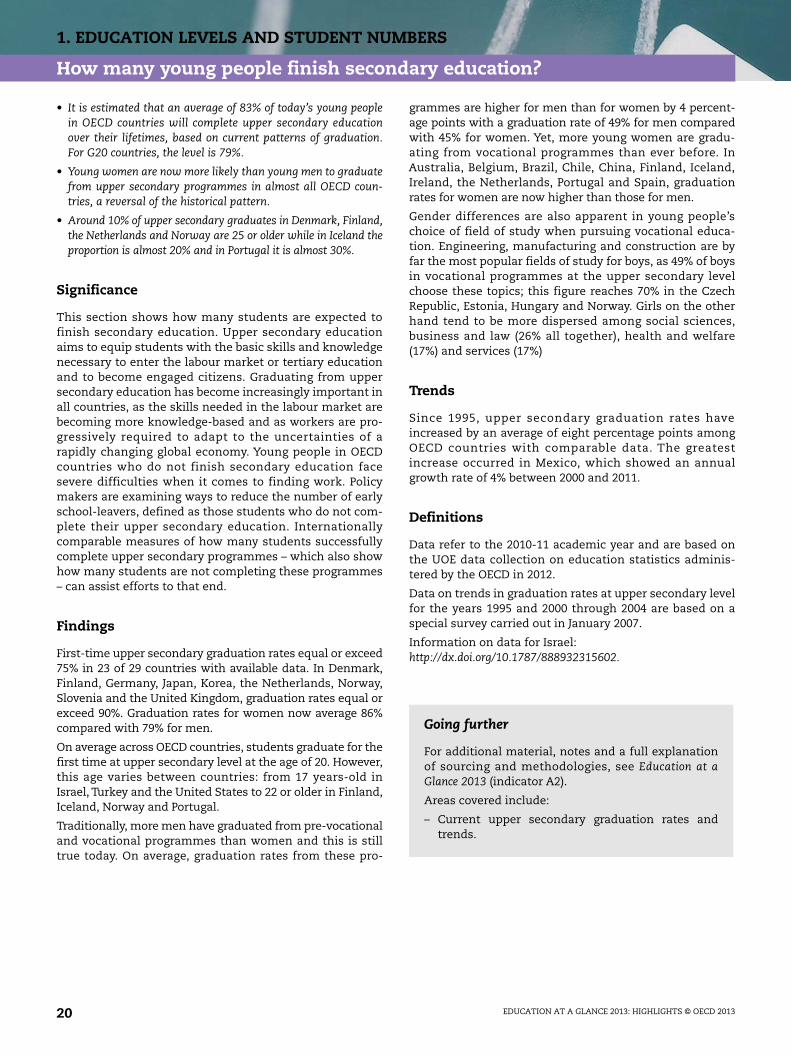
Figure 1.7. Upper secondary graduation rates, 2011
This figure shows the percentage of students who enter an upper secondary programme for the first time and who graduate from it inthe amount of time normally allocated for completing the programme.
Source: OECD (2013), Education at a Glance 2013, Table A2.1a, available at http://dx.doi.org/10.1787/888932848210.
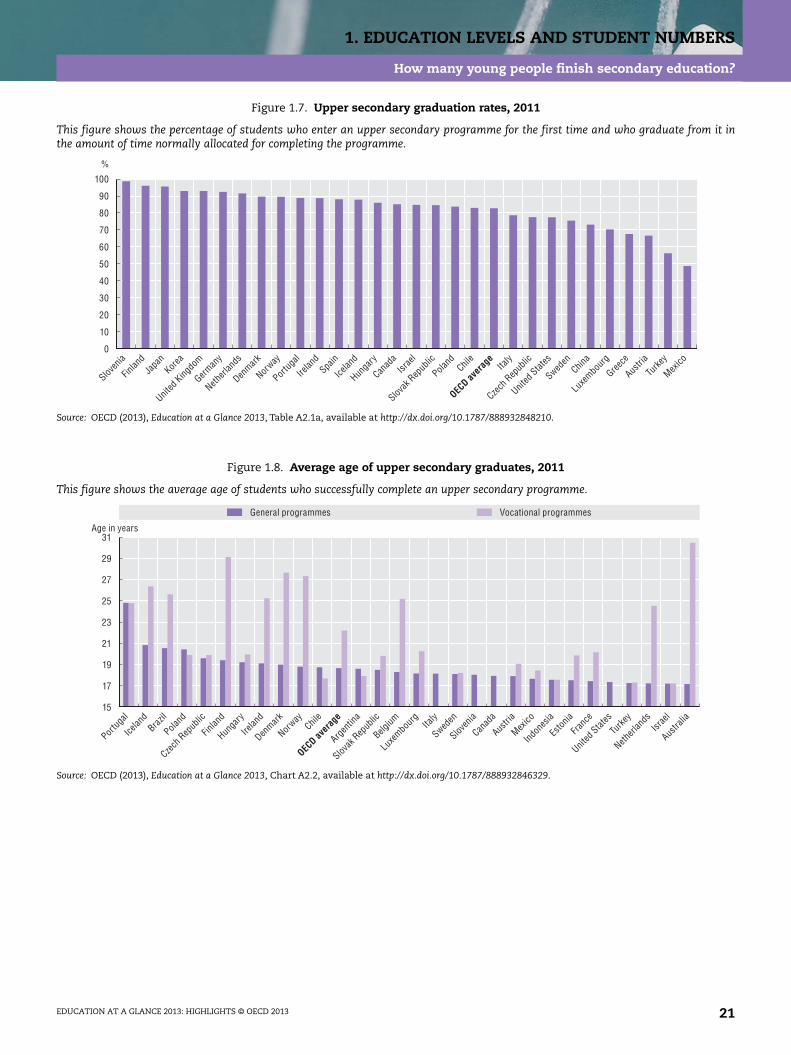
Figure 1.8. Average age of upper secondary graduates, 2011
This figure shows the average age of students who successfully complete an upper secondary programme.
Source: OECD (2013), Education at a Glance 2013, Chart A2.2, available at http://dx.doi.org/10.1787/888932846329.
0
10
20
30
40
50
60
70
80
90
100
%
Sloven
ia
Finlan
dJa
pan
Korea
United
Kingdo
m
German
y
Netherl
ands
Denmark
Norway
Portug
al
Irelan
dSpa
in
Icelan
d
Hunga
ry
Canad
aIsr
ael
Slovak
Rep
ublic
Poland
Chile
OECD av
erag
eIta
ly
Czech
Rep
ublic
United
States
Sweden
China
Luxe
mbour
g
Greece
Austri
a
Turke
y
Mexico
15
17
19
21
23
25
27
29
31
General programmes Vocational programmes
Portug
al
Icelan
dBraz
il
Poland
Czech
Rep
ublic
Finlan
d
Hunga
ry
Irelan
d
Denmark
Norway
Chile
OECD av
erag
e
Argen
tina
Slovak
Rep
ublic
Belgium
Luxe
mbour
gIta
ly
Sweden
Sloven
ia
Canad
a
Austri
a
Mexico
Indon
esia
Eston
ia
Franc
e
United
States
Turke
y
Netherl
ands
Israe
l
Austra
lia
Age in years
EDUCATION AT A GLANCE 2013: HIGHLIGHTS © OECD 2013 21

EDUCATION AT A GLANCE 2013: HIGHLIG
2. HIGHER EDUCATION AND WORK
How many young people enter tertiary education?
How many young people graduate from tertiary education?
How many students fail to graduate?
How successful are students in moving from education to work?
How many students study abroad and where do they go?
HTS © OECD 2013 23
2. HIGHER EDUCATION AND WORK
How many young people enter tertiary education?
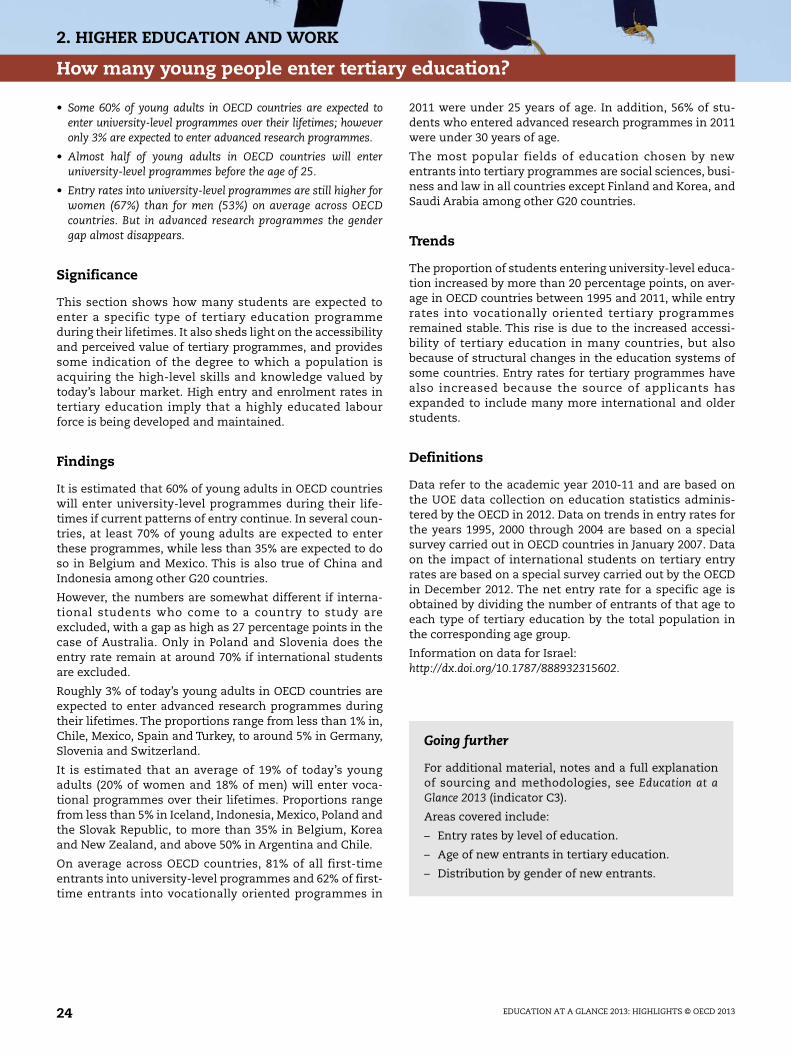
• Some 60% of young adults in OECD countries are expected toenter university-level programmes over their lifetimes; howeveronly 3% are expected to enter advanced research programmes.
• Almost half of young adults in OECD countries will enteruniversity-level programmes before the age of 25.
• Entry rates into university-level programmes are still higher forwomen (67%) than for men (53%) on average across OECDcountries. But in advanced research programmes the gendergap almost disappears.
Significance
This section shows how many students are expected toenter a specific type of tertiary education programmeduring their lifetimes. It also sheds light on the accessibilityand perceived value of tertiary programmes, and providessome indication of the degree to which a population isacquiring the high-level skills and knowledge valued bytoday’s labour market. High entry and enrolment rates intertiary education imply that a highly educated labourforce is being developed and maintained.
Findings
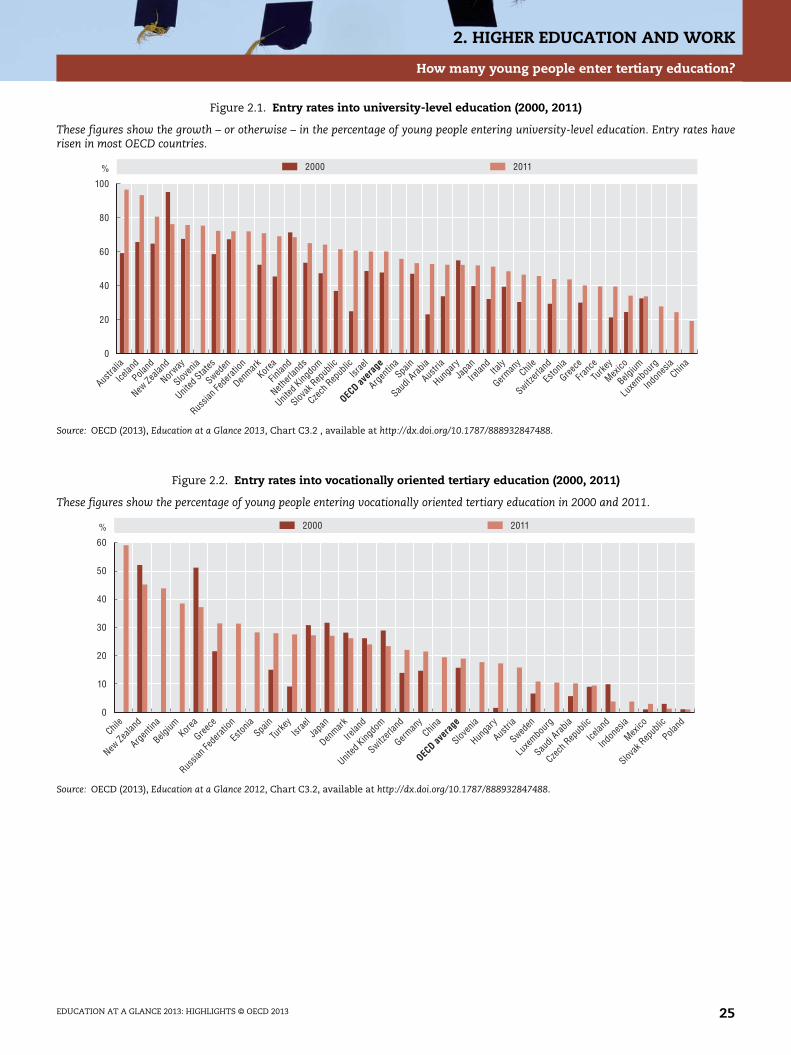
It is estimated that 60% of young adults in OECD countrieswill enter university-level programmes during their life-times if current patterns of entry continue. In several coun-tries, at least 70% of young adults are expected to enterthese programmes, while less than 35% are expected to doso in Belgium and Mexico. This is also true of China andIndonesia among other G20 countries.
However, the numbers are somewhat different if interna-tional students who come to a country to study areexcluded, with a gap as high as 27 percentage points in thecase of Australia. Only in Poland and Slovenia does theentry rate remain at around 70% if international studentsare excluded.
Roughly 3% of today’s young adults in OECD countries areexpected to enter advanced research programmes duringtheir lifetimes. The proportions range from less than 1% in,Chile, Mexico, Spain and Turkey, to around 5% in Germany,Slovenia and Switzerland.
It is estimated that an average of 19% of today’s youngadults (20% of women and 18% of men) will enter voca-tional programmes over their lifetimes. Proportions rangefrom less than 5% in Iceland, Indonesia, Mexico, Poland andthe Slovak Republic, to more than 35% in Belgium, Koreaand New Zealand, and above 50% in Argentina and Chile.
On average across OECD countries, 81% of all first-timeentrants into university-level programmes and 62% of first-time entrants into vocationally oriented programmes in
2011 were under 25 years of age. In addition, 56% of stu-dents who entered advanced research programmes in 2011were under 30 years of age.
The most popular fields of education chosen by newentrants into tertiary programmes are social sciences, busi-ness and law in all countries except Finland and Korea, andSaudi Arabia among other G20 countries.
Trends
The proportion of students entering university-level educa-tion increased by more than 20 percentage points, on aver-age in OECD countries between 1995 and 2011, while entryrates into vocationally oriented tertiary programmesremained stable. This rise is due to the increased accessi-bility of tertiary education in many countries, but alsobecause of structural changes in the education systems ofsome countries. Entry rates for tertiary programmes havealso increased because the source of applicants hasexpanded to include many more international and olderstudents.
Definitions
Data refer to the academic year 2010-11 and are based onthe UOE data collection on education statistics adminis-tered by the OECD in 2012. Data on trends in entry rates forthe years 1995, 2000 through 2004 are based on a specialsurvey carried out in OECD countries in January 2007. Dataon the impact of international students on tertiary entryrates are based on a special survey carried out by the OECDin December 2012. The net entry rate for a specific age isobtained by dividing the number of entrants of that age toeach type of tertiary education by the total population inthe corresponding age group.
Information on data for Israel:http://dx.doi.org/10.1787/888932315602.
Going further
For additional material, notes and a full explanationof sourcing and methodologies, see Education at aGlance 2013 (indicator C3).
Areas covered include:
– Entry rates by level of education.
– Age of new entrants in tertiary education.
– Distribution by gender of new entrants.
EDUCATION AT A GLANCE 2013: HIGHLIGHTS © OECD 201324
2. HIGHER EDUCATION AND WORK
How many young people enter tertiary education?
Figure 2.1. Entry rates into university-level education (2000, 2011)
These figures show the growth – or otherwise – in the percentage of young people entering university-level education. Entry rates haverisen in most OECD countries.
Source: OECD (2013), Education at a Glance 2013, Chart C3.2 , available at http://dx.doi.org/10.1787/888932847488.
Figure 2.2. Entry rates into vocationally oriented tertiary education (2000, 2011)
These figures show the percentage of young people entering vocationally oriented tertiary education in 2000 and 2011.
Source: OECD (2013), Education at a Glance 2012, Chart C3.2, available at http://dx.doi.org/10.1787/888932847488.
0
20
40
60
80
100
% 2000 2011
Austra
lia
Icelan
d
Poland
New Ze
aland
Norway
Sloven
ia
United
States
Sweden
Russia
n Fed
eratio
n
Denmark
Korea
Finlan
d
Netherl
ands
United
Kingdo
m
Slovak
Rep
ublic
Czech
Rep
ublic
Israe
l
OECD av
erag
e
Argen
tinaSpa
in
Saudi
Arabia
Austri
a
Hunga
ryJa
pan
Irelan
dIta
ly
German
yChil
e
Switzerl
and
Eston
ia
Greece
Franc
e
Turke
y
Mexico
Belgium
Luxe
mbour
g
Indon
esia
China
0
20
10
30
40
50
60
% 2000 2011
Chile
New Ze
aland
Argen
tina
Belgium Kor
ea
Greece
Russia
n Fed
eratio
n
Eston
iaSpa
in
Turke
yIsr
ael
Japa
n
Denmark
Irelan
d
United
Kingdo
m
Switzerl
and
German
yChin
a
OECD av
erag
e
Sloven
ia
Hunga
ry
Austri
a
Sweden
Luxe
mbour
g
Saudi
Arabia
Czech
Rep
ublic
Icelan
d
Indon
esia
Mexico
Slovak
Rep
ublic
Poland
EDUCATION AT A GLANCE 2013: HIGHLIGHTS © OECD 2013 25

2. HIGHER EDUCATION AND WORK
How many young people graduate from tertiary education?
• Some 40% of today’s young adults in OECD countries areexpected to complete university-level education over their life-times, based on current patterns of graduation.
• About 11% of today’s young adults in OECD countries areexpected to complete vocationally oriented education over theirlifetimes.
• A student in an OECD country obtains his/her first university-level degree at the age of 27 on average, with ages ranging from24 in the United Kingdom to 29 or more in Finland, Iceland,Israel and Sweden.
Significance
Tertiary education rates indicate a country’s capacity toequip future workers with advanced and specialisedknowledge and skills. People have strong incentives toobtain a tertiary education in OECD countries, includinghigher salaries and better employment prospects. Tertiaryeducation varies widely in structure and scope betweencountries, and graduation rates are influenced both by theease of access to these programmes, flexibility in complet-ing them and the demand for higher skills in the labourmarket. Expanding access to and improving the quality oftertiary education are vital to knowledge-based economies,but these objectives are even more difficult to achievewhen budgets are tight.
Findings
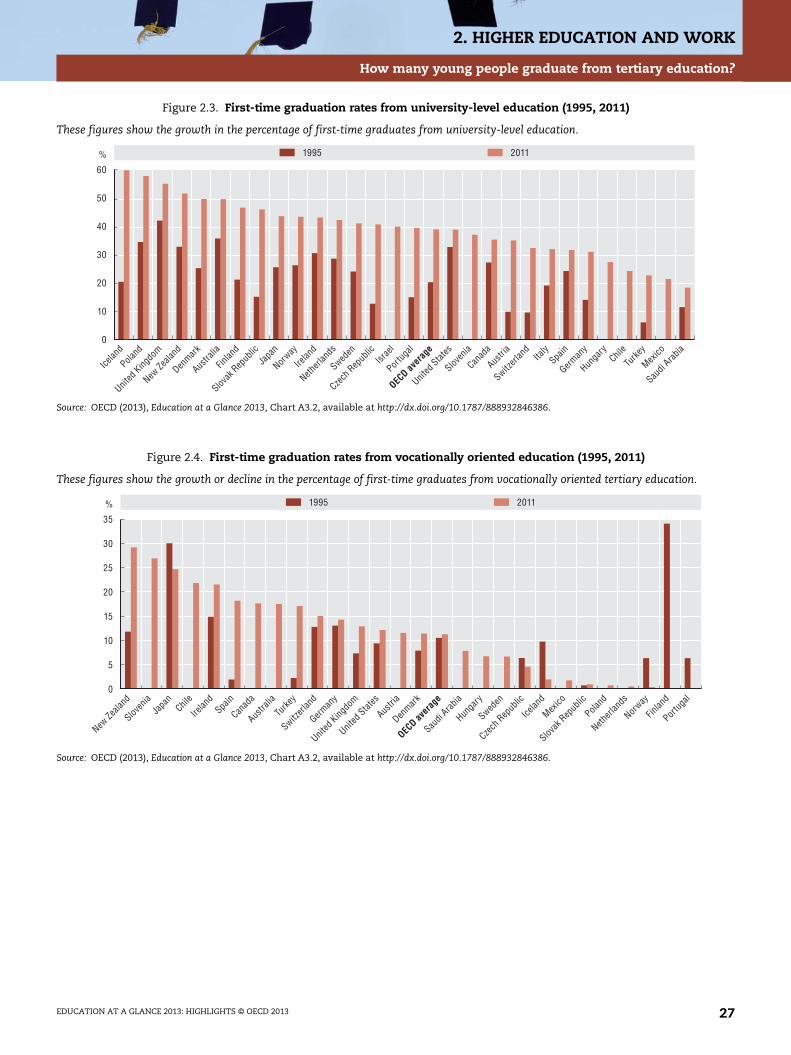
Some 40% of young people, on average across the 28 OECDcountries with comparable data, will graduate from univer-sity-level programmes during their lifetimes, based on 2011patterns of graduation. The proportion ranges from lessthan 25% in Chile, Mexico and Turkey, to 50% or more inAustralia, Denmark, Iceland, New Zealand, Poland and theUnited Kingdom.
Most graduates at all levels of tertiary education are women,except at the doctoral level. An estimated 48% of today’syoung women and 32% of today’s young men on average inOECD countries will complete university-level educationover their lifetimes, based on current patterns of graduation.
Some 1.6% of young people today are expected to com-plete advanced research programmes on average acrossOECD countries, up from 1.0% in 2000. Countries withthe highest increase in advanced research graduation ratesare Denmark, Ireland, New Zealand, the Slovak Republicand the United Kingdom, where graduation rates increasedby at least 1 percentage point from 2000 to 2011. China hada graduation rate of 2.2% in 2011 – above the OECD average.
International students represent a significant share of ter-tiary graduates in a number of countries. In Australia,Austria, New Zealand, Switzerland and the United Kingdom,at least 10% of students graduating with a first degree in ter-tiary education are international students.
Trends
University-level graduation rates have risen by 20 percentagepoints on average across OECD countries with available dataover the past 16 years, while rates for vocationally orientedtertiary programmes have remained stable. Doctoratesrepresent only a small proportion of tertiary programmesbut the graduation rate has doubled over the past 16 years.
Definitions
Data are for the 2010-11 academic year and are based onthe UOE data collection on education statistics adminis-tered by the OECD in 2012. Data on the impact of interna-tional students on tertiary graduation rates are based on aspecial survey conducted by the OECD in December 2012.
Tertiary graduates are those who obtain a universitydegree, vocational qualifications, or advanced researchdegrees of doctorate standard. Net graduation rates repre-sent the estimated percentage of an age group that willcomplete tertiary education over their lifetimes, based oncurrent patterns of graduation.
Information on data for Israel:http://dx.doi.org/10.1787/888932315602.
Further reading from OECD
Higher Education Management and Policy (journal)
OECD Reviews of Tertiary Education (series of national reviews)
Going further
For additional material, notes and a full explanationof sourcing and methodologies, see Education at aGlance 2013 (indicator A3).
Areas covered include:
– Graduation rates by qualification level and by gender.
EDUCATION AT A GLANCE 2013: HIGHLIGHTS © OECD 201326
2. HIGHER EDUCATION AND WORK
How many young people graduate from tertiary education?
Figure 2.3. First-time graduation rates from university-level education (1995, 2011)
These figures show the growth in the percentage of first-time graduates from university-level education.
Source: OECD (2013), Education at a Glance 2013, Chart A3.2, available at http://dx.doi.org/10.1787/888932846386.
Figure 2.4. First-time graduation rates from vocationally oriented education (1995, 2011)
These figures show the growth or decline in the percentage of first-time graduates from vocationally oriented tertiary education.
Source: OECD (2013), Education at a Glance 2013, Chart A3.2, available at http://dx.doi.org/10.1787/888932846386.
0
20
10
30
40
50
60
% 1995 2011
Icelan
d
Poland
United
Kingdo
m
New Ze
aland
Denmark
Austra
lia
Finlan
d
Slovak
Rep
ublic
Japa
n
Norway
Irelan
d
Netherl
ands
Sweden
Czech
Rep
ublic
Israe
l
Portug
al
OECD av
erag
e
United
States
Sloven
ia
Canad
a
Austri
a
Switzerl
and
Italy
Spain
German
y
Hunga
ryChil
e
Turke
y
Mexico
Saudi
Arabia
0
15
10
5
20
25
30
35
1995 2011%
New Ze
aland
Sloven
iaJa
pan
Chile
Irelan
dSpa
in
Canad
a
Austra
lia
Turke
y
Switzerl
and
German
y
United
Kingdo
m
United
States
Austri
a
Denmark
OECD av
erag
e
Saudi
Arabia
Hunga
ry
Sweden
Czech
Rep
ublic
Icelan
d
Mexico
Slovak
Rep
ublic
Poland
Netherl
ands
Norway
Finlan
d
Portug
al
EDUCATION AT A GLANCE 2013: HIGHLIGHTS © OECD 2013 27
2. HIGHER EDUCATION AND WORK
How many students fail to graduate?
• About 70% of students who enter a tertiary programme gradu-ate with a first degree at this level on average across OECDcountries with available data.
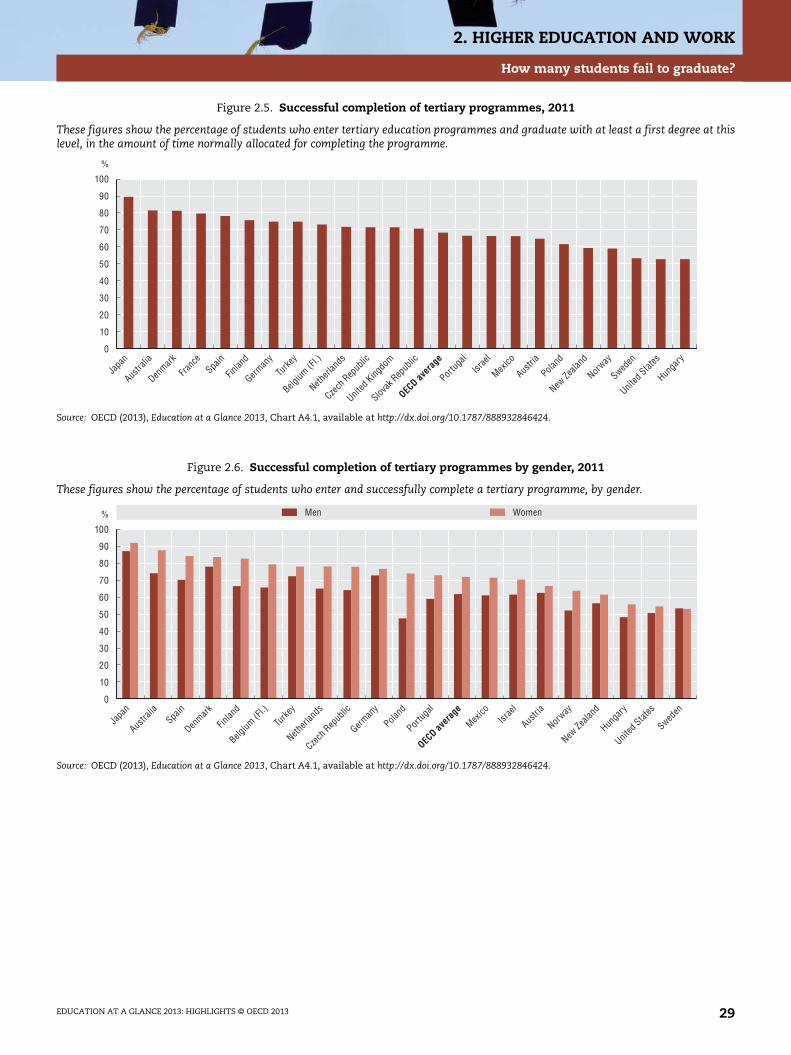
• Women enrolled in university-level programmes are more likelythan men to earn a tertiary degree at the end of the programme:their completion rate is on average 10 percentage points higherthan men’s.
• Full-time students have a better chance of graduating thanpart-time students, but there is no clear relationship betweenthe level of tuition fees and the number of students who com-plete their degree.
Significance
Tertiary completion rates can indicate the efficiency of ter-tiary education systems, as they show how many of the stu-dents who enter a tertiary programme ultimately graduatefrom it. However, low completion rates do not necessarilyimply inefficiency, as students may leave a tertiary pro-gramme for a variety of reasons: they may realise that theyhave chosen a subject or programme that is not a good fit forthem; they may fail to meet the standards set by their edu-cational institution; or they may find attractive employmentopportunities before completing the programme. Low com-pletion rates (i.e. high drop-out rates) may indicate, on theother hand, that the education system is not meeting stu-dents’ needs.
Findings
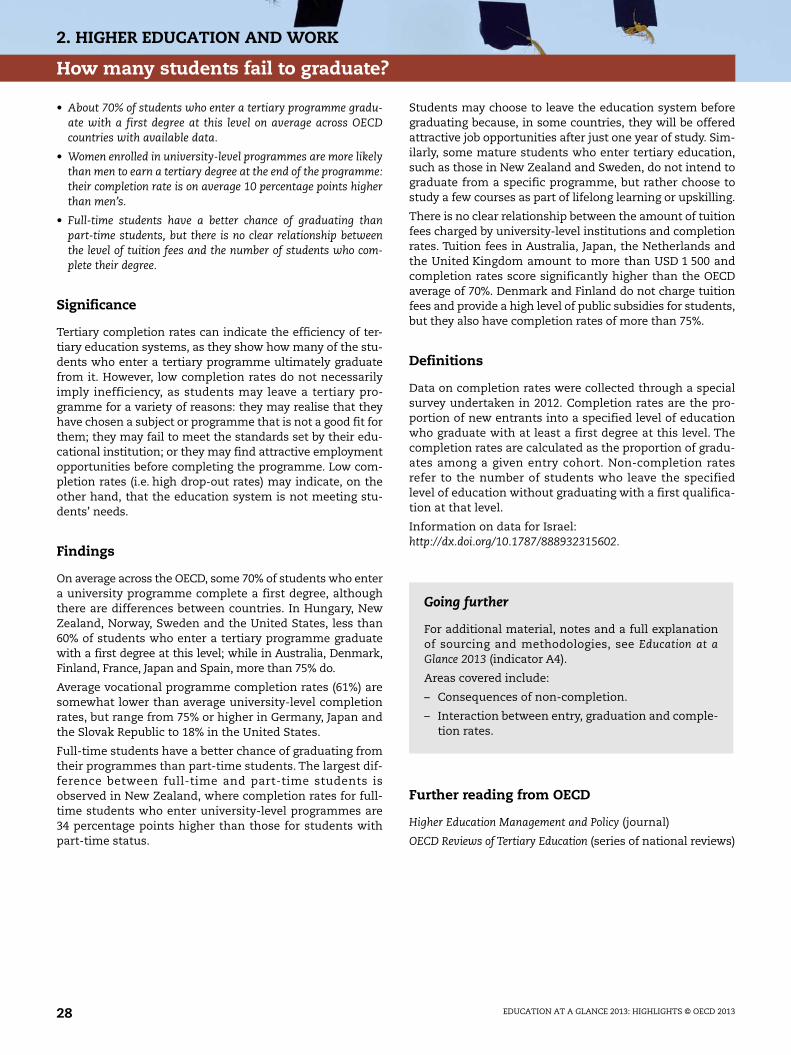
On average across the OECD, some 70% of students who entera university programme complete a first degree, althoughthere are differences between countries. In Hungary, NewZealand, Norway, Sweden and the United States, less than60% of students who enter a tertiary programme graduatewith a first degree at this level; while in Australia, Denmark,Finland, France, Japan and Spain, more than 75% do.
Average vocational programme completion rates (61%) aresomewhat lower than average university-level completionrates, but range from 75% or higher in Germany, Japan andthe Slovak Republic to 18% in the United States.
Full-time students have a better chance of graduating fromtheir programmes than part-time students. The largest dif-ference between full-time and part-time students isobserved in New Zealand, where completion rates for full-time students who enter university-level programmes are34 percentage points higher than those for students withpart-time status.
Students may choose to leave the education system beforegraduating because, in some countries, they will be offeredattractive job opportunities after just one year of study. Sim-ilarly, some mature students who enter tertiary education,such as those in New Zealand and Sweden, do not intend tograduate from a specific programme, but rather choose tostudy a few courses as part of lifelong learning or upskilling.
There is no clear relationship between the amount of tuitionfees charged by university-level institutions and completionrates. Tuition fees in Australia, Japan, the Netherlands andthe United Kingdom amount to more than USD 1 500 andcompletion rates score significantly higher than the OECDaverage of 70%. Denmark and Finland do not charge tuitionfees and provide a high level of public subsidies for students,but they also have completion rates of more than 75%.
Definitions
Data on completion rates were collected through a specialsurvey undertaken in 2012. Completion rates are the pro-portion of new entrants into a specified level of educationwho graduate with at least a first degree at this level. Thecompletion rates are calculated as the proportion of gradu-ates among a given entry cohort. Non-completion ratesrefer to the number of students who leave the specifiedlevel of education without graduating with a first qualifica-tion at that level.
Information on data for Israel:http://dx.doi.org/10.1787/888932315602.
Further reading from OECD
Higher Education Management and Policy (journal)
OECD Reviews of Tertiary Education (series of national reviews)
Going further
For additional material, notes and a full explanationof sourcing and methodologies, see Education at aGlance 2013 (indicator A4).
Areas covered include:
– Consequences of non-completion.
– Interaction between entry, graduation and comple-tion rates.
EDUCATION AT A GLANCE 2013: HIGHLIGHTS © OECD 201328
2. HIGHER EDUCATION AND WORK
How many students fail to graduate?
Figure 2.5. Successful completion of tertiary programmes, 2011
These figures show the percentage of students who enter tertiary education programmes and graduate with at least a first degree at thislevel, in the amount of time normally allocated for completing the programme.
Source: OECD (2013), Education at a Glance 2013, Chart A4.1, available at http://dx.doi.org/10.1787/888932846424.
Figure 2.6. Successful completion of tertiary programmes by gender, 2011
These figures show the percentage of students who enter and successfully complete a tertiary programme, by gender.
Source: OECD (2013), Education at a Glance 2013, Chart A4.1, available at http://dx.doi.org/10.1787/888932846424.
0
10
20
30
40
50
60
70
80
90
100
%
Japa
n
Austra
lia
Denmark
Franc
eSpa
in
Finlan
d
German
y
Turke
y
Belgium
(Fl.)
Netherl
ands
Czech
Rep
ublic
United
Kingdo
m
Slovak
Rep
ublic
OECD av
erag
e
Portug
alIsr
ael
Mexico
Austri
a
Poland
New Ze
aland
Norway
Sweden
United
States
Hunga
ry
0
20
10
30
40
50
60
70
80
90
100
%
Japa
n
Austra
liaSpa
in
Denmark
Finlan
d
Belgium
(Fl.)
Turke
y
Netherl
ands
Czech
Rep
ublic
German
y
Poland
Portug
al
OECD av
erag
e
Mexico
Israe
l
Austri
a
Norway
New Ze
aland
Hunga
ry
United
States
Sweden
Men Women
EDUCATION AT A GLANCE 2013: HIGHLIGHTS © OECD 2013 29
2. HIGHER EDUCATION AND WORK
How successful are students in moving from education to work?
• On average across OECD countries, 16% of people aged 15-29are not employed or in education and training (NEET); womenare more likely to be NEET than men.
• The proportion of 15-29 year-olds no longer in education whohad a job shrank from 41% in 2008 to 37% in 2011, on averageacross OECD countries.
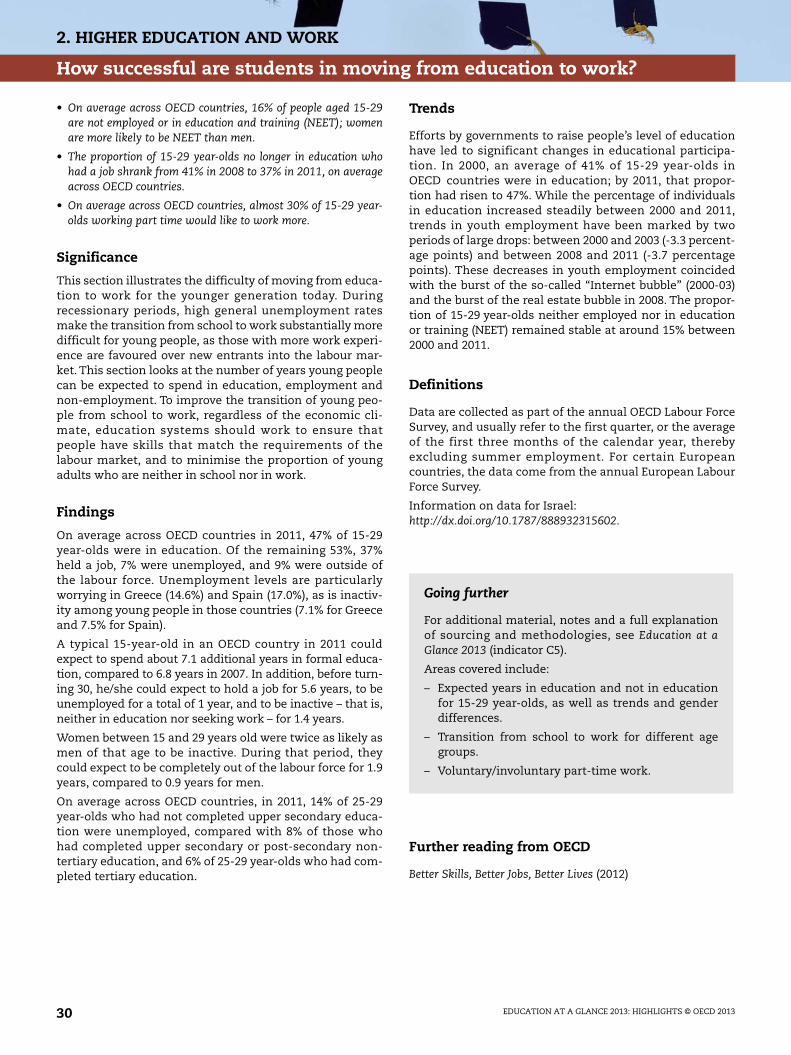
• On average across OECD countries, almost 30% of 15-29 year-olds working part time would like to work more.
Significance
This section illustrates the difficulty of moving from educa-tion to work for the younger generation today. Duringrecessionary periods, high general unemployment ratesmake the transition from school to work substantially moredifficult for young people, as those with more work experi-ence are favoured over new entrants into the labour mar-ket. This section looks at the number of years young peoplecan be expected to spend in education, employment andnon-employment. To improve the transition of young peo-ple from school to work, regardless of the economic cli-mate, education systems should work to ensure thatpeople have skills that match the requirements of thelabour market, and to minimise the proportion of youngadults who are neither in school nor in work.
Findings
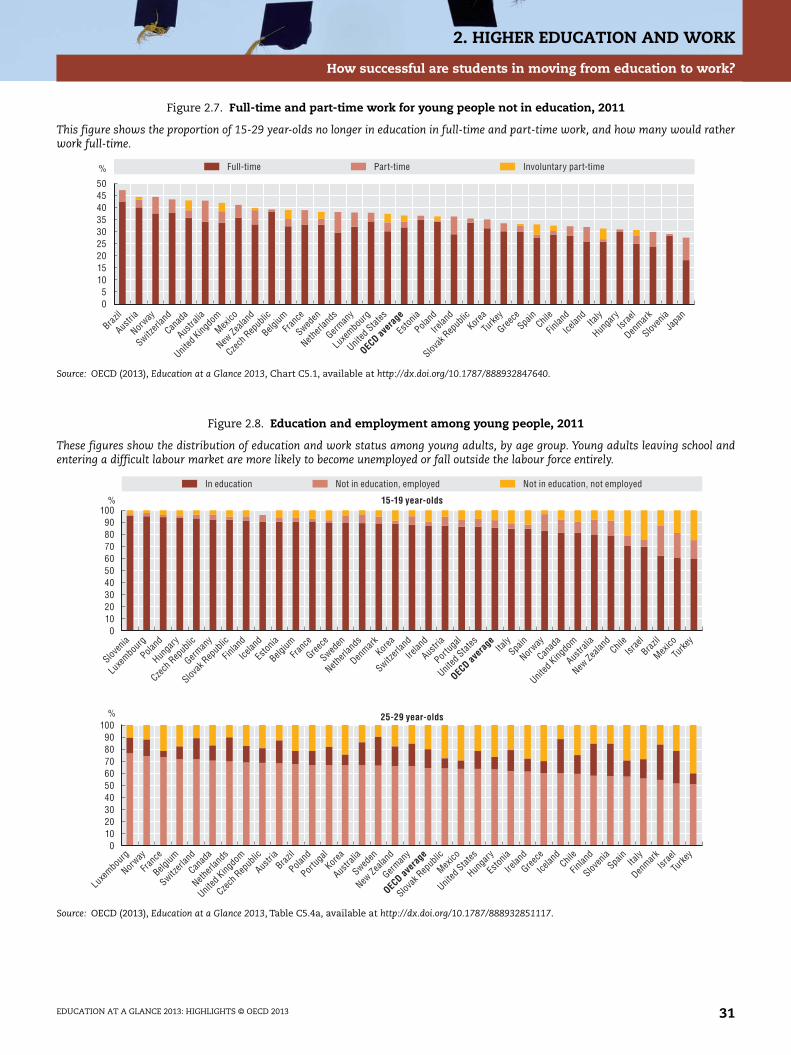
On average across OECD countries in 2011, 47% of 15-29year-olds were in education. Of the remaining 53%, 37%held a job, 7% were unemployed, and 9% were outside ofthe labour force. Unemployment levels are particularlyworrying in Greece (14.6%) and Spain (17.0%), as is inactiv-ity among young people in those countries (7.1% for Greeceand 7.5% for Spain).
A typical 15-year-old in an OECD country in 2011 couldexpect to spend about 7.1 additional years in formal educa-tion, compared to 6.8 years in 2007. In addition, before turn-ing 30, he/she could expect to hold a job for 5.6 years, to beunemployed for a total of 1 year, and to be inactive – that is,neither in education nor seeking work – for 1.4 years.
Women between 15 and 29 years old were twice as likely asmen of that age to be inactive. During that period, theycould expect to be completely out of the labour force for 1.9years, compared to 0.9 years for men.
On average across OECD countries, in 2011, 14% of 25-29year-olds who had not completed upper secondary educa-tion were unemployed, compared with 8% of those whohad completed upper secondary or post-secondary non-tertiary education, and 6% of 25-29 year-olds who had com-pleted tertiary education.
Trends
Efforts by governments to raise people’s level of educationhave led to significant changes in educational participa-tion. In 2000, an average of 41% of 15-29 year-olds inOECD countries were in education; by 2011, that propor-tion had risen to 47%. While the percentage of individualsin education increased steadily between 2000 and 2011,trends in youth employment have been marked by twoperiods of large drops: between 2000 and 2003 (-3.3 percent-age points) and between 2008 and 2011 (-3.7 percentagepoints). These decreases in youth employment coincidedwith the burst of the so-called “Internet bubble” (2000-03)and the burst of the real estate bubble in 2008. The propor-tion of 15-29 year-olds neither employed nor in educationor training (NEET) remained stable at around 15% between2000 and 2011.
Definitions
Data are collected as part of the annual OECD Labour ForceSurvey, and usually refer to the first quarter, or the averageof the first three months of the calendar year, therebyexcluding summer employment. For certain Europeancountries, the data come from the annual European LabourForce Survey.
Information on data for Israel:http://dx.doi.org/10.1787/888932315602.
Further reading from OECD
Better Skills, Better Jobs, Better Lives (2012)
Going further
For additional material, notes and a full explanationof sourcing and methodologies, see Education at aGlance 2013 (indicator C5).
Areas covered include:
– Expected years in education and not in educationfor 15-29 year-olds, as well as trends and genderdifferences.
– Transition from school to work for different agegroups.
– Voluntary/involuntary part-time work.
EDUCATION AT A GLANCE 2013: HIGHLIGHTS © OECD 201330
2. HIGHER EDUCATION AND WORK
How successful are students in moving from education to work?
Figure 2.7. Full-time and part-time work for young people not in education, 2011
This figure shows the proportion of 15-29 year-olds no longer in education in full-time and part-time work, and how many would ratherwork full-time.
Source: OECD (2013), Education at a Glance 2013, Chart C5.1, available at http://dx.doi.org/10.1787/888932847640.
Figure 2.8. Education and employment among young people, 2011
These figures show the distribution of education and work status among young adults, by age group. Young adults leaving school andentering a difficult labour market are more likely to become unemployed or fall outside the labour force entirely.
Source: OECD (2013), Education at a Glance 2013, Table C5.4a, available at http://dx.doi.org/10.1787/888932851117.
%
0
50
51015202530354045
Brazil
Austri
a
Norway
Switzerl
and
Canad
a
Austra
lia
United
Kingdo
mMex
ico
New Ze
aland
Czech
Rep
ublic
Belgium
Franc
e
Sweden
Netherl
ands
German
y
Luxe
mbour
g
United
States
OECD av
erag
e
Eston
ia
Poland
Irelan
d
Slovak
Rep
ublic
Korea
Turke
y
Greece
Spain
Chile
Finlan
d
Icelan
dIta
ly
Hunga
ryIsr
ael
Denmark
Sloven
iaJa
pan
Full-time Part-time Involuntary part-time
%
0102030405060708090
100
%
0102030405060708090
100
15-19 year-olds
25-29 year-olds
Luxe
mbourg
Franc
e
Belgium
Switzerl
and
Canad
a
Netherl
ands
United
Kingdo
m
Czech
Rep
ublic
Austri
aBraz
il
Poland
Portug
alKor
ea
Austra
lia
Sweden
New Ze
aland
German
y
OECD av
erag
e
Slovak
Rep
ublic
United
States
Hunga
ry
Eston
ia
Irelan
d
Greece
Icelan
dChil
e
Finlan
d
Sloven
iaSpa
in
Norway
Italy
Denmark
Israe
l
Turke
y
Mexico
In education Not in education, not employedNot in education, employed
Luxe
mbourg
Norway
Franc
e
Belgium
Switzerl
and
Canad
a
Netherl
ands
United
Kingdo
m
Czech
Rep
ublic
Austri
aBraz
il
Poland
Portug
alKor
ea
Austra
lia
Sweden
New Ze
aland
German
y
OECD av
erag
e
Slovak
Rep
ublic
Mexico
United
States
Hunga
ry
Eston
ia
Irelan
d
Greece
Icelan
dChil
e
Finlan
d
Sloven
iaSpa
inIta
ly
Denmark
Israe
l
Turke
y
EDUCATION AT A GLANCE 2013: HIGHLIGHTS © OECD 2013 31
2. HIGHER EDUCATION AND WORK
How many students study abroad and where do they go?
• Nearly 4.3 million students are enrolled in university-leveleducation outside their home country. Australia, the UnitedKingdom, Switzerland, New Zealand and Austria have, indescending order, the highest percentage of internationalstudents.
• Asian students represent 53% of foreign students enrolledworldwide. The largest numbers of foreign students are fromChina, India and Korea.
• OECD countries receive more international students than theysend abroad for tertiary education. Almost three times as manyforeign students are enrolled in tertiary education in OECDcountries as there are OECD citizens studying abroad.
• Some 83% of all foreign students are enrolled in G20 countries,while 77% are enrolled in OECD countries. These proportionshave remained stable during the past decade.
Significance
This section looks at the extent to which students arestudying abroad and their preferred destinations. Pursuinghigher-level education in a foreign country allows studentsto expand their knowledge of other societies and lan-guages, and thus improve their prospects in globalised sec-tors of the labour market. Beyond its social and educationaleffects, studying abroad has a considerable economicimpact. For host countries, enrolling international studentscan not only help raise revenues from higher education, butcan also be part of a broader strategy to recruit highlyskilled immigrants.
Findings
OECD countries attract three out of four students studyingabroad, with Australia, Canada, France, Germany, theUnited Kingdom and the United States together receivingmore than 50% of all foreign students worldwide.
In terms of geographical area, Europe is the top destinationfor tertiary level students enrolled outside their country oforigin, hosting 48% of these students, followed by NorthAmerica, which hosts 21% of all international students. Thenumber of international students in Oceania has tripledsince 2000, although this region hosts less than 10% of allforeign students. Other regions, such as Asia, Latin Americaand the Caribbean, are also seeing growing numbers ofinternational students, reflecting the internationalisation ofuniversities in an increasing number of countries.
International students from OECD countries mainly comefrom Canada, France, Germany, Italy, Japan, Korea, the SlovakRepublic, Turkey and the United States. In the 21 Europeancountries that are members of the OECD, there were2.7 foreign students per European citizen enrolled abroad.
International students represent 10% or more of the enrol-ments in tertiary education in Australia, Austria,New Zealand, Switzerland and the United Kingdom. Theyalso account for more than 30% of enrolments in advancedresearch programmes in Australia, the Netherlands,New Zealand, Switzerland, and the United Kingdom.
Trends
Over the past three decades, the number of studentsenrolled outside their country of citizenship has risen dra-matically, from 0.8 million worldwide in 1975 to 4.3 millionin 2011, a more than fivefold increase. During the 2000-11period, the number of foreign tertiary students enrolledworldwide more than doubled, with an average annualgrowth rate of almost 7%. In OECD countries, the number offoreign students enrolled at the tertiary level mirrored theglobal trend.
Definitions
Data on international and foreign students refer to the aca-demic year 2010-11 unless otherwise indicated and arebased on the UOE data collection on education statisticsadministered by the OECD in 2012. Additional data fromthe UNESCO Institute for Statistics are also included,although the year of reference is 2010. Students are classi-fied as “international” if they left their country of origin andmoved to another country to study. Students are classifiedas “foreign” if they are not citizens of the country in whichthey are studying. This latter category includes some stu-dents who are permanent residents, albeit not citizens, ofthe countries in which they are studying (for example,young people from immigrant families).
Information on data for Israel:http://dx.doi.org/10.1787/888932315602.
Going further
For additional material, notes and a full explanationof sourcing and methodologies, see Education at aGlance 2013 (Indicator C4).
Areas covered include:
– Distribution of students by country of origin anddestination.
– Trends in the numbers of students studying abroad.
EDUCATION AT A GLANCE 2013: HIGHLIGHTS © OECD 201332
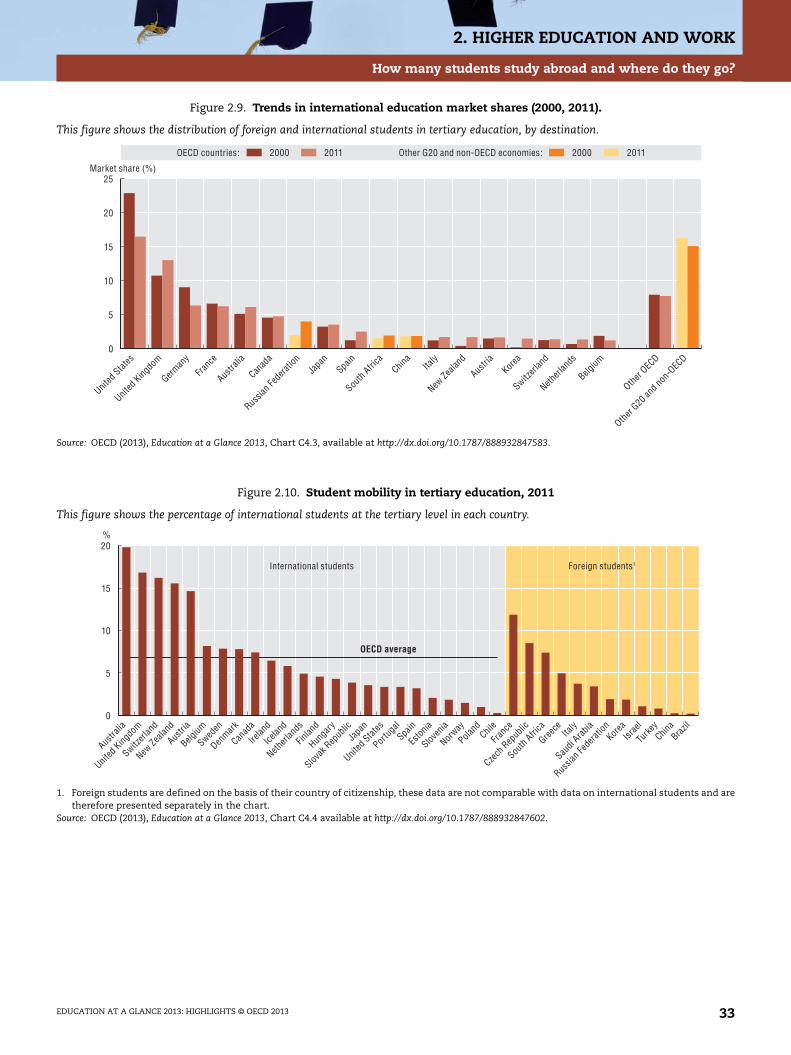
2. HIGHER EDUCATION AND WORK
How many students study abroad and where do they go?
Figure 2.9. Trends in international education market shares (2000, 2011).
This figure shows the distribution of foreign and international students in tertiary education, by destination.
Source: OECD (2013), Education at a Glance 2013, Chart C4.3, available at http://dx.doi.org/10.1787/888932847583.
Figure 2.10. Student mobility in tertiary education, 2011
This figure shows the percentage of international students at the tertiary level in each country.
1. Foreign students are defined on the basis of their country of citizenship, these data are not comparable with data on international students and aretherefore presented separately in the chart.
Source: OECD (2013), Education at a Glance 2013, Chart C4.4 available at http://dx.doi.org/10.1787/888932847602.
0
25
5
10
15
20
Market share (%)
2000 2011OECD countries: 2000 2011Other G20 and non-OECD economies:
United
States
United
Kingdo
m
German
y
Franc
e
Austra
lia
Canad
a
Russia
n Fed
eratio
nJa
pan
Spain
South
Africa
China
Italy
New Ze
aland
Austri
aKor
ea
Switzerl
and
Netherl
ands
Belgium
Other O
ECD
Other G
20 an
d non
-OEC
D
0
20%
5
10
15
Austra
lia
United
Kingdo
m
Switzerl
and
New Ze
aland
Austri
a
Belgium
Sweden
Denmark
Canad
a
Irelan
d
Icelan
d
Netherl
ands
Finlan
d
Hunga
ry
Slovak
Rep
ublic
Japa
n
United
States
Portug
alSpa
in
Eston
ia
Sloven
ia
Norway
Poland
Chile
Franc
e
Czech
Rep
ublic
South
Africa
Greece Ita
ly
Saudi
Arabia
Russia
n Fed
eratio
nKor
eaIsr
ael
Turke
yChin
aBraz
il
Foreign students1International students
OECD average
EDUCATION AT A GLANCE 2013: HIGHLIGHTS © OECD 2013 33

EDUCATION AT A GLANCE 2013: HIGHLIG
3. THE ECONOMIC AND SOCIAL BENEFITSOF EDUCATION
How much more do tertiary graduates earn?
How does education affect employment rates?
What are the incentives to invest in education?
What are the health benefits of education?
HTS © OECD 2013 35
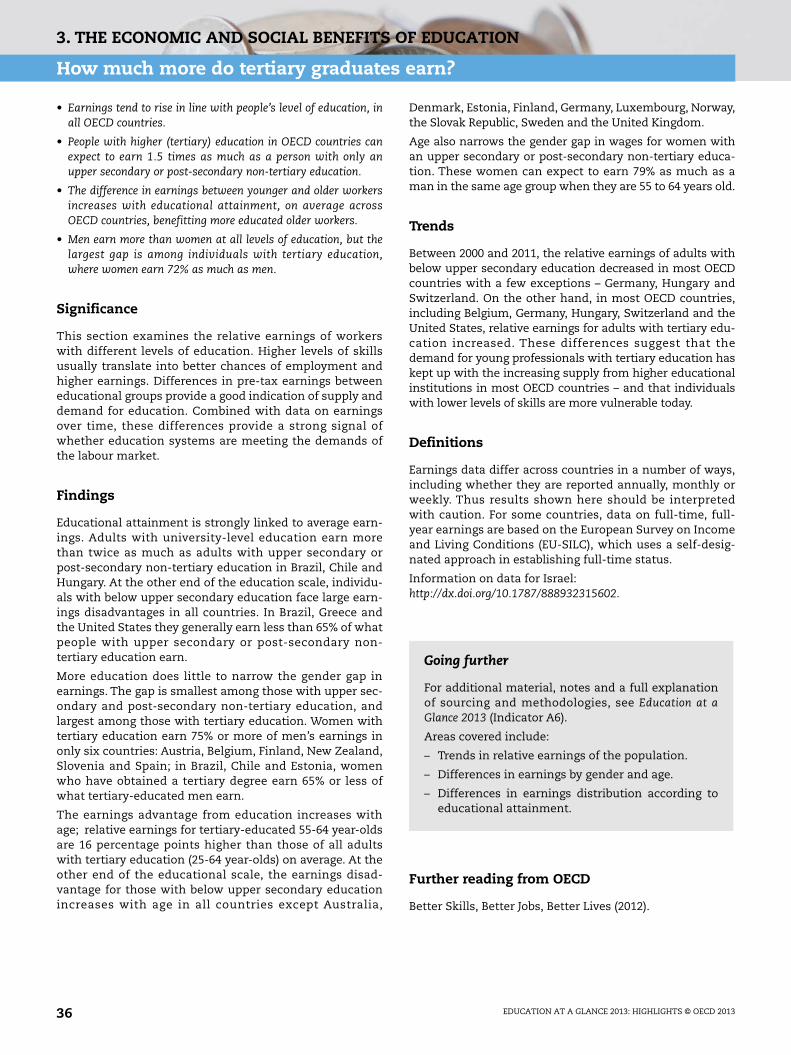
3. THE ECONOMIC AND SOCIAL BENEFITS OF EDUCATION
How much more do tertiary graduates earn?
• Earnings tend to rise in line with people’s level of education, inall OECD countries.
• People with higher (tertiary) education in OECD countries canexpect to earn 1.5 times as much as a person with only anupper secondary or post-secondary non-tertiary education.
• The difference in earnings between younger and older workersincreases with educational attainment, on average acrossOECD countries, benefitting more educated older workers.
• Men earn more than women at all levels of education, but thelargest gap is among individuals with tertiary education,where women earn 72% as much as men.
Significance
This section examines the relative earnings of workerswith different levels of education. Higher levels of skillsusually translate into better chances of employment andhigher earnings. Differences in pre-tax earnings betweeneducational groups provide a good indication of supply anddemand for education. Combined with data on earningsover time, these differences provide a strong signal ofwhether education systems are meeting the demands ofthe labour market.
Findings
Educational attainment is strongly linked to average earn-ings. Adults with university-level education earn morethan twice as much as adults with upper secondary orpost-secondary non-tertiary education in Brazil, Chile andHungary. At the other end of the education scale, individu-als with below upper secondary education face large earn-ings disadvantages in all countries. In Brazil, Greece andthe United States they generally earn less than 65% of whatpeople with upper secondary or post-secondary non-tertiary education earn.
More education does little to narrow the gender gap inearnings. The gap is smallest among those with upper sec-ondary and post-secondary non-tertiary education, andlargest among those with tertiary education. Women withtertiary education earn 75% or more of men’s earnings inonly six countries: Austria, Belgium, Finland, New Zealand,Slovenia and Spain; in Brazil, Chile and Estonia, womenwho have obtained a tertiary degree earn 65% or less ofwhat tertiary-educated men earn.
The earnings advantage from education increases withage; relative earnings for tertiary-educated 55-64 year-oldsare 16 percentage points higher than those of all adultswith tertiary education (25-64 year-olds) on average. At theother end of the educational scale, the earnings disad-vantage for those with below upper secondary educationincreases with age in all countries except Australia,
Denmark, Estonia, Finland, Germany, Luxembourg, Norway,the Slovak Republic, Sweden and the United Kingdom.
Age also narrows the gender gap in wages for women withan upper secondary or post-secondary non-tertiary educa-tion. These women can expect to earn 79% as much as aman in the same age group when they are 55 to 64 years old.
Trends
Between 2000 and 2011, the relative earnings of adults withbelow upper secondary education decreased in most OECDcountries with a few exceptions – Germany, Hungary andSwitzerland. On the other hand, in most OECD countries,including Belgium, Germany, Hungary, Switzerland and theUnited States, relative earnings for adults with tertiary edu-cation increased. These differences suggest that thedemand for young professionals with tertiary education haskept up with the increasing supply from higher educationalinstitutions in most OECD countries – and that individualswith lower levels of skills are more vulnerable today.
Definitions
Earnings data differ across countries in a number of ways,including whether they are reported annually, monthly orweekly. Thus results shown here should be interpretedwith caution. For some countries, data on full-time, full-year earnings are based on the European Survey on Incomeand Living Conditions (EU-SILC), which uses a self-desig-nated approach in establishing full-time status.
Information on data for Israel:http://dx.doi.org/10.1787/888932315602.
Further reading from OECD
Better Skills, Better Jobs, Better Lives (2012).
Going further
For additional material, notes and a full explanationof sourcing and methodologies, see Education at aGlance 2013 (Indicator A6).
Areas covered include:
– Trends in relative earnings of the population.
– Differences in earnings by gender and age.
– Differences in earnings distribution according toeducational attainment.
EDUCATION AT A GLANCE 2013: HIGHLIGHTS © OECD 201336
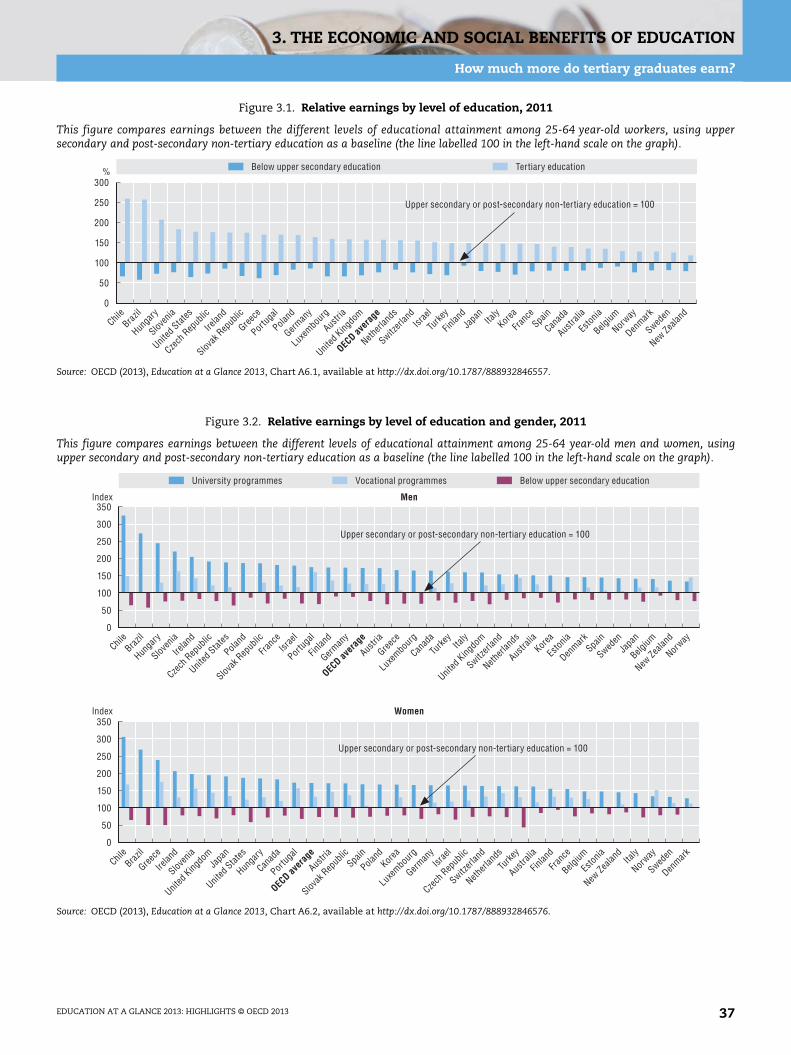
3. THE ECONOMIC AND SOCIAL BENEFITS OF EDUCATION
How much more do tertiary graduates earn?
Figure 3.1. Relative earnings by level of education, 2011
This figure compares earnings between the different levels of educational attainment among 25-64 year-old workers, using uppersecondary and post-secondary non-tertiary education as a baseline (the line labelled 100 in the left-hand scale on the graph).
Source: OECD (2013), Education at a Glance 2013, Chart A6.1, available at http://dx.doi.org/10.1787/888932846557.
Figure 3.2. Relative earnings by level of education and gender, 2011
This figure compares earnings between the different levels of educational attainment among 25-64 year-old men and women, usingupper secondary and post-secondary non-tertiary education as a baseline (the line labelled 100 in the left-hand scale on the graph).
Source: OECD (2013), Education at a Glance 2013, Chart A6.2, available at http://dx.doi.org/10.1787/888932846576.
%
0
300
50
100
150
200
250
Below upper secondary education Tertiary education
Chile
Brazil
Hunga
ry
Sloven
ia
United
States
Czech
Rep
ublic
Irelan
d
Slovak
Rep
ublic
Greece
Portug
al
Poland
German
y
Luxe
mbourg
Austri
a
United
Kingdo
m
OECD av
erag
e
Netherl
ands
Switzerl
and
Israe
l
Turke
y
Finlan
dJa
pan
Italy
Korea
Franc
eSpa
in
Canad
a
Austra
lia
Eston
ia
Belgium
Norway
Denmark
Sweden
New Ze
aland
Upper secondary or post-secondary non-tertiary education = 100
Index
Index
0
350
0
350
50
100
150
200
250
300
50
100
150
200
250
300
Men
Women
University programmes Below upper secondary educationVocational programmes
Chile
Brazil
Hunga
ry
Sloven
ia
Irelan
d
Czech
Rep
ublic
United
States
Poland
Slovak
Rep
ublic
Franc
eIsr
ael
Portug
al
Finlan
d
German
y
OECD av
erag
e
Austri
a
Greece
Luxe
mbour
g
Canad
a
Turke
yIta
ly
United
Kingdo
m
Switzerl
and
Netherl
ands
Austra
liaKor
ea
Eston
ia
Denmark
Spain
Sweden
Japa
n
Belgium
New Ze
aland
Norway
Upper secondary or post-secondary non-tertiary education = 100
Upper secondary or post-secondary non-tertiary education = 100
Chile
Brazil
Greece
Irelan
d
Sloven
ia
United
Kingdo
mJa
pan
United
States
Hunga
ry
Canad
a
Portug
al
OECD av
erag
e
Austri
a
Slovak
Rep
ublic
Spain
Poland
Korea
Luxe
mbour
g
German
yIsr
ael
Czech
Rep
ublic
Switzerl
and
Netherl
ands
Turke
y
Austra
lia
Finlan
d
Franc
e
Belgium
Eston
ia
New Ze
aland Ita
ly
Norway
Sweden
Denmark
EDUCATION AT A GLANCE 2013: HIGHLIGHTS © OECD 2013 37
3. THE ECONOMIC AND SOCIAL BENEFITS OF EDUCATION
How does education affect employment rates?
• Across OECD countries, people with a tertiary education aremore likely to have a job, and to be working full-time, thanthose without.
• Unemployment rates are nearly three times higher among peoplewho do not have an upper secondary education (13% on averageacross OECD countries) than among those who have a tertiaryeducation (5%).
• People with at least an upper secondary education are morelikely to have a job than those without this level of education.
• Men generally have higher employment rates than women,although the gap is narrowest among tertiary-educated indi-viduals and widest among those without an upper secondaryeducation.
Significance
This section examines the relationship between educationand working life. OECD countries depend upon a sufficientsupply of well-educated workers to promote economicdevelopment. Data on employment and unemploymentrates thus carry important information for policy makersabout how well the supply of skills matches demand. Thesedata also help governments better understand how econo-mies may evolve in the coming years and help them ensurethat the students of today are better prepared for the jobsof tomorrow.
Findings
Education has a substantial impact on employment pros-pects. On average across OECD countries, over 80% of thepopulation with tertiary education is employed. The OECDaverage falls to over 70% for people with upper secondaryor post-secondary non-tertiary education and to less than60% for those without an upper secondary education. Theprobability of working full time also increases with thelevel of education. Some 64% of people with below uppersecondary education work full time, compared with 75% ofpeople with a tertiary education.
Differences in employment rates between tertiary-educatedindividuals and those with lower secondary education areparticularly large in the Czech Republic, Hungary, Poland,the Slovak Republic, Slovenia and the United Kingdom,where they amount to 40 percentage points or more. Acrossall OECD countries and education levels, the employmentrate of women is far below that of men at all levels of educa-tion: only 65% of women are employed compared with 80%of men. Although the gender gap narrows as educationalattainment increases, the employment rate among tertiary-educated women across OECD countries is still considerablylower than that of men – despite the fact that in 2011 aslightly higher proportion of women (33%) than men (30%) inOECD countries had received a tertiary education.
Across OECD countries, individuals with a vocationally ori-ented upper secondary education are more likely to beemployed (76%) than those who have a general upper sec-ondary degree (70%). They are also less likely to be unem-ployed (7.4%) than those with a general upper secondarydegree (8.4%).
Trends
Education is generally good insurance against unemploy-ment, even in difficult economic times. Over the past15 years, employment rates for men and women with ter-tiary education have consistently been higher than forthose without. Conversely, unemployment rates amonglower-educated men and women have been higher thanamong those with tertiary education. The economic crisisonly widened these gaps. People without an upper second-ary or post-secondary non-tertiary education were hithardest: between 2008 and 2011 the unemployment rateamong them increased by almost 4 percentage points, from8.8% to 12.6%.
Definitions
The employment rate refers to the number of persons inemployment as a percentage of the population of workingage. The unemployment rate refers to unemployed personsas a percentage of the labour force. The unemployed aredefined as people without work but actively seekingemployment and currently available to start work. Theemployed are defined as those who work for pay or profitfor at least one hour a week, or who have a job but are tem-porarily not at work due to illness, leave or industrialaction.
Information on data for Israel:http://dx.doi.org/10.1787/888932315602.
Going further
For additional material, notes and a full explanationof sourcing and methodologies, see Education at aGlance 2013 (Indicator A5).
Areas covered include:
– Trends in employment and unemployment rates,by gender and educational attainment.
– Employment rates of individuals with vocationaland general education.
– Part-time and involuntary part-time work.
EDUCATION AT A GLANCE 2013: HIGHLIGHTS © OECD 201338
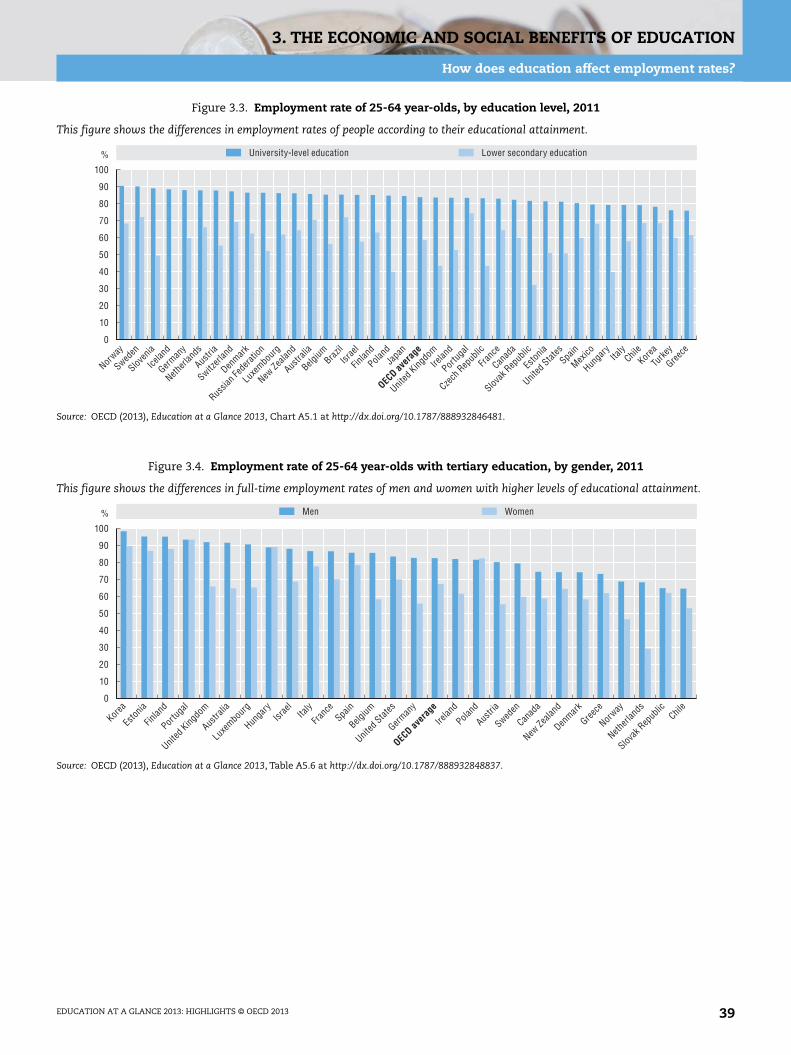
3. THE ECONOMIC AND SOCIAL BENEFITS OF EDUCATION
How does education affect employment rates?
Figure 3.3. Employment rate of 25-64 year-olds, by education level, 2011
This figure shows the differences in employment rates of people according to their educational attainment.
Source: OECD (2013), Education at a Glance 2013, Chart A5.1 at http://dx.doi.org/10.1787/888932846481.
Figure 3.4. Employment rate of 25-64 year-olds with tertiary education, by gender, 2011
This figure shows the differences in full-time employment rates of men and women with higher levels of educational attainment.
Source: OECD (2013), Education at a Glance 2013, Table A5.6 at http://dx.doi.org/10.1787/888932848837.
0
10
20
30
40
50
60
70
80
90
100
% University-level education Lower secondary education
Norway
Sweden
Sloven
ia
Icelan
d
German
y
Netherl
ands
Austri
a
Switzerl
and
Denmark
Russia
n Fed
eratio
n
Luxe
mbour
g
New Ze
aland
Austra
lia
BelgiumBraz
ilIsr
ael
Finlan
d
Poland
Japa
n
OECD av
erag
e
United
Kingdo
mIre
land
Portug
al
Czech
Rep
ublic
Franc
e
Canad
a
Slovak
Rep
ublic
Eston
ia
United
States
Spain
Mexico
Hunga
ryIta
lyChil
eKor
ea
Turke
y
Greece
0
10
20
30
40
50
60
70
80
90
100
% Men Women
Korea
Eston
ia
Finlan
d
Portug
al
United
Kingdo
m
Austra
lia
Luxe
mbourg
Hunga
ryIsr
ael
Italy
Franc
eSpa
in
Belgium
United
States
German
y
OECD av
erag
e
Irelan
d
Poland
Austri
a
Sweden
Canad
a
New Ze
aland
Denmark
Greece
Norway
Netherl
ands
Slovak
Rep
ublic
Chile
EDUCATION AT A GLANCE 2013: HIGHLIGHTS © OECD 2013 39

3. THE ECONOMIC AND SOCIAL BENEFITS OF EDUCATION
What are the incentives to invest in education?
• People invest about USD 55 000 to obtain a tertiary degree inOECD countries, but men can expect to earn USD 330 000 morein their lifetime than those without this level of education, andwomen USD 240 000 more.
• Education does not only pay off for individuals; it also contrib-utes to the public good in the form of greater tax revenues andsocial contributions.
• The net public return on an investment in tertiary education isover USD 100 000 for men on average across OECD countries –nearly three times the amount of public investment – andaround USD 60 000 for women.
Significance
Higher educational achievement benefits both individualsand society, not only financially, but in the well-being withwhich it is associated. The efforts people make to continueeducation after compulsory schooling can be thought of asan investment with the potential to bring rewards in theform of future financial returns. Society, in turn, profitsthrough reduced public expenditure on social welfare pro-grammes and revenues earned through taxes paid onceindividuals enter the labour market.
Findings
Rewards are typically higher for those with higher levels ofeducation. Gross earning benefits for a person with an uppersecondary or post-secondary non-tertiary degree, comparedto benefits for a person who has not attained this level ofeducation, are particularly high in Austria, Norway and theUnited States. They amount to at least USD 250 000 for aman and USD 150 000 for a woman.
Higher education generates gross earnings benefits, com-pared with the income of a person with an upper secondaryor post-secondary non-tertiary education, of USD 330 000 formen and USD 240 000 for women across OECD countries.
Individuals invest about USD 55 000 to obtain a tertiarydegree in OECD countries. In Japan, the Netherlands, theUnited Kingdom and the United States, average investmentexceeds USD 100 000 when direct costs such as tuition feesand indirect costs such as loss of earnings while studyingare taken into account.
With few exceptions, rewards are higher for individualswho attain tertiary education than those without. Onlyin Denmark and Sweden does upper secondary or post-secondary non-tertiary education bring higher returns toboth men and women. In Norway and Korea, upper second-
ary or post-secondary non-tertiary education returnsexceed tertiary education returns for men; in New Zealand,the same is true for women.
Investing in upper secondary or post-secondary non-tertiary education generates a net public return ofUSD 38 000 for men and USD 22 000 for women across theirworking life, on average across the 28 OECD countries withavailable data. The public benefits are twice as large as theoverall public costs of upper secondary or post-secondarynon-tertiary education, for both men and women. In theUnited Kingdom, public benefits are six times larger thanthe public costs for a man with this level of education andeight times larger for a woman.
On average across OECD countries, public investment in aperson’s tertiary education is USD 39 000 higher than thatfor an individual’s upper secondary or post-secondary edu-cation. Public investment in an individual’s tertiary educationis highest in Austria, Denmark, Germany, the Netherlands,Norway and Sweden.
Definitions
The economic returns to education are measured by thenet present value or NPV. In the calculations, privateinvestment costs include after-tax foregone earningsadjusted for the probability of finding a job (unemploymentrate) and direct private spending on education. Public costsinclude lost income tax receipts during the school years,and public spending.
Information on data for Israel:http://dx.doi.org/10.1787/888932315602.
Going further
For additional material, notes and a full explanationof sourcing and methodologies, as well as a technicalexplanation of how the NPV is derived, see Educationat a Glance 2013 (Indicator A7).
Areas covered include:
– Private costs and benefits of education, by educa-tion level and gender.
– Public costs and benefits of education, by educa-tion level and gender.
EDUCATION AT A GLANCE 2013: HIGHLIGHTS © OECD 201340
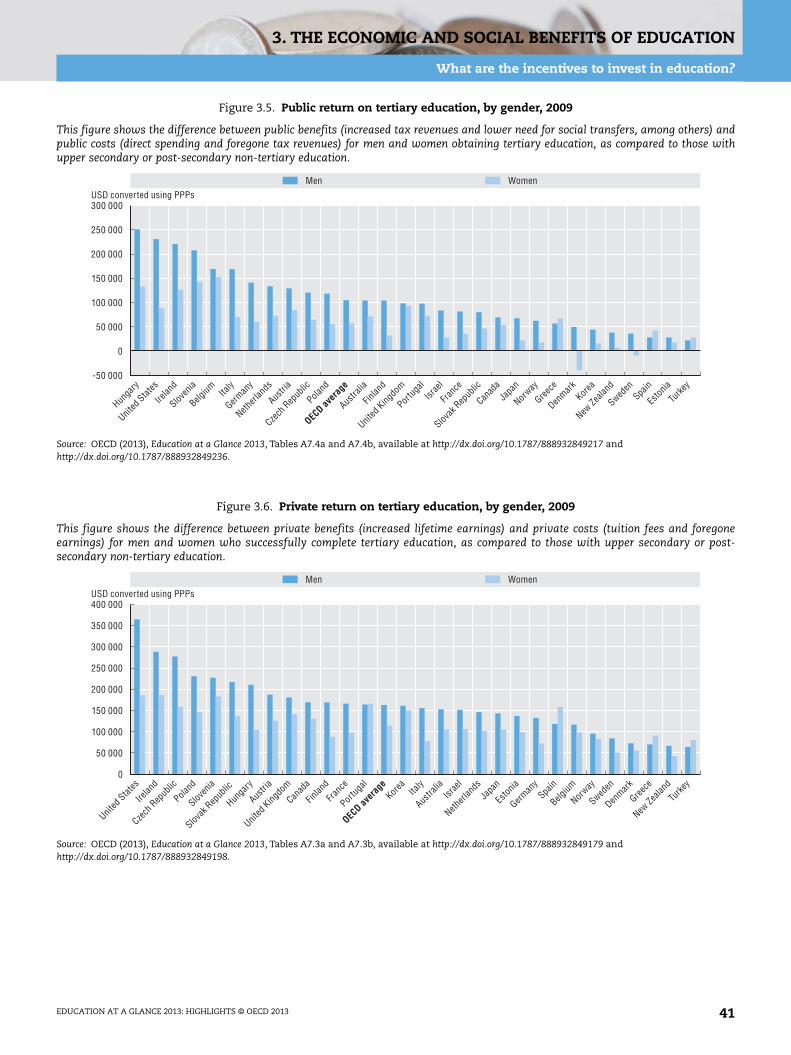
3. THE ECONOMIC AND SOCIAL BENEFITS OF EDUCATION
What are the incentives to invest in education?
Figure 3.5. Public return on tertiary education, by gender, 2009
This figure shows the difference between public benefits (increased tax revenues and lower need for social transfers, among others) andpublic costs (direct spending and foregone tax revenues) for men and women obtaining tertiary education, as compared to those withupper secondary or post-secondary non-tertiary education.
Source: OECD (2013), Education at a Glance 2013, Tables A7.4a and A7.4b, available at http://dx.doi.org/10.1787/888932849217 andhttp://dx.doi.org/10.1787/888932849236.
Figure 3.6. Private return on tertiary education, by gender, 2009
This figure shows the difference between private benefits (increased lifetime earnings) and private costs (tuition fees and foregoneearnings) for men and women who successfully complete tertiary education, as compared to those with upper secondary or post-secondary non-tertiary education.
Source: OECD (2013), Education at a Glance 2013, Tables A7.3a and A7.3b, available at http://dx.doi.org/10.1787/888932849179 andhttp://dx.doi.org/10.1787/888932849198.
-50 000
300 000
0
50 000
100 000
150 000
200 000
250 000
Korea
Japa
n
Canad
a
Irelan
d
United
Kingdo
m
Norway
New Ze
aland
Israe
l
Austra
lia
United
States
Franc
e
Sweden
Belgium
Netherl
ands
Finlan
d
Poland
Spain
Eston
ia
OECD av
erag
e
Denmark
Sloven
ia
Greece
Hunga
ry
German
y
Portug
al
Slovak
Rep
ublic
Czech
Rep
ublic
Austri
aIta
ly
Turke
y
USD converted using PPPsMen Women
0
400 000
50 000
100 000
150 000
200 000
250 000
300 000
350 000
USD converted using PPPsMen Women
United
States
Irelan
d
Czech
Rep
ublic
Poland
Sloven
ia
Slovak
Rep
ublic
Hunga
ry
Austri
a
United
Kingdo
m
Canad
a
Finlan
d
Franc
e
Portug
al
OECD av
erag
eKor
ea Italy
Austra
liaIsr
ael
Netherl
ands
Japa
n
Eston
ia
German
ySpa
in
Belgium
Norway
Sweden
Denmark
Greece
New Ze
aland
Turke
y
EDUCATION AT A GLANCE 2013: HIGHLIGHTS © OECD 2013 41
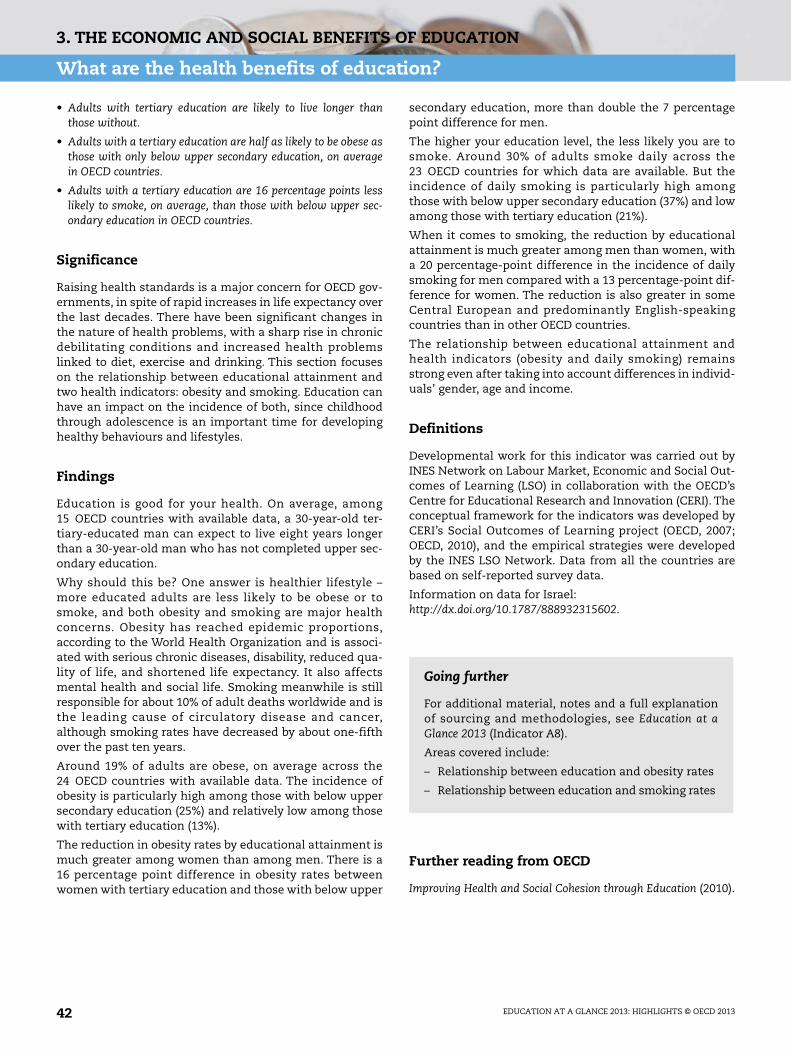
3. THE ECONOMIC AND SOCIAL BENEFITS OF EDUCATION
What are the health benefits of education?
• Adults with tertiary education are likely to live longer thanthose without.
• Adults with a tertiary education are half as likely to be obese asthose with only below upper secondary education, on averagein OECD countries.
• Adults with a tertiary education are 16 percentage points lesslikely to smoke, on average, than those with below upper sec-ondary education in OECD countries.
Significance
Raising health standards is a major concern for OECD gov-ernments, in spite of rapid increases in life expectancy overthe last decades. There have been significant changes inthe nature of health problems, with a sharp rise in chronicdebilitating conditions and increased health problemslinked to diet, exercise and drinking. This section focuseson the relationship between educational attainment andtwo health indicators: obesity and smoking. Education canhave an impact on the incidence of both, since childhoodthrough adolescence is an important time for developinghealthy behaviours and lifestyles.
Findings
Education is good for your health. On average, among15 OECD countries with available data, a 30-year-old ter-tiary-educated man can expect to live eight years longerthan a 30-year-old man who has not completed upper sec-ondary education.
Why should this be? One answer is healthier lifestyle –more educated adults are less likely to be obese or tosmoke, and both obesity and smoking are major healthconcerns. Obesity has reached epidemic proportions,according to the World Health Organization and is associ-ated with serious chronic diseases, disability, reduced qua-lity of life, and shortened life expectancy. It also affectsmental health and social life. Smoking meanwhile is stillresponsible for about 10% of adult deaths worldwide and isthe leading cause of circulatory disease and cancer,although smoking rates have decreased by about one-fifthover the past ten years.
Around 19% of adults are obese, on average across the24 OECD countries with available data. The incidence ofobesity is particularly high among those with below uppersecondary education (25%) and relatively low among thosewith tertiary education (13%).
The reduction in obesity rates by educational attainment ismuch greater among women than among men. There is a16 percentage point difference in obesity rates betweenwomen with tertiary education and those with below upper
secondary education, more than double the 7 percentagepoint difference for men.
The higher your education level, the less likely you are tosmoke. Around 30% of adults smoke daily across the23 OECD countries for which data are available. But theincidence of daily smoking is particularly high amongthose with below upper secondary education (37%) and lowamong those with tertiary education (21%).
When it comes to smoking, the reduction by educationalattainment is much greater among men than women, witha 20 percentage-point difference in the incidence of dailysmoking for men compared with a 13 percentage-point dif-ference for women. The reduction is also greater in someCentral European and predominantly English-speakingcountries than in other OECD countries.
The relationship between educational attainment andhealth indicators (obesity and daily smoking) remainsstrong even after taking into account differences in individ-uals’ gender, age and income.
Definitions
Developmental work for this indicator was carried out byINES Network on Labour Market, Economic and Social Out-comes of Learning (LSO) in collaboration with the OECD’sCentre for Educational Research and Innovation (CERI). Theconceptual framework for the indicators was developed byCERI’s Social Outcomes of Learning project (OECD, 2007;OECD, 2010), and the empirical strategies were developedby the INES LSO Network. Data from all the countries arebased on self-reported survey data.
Information on data for Israel:http://dx.doi.org/10.1787/888932315602.
Further reading from OECD
Improving Health and Social Cohesion through Education (2010).
Going further
For additional material, notes and a full explanationof sourcing and methodologies, see Education at aGlance 2013 (Indicator A8).
Areas covered include:
– Relationship between education and obesity rates
– Relationship between education and smoking rates
EDUCATION AT A GLANCE 2013: HIGHLIGHTS © OECD 201342
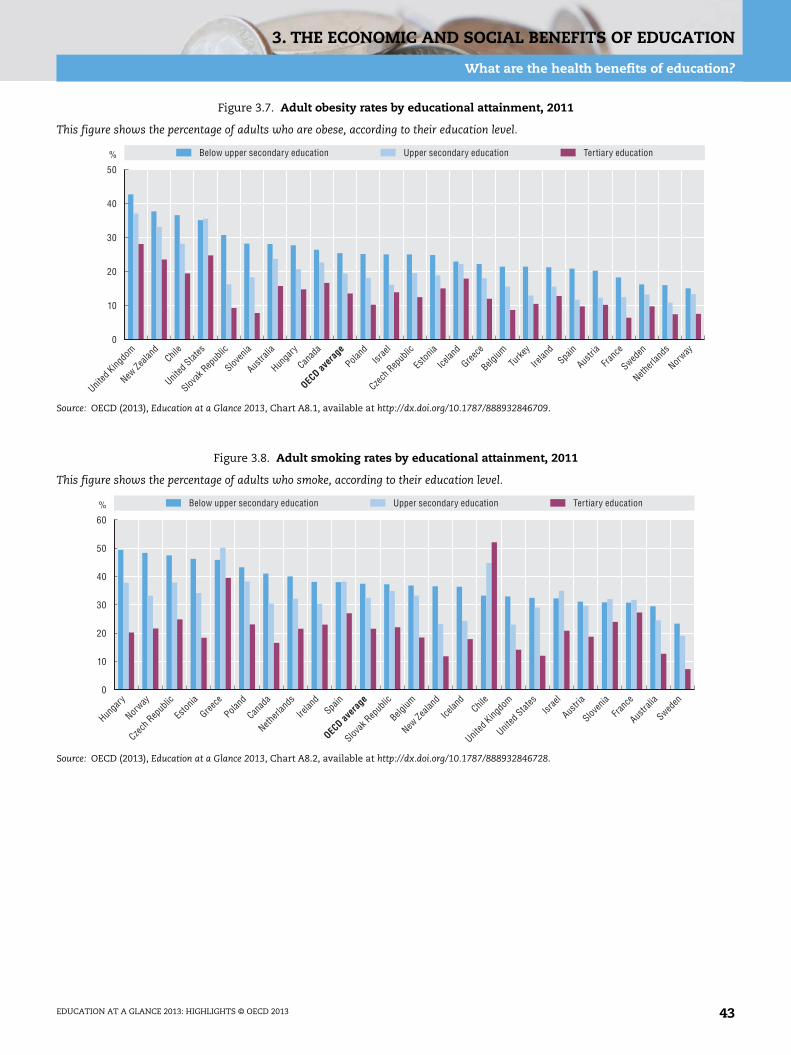
3. THE ECONOMIC AND SOCIAL BENEFITS OF EDUCATION
What are the health benefits of education?
Figure 3.7. Adult obesity rates by educational attainment, 2011
This figure shows the percentage of adults who are obese, according to their education level.
Source: OECD (2013), Education at a Glance 2013, Chart A8.1, available at http://dx.doi.org/10.1787/888932846709.
Figure 3.8. Adult smoking rates by educational attainment, 2011
This figure shows the percentage of adults who smoke, according to their education level.
Source: OECD (2013), Education at a Glance 2013, Chart A8.2, available at http://dx.doi.org/10.1787/888932846728.
0
50
%
10
20
30
40
Below upper secondary education Upper secondary education Tertiary education
United
Kingdo
m
New Ze
aland
Chile
United
States
Slovak
Rep
ublic
Sloven
ia
Austra
lia
Hunga
ry
Canad
a
OECD av
erag
e
Poland
Israe
l
Czech
Rep
ublic
Eston
ia
Icelan
d
Greece
Belgium
Turke
y
Irelan
dSpa
in
Austri
a
Franc
e
Sweden
Netherl
ands
Norway
0
60
50
%
10
20
30
40
Below upper secondary education Upper secondary education Tertiary education
Hunga
ry
Norway
Czech
Rep
ublic
Eston
ia
Greece
Poland
Canad
a
Netherl
ands
Irelan
dSpa
in
OECD av
erag
e
Slovak
Rep
ublic
Belgium
New Ze
aland
Icelan
dChil
e
United
Kingdo
m
United
States
Israe
l
Austri
a
Sloven
ia
Franc
e
Austra
lia
Sweden
EDUCATION AT A GLANCE 2013: HIGHLIGHTS © OECD 2013 43

EDUCATION AT A GLANCE 2013: HIGHLIG
4. PAYING FOR EDUCATION
How much is spent per student?
What share of national wealth is spent on education?
What share of public spending goes to education?
What is the role of private spending?
How much do tertiary students pay?
How much do teachers cost?
HTS © OECD 2013 45

4. PAYING FOR EDUCATION
How much is spent per student?
• OECD countries on average spend USD 9 313 per student eachyear between primary and tertiary education: USD 7 974per primary student, USD 9 014 per secondary student, andUSD 13 528 per tertiary student.
• Some 94% of total spending per student in primary and second-ary education is devoted to core educational services. Greaterdifferences are seen at the tertiary level, partly because expen-diture on research and development (R&D) represents an aver-age of 31% of total spending per student
• Spending per student on primary, secondary and post-second-ary non-university-level education increased by 17 percentagepoints on average across OECD countries between 2005 and2010. However between 2009 and 2010, investment in educa-tion fell in around one-third of OECD countries as a result of theeconomic crisis.
Significance
This section shows the levels of combined public and pri-vate spending on education. Demand for high-quality edu-cation, which may mean spending more per student, mustbe balanced against other demands on public spending andthe desire to keep taxes low. This issue is all the moreimportant at a time of economic crisis and tight publicspending. While it is difficult to determine the level ofspending needed to prepare a student for work and life,international comparisons can provide reference points forcomparisons of education resources.
Findings
Spending per student is largely affected by teachers’ sala-ries. Indeed, teachers’ salaries and low student-teacherratios are the main elements raising spending in the10 countries with the highest levels of spending per stu-dent at the secondary level.
There is a strong relationship between spending per stu-dent and GDP per capita at the primary and secondarylevels – poorer countries tend to spend less than richerones. The relationship is weaker at the tertiary level,mainly because financing mechanisms and enrolment pat-terns differ more at this level.
Once R&D activities and ancillary services such as welfareservices to students are excluded, spending on educationalcore services from primary through tertiary education inOECD countries falls from an average USD 9 313 to an aver-age USD 7 637. This results mainly from the much lowerlevel of spending per student at the tertiary level (USD 8 889)when peripheral activities are not taken into account.
On average, OECD countries spend nearly twice as muchper student at the tertiary level than at the primary level. Attertiary level, however, other services, particularly research
and development activities, also constitute a large slice ofexpenditure. When these are excluded, spending per stu-dent on core educational services at the tertiary level isstill, on average, 10% higher than at the primary, secondaryand post-secondary non-tertiary levels.
Trends
Spending per primary, secondary and post-secondary non-tertiary student increased in every country with availabledata, and by an average of more than 61% between 1995and 2010, a period of relatively stable student enrolment inmost countries.
Between 2005 and 2010, spending per tertiary student fellin 8 of the 31 countries with available data. Spending inAustria, Iceland, Israel, the United Kingdom and the UnitedStates, did not increase at the same pace as enrolment rates.In New Zealand, the Russian Federation and Switzerland,public spending per student (data on private expenditure arenot available) decreased during this period.
Definitions
Data refer to the financial year 2010 and are based on theUOE data collection on education statistics administered bythe OECD in 2012. Spending per student at a particular levelof education is calculated by dividing the total expenditureby educational institutions at that level by the correspond-ing full-time equivalent enrolment.
Core educational services are directly related to instructionin educational institutions, including teachers’ salaries,construction and maintenance of school buildings, teach-ing materials, books, and administration of schools.
Information on data for Israel:http://dx.doi.org/10.1787/888932315602.
Going further
For additional material, notes and a full explanationof sourcing and methodologies, see Education at aGlance 2013 (Indicator B1).
Areas covered include:
– Annual expenditure by educational institutionsper student for all services, and compared to GDPper capita.
– Cumulative expenditure by educational institu-tions per student.
EDUCATION AT A GLANCE 2013: HIGHLIGHTS © OECD 201346
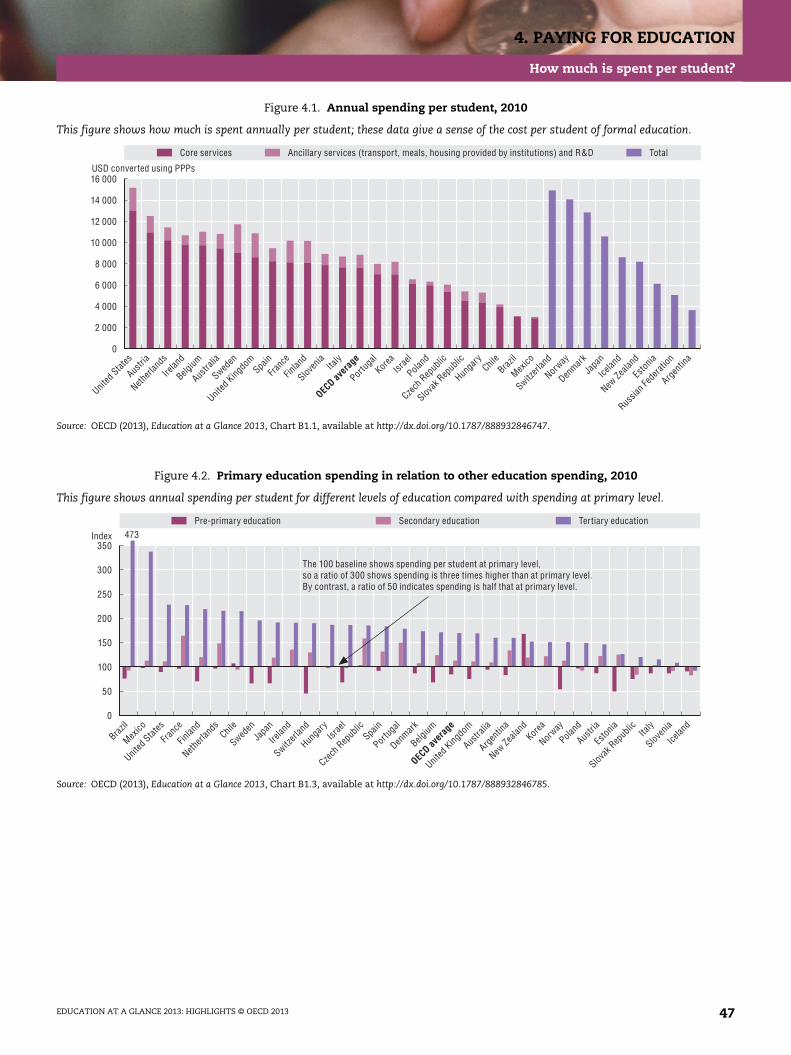
4. PAYING FOR EDUCATION
How much is spent per student?
Figure 4.1. Annual spending per student, 2010
This figure shows how much is spent annually per student; these data give a sense of the cost per student of formal education.
Source: OECD (2013), Education at a Glance 2013, Chart B1.1, available at http://dx.doi.org/10.1787/888932846747.
Figure 4.2. Primary education spending in relation to other education spending, 2010
This figure shows annual spending per student for different levels of education compared with spending at primary level.
Source: OECD (2013), Education at a Glance 2013, Chart B1.3, available at http://dx.doi.org/10.1787/888932846785.
0
16 000
2 000
4 000
6 000
8 000
10 000
12 000
14 000
USD converted using PPPs
Core services Ancillary services (transport, meals, housing provided by institutions) and R&D Total
United
States
Austri
a
Netherl
ands
Irelan
d
Belgium
Austra
lia
Sweden
United
Kingdo
mSpa
in
Franc
e
Finlan
d
Sloven
iaIta
ly
OECD av
erag
e
Portug
alKor
eaIsr
ael
Poland
Czech
Rep
ublic
Slovak
Rep
ublic
Hunga
ryChil
eBraz
il
Mexico
Switzerl
and
Norway
Denmark
Japa
n
Icelan
d
New Ze
aland
Eston
ia
Russia
n Fed
eratio
n
Argen
tina
0
350
50
100
150
200
250
300
473Pre-primary education Secondary education Tertiary education
Brazil
Mexico
United
States
Franc
e
Finlan
d
Netherl
ands
Chile
Sweden
Japa
n
Irelan
d
Switzerl
and
Hunga
ryIsr
ael
Czech
Rep
ublic
Spain
Portug
al
Denmark
Belgium
OECD av
erag
e
United
Kingdo
m
Austra
lia
Argen
tina
New Ze
aland
Korea
Norway
Poland
Austri
a
Eston
ia
Slovak
Rep
ublic Ita
ly
Sloven
ia
Icelan
d
The 100 baseline shows spending per student at primary level,so a ratio of 300 shows spending is three times higher than at primary level.By contrast, a ratio of 50 indicates spending is half that at primary level.
Index
EDUCATION AT A GLANCE 2013: HIGHLIGHTS © OECD 2013 47
4. PAYING FOR EDUCATION
What share of national wealth is spent on education?
• OECD countries spend 6.3% of their GDP on educational insti-tutions on average.
• Spending on all levels of education combined increased at afaster rate than GDP growth between 2000 and 2010 in almostall countries for which data are available.
• GDP rose in most countries between 2009 and 2010, but publicspending on educational institutions fell in one-third of OECDcountries during that time, probably as a consequence of fiscalconsolidation policies.
Significance
Countries invest in educational institutions to help fostereconomic growth, enhance productivity, contribute to per-sonal and social development, and reduce social inequality.This section examines the proportion of a nation’s wealththat is invested in education. The level of spending dependson how a country – including its government, private enter-prise, individual students and their families – prioritiseseducation in relation to overall spending. Education spend-ing largely comes from public budgets and is closely scruti-nised by governments. During times of financial crisis, evencore sectors like education can be subject to budget cuts.
Findings
Spending on pre-primary education accounts for nearlyone-tenth of spending on educational institutions, or 0.6%of GDP, on average across OECD countries. There are largedifferences among countries. For instance, spending onpre-primary education represents less than 0.2% of GDP inAustralia and Turkey, but about 1% or more in Denmark andIceland.
Nearly two-thirds of combined OECD spending on educa-tional institutions, or 3.9% of GDP, are devoted to primary,secondary and post-secondary non-tertiary education.New Zealand and Norway spend more than 5% of their GDPon these levels of education, while the Czech Republic,Hungary, Japan, the Russian Federation and Turkey spend3% or less.
Tertiary education accounts for one-quarter of spending oneducational institutions, or 1.6% of GDP, on average acrossOECD countries. Canada, Chile, Korea and the United Statesspend between 2.4% and 2.8% of their GDP on tertiary insti-tutions. Three countries devote less than 1% of GDP to ter-tiary education: Brazil (0.9%), Hungary (0.8%) and theSlovak Republic (0.9%).
Private spending on educational institutions as a percentageof GDP is highest in tertiary education. It represents between1.7% and 1.9% of GDP in Chile, Korea and the United States.
Trends
The global economic crisis that began in 2008 had – and isstill having – major adverse effects on different sectors ofthe economy. The annual rate of growth of public spendingon educational institutions slowed from 4% between 2008and 2009 to 1% between 2009 and 2010 on average acrossOECD countries. More than one-third of the countries withavailable data reported a slowdown in the annual growth ofpublic spending on educational institutions between 2008and 2010: Austria, Ireland, New Zealand, Norway, Portugal,Spain and the United States reported an increase between2008 and 2009 then a drop between 2009 and 2010, whileEstonia, Hungary, Iceland and Italy reported decreasesbetween both 2008-09 and 2009-10.
Definitions
Data refer to the 2010 financial year and are based on theUOE data collection on education statistics administered bythe OECD in 2012. Expenditure on educational institutionsincludes expenditure on both instructional institutions(those that provide teaching to individuals in an organizedgroup setting or through distance education) and non-instructional institutions (those that provide administra-tive, advisory or professional services to other educationalinstitutions, but do not enrol students themselves).
Information on data for Israel:http://dx.doi.org/ 10.1787/888932315602.
Going further
For additional material, notes and a full explanationof sourcing and methodologies, see Education at aGlance 2013 (Indicator B2).
Areas covered include:
– Expenditure on educational institutions as a per-centage of GDP.
– Change in expenditure, 1995, 2000, and 2008-10.
EDUCATION AT A GLANCE 2013: HIGHLIGHTS © OECD 201348

4. PAYING FOR EDUCATION
What share of national wealth is spent on education?
Figure 4.3. Trends in education spending as a percentage of GDP (2000, 2010)
This figure shows the share of national income that countries devote to spending on educational institutions, and how that share haschanged over time.
Source: OECD (2013), Education at a Glance 2013, Table B2.1, available at http://dx.doi.org/10.1787/888932849578.
Figure 4.4. Impact of the economic crisis on education spending
This figure shows how the economic crisis has affected public spending on education.
Source: OECD (2013), Education at a Glance 2013, Chart B2.3, available at http://dx.doi.org/10.1787/888932846918.
0
9
1
2
3
4
5
6
7
8
2010 2000% of GDP
Denmark
Icelan
dKor
ea
Norway
Israe
l
United
States
New Ze
aland
Argen
tina
Belgium
Canad
a
Finlan
d
United
Kingdo
m
Sweden
Irelan
dChil
e
Franc
e
Netherl
ands
OECD av
erag
e
Mexico
Austra
lia
Eston
ia
Sloven
ia
Portug
al
Poland
Austri
aBraz
ilSpa
in
Switzerl
andJa
pan
Russia
n Fed
eratio
n
Czech
Rep
ublic Ita
ly
Slovak
Rep
ublic
Hunga
ry
85
120
90
95
100
105
110
115
Index of change (2008 = 100)
Austra
lia
Slovak
Rep
ublic
Denmark
Irelan
d
Portug
al
Finlan
d
New Ze
aland
Netherl
ands
Japa
n
United
Kingdo
m
Canad
a
Czech
Rep
ublic
Sloven
ia
Mexico
Spain
Austri
a
OECD av
erag
e
Norway
Korea
Franc
e
Switzerl
and
Sweden
Eston
ia
Belgium Isr
ael
United
States
Russia
n Fed
eratio
n
Poland
Icelan
dIta
ly
Hunga
ry
Change in public spending on education as a percentage of GDP Change in GDP
EDUCATION AT A GLANCE 2013: HIGHLIGHTS © OECD 2013 49
4. PAYING FOR EDUCATION
What share of public spending goes to education?
• Education accounts for 13% of total public spending, on averagein OECD countries, ranging from less than 10% in theCzech Republic, Hungary, Ireland, Italy and Japan, to more than20% in Mexico and New Zealand.
• The proportion of public spending devoted to educationincreased slightly between 1995 and 2010 in most countries.
• Public spending on education grew faster than public spendingon all other services between 2008 and 2010 in almost half ofthe OECD countries, although there was no clear global trend.
• Most OECD countries spend more than twice as much on pri-mary, secondary and post-secondary non-tertiary education ason tertiary education.
Significance
Public spending on education, as a percentage of total pub-lic spending, indicates the importance placed on educationrelative to that of other areas of public spending, such ashealth care, social security and national security. Since thesecond half of the 1990s, most OECD countries have soughtto consolidate public budgets, and education has had tocompete with other sectors for public financial support.More recently, the economic crisis has put further pressureon public budgets to the extent that fewer public resourcesmay be allocated to education. This section evaluates thechange in spending on education both in absolute termsand relative to changes in the size of public budgets.
Findings
Education is a priority for governments. The proportion ofpublic spending devoted to education increased between1995 and 2005 in most countries with available data. OnlyCanada, France, Israel, Japan, New Zealand and Portugalshow a different pattern.
The share of public spending devoted to educationdecreased in around two-thirds of countries between 2005and 2010, as total public spending grew faster than spend-ing on education.
While there was no clear global trend in how the proportionof public spending on education evolved during the eco-nomic crisis, in 14 out of the 30 countries with available data,public spending on education grew at a faster rate than pub-lic spending on all other services between 2008 and 2010.
Public funding is more decentralised at the primary,secondary and post-secondary non-tertiary levels than atthe tertiary level. On average, more than 50% of the initialpublic funds for these levels of education comes from thecentral government in OECD countries, compared with 87%for tertiary education.
At the primary, secondary and post-secondary non-tertiarylevels of education, only New Zealand has an entirely cen-tralised public funding system, while nine countries (Chile,Estonia, Hungary, Iceland, Ireland, the Netherlands, NewZealand, Norway and the Slovak Republic) have an entirelycentralised funding system for tertiary education.
Trends
Over the past 15 years (1995-2010), public spending on alllevels of education has increased slightly in two-thirds ofcountries with available data. But in the period between2005 and 2010, public spending on education as a percent-age of total public spending decreased in just under two-thirds of countries with available data. The decrease wasespecially substantial (1 percentage point or more) inHungary, Iceland, Ireland, Mexico, Norway, Poland, Slove-nia and the United States.
Definitions
Data refer to the financial year 2010 and are based on theUOE data collection on education statistics administered bythe OECD in 2012. Total public expenditure, also referred toas total public spending, corresponds to the non-repayablecurrent and capital expenditure of all levels of government:central, regional and local. It includes direct public spend-ing on educational institutions as well as public support tohouseholds (e.g. scholarships and loans to students fortuition fees and student living costs) and to other privateentities for education (e.g. subsidies to companies or labourorganisations that operate apprenticeship programmes).
Information on data for Israel:http://dx.doi.org/10.1787/888932315602.
Going further
For additional material, notes and a full explanationof sourcing and methodologies, see Education at aGlance 2013 (Indicator B4).
Areas covered include:
– Distribution of total public spending on education.
– Initial sources of public educational funds andfinal purchasers of educational resources by levelof government (online).
EDUCATION AT A GLANCE 2013: HIGHLIGHTS © OECD 201350

4. PAYING FOR EDUCATION
What share of public spending goes to education?
Figure 4.5. Trends in public spending on education as a percentage of total public spending (2005, 2010)
This figure shows total public spending on education (which includes spending on educational institutions and spending such as publicsubsidies to households), as a percentage of total public spending, and how it has evolved.
Source: OECD (2013), Education at a Glance 2013, Chart B4.1, available at http://dx.doi.org/10.1787/888932847032.
Figure 4.6. Total public spending as a percentage of GDP (2000, 2010)
This figure shows the size of public spending as a percentage of the overall economy. These data provide context for examining theproportion of public spending that is devoted to education.
Source: OECD (2013), Education at a Glance 2013, Chart B4.2, available at http://dx.doi.org/10.1787/888932847051.
0
25
2010 2005
5
10
15
20
% of total public expenditure
Mexico
New Ze
aland
Brazil
Chile
Korea
Switzerl
and
Denmark
Austra
lia
Norway
Icelan
d
Eston
iaIsr
ael
Sweden
Canad
a
OECD av
erag
e
United
States
Belgium
Finlan
d
United
Kingdo
m
Netherl
ands
Poland
Sloven
ia
Austri
a
Portug
alSpa
in
Slovak
Rep
ublic
Russia
n Fed
eratio
n
Franc
e
Hunga
ry
Irelan
d
Czech
Rep
ublic
Japa
nIta
ly
0
70
10
20
30
40
50
60
2010 2000
New Ze
aland
% of GDP
Irelan
d
Norway
Denmark
Franc
e
Finlan
d
Belgium
Austri
a
Sweden
United
Kingdo
m
Icelan
d
Portug
al
Netherl
ands Ita
ly
Sloven
ia
Hunga
rySpa
in
Poland
Czech
Rep
ublic
Israe
l
United
States
Japa
n
Eston
ia
Canad
a
Slovak
Rep
ublic
Russia
n Fed
eratio
n
Austra
lia
Switzerl
and
Brazil
Korea
Mexico Chil
e
EDUCATION AT A GLANCE 2013: HIGHLIGHTS © OECD 2013 51
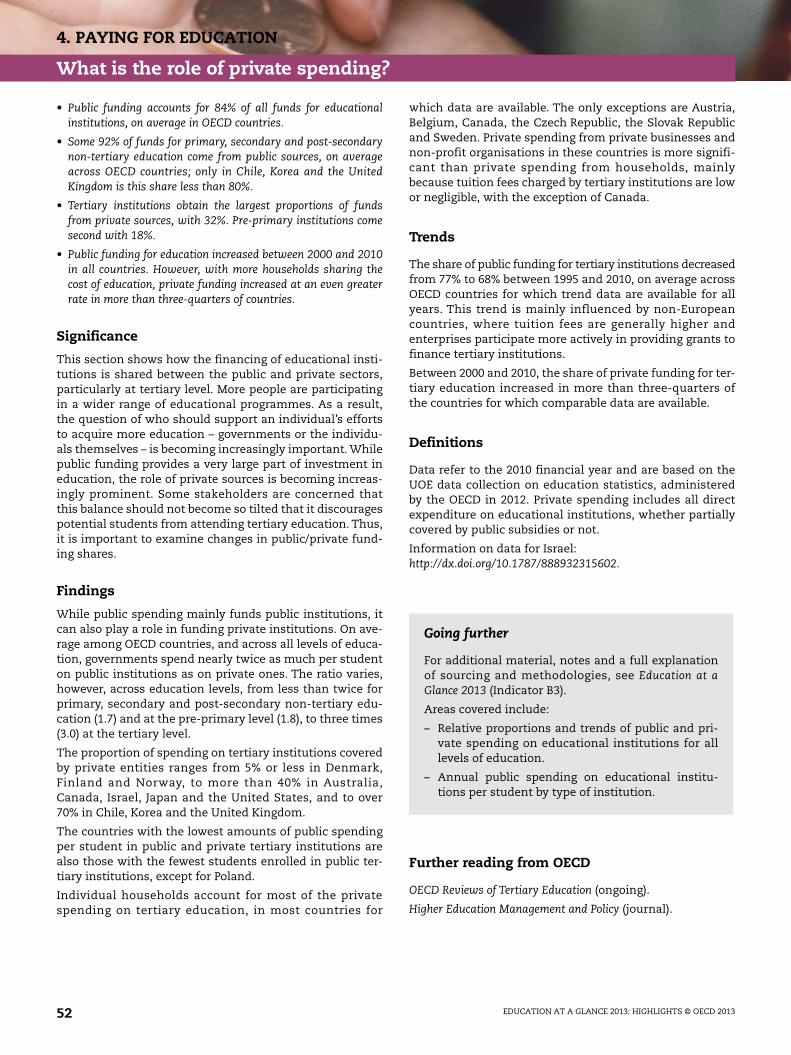
4. PAYING FOR EDUCATION
What is the role of private spending?
• Public funding accounts for 84% of all funds for educationalinstitutions, on average in OECD countries.
• Some 92% of funds for primary, secondary and post-secondarynon-tertiary education come from public sources, on averageacross OECD countries; only in Chile, Korea and the UnitedKingdom is this share less than 80%.
• Tertiary institutions obtain the largest proportions of fundsfrom private sources, with 32%. Pre-primary institutions comesecond with 18%.
• Public funding for education increased between 2000 and 2010in all countries. However, with more households sharing thecost of education, private funding increased at an even greaterrate in more than three-quarters of countries.
Significance
This section shows how the financing of educational insti-tutions is shared between the public and private sectors,particularly at tertiary level. More people are participatingin a wider range of educational programmes. As a result,the question of who should support an individual’s effortsto acquire more education – governments or the individu-als themselves – is becoming increasingly important. Whilepublic funding provides a very large part of investment ineducation, the role of private sources is becoming increas-ingly prominent. Some stakeholders are concerned thatthis balance should not become so tilted that it discouragespotential students from attending tertiary education. Thus,it is important to examine changes in public/private fund-ing shares.
Findings
While public spending mainly funds public institutions, itcan also play a role in funding private institutions. On ave-rage among OECD countries, and across all levels of educa-tion, governments spend nearly twice as much per studenton public institutions as on private ones. The ratio varies,however, across education levels, from less than twice forprimary, secondary and post-secondary non-tertiary edu-cation (1.7) and at the pre-primary level (1.8), to three times(3.0) at the tertiary level.
The proportion of spending on tertiary institutions coveredby private entities ranges from 5% or less in Denmark,Finland and Norway, to more than 40% in Australia,Canada, Israel, Japan and the United States, and to over70% in Chile, Korea and the United Kingdom.
The countries with the lowest amounts of public spendingper student in public and private tertiary institutions arealso those with the fewest students enrolled in public ter-tiary institutions, except for Poland.
Individual households account for most of the privatespending on tertiary education, in most countries for
which data are available. The only exceptions are Austria,Belgium, Canada, the Czech Republic, the Slovak Republicand Sweden. Private spending from private businesses andnon-profit organisations in these countries is more signifi-cant than private spending from households, mainlybecause tuition fees charged by tertiary institutions are lowor negligible, with the exception of Canada.
Trends
The share of public funding for tertiary institutions decreasedfrom 77% to 68% between 1995 and 2010, on average acrossOECD countries for which trend data are available for allyears. This trend is mainly influenced by non-Europeancountries, where tuition fees are generally higher andenterprises participate more actively in providing grants tofinance tertiary institutions.
Between 2000 and 2010, the share of private funding for ter-tiary education increased in more than three-quarters ofthe countries for which comparable data are available.
Definitions
Data refer to the 2010 financial year and are based on theUOE data collection on education statistics, administeredby the OECD in 2012. Private spending includes all directexpenditure on educational institutions, whether partiallycovered by public subsidies or not.
Information on data for Israel:http://dx.doi.org/10.1787/888932315602.
Further reading from OECD
OECD Reviews of Tertiary Education (ongoing).
Higher Education Management and Policy (journal).
Going further
For additional material, notes and a full explanationof sourcing and methodologies, see Education at aGlance 2013 (Indicator B3).
Areas covered include:
– Relative proportions and trends of public and pri-vate spending on educational institutions for alllevels of education.
– Annual public spending on educational institu-tions per student by type of institution.
EDUCATION AT A GLANCE 2013: HIGHLIGHTS © OECD 201352
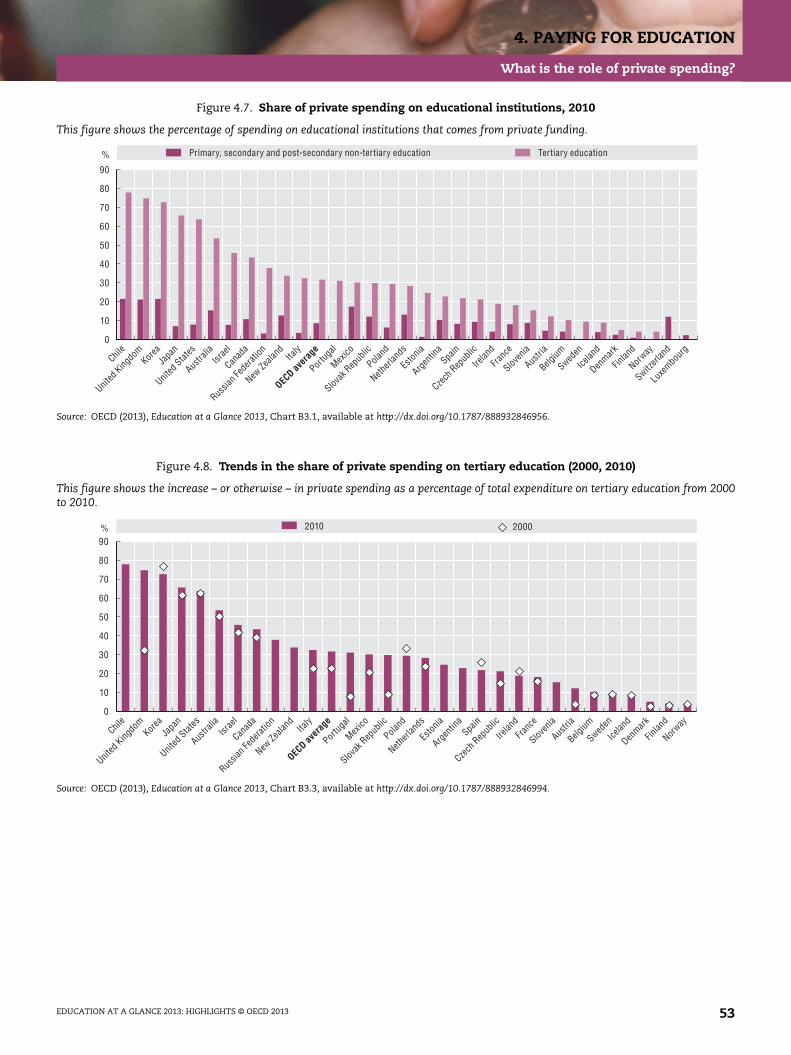
4. PAYING FOR EDUCATION
What is the role of private spending?
Figure 4.7. Share of private spending on educational institutions, 2010
This figure shows the percentage of spending on educational institutions that comes from private funding.
Source: OECD (2013), Education at a Glance 2013, Chart B3.1, available at http://dx.doi.org/10.1787/888932846956.
Figure 4.8. Trends in the share of private spending on tertiary education (2000, 2010)
This figure shows the increase – or otherwise – in private spending as a percentage of total expenditure on tertiary education from 2000to 2010.
Source: OECD (2013), Education at a Glance 2013, Chart B3.3, available at http://dx.doi.org/10.1787/888932846994.
0
90
%
10
20
30
40
50
60
70
80
Primary, secondary and post-secondary non-tertiary education Tertiary education
Chile
United
Kingdo
mKor
eaJa
pan
United
States
Austra
liaIsr
ael
Canad
a
Russia
n Fed
eratio
n
New Ze
aland Ita
ly
OECD av
erag
e
Portug
al
Mexico
Slovak
Rep
ublic
Poland
Netherl
ands
Eston
ia
Argen
tina
Spain
Czech
Rep
ublic
Irelan
d
Franc
e
Sloven
ia
Austri
a
Belgium
Sweden
Icelan
d
Denmark
Finlan
d
Norway
Switzerl
and
Luxe
mbour
g
0
90
2010 2000
10
20
30
40
50
60
70
80
%
Chile
United
Kingdo
mKor
eaJa
pan
United
States
Austra
liaIsr
ael
Canad
a
Russia
n Fed
eratio
n
New Ze
aland Ita
ly
OECD av
erag
e
Portug
al
Mexico
Slovak
Rep
ublic
Poland
Netherl
ands
Eston
ia
Argen
tina
Spain
Czech
Rep
ublic
Irelan
d
Franc
e
Sloven
ia
Austri
a
Belgium
Sweden
Icelan
d
Denmark
Finlan
d
Norway
EDUCATION AT A GLANCE 2013: HIGHLIGHTS © OECD 2013 53
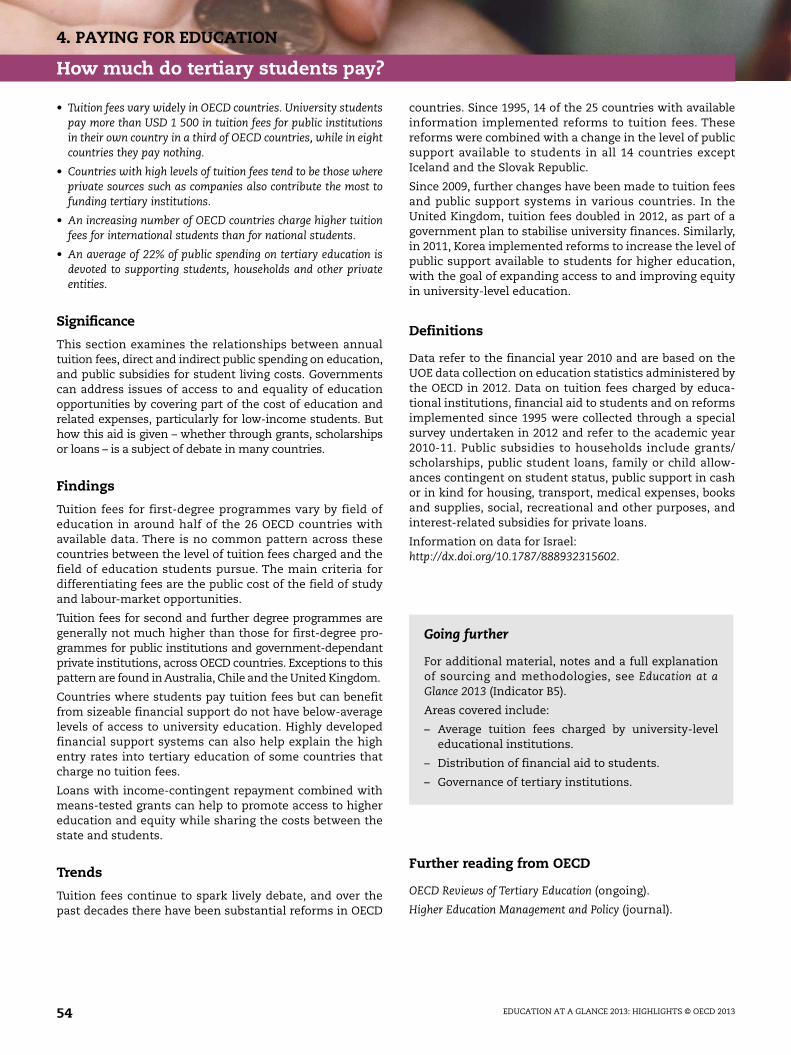
4. PAYING FOR EDUCATION
How much do tertiary students pay?
• Tuition fees vary widely in OECD countries. University studentspay more than USD 1 500 in tuition fees for public institutionsin their own country in a third of OECD countries, while in eightcountries they pay nothing.
• Countries with high levels of tuition fees tend to be those whereprivate sources such as companies also contribute the most tofunding tertiary institutions.
• An increasing number of OECD countries charge higher tuitionfees for international students than for national students.
• An average of 22% of public spending on tertiary education isdevoted to supporting students, households and other privateentities.
Significance
This section examines the relationships between annualtuition fees, direct and indirect public spending on education,and public subsidies for student living costs. Governmentscan address issues of access to and equality of educationopportunities by covering part of the cost of education andrelated expenses, particularly for low-income students. Buthow this aid is given – whether through grants, scholarshipsor loans – is a subject of debate in many countries.
Findings
Tuition fees for first-degree programmes vary by field ofeducation in around half of the 26 OECD countries withavailable data. There is no common pattern across thesecountries between the level of tuition fees charged and thefield of education students pursue. The main criteria fordifferentiating fees are the public cost of the field of studyand labour-market opportunities.
Tuition fees for second and further degree programmes aregenerally not much higher than those for first-degree pro-grammes for public institutions and government-dependantprivate institutions, across OECD countries. Exceptions to thispattern are found in Australia, Chile and the United Kingdom.
Countries where students pay tuition fees but can benefitfrom sizeable financial support do not have below-averagelevels of access to university education. Highly developedfinancial support systems can also help explain the highentry rates into tertiary education of some countries thatcharge no tuition fees.
Loans with income-contingent repayment combined withmeans-tested grants can help to promote access to highereducation and equity while sharing the costs between thestate and students.
Trends
Tuition fees continue to spark lively debate, and over thepast decades there have been substantial reforms in OECD
countries. Since 1995, 14 of the 25 countries with availableinformation implemented reforms to tuition fees. Thesereforms were combined with a change in the level of publicsupport available to students in all 14 countries exceptIceland and the Slovak Republic.
Since 2009, further changes have been made to tuition feesand public support systems in various countries. In theUnited Kingdom, tuition fees doubled in 2012, as part of agovernment plan to stabilise university finances. Similarly,in 2011, Korea implemented reforms to increase the level ofpublic support available to students for higher education,with the goal of expanding access to and improving equityin university-level education.
Definitions
Data refer to the financial year 2010 and are based on theUOE data collection on education statistics administered bythe OECD in 2012. Data on tuition fees charged by educa-tional institutions, financial aid to students and on reformsimplemented since 1995 were collected through a specialsurvey undertaken in 2012 and refer to the academic year2010-11. Public subsidies to households include grants/scholarships, public student loans, family or child allow-ances contingent on student status, public support in cashor in kind for housing, transport, medical expenses, booksand supplies, social, recreational and other purposes, andinterest-related subsidies for private loans.
Information on data for Israel:http://dx.doi.org/10.1787/888932315602.
Further reading from OECD
OECD Reviews of Tertiary Education (ongoing).
Higher Education Management and Policy (journal).
Going further
For additional material, notes and a full explanationof sourcing and methodologies, see Education at aGlance 2013 (Indicator B5).
Areas covered include:
– Average tuition fees charged by university-leveleducational institutions.
– Distribution of financial aid to students.
– Governance of tertiary institutions.
EDUCATION AT A GLANCE 2013: HIGHLIGHTS © OECD 201354
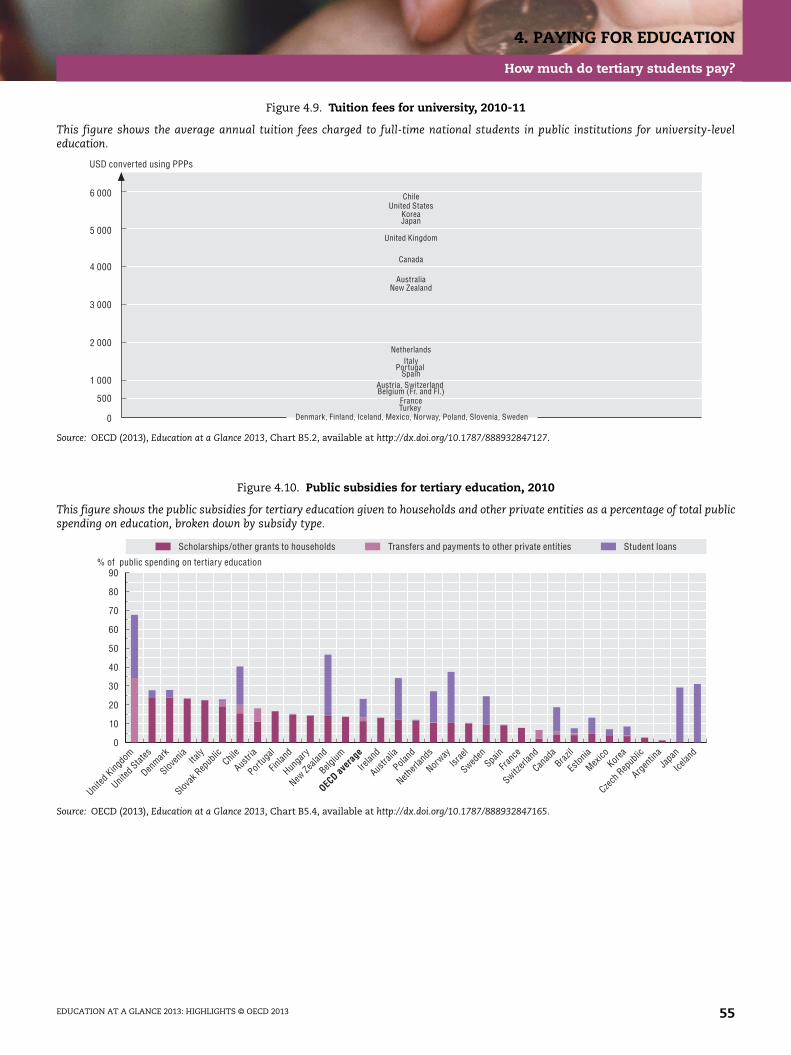
4. PAYING FOR EDUCATION
How much do tertiary students pay?
Figure 4.9. Tuition fees for university, 2010-11
This figure shows the average annual tuition fees charged to full-time national students in public institutions for university-leveleducation.
Source: OECD (2013), Education at a Glance 2013, Chart B5.2, available at http://dx.doi.org/10.1787/888932847127.
Figure 4.10. Public subsidies for tertiary education, 2010
This figure shows the public subsidies for tertiary education given to households and other private entities as a percentage of total publicspending on education, broken down by subsidy type.
Source: OECD (2013), Education at a Glance 2013, Chart B5.4, available at http://dx.doi.org/10.1787/888932847165.
0
500
1 000
2 000
3 000
4 000
5 000
6 000
Spain
Denmark, Finland, Iceland, Mexico, Norway, Poland, Slovenia, Sweden
United Kingdom
Canada
Netherlands
United States
Belgium (Fr. and Fl.)France
AustraliaNew Zealand
Portugal
Austria, Switzerland
KoreaJapan
Chile
Italy
Turkey
USD converted using PPPs
0
90
10
20
30
40
50
60
70
80
% of public spending on tertiary education
Scholarships/other grants to households Transfers and payments to other private entities Student loans
United
Kingdo
m
United
States
Denmark
Sloven
iaIta
ly
Slovak
Rep
ublic
Chile
Austri
a
Portug
al
Finlan
d
Hunga
ry
New Ze
aland
Belgium
OECD av
erag
e
Irelan
d
Austra
lia
Poland
Netherl
ands
Norway
Israe
l
Sweden
Spain
Franc
e
Switzerl
and
Canad
aBraz
il
Eston
ia
Mexico
Korea
Czech
Rep
ublic
Argen
tinaJa
pan
Icelan
d
EDUCATION AT A GLANCE 2013: HIGHLIGHTS © OECD 2013 55

4. PAYING FOR EDUCATION
How much do teachers cost?
• Four factors influence the cost of teachers per student: howmany hours students spend in the classroom, teachers’ teach-ing hours, estimated class size and teachers’ salaries.
• The cost of teachers per student varies significantly betweencountries; in most countries, the salary cost of teachers per stu-dent increases with the level of education taught.
• The cost of teachers per student increased substantially in mostcountries at the primary and lower secondary levels between2005 and 2011. On average, it increased by more than 10%:from USD 2 398 to USD 2 627 at the primary level, and fromUSD 3 473 to USD 3 818 at the lower secondary level.
Significance
The relationship between resources devoted to educationand student learning outcomes has been the focus of mucheducation policy debate in recent years, as governmentsseek to ensure value for money in public spending whilesatisfying the educational needs of society and the economy.Indeed, various reforms implemented during the last decadein primary and secondary education have had importantimpacts in this area. Consequently, there is considerableinterest in international comparisons of how various schoolsystems allocate resources. Since teachers account for amajor part of spending, their costs are of particular interest.
Findings
Similar levels of spending among countries can mask avariety of contrasting policy choices. For example, at theupper secondary level of education, Germany and Portugalshowed similar levels of salary costs of teachers per stu-dent in 2011, both higher than average. In Germany, thismainly results from significantly higher salaries, while inPortugal, this results mostly from below-average class size.
Teachers’ salaries are most often the main driver of the dif-ference from the average cost of teachers per student ateach level of education. Estimated class size is the secondmain driver of the difference at each level. Naturally, teach-ers’ salaries vary according to countries’ relative level ofwealth. The impact of teachers’ salaries on the average costof teachers per student is weaker when differences incountries’ wealth are accounted for.
There are large differences in the cost of teachers per stu-dent between education levels. The average salary cost ofteachers per student in 2011 was USD 2 757 per primary stu-dent, USD 3 456 per lower secondary student and USD 3 420
per upper secondary student. However, in some countries,mainly Finland, the Netherlands and Slovenia, the salarycost of teachers is lower at the upper secondary level than atthe lower secondary level.
Trends
Most OECD countries simultaneously increased teachers’salaries and decreased estimated class sizes at the primaryand lower secondary levels of education, between 2005 and2011. During this period, teachers’ salaries increased, onaverage, by more than 14% at the primary level and bynearly 11% at the lower secondary level, while estimatedclass size decreased, by 18% at the primary level and by 6%at the lower secondary level, in countries with availabledata for both years. These changes resulted in an increasein the salary cost of teachers. Hungary and Italy are theonly two countries where the salary cost of teachers perstudent decreased significantly between 2005 and 2011 atboth primary and lower secondary levels.
Definitions
Data referring to the 2011 school year are based on the UOEdata collection on education statistics, as well as on theSurvey on Teachers and the Curriculum, which were bothadministered by the OECD in 2012. Data referring to the2000 and 2005 school years are based on the UOE data col-lection on education statistics, and on the Survey on Teach-ers and the Curriculum, which were both administered bythe OECD and published in the 2013 edition (for trend dataon teaching time and salary of teachers) and 2002 and 2007editions (ratio of student to teaching staff and instructiontime) of Education at a Glance.
Going further
For additional material, notes and a full explanationof sourcing and methodologies, see Education at aGlance 2013 (Indicator B7).
Areas covered include:
– Salary cost per student by level of education.
– Salary cost per student as a percentage of GDP percapita.
EDUCATION AT A GLANCE 2013: HIGHLIGHTS © OECD 201356
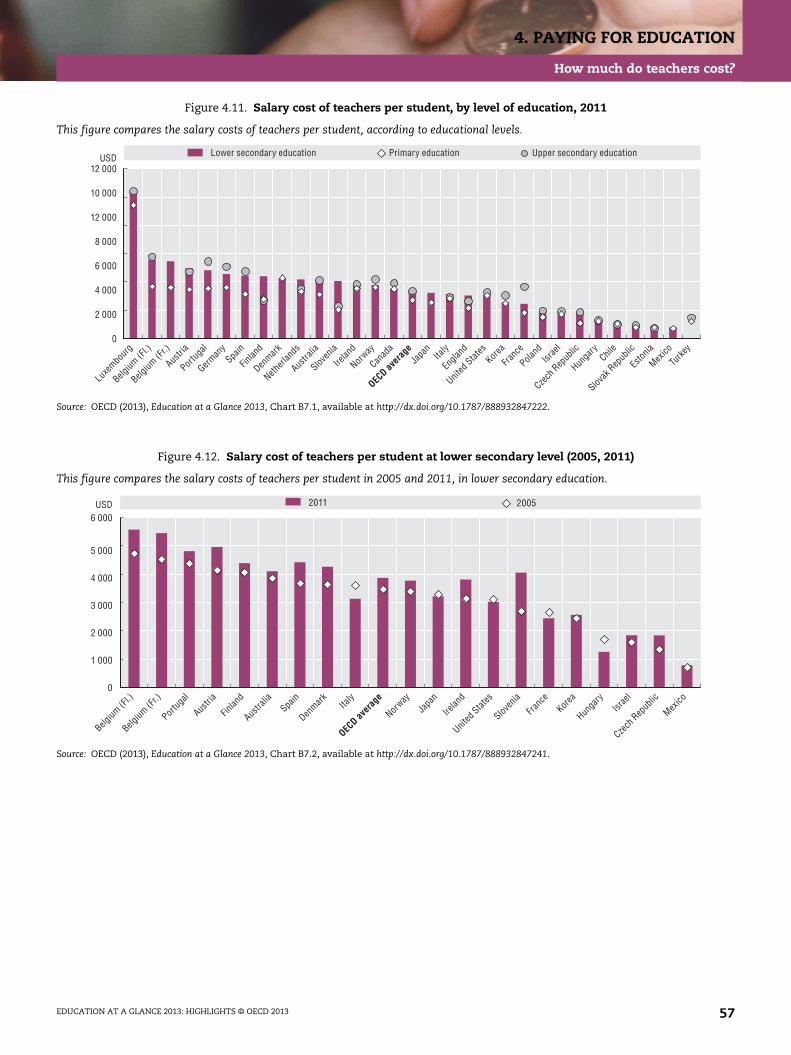
4. PAYING FOR EDUCATION
How much do teachers cost?
Figure 4.11. Salary cost of teachers per student, by level of education, 2011
This figure compares the salary costs of teachers per student, according to educational levels.
Source: OECD (2013), Education at a Glance 2013, Chart B7.1, available at http://dx.doi.org/10.1787/888932847222.
Figure 4.12. Salary cost of teachers per student at lower secondary level (2005, 2011)
This figure compares the salary costs of teachers per student in 2005 and 2011, in lower secondary education.
Source: OECD (2013), Education at a Glance 2013, Chart B7.2, available at http://dx.doi.org/10.1787/888932847241.
0
12 000
2 000
4 000
6 000
8 000
12 000
10 000
USD Lower secondary education
Luxe
mbourg
Belgium
(Fl.)
Belgium
(Fr.)
Austri
a
Portug
al
German
ySpa
in
Finlan
d
Denmark
Netherl
ands
Austra
lia
Sloven
ia
Irelan
d
Norway
Canad
a
OECD av
erag
eJa
pan
Italy
Engla
nd
United
States
Korea
Franc
e
Poland
Israe
l
Czech
Rep
ublic
Hunga
ryChil
e
Slovak
Rep
ublic
Eston
ia
Mexico
Turke
y
Primary education Upper secondary education
0
6 000
2011 2005USD
1 000
2 000
3 000
4 000
5 000
Belgium
(Fl.)
Belgium
(Fr.)
Portug
al
Austri
a
Finlan
d
Austra
liaSpa
in
Denmark Ita
ly
OECD av
erag
e
Norway
Japa
n
Irelan
d
United
States
Sloven
ia
Franc
eKor
ea
Hunga
ryIsr
ael
Czech
Rep
ublic
Mexico
EDUCATION AT A GLANCE 2013: HIGHLIGHTS © OECD 2013 57

EDUCATION AT A GLANCE 2013: HIGHLIG
5. THE SCHOOL ENVIRONMENT
How long do students spend in the classroom?
How many students are in each classroom?
How much are teachers paid?
How much time do teachers spend teaching?
HTS © OECD 2013 59
5. THE SCHOOL ENVIRONMENT
How long do students spend in the classroom?
• It is expected that students in OECD countries will receive anaverage of 7 751 hours of instruction during their primary andlower secondary education, and most of that instruction time iscompulsory.
• Reading, writing and literature, mathematics and scienceaccount for 51% of compulsory instruction time for primaryschool students, on average in OECD countries, and 41% of com-pulsory instruction time for lower secondary school students.
• In OECD countries, an average of 6% of compulsory instructiontime for primary students and 7% for lower secondary studentsis devoted to the flexible part of the curriculum.
Significance
This section examines the amount of time students spendin formal education during their primary and lower sec-ondary education. The choices that countries make abouthow much time should be devoted to education and whichsubjects should be compulsory reflect national and/orregional education priorities. Since a large part of publicinvestment in education goes to instruction time in formalclassroom settings, the length of time students spend inschool is an important factor in determining the amount offunding that should be devoted to education.
Findings
Compulsory instruction time is dedicated to teaching thecompulsory curriculum. In OECD countries, primary stu-dents receive an average of 802 hours of instruction peryear, of which 791 hours are compulsory. Lower secondarystudents receive an average of 122 more hours of instruc-tion per year than primary students, of which 116 hours arecompulsory.
The proportion of the compulsory curriculum that isdevoted to reading, writing and literature varies widelyacross OECD and G20 countries. It ranges from 15% inIndonesia to 38% in Hungary for primary students; forlower secondary students, it ranges from 11% in Japan andPortugal to 24% in Ireland.
The largest portion of the curriculum for primary students,26%, is devoted to reading and writing in all reporting OECDcountries and in some G20 countries. In most OECD andG20 countries the second largest share of time, 17%, isspent studying mathematics, followed by the arts, with11%. Together with physical education (9%), science (7%)and social studies (7%), these six study areas form themajor part of the curriculum for this education level.
For lower secondary school students in around one-third ofthe countries with available data, the proportion of com-pulsory instruction time devoted to reading, writing and lit-erature is also the largest, when compared with other fieldsof instruction; but in 9 countries, students spend the larg-est proportion of the compulsory core curriculum studyingmodern foreign languages. In Luxembourg and Denmark,lower secondary students spend more than 20% of compul-sory instruction time studying modern foreign languages.
On average among OECD countries, the flexible part of thecurriculum accounts for some 6% of compulsory instruc-tion time for primary students and 7% for lower secondarystudents. While the Czech Republic and the Netherlandsallow complete flexibility within the compulsory curricu-lum at the primary and lower secondary levels, in Greece,Hungary, Luxembourg and Mexico, the flexible part of thecurriculum is negligible at both levels of education.
Definitions
Data on instruction time distinguish between “compul-sory” and “intended” instruction time. Compulsory instruc-tion time refers to the minimum amount of instructionthat schools are expected to provide and students mustattend. Intended instruction time is an estimate of thenumber of hours per year during which students are taughtboth compulsory and non-compulsory parts of the curricu-lum. It does not, however, indicate the quality of the educa-tion provided nor the level or quality of the human andmaterial resources involved. Data on instruction time arefrom the 2012 OECD-INES Survey on Teachers and theCurriculum and refer to the 2010-11 school year.
Information on data for Israel:http://dx.doi.org/10.1787/888932315602.
Going further
For additional material, notes and a full explanationof sourcing and methodologies, see Education at aGlance 2013 (Indicator D1).
Areas covered include:
– Compulsory and intended instruction time in pub-lic institutions.
– Instruction time per subject.
EDUCATION AT A GLANCE 2013: HIGHLIGHTS © OECD 201360
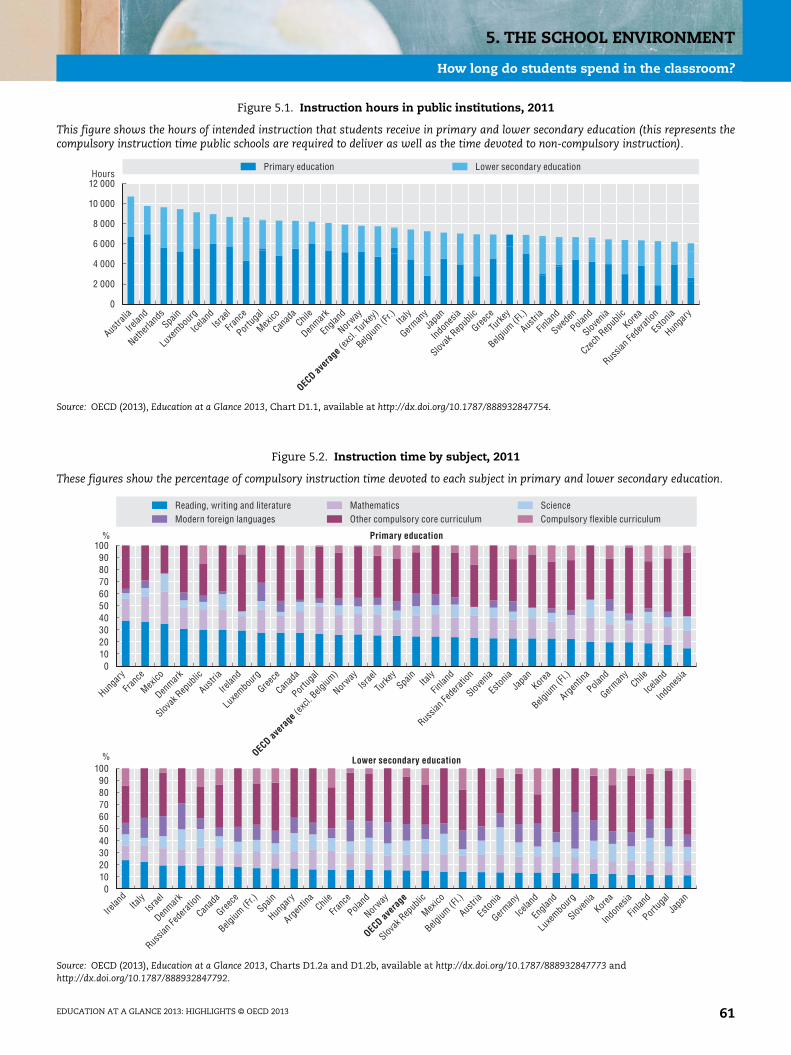
5. THE SCHOOL ENVIRONMENT
How long do students spend in the classroom?
Figure 5.1. Instruction hours in public institutions, 2011
This figure shows the hours of intended instruction that students receive in primary and lower secondary education (this represents thecompulsory instruction time public schools are required to deliver as well as the time devoted to non-compulsory instruction).
Source: OECD (2013), Education at a Glance 2013, Chart D1.1, available at http://dx.doi.org/10.1787/888932847754.
Figure 5.2. Instruction time by subject, 2011
These figures show the percentage of compulsory instruction time devoted to each subject in primary and lower secondary education.
Source: OECD (2013), Education at a Glance 2013, Charts D1.2a and D1.2b, available at http://dx.doi.org/10.1787/888932847773 andhttp://dx.doi.org/10.1787/888932847792.
0
12 000
2 000
4 000
6 000
8 000
10 000
Primary education Lower secondary education
Austra
lia
Irelan
d
Netherl
ands
Spain
Luxe
mbour
g
Icelan
dIsr
ael
Franc
e
Portug
al
Mexico
Canad
aChil
e
Denmark
Engla
nd
Norway
OECD av
erag
e (ex
cl. Tu
rkey)
Belgium
(Fr.)
Italy
German
yJa
pan
Indon
esia
Slovak
Rep
ublic
Greece
Turke
y
Belgium
(Fl.)
Austri
a
Finlan
d
Sweden
Poland
Sloven
ia
Czech
Rep
ublic
Korea
Russia
n Fed
eratio
n
Eston
ia
Hunga
ry
Hours
%
0102030405060708090
100
%
0102030405060708090
100
Primary education
Lower secondary education
Modern foreign languagesReading, writing and literature
Compulsory flexible curriculumScience
Other compulsory core curriculumMathematics
Hunga
ry
Franc
e
Mexico
Denmark
Slovak
Rep
ublic
Austri
a
Irelan
d
Luxe
mbour
g
Greece
Canad
a
Portug
al
OECD av
erag
e (ex
cl. Belg
ium)
Norway
Israe
l
Turke
ySpa
inIta
ly
Finlan
d
Russia
n Fed
eratio
n
Sloven
ia
Eston
iaJa
pan
Korea
Belgium
(Fl.)
Argen
tina
Poland
German
yChil
e
Icelan
d
Indon
esia
Irelan
dIta
lyIsr
ael
Denmark
Russia
n Fed
eratio
n
Canad
a
Greece
Belgium
(Fr.)
Spain
Hunga
ry
Argen
tina
Chile
Franc
e
Poland
Norway
OECD av
erag
e
Slovak
Rep
ublic
Mexico
Belgium
(Fl.)
Austri
a
Eston
ia
German
y
Icelan
d
Engla
nd
Luxe
mbourg
Sloven
iaKor
ea
Indon
esia
Finlan
d
Portug
al
Japa
n
EDUCATION AT A GLANCE 2013: HIGHLIGHTS © OECD 2013 61
5. THE SCHOOL ENVIRONMENT
How many students are in each classroom?
• There are about 21 students per class at primary level in OECDcountries, on average, but numbers are larger in other G20countries.
• The number of students per class increases by two or more stu-dents between primary and lower secondary education, onaverage in OECD countries.
• The average class size at primary level decreased between 2000and 2011, especially in countries that had relatively largeclasses, such as Korea and Turkey.
Significance
This section examines the number of students per class atthe primary and lower secondary levels, in both public andprivate institutions. Class size is a hotly debated topic inmany OECD countries and has a considerable impact onthe level of current spending on education. While smallerclasses are often perceived as enabling a higher quality ofeducation, particularly among pupils from disadvantagedbackgrounds, overall evidence of the effect of differences inclass size on student performance is weak.
Findings
The average primary school class in OECD and G20 countriesnumbers around 21 pupils, ranging from fewer than 16pupils in Luxembourg to more than 30 in Chile and China.The number of students per class tends to increase betweenprimary and lower secondary education. In lower secondaryeducation, the average class size in all countries with avail-able data is more than 23 students, ranging from fewer than20 students in Estonia, Iceland, Luxembourg, the RussianFederation, Slovenia, and the United Kingdom, to 34 stu-dents per class in Korea and almost 53 students in China.
The student-teacher ratio decreases between the primaryand lower secondary levels in 27 of the 30 OECD and G20countries with available data. This decrease in the student-teacher ratio reflects differences in annual instruction timefor students, which tends to increase with the level of edu-cation.
The student-teacher ratio in secondary education isslightly more favourable in private than in public institu-tions, on average across OECD countries. This is most strik-ing in Mexico where, at the secondary level, there arenearly 17 more students per teacher in public than in pri-vate institutions. On average across OECD countries, thereis at most one student more per class in public than in pri-vate institutions at the primary and lower secondary levels.
Class size varies significantly within countries. The differ-ence between the smallest and largest classes is as large as
30 students in Brazil, Iceland, Malaysia, Mexico and Turkey.This may result partly from differences in the size of thecommunity to which the school belongs or from differ-ences between public and private schools.
Trends
From 2000 to 2011, the average class size in countries withavailable data for both years decreased by one student atboth the primary and lower secondary levels, and the rangeof class size among OECD countries narrowed. The slightdecrease in average primary class size can be partlyexplained by reforms on class size during that period. Pri-mary class sizes decreased most notably (by more than fourstudents) in countries that had relatively large class sizes in2000, such as Korea and Turkey. By contrast, class size hasgrown in some countries that had relatively small classesin 2000, most notably Denmark and Iceland.
Definitions
Data refer to the 2010-11 school year, and are based on theUOE data collection on education statistics administered bythe OECD in 2012. Class sizes have been calculated by divid-ing the number of students enrolled by the number ofclasses.
Information on data for Israel:http://dx.doi.org/10.1787/888932315602.
Further reading from OECD
Improving School Leadership (Vol. 1: Policy and Practice) (2008).
Going further
For additional material, notes and a full explanationof sourcing and methodologies, see Education at aGlance 2013 (Indicator D2).
Areas covered include:
– Average class size, by type of institution and levelof education.
– Ratio of students to teaching staff.
– Teaching staff and non-teaching staff employed ineducational institutions.
EDUCATION AT A GLANCE 2013: HIGHLIGHTS © OECD 201362

5. THE SCHOOL ENVIRONMENT
How many students are in each classroom?
Figure 5.3. Trends in average class size in primary education (2000, 2011)
This figure shows the average number of students in primary classes, and whether these numbers have risen or fallen.
Source: OECD (2013), Education at a Glance 2013, Chart D2.1, available at http://dx.doi.org/10.1787/888932851668.
Figure 5.4. Average class size, by level of education, 2011
This figure shows how class sizes differ between primary and lower secondary education.
Source: OECD (2013), Education at a Glance 2013, Chart D2.2, available at http://dx.doi.org/10.1787/888932851687.
0
40
2011 2000
10
20
30
Number of students per classroom
China
ChileJa
pan
Israe
lKor
ea
Turke
y
Indon
esia
Argen
tina
United
Kingdo
mBraz
il
Irelan
d
Austra
lia
Franc
eSpa
in
German
y
Belgium
(Fr.)
Hunga
ry
Portug
al
Denmark
United
States
Czech
Rep
ublic
Mexico
Finlan
dIta
ly
Sloven
ia
Poland
Icelan
d
Austri
a
Slovak
Rep
ublic
Russia
n Fed
eratio
n
Eston
ia
Greece
Luxe
mbour
g
0
60
50
40
Lower secondary education Primary education
10
20
30
Number of students per classroom
ChinaKor
ea
Indon
esia
Japa
nChil
eIsr
aelBraz
il
Argen
tina
Mexico
Franc
e
German
ySpa
in
Austra
lia
OECD av
erag
e
United
States
Portug
al
Poland
Greece Ita
ly
Austri
a
Czech
Rep
ublic
Hunga
ry
Denmark
Slovak
Rep
ublic
Finlan
d
Icelan
d
Luxe
mbour
g
United
Kingdo
m
Sloven
ia
Russia
n Fed
eratio
n
Eston
ia
Turke
y
Irelan
d
Belgium
(Fr.)
EDUCATION AT A GLANCE 2013: HIGHLIGHTS © OECD 2013 63

5. THE SCHOOL ENVIRONMENT
How much are teachers paid?
• Salaries for teachers in OECD countries with at least 15 yearsof experience average USD 36 135 at the pre-primary level,USD 38 136 at the primary level, USD 39 934 at the lower sec-ondary level and USD 41 665 at the upper secondary level.
• Teachers’ salaries at primary-school level represent 82% of aver-age earnings for 25-64 year-olds with a tertiary education, against89% at upper secondary level on average in OECD countries
• Salaries at the top of the scale are, on average, 58% higher thanstarting salaries at pre-primary level and 62% higher at uppersecondary level.
Significance
This section shows the starting, mid-career and maximumstatutory salaries of teachers in public pre-primary, pri-mary and secondary education. Since teachers’ salaries arethe largest single cost in education, teacher compensationis a critical consideration for policy makers seeking tomaintain both the quality of teaching and a balanced edu-cation budget.
Findings
In most OECD and other G20 countries, teachers’ salariesrise with the level of education they teach. For example, inBelgium, Denmark, Finland, Hungary, Indonesia, Polandand Switzerland, the salary of an upper secondary teacherwith at least 15 years of experience is at least 25% higherthan that of a pre-primary teacher with the same amountof experience.
Salaries at the top of the scale in pre-primary education are,on average, 58% higher than starting salaries. This figurereaches 59% in primary education, 61% in lower secondaryeducation, and 62% in upper secondary education. The dif-ference tends to be greatest when it takes many years toprogress through the scale. In countries where it takes 30years or more to reach the top of the salary scale, salaries atthe top of the scale are on average 78% higher than startingsalaries.
Teachers with maximum qualifications at the top of theirsalary scales earn, on average, USD 47 243 at the pre-primarylevel, USD 49 609 at the primary level, USD 52 697 at thelower secondary level, and USD 53 449 at the upper second-ary level. However, the salary premium for higher qualifica-tions varies. Primary teachers who hold the maximumqualification earn at least 30% more than primary teacherswith similar experience, but who hold the minimum qualifi-cation, in Israel, Mexico, Poland and Slovenia, for example.However, in around 40% of countries there is no difference.
Trends
Teachers’ salaries increased in real terms in most countriesbetween 2000 and 2011. In Denmark, Estonia, Ireland andPortugal, salaries increased at all levels of education by atleast 20%. In the Czech Republic (primary and lower sec-ondary levels) and in Turkey (upper secondary level), sala-ries doubled over the past decade. Notable exceptions areFrance and Japan, where there was a decline in teachers’salaries in real terms during that period.
In some countries, the economic downturn in 2008 also hada direct impact on teachers’ salaries. Teachers’ salariesdecreased, for the first time since 2000, by around 2% at alllevels of education between 2009 and 2011, on averageacross OECD countries with available data.
Definitions
Data are from the 2012 OECD-INES Survey on Teachers andthe Curriculum and refer to the 2010-11 school year. Grossteachers’ salaries were converted using purchasing powerparities (PPPs) for private consumption from the OECDNational Accounts database. Starting salaries refer to theaverage scheduled gross salary per year for a fully qualifiedfull-time teacher, at the beginning of a teaching career.Earnings for workers with tertiary education are averageearnings for full-time, full-year workers aged 25 to 64 withuniversity-level, vocational tertiary or post-tertiary education.
Information on data for Israel:http://dx.doi.org/10.1787/888932315602.
Further reading from OECD
Education Today 2013: The OECD Perspective (2013)
Going further
For additional material, notes and a full explanationof sourcing and methodologies, see Education at aGlance 2013 (Indicator D3).
Areas covered include:
– Teachers’ salaries and trends.
– Additional payments for teachers.
EDUCATION AT A GLANCE 2013: HIGHLIGHTS © OECD 201364
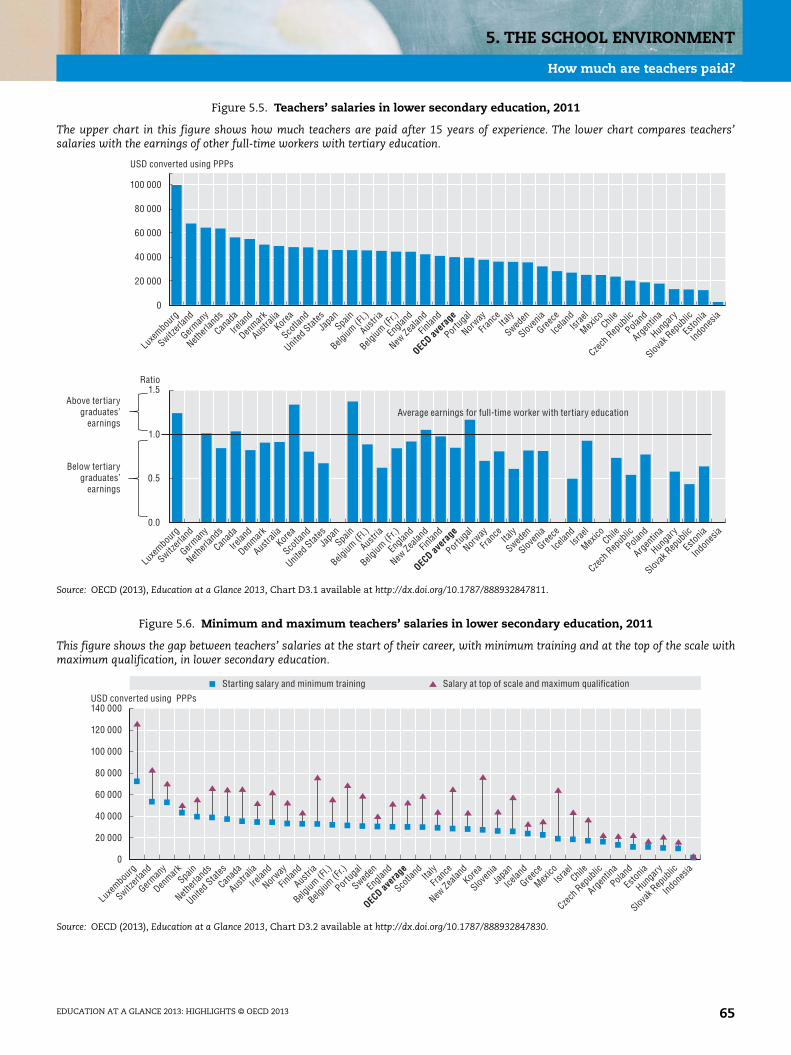
5. THE SCHOOL ENVIRONMENT
How much are teachers paid?
Figure 5.5. Teachers’ salaries in lower secondary education, 2011
The upper chart in this figure shows how much teachers are paid after 15 years of experience. The lower chart compares teachers’salaries with the earnings of other full-time workers with tertiary education.
Source: OECD (2013), Education at a Glance 2013, Chart D3.1 available at http://dx.doi.org/10.1787/888932847811.
Figure 5.6. Minimum and maximum teachers’ salaries in lower secondary education, 2011
This figure shows the gap between teachers’ salaries at the start of their career, with minimum training and at the top of the scale withmaximum qualification, in lower secondary education.
Source: OECD (2013), Education at a Glance 2013, Chart D3.2 available at http://dx.doi.org/10.1787/888932847830.
0
100 000
0.0
0.5
1.0
1.5
20 000
40 000
60 000
80 000
Above tertiarygraduates’
earnings
Below tertiarygraduates’
earnings
Ratio
Luxe
mbourg
Switzerl
and
German
y
Netherl
ands
Canad
a
Irelan
d
Denmark
Austra
liaKor
ea
Scotla
nd
United
StatesJa
panSpa
in
Belgium
(Fl.)
Austri
a
Belgium
(Fr.)
Engla
nd
New Ze
aland
Finlan
d
OECD av
erag
e
Portug
al
Norway
Franc
eIta
ly
Sweden
Sloven
ia
Greece
Icelan
dIsr
ael
Mexico Chil
e
Czech
Rep
ublic
Poland
Argen
tina
Hunga
ry
Slovak
Rep
ublic
Eston
ia
Indon
esia
Average earnings for full-time worker with tertiary education
USD converted using PPPs
0
140 000
20 000
40 000
60 000
80 000
100 000
120 000
Salary at top of scale and maximum qualificationStarting salary and minimum training
USD converted using PPPs
Luxe
mbourg
Switzerl
and
German
y
Denmark
Spain
Netherl
ands
United
States
Canad
a
Austra
lia
Irelan
d
Norway
Finlan
d
Austri
a
Belgium
(Fl.)
Belgium
(Fr.)
Portug
al
Sweden
Engla
nd
OECD av
erag
e
Scotla
nd Italy
Franc
e
New Ze
aland
Korea
Sloven
iaJa
pan
Icelan
d
Greece
Mexico
Israe
lChil
e
Czech
Rep
ublic
Argen
tina
Poland
Eston
ia
Hunga
ry
Slovak
Rep
ublic
Indon
esia
EDUCATION AT A GLANCE 2013: HIGHLIGHTS © OECD 2013 65
5. THE SCHOOL ENVIRONMENT
How much time do teachers spend teaching?
• The number of teaching hours per teacher in public schoolsaverages 994 hours per year in pre-primary education, 790hours per year in primary education, 709 hours in lowersecondary education, and 664 hours in upper secondary education.
• Average teaching time increased or decreased by at least 10%between 2000 and 2011 in primary, lower secondary and/orupper secondary education in almost half of the countries withavailable data.
• The way teachers’ working time is regulated varies signifi-cantly among countries, from hours per year to number of les-sons per week.
Significance
This section examines the time teachers spend teachingand doing non-teaching work, such as preparing lessonsand assessing students. Although working time and teach-ing time only partly determine teachers’ actual workload,they do provide valuable insights into differences in what isrequired of teachers in different countries. Teaching hoursand the extent of non-teaching duties may also affect theattractiveness of teaching as a profession. The amount oftime that teachers spend teaching is also one of the factorsthat affect the financial resources countries need to allo-cate to education.
Findings
The average number of teaching hours in public pre-pri-mary schools in OECD and other G20 countries is 994 hoursper year, but ranges from 450 hours in Indonesia to over1 500 hours in Iceland, Norway and Sweden. Public primaryschool teachers teach an average of 790 hours per year, butteaching time ranges from less than 600 hours in Greeceand the Russian Federation to over 1 000 hours in Chile andthe United States. The number of teaching hours in publiclower secondary schools averages 709 hours per year, butranges from 415 hours in Greece to over 1 000 hours inArgentina, Chile, Mexico and the United States. Teachers inpublic upper secondary schools teach an average of 664hours per year, but this figure ranges from 369 hours inDenmark to 1 448 hours in Argentina.
Pre-primary teachers are required to teach almost 30%more hours than primary school teachers, on average; butthe actual time during which teachers are required to be
working at school, or their total working time, is oftenequivalent for these two levels of education.
Trends
Teaching time varied by at least 10% for at least one level ofeducation between 2000 and 2011 in almost half of thecountries with available data. In most countries with a sig-nificant change, teaching time increased over this period.The number of teaching hours changed dramatically in afew countries: it increased by more than 25% in Portugaland Spain at the secondary level. In contrast, net teachingtime dropped by around 10% between 2000 and 2011 inMexico (lower secondary level), in the Netherlands (lowerand upper secondary levels) and in Scotland (primarylevel).
Definitions
Data are from the 2012 OECD-INES Survey on Teachers andthe Curriculum and refer to the 2010-11 school year. Teach-ing time is defined as the scheduled number of hours peryear that a full-time teacher teaches a group or class of stu-dents as set by policy. Working time refers to the normalworking hours of a full-time teacher and includes timedirectly associated with teaching as well as the hoursdevoted to teaching-related activities, such as preparinglessons, counselling students, correcting assignments andtests, and meeting with parents and other staff.
Information on data for Israel:http://dx.doi.org/10.1787/888932315602.
Going further
For additional material, notes and a full explanationof sourcing and methodologies, see Education at aGlance 2013 (Indicator D4).
Areas covered include:
– Organisation of teachers’ working time.
– Number of teaching hours per year, by level of edu-cation.
EDUCATION AT A GLANCE 2013: HIGHLIGHTS © OECD 201366
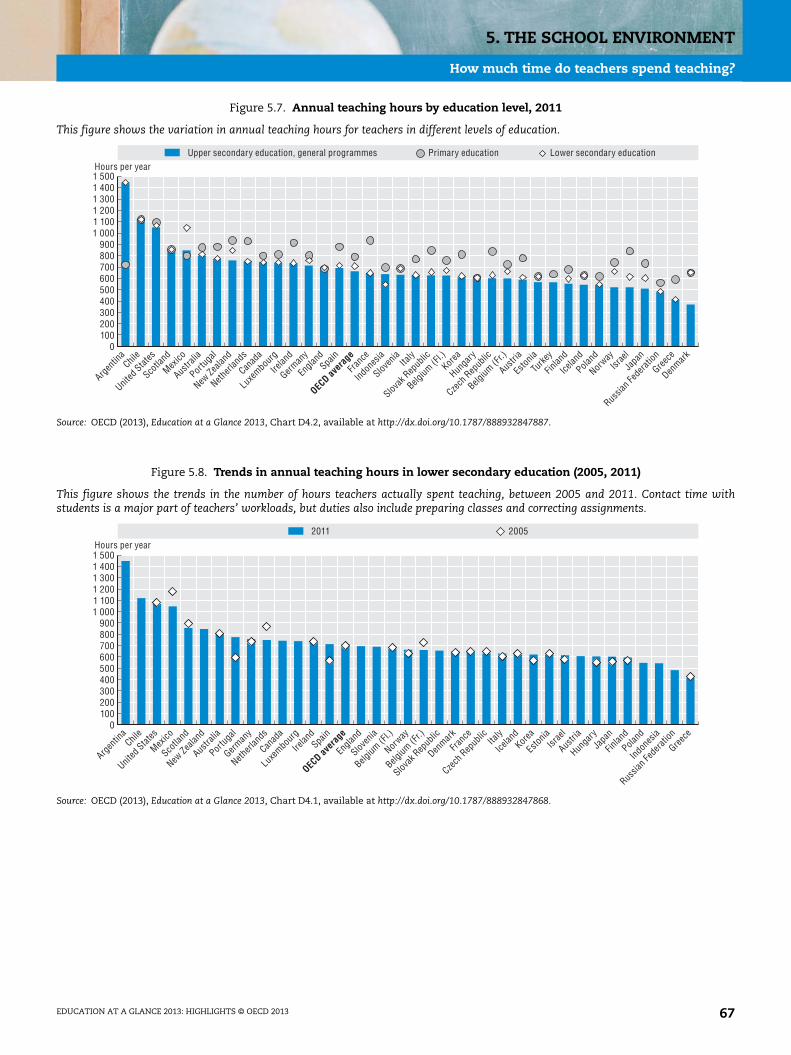
5. THE SCHOOL ENVIRONMENT
How much time do teachers spend teaching?
Figure 5.7. Annual teaching hours by education level, 2011
This figure shows the variation in annual teaching hours for teachers in different levels of education.
Source: OECD (2013), Education at a Glance 2013, Chart D4.2, available at http://dx.doi.org/10.1787/888932847887.
Figure 5.8. Trends in annual teaching hours in lower secondary education (2005, 2011)
This figure shows the trends in the number of hours teachers actually spent teaching, between 2005 and 2011. Contact time withstudents is a major part of teachers’ workloads, but duties also include preparing classes and correcting assignments.
Source: OECD (2013), Education at a Glance 2013, Chart D4.1, available at http://dx.doi.org/10.1787/888932847868.
0100200300400500600700800900
1 0001 1001 2001 3001 4001 500Hours per year
Upper secondary education, general programmes Primary education Lower secondary education
Argen
tina
Chile
United
States
Scotla
nd
Mexico
Austra
lia
Portug
al
New Ze
aland
Netherl
ands
Canad
a
Luxe
mbourg
Irelan
d
German
y
Engla
ndSpa
in
OECD av
erag
e
Franc
e
Indon
esia
Sloven
iaIta
ly
Slovak
Rep
ublic
Belgium
(Fl.)
Korea
Hunga
ry
Czech
Rep
ublic
Belgium
(Fr.)
Austri
a
Eston
ia
Turke
y
Finlan
d
Icelan
d
Poland
Norway
Israe
l
Japa
n
Russia
n Fed
eratio
n
Greece
Denmark
0
1 500
100200300400500600700800900
1 0001 1001 2001 3001 400
2011 2005Hours per year
Argen
tina
Chile
United
States
Mexico
Scotla
nd
New Ze
aland
Austra
lia
Portug
al
German
y
Netherl
ands
Canad
a
Luxe
mbourg
Irelan
dSpa
in
OECD av
erag
e
Engla
nd
Sloven
ia
Belgium
(Fl.)
Norway
Belgium
(Fr.)
Slovak
Rep
ublic
Denmark
Franc
e
Czech
Rep
ublic Ita
ly
Icelan
dKor
ea
Eston
iaIsr
ael
Austri
a
Hunga
ryJa
pan
Finlan
d
Poland
Indon
esia
Russia
n Fed
eratio
n
Greece
EDUCATION AT A GLANCE 2013: HIGHLIGHTS © OECD 2013 67

STATISTICAL NOTE
Statistical note
Coverage of statistics
Although a lack of data still limits the scope of the indicators in many countries, the
coverage extends, in principle, to the entire national education system (within the national
territory) regardless of the ownership or sponsorship of the institutions concerned and
regardless of education delivery mechanisms. With one exception described below, all
types of students and all age groups are meant to be included: children (including students
with special needs), adults, nationals, foreigners, as well as students in open distance
learning, in special education programmes or in educational programmes organised by
ministries other than the Ministry of Education, provided the main aim of the programme
is the educational development of the individual. However, vocational and technical
training in the workplace, with the exception of combined school and work-based
programmes that are explicitly deemed to be parts of the education system, is not included
in the basic education expenditure and enrolment data.
Educational activities classified as “adult” or “non-regular” are covered, provided that
the activities involve studies or have a subject matter content similar to “regular”
education studies or that the underlying programmes lead to potential qualifications
similar to corresponding regular educational programmes. Courses for adults that are
primarily for general interest, personal enrichment, leisure or recreation are excluded.
Calculation of international means
For many indicators an OECD average is presented.
OECD average: This is calculated as the unweighted mean of the data values of all
OECD countries for which data are available or can be estimated. The OECD average
therefore refers to an average of data values at the level of the national systems and can be
used to answer the question of how an indicator value for a given country compares with
the value for a typical or average country. It does not take into account the absolute size of
the education system in each country.
EDUCATION AT A GLANCE 2013: HIGHLIGHTS © OECD 2013 69


GLOSSARY
Glossary
Ancillary services: Ancillary services are services provided by educational institutions
that are peripheral to the main educational mission. The two main components of
ancillary services are student welfare services and services for the general public.
Class size: Class size is the average number of students per class, calculated by dividing
the number of students enrolled by the number of classes.
Completion rates: Completion rates are based on the proportion of new entrants into a
specified level of education who graduate with at least a first degree at this level, in the
amount of time normally allocated for completing the programme.
Compulsory education: Compulsory education refers to the legal age from which children
are no longer compelled to attend school (e.g., 15th birthday).
Current expenditure: Current expenditure corresponds to education spending on goods
and services consumed within the current year, which needs to be made recurrently
to sustain the production of educational services.
Dropout rate: Dropout rates correspond to the proportion of students who leave a
specified level in the educational system without obtaining a first qualification.
Educational attainment: Educational attainment is expressed by the highest completed
level of education, defined according to the International Standard Classification of
Education (ISCED).
Educational personnel: The classification is based on four main functional categories
i) Instructional personnel; ii) Professional support for students; iii) Management/
Quality control/Administration; and iv) Maintenance and operations personnel.
Teaching staff (teachers) and teachers’ aides make up the category instructional
personnel.
Education expectancy: Education expectancy is the average duration of formal education
in which a five-year-old child can expect to enrol over his or her lifetime.
Employment rate: Employment rates represent the number of persons in employment as
a percentage of the working-age population.
Enrolment rates: Enrolment rates represent the number of students of a particular age
group enrolled in all levels of education as a percentage of the total population of that
age group.
Expenditure on educational core services: Expenditure on educational core services
includes all expenditure that is directly related to instruction and education. This
should cover all expenditure on teachers, school buildings, teaching materials, books,
tuition outside schools, and administration of schools.
First-generation students: First-generation students are those students who reported in
PISA that they were born in the country of assessment but whose parents were born in
another country.
EDUCATION AT A GLANCE 2013: HIGHLIGHTS © OECD 2013 71
GLOSSARY
72
Foreign students: Foreign students are students who do not hold the citizenship of the
country for which the data are collected.
General programmes: General programmes are programmes that are not designed
explicitly to prepare participants for a specific class of occupations or trades or for
entry into further vocational or technical education programmes.
Gross Domestic Product (GDP): Gross Domestic Product (GDP) is the standard measure of
the value of final goods and services produced by a country during a period minus the
value of imports.
Human capital: Human capital is productive wealth embodied in labour, skills and
knowledge.
Intended instruction time: Intended instruction time refers to the number of hours per
year for which students ought to receive instruction in both the compulsory and non-
compulsory parts of the curriculum.
Lower secondary education: Lower secondary education completes the provision of basic
education, usually in a more subject-oriented way with more specialist teachers. Entry
follows 6 years of primary education; duration is 3 years. In some countries, the end of
this level marks the end of compulsory education.
Net graduation rates: Net graduation rates refer to the estimated percentage of people
from a specific age group who will complete tertiary education over their lifetimes,
based on current patterns of graduation.
PISA or Programme for International Student Assessment: The Programme for International
Student Assessment is an international study conducted by the OECD which measures
how well young adults, at age 15 and therefore approaching the end of compulsory
schooling, are prepared to meet the challenges of today's knowledge societies.
Post-secondary non-tertiary level of education: Programmes at this level may be regarded
nationally as part of upper secondary or post-secondary education, but in terms of
international comparison their status is less clear cut. Programme content may not be
much more advanced than in upper secondary, and is certainly lower than at tertiary
level. Entry typically requires completion of an upper secondary programme. Duration
is usually equivalent to between 6 months and 2 years of full-time study.
Pre-primary education: Pre-primary education is the first stage of organised instruction
designed to introduce very young children to the school atmosphere (minimum entry
age of 3).
Primary education: Primary education is designed to provide a sound basic education in
reading, writing and mathematics and a basic understanding of some other subjects
(entry age: between 5 and 7). Duration is of 6 years.
Private expenditure: Private expenditure refers to expenditure funded by private sources,
i.e. households and other private entities. “Households” refers to students and their
families. “Other private entities” include private business firms and non-profit
organisations, including religious organisations, charitable organisations, and
business and labour associations.
Private institution: An institution is classified as private if it is controlled and managed by
a non-governmental organisation (e.g., a Church, Trade Union or business enterprise),
or if its Governing Board consists mostly of members not selected by a public agency.
Private internal rate of return: The rate of return represents a measure of the returns
obtained, over time, relative to the costs of the initial investment in education.
EDUCATION AT A GLANCE 2013: HIGHLIGHTS © OECD 2013

GLOSSARY
Public institution: An institution is classified as public if it is controlled and managed
directly by a public education authority or agency; or is controlled and managed either
by a government agency directly or by a governing body (Council, Committee etc.),
most of whose members are appointed by a public authority or elected by public
franchise.
Teaching time: Teaching time is defined as the scheduled number of hours per year that a
full-time teacher teaches a group or class of students as set by policy.
University-level education: “Long-stream” programmes that are theory based and aimed
at preparing students for further research or to give access to highly skilled
professions, such as medicine or architecture. Entry is preceded by 13 years of
education, and students are typically required to have completed upper secondary or
post-secondary non-tertiary education. Duration is equivalent to at least 3 years of
full-time study, but 4 is more usual.
Upper secondary education: Upper secondary education corresponds to the final stage of
secondary education in most OECD countries. Instruction is based on even stronger
subject specialisation than at lower-secondary level, and teachers are usually more
qualified. Students are typically expected to have completed 9 years of education or
lower secondary schooling before entry and are generally around the age of 15 or 16.
Vocationally oriented tertiary education: “Short-stream” programmes that are more
practically oriented or focus on the skills needed for students to directly enter specific
occupations. Entry is preceded by 13 years of education; duration is equivalent to at
least 2 years of full-time study, but 3 is more usual.
Vocational programmes: Vocational education prepares participants for direct entry,
without further training, into specific occupations. Successful completion of such
programmes leads to a labour-market relevant vocational qualification.
EDUCATION AT A GLANCE 2013: HIGHLIGHTS © OECD 2013 73

FURTHER READING
Further reading
Education Today 2013This book summarises what OECD has to say about the state of
education today in eight key areas: early childhood education,
schooling, transitions beyond initial education, higher education,
adult learning, outcomes and returns, equity, and innovation.
Trends Shaping Education 2013What does it mean for education that our societies are
increasingly diverse? How is global economic power shifting
towards new countries? In what ways are working patterns
changing? Trends Shaping Education 2013 brings together
international evidence to address questions like these.
OECD Reviews of Vocational Education and TrainingWhat type of training is needed to meet the needs of changing
economies? How should the programmes be funded? How should
they be linked to academic and university programmes? How can
employers and unions be engaged? The country reports in this
series look at these and other questions. They form part of Skills
beyond School, the OECD policy review of post-secondary vocational
education and training.
EDUCATION AT A GLANCE 2013: HIGHLIGHTS © OECD 2013 75
FURTHER READING
76
Art for Art's Sake? The Impact of Arts EducationArts education is often said to be a means of developing critical
and creative thinking. This report examines the state of empirical
knowledge about the impact of arts education on these kinds of
outcomes.
Better Skills, Better Jobs, Better LivesThis book presents a strategy that will help countries reach the
goal of having and making the best use of a high-quality pool of
skills.
Education at a Glance country-specific material :Country notes with key fact tables and multilingual summaries for
34 OECD member countries, 8 non-OECD member countries, as
well as the European Union.
Related OECD publications
Teachers for the 21st Century: Using Evaluation to Improve Teaching (2013),
http://dx.doi.org/10.1787/9789264193864-en.
PISA 2012 Assessment and Analytical Framework : Mathematics, Reading, Science, Problem Solving
and Financial Literacy (2013), http://dx.doi.org/10.1787/9789264190511-en.
OECD Factbook (2013), http://dx.doi.org/10.1787/factbook-2013-en.
Equity and Quality in Education: Supporting Disadvantaged Students and Schools (2012),
http://dx.doi.org/10.1787/9789264130852-en.
EDUCATION AT A GLANCE 2013: HIGHLIGHTS © OECD 2013
FURTHER READING
Health at a Glance 2011: OECD Indicators (2011), http://dx.doi.org/10.1787/health_glance-2011-en.
How’s Life?: Measuring Well-being (2011), http://dx.doi.org/10.1787/9789264121164-en.
PISA 2009 Results: Students On Line: Digital Technologies and Performance (Volume VI) (2011),
http://dx.doi.org/10.1787/9789264112995-en.
PISA 2009 Results: Learning Trends: Changes in Student Performance Since 2000 (Volume V) (2010),
http://dx.doi.org/10.1787/9789264091580-en.
PISA 2009 Results: What Makes a School Successful?: Resources, Policies and Practices (Volume IV)
(2010), http://dx.doi.org/10.1787/9789264091559-en.
PISA 2009 Results: Learning to Learn: Student Engagement, Strategies and Practices (Volume III)
(2010), http://dx.doi.org/10.1787/9789264083943-en.
PISA 2009 Results: Overcoming Social Background: Equity in Learning Opportunities and Outcomes
(Volume II) (2010), http://dx.doi.org/10.1787/9789264091504-en.
PISA 2009 Results: What Students Know and Can Do: Student Performance in Reading,
Mathematics and Science (Volume I) (2010), http://dx.doi.org/10.1787/9789264091450-en.
Improving Health and Social Cohesion through Education (2010),
http://dx.doi.org/10.1787/9789264086319-en.
Starting Strong III: A Quality Toolbox for Early Childhood Education and Care (2011),
http://dx.doi.org/10.1787/9789264123564-en.
Learning for Jobs: OECD Reviews of Vocational Education and Training (2010),
http://dx.doi.org/10.1787/9789264087460-en.
Creating Effective Teaching and Learning Environments: First Results from TALIS (2009),
http://dx.doi.org/10.1787/9789264072992-en.
Forthcoming:
PISALaunched in 1997 by the OECD, the Programme for
International Student Assessment (PISA) is an
international study which aims to evaluate
education systems worldwide by testing the skills
and knowledge of 15-year-old students.
To date, students from more than 70 countries and economies have participated in the
assessment.
Since the year 2000, every three years, a randomly selected group of fifteen-year-olds
take tests in key subjects: reading, mathematics and science, with focus given to one
subject in each year of assessment.
The 2012 data collection focussed on mathematics and included an optional
computer-based assessment of mathematics and reading involving some 30 countries as
well as an optional area of assessment: financial literacy, which 19 countries took up.
Results of the 2012 data collection will be published on 3 December 2013.
EDUCATION AT A GLANCE 2013: HIGHLIGHTS © OECD 2013 77
T
enviro
to hel
inform
where
practi
T
Denm
Luxem
Spain,
part in
O
resear
stand
ORGANISATION FOR ECONOMIC CO-OPERATIONAND DEVELOPMENT
he OECD is a unique forum where governments work together to address the economic, social and
nmental challenges of globalisation. The OECD is also at the forefront of efforts to understand and
p governments respond to new developments and concerns, such as corporate governance, the
ation economy and the challenges of an ageing population. The Organisation provides a setting
governments can compare policy experiences, seek answers to common problems, identify good
ce and work to co-ordinate domestic and international policies.
he OECD member countries are: Australia, Austria, Belgium, Canada, Chile, the Czech Republic,
ark, Estonia, Finland, France, Germany, Greece, Hungary, Iceland, Ireland, Israel, Italy, Japan, Korea,
bourg, Mexico, the Netherlands, New Zealand, Norway, Poland, Portugal, the Slovak Republic, Slovenia,
Sweden, Switzerland, Turkey, the United Kingdom and the United States. The European Union takes
the work of the OECD.
ECD Publishing disseminates widely the results of the Organisation’s statistics gathering and
ch on economic, social and environmental issues, as well as the conventions, guidelines and
ards agreed by its members.
OECD PUBLISHING, 2, rue André-Pascal, 75775 PARIS CEDEX 16
(96 2013 04 1 P) ISBN 978-92-64-20106-4 – No. 60497 2013
Consult this publication on line at http://dx.doi.org/10.1787/eag_highlights-2013-en.
This work is published on the OECD iLibrary, which gathers all OECD books, periodicals and statistical databases.Visit www.oecd-ilibrary.org for more information.
Education at a Glance 2013HIGHLIGHTS
Education at a Glance 2013HIGHLIGHTS
Education at a Glance 2013: Highlights summarises the OECD’s fl agship compendium of education statistics, Education at a Glance. It provides easily accessible data on key topics in education today, including:
• Education levels and student numbers: How far have adults studied, and how does early childhood education affect student performance later on?
• Higher education and work: How many young people graduate from tertiary education, and how easily do they enter the world of work?
• Economic and social benefi ts of education: How does education affect people’s job prospects, and what is its impact on incomes?
• Paying for education: What share of public spending goes on education, and what is the role of private spending?
• The school environment: How many hours do teachers work, and how does class size vary?
• Each indicator is presented on a two-page spread. The left-hand page explains the signifi cance of the indicator, discusses the main fi ndings, examines key trends and provides readers with a roadmap for fi nding out more in the OECD education databases and in other OECD education publications. The right-hand page contains clearly presented charts and tables, accompanied by dynamic hyperlinks (StatLinks) that direct readers to the corresponding data in Excel™ format.
ISBN 978-92-64-20106-496 2013 04 1 P -:HSTCQE=WUVU[Y:
Ed
ucation at a G
lance 2013 HIG
HL
IGH
TS
2013