Embed Size (px)
Citation preview

ILCL-ILSL MONTHLYEconomy and Market ReviewILCL-ILSL MONTHLYEconomy and Market ReviewApril : 2015 Issue : 20April : 2015 Issue : 20
YOUR MONEY MANAGER
www.il-capital.com
IL Capital Limited and International Leasing Securities Limited are subsidiaries of International Leasing and Financial Services LimitedIL Capital Limited and International Leasing Securities Limited are subsidiaries of International Leasing and Financial Services Limitedwww.ilslbd.com
Natural Gas Industry of BangladeshNatural Gas Industry of Bangladesh

Printers Building, 14th floor5 Rajuk Avenue, Dhaka-1000.
Call us at : +8801929996677-8 orEmail us at : [email protected]
www.il-capital.com
We Offer :Margin Loan at Low Interest Rate
Market Insight and Research
IPO/RPO/Right Application

Welcome to our April 2015 issue. Our vision is to establish ourselves as one of the leading Investment Banking solution providers in Bangladesh with high ethical standards and best practices. We started our first monthly publication “ILCL Monthly Economy and Market Review” with September, 2013 edition and seek every opportunity to make it more informative and beneficial for our readers that cover honorable business community, corporate clients and high net worth retail clients.
This edition includes a short note on An Overview of IPO Market: A Recent Snapshot from Home and South Asia and also covers Natural Gas Industry of Bangladesh with a snapshot over a stocks defined under the sector in prime bourse.
We are looking forward to any advice or suggestions from our readers or any other concern to make it distinguished and complete. Please do not hesitate to contact us to convey your opinion. We are also committed to the readers for any assistance or explanation over any doubt or confusion arising from our publications.
Thanking You-
ILCL-ILSL Monthly Economy and Market Review – April 2015
Table of Contents
ILCL-ILSL MONTHLYEconomy and Market Review
April, 2015
Economy UpdateAn Overview of IPO Market:
A Recent Snapshot from Home and South Asia
Market UpdateNatural Gas Industry of Bangladesh
Titas Gas Transmission andDistribution Company Limited
Mutual Fund: Monthly Update
01091014212325Business Newsflash
Saad Faisal Md. Humayan Kabir, FCAChief Operating Officer, IL Capital Chief Operating Officer, ILSL
Editorial

1ILCL-ILSL Monthly Economy and Market Review – April 2015
Economy Update
The International Monetary Fund (IMF) has projected the growth of Bangladesh to reach 7% and hold the second position in the list of 10 countries with GDP worth USD 100bn by the year 2019, with Iraq (9.2% growth) occupying the first place. Considering Bangladesh as one of the 14 countries among the frontier markets under the Low Income Developing Countries (LIDCs), IMF believes that the overall outlook is expected to be strong through better performance, structural reforms and critical business environment improvements. The UK based PwC projected Bangladesh to become the 29th largest economy in the world under the global GDP ranking at PPP terms by 2030 and 23rd largest by 2050, which is currently ranked at 31st position in the list. PwC also projected the investment rate of Bangladesh to be at 23.2%, with India having 23.7%, Philippines 25.5% and Malaysia with highest investment rate of 28.2% in the region by 2025. For the year 2014, the rates were 21.2%, 25.7%, 20.5%, and 28.2% respectively.
In their biannual Regional Economic Outlook for Asia and the Pacific report, the IMF has shown that the region's gross domestic product (GDP) growth will sustain at 5.6% in 2015. Asean countries (Malaysia, Myanmar, Philippines, Singapore, Thailand, Viet Nam, Brunei Darussalam, Cambodia, Indonesia and Lao PDR) account for about 5% of global manufacturing presently, according to McKinsey. Global foreign direct inflows into Asean's largest countries amounted to USD 128.4bn in 2013, according to Bank of America Merrill Lynch. A lot of production in China has moved into Vietnam, Thailand and Indonesia. Global investment is migrating from the west to the east. The growth in South Asia will continue with accelerating domestic consumption fueled by healthy labor markets, low interest rates and the recent fall in oil prices. Southeast Asia has the appropriate fundamentals to be a major market for investors. After a period of cooling down because of fluctuating currencies and oil price along with political instability, the region's growth story is very convincing.
Bangladesh has maintained a GDP growth rate of 6-7% for a decade. With inflation remaining below 7%, strong foreign exchange reserve, stable exchange rate, bank lending rates on down trend and the overall balance of payment being positive, it indicates to be a bright position in the region. Along with infrastructural developments in power generation, robust manufacturing industries and recent development plans with foreign partnerships in establishing deep sea port and nuclear power plants, Bangladesh has nailed its position in the list of lucrative country to invest.
In comparison with other South Asian countries, Bangladesh consumption rate remained higher than others and is projected to continue in the trend for the upcoming years. This only indicates that the households of Bangladesh can increase their real consumption based on income alone, which implies further GDP growth for the country.
Source: UNCTAD and IL Capital Research
Estimated Global FDI inflow (USD bn)
13461612
1324 1363 1260
2010 2011 2012 2013 2014
Stock of Direct Foreign Investment 2014 (USD Bn)
Source: CIA and IL Capital Research
Bang
lade
sh
Indi
a
Paki
stan
Viet
Nam
Phili
ppin
es
Mal
aysia
Indo
nesia
8.62
5
261.
7
31.2
5
93.6
1
36.3
5
144 25
5
0.1669 129.8 1.8 7.7 16.19 146.7 23.27
Abroad Home
Consumer Price (annual % change)
Source :IMF and IL Capital Research
7.5
9.5
2.9
2.1
6.4
6.9
6.7
7.5
3.6
3.9
5.5
6.4
5.7
6.1
3.5
2.7
5
5.5
Bangladesh
India
Philippines
Malaysia
Indonesia
Sri Lanka
2013 2015(P) 2019(P)
2014 2030 (P) 2050(P) 2014 2025(P)Bangladesh 31 29 23 Bangladesh 21.2 23.2India 3 3 2 India 25.7 23.7Pakistan 25 22 15 Pakistan 16.2 17.2Viet Nam 32 28 22 Viet Nam 20.1 25.1Philippines 28 26 20 Philippines 20.5 25.5Malaysia 27 24 24 Malaysia 28.2 28.2Indonesia 9 5 4 Indonesia 26 23Source : PwC and IL Capital Research
GDP at PPP Ranking Investment Rate (as % GDP)

Inflation:
GDP:
GDP Growth and Inflation by Countries in 2014 (%)
Low Inflation Countries
High Inflation Countries
Infla
tion
Bangladesh
India
Sri Lanka
Phillippines
Thailand
Malaysia
Singapore
Indonesia
Vietnam
0.0%
1.0%
2.0%
3.0%
4.0%
5.0%
6.0%
7.0%
8.0%
0.0% 1.0% 2.0% 3.0% 4.0% 5.0% 6.0% 7.0% 8.0% 9.0%
GDP Growth
GDP Growth Rate (%) Base 2005-06
In the South Asian region, China and India are contributing the largest global output volume which strongly indicates their robust economic growth conditions. The United Nation forecasts that the economic growth in South Asia is aiming to rise up from an estimated 4.9% in FY2014 to 5.4% in FY2015 and will approach 5.7% in FY2016. Moreover, with the international oil prices declining, the inflation pressure has come to an ease across the region, which supports further accelerating economic outlook for the upcoming periods.
Bangladesh is expected to position itself among the top ten countries in terms of economic growth. The IMF has projected that Bangladesh will be the second in the list of highest growth countries in the world in FY2019 with 7% growth rate while Iraq will at the top of the list with 9.2% growth. The report only includes countries with a GDP worth over USD 100 billion. Bangladesh is expected to maintain a steady growth of over 6% rate, growing to 6.5% in FY2015 and then accelerating to 7% betweenFY2017 and FY2019.
The country’s Point-to-Point inflation witnessed a rise and reached to 6.27% in the month of March from 6.14% in the previous month of February. Due to recent political situation, communication disruption in the supply chain has increased the cost of food products, which got reflected in the surging food inflation, standing at 6.73% in the month of March from 6.11% in the February. Besides, the non-food inflation decreased to 6.12% in March as against 6.20% in the previous month of February. However, the Y-o-Y comparison indicates that the general Point-to-Point inflation along with the food inflation have both decelerated from the past year, while the non-food inflation has surged.
6.7
7.1
6.0
5.1
5.6
6.5 6.5
6.0 6.
1
5.5
6.2
5.6
6.4
6.1 6.2 6.
3
7.3
4.0
4.5
5.0
5.5
6.0
6.5
7.0
7.5
2005
-06
2006
-07
2007
-08
2008
-09
2009
-10
2010
-11
2011
-12
2012
-13
2013
-14
2013
-14E
2014
-15E
2013
-14E
2014
-15E
2013
-14E
2014
-15E
2013
-14E
2014
-15E
History IMF ADB WB Govt.
Inflation (%) Base 2005-06
5.0
1.8
8.79.1
11.3
4.9
6.1
1.5
3.5
5.5
7.5
9.5
11.5
13.5
July
Augu
st
Sept
embe
r
Oct
ober
Nove
mbe
r
Dece
mbe
r
Janu
ary
Febr
uary
Mar
ch
April
May
June
July
Augu
st
Sept
embe
r
Oct
ober
Nove
mbe
r
Dece
mbe
r
Janu
ary
Febr
uary
Mar
ch
April
May
June July
Augu
st
Sept
embe
r
Oct
ober
Nove
mbe
r
Dece
meb
r
Janu
ary
Febr
uary
Mar
ch
2012-13 2013-14 2014-15
Headline Food Non-Food
Source: Bangladesh Bank and IL Capital
2ILCL-ILSL Monthly Economy and Market Review – April 2015
Money Supply:
Annual Broad Money Supply (M2) Growth Rate (%) Monthly Broad Money Supply (M2) Growth yoy (%)
Annual Reserve Money Growth Rate (%) Monthly Reserve Money Growth yoy (%)
Annual Net Foreign Assets Growth Rate (%) Monthly Net Foreign Asset Growth yoy %
15.6%
13.8%
19.3%
17.1%
22.4%
17.4%
16.1%
10.0%
12.0%
14.0%
16.0%
18.0%
20.0%
22.0%
24.0%
2002
-03
2003
-04
2004
-05
2005
-06
2006
-07
2007
-08
2008
-09
2009
-10
2010
-11
2011
-12
2012
-13
2013
-14
15.8%
15.3%
16.5%
15.7%
12.6%
13.3%
12.8%
11.0%
12.0%
13.0%
14.0%
15.0%
16.0%
17.0%
Janu
ary
Febr
uary
Mar
ch
April
May
June July
Augu
st
Sept
embe
r
Oct
ober
Nove
mbe
r
Dece
mbe
r
Janu
ary
Febr
uary
2013-14 2014-15
4.2%
14.8%
23.9%
16.1%
31.9%
18.2%
21.0%
9.0%
15.5%
0.0%
5.0%
10.0%
15.0%
20.0%
25.0%
30.0%
35.0%
2002
-03
2003
-04
2004
-05
2005
-06
2006
-07
2007
-08
2008
-09
2009
-10
2010
-11
2011
-12
2012
-13
2013
-14
14.4%
10.8%
15.5%
21.2%
16.6%
26.0%
14.3%
15.3%
7.0%
9.0%
11.0%
13.0%
15.0%
17.0%
19.0%
21.0%
23.0%
25.0%
27.0%Ja
nuar
y
Febr
uary
Mar
ch
April
May
June July
Augu
st
Sept
embe
r
Oct
ober
Nove
mbe
r
Dece
mbe
r
Janu
ary
Febr
uary
2013-14 2014-15
The broad money growth rate in the economy kept declining from 13.35% to 12.79% for the period of December to FebruaryFY2014-15. For the period the public sector credit growth had decreased significantly which affected the money-supply growth.
Moreover, a surge in the sales of the national saving certificate is also expected to be a reason for the decline in money supply.It was recorded that the net sales of saving certificates amounted to BDT 131.35 billion in the six months of the FY2015,significantly up from the target of BDT 90.56 billion.
Although the USD BDT exchange rate remain relatively stable, the monthly net foreign asset has noticed a gradual deceleration from 39.29% growth in July to 19.9% in the month of February FY2014-2015.
Source: Bangladesh Bank and IL Capital
47.2%
17.1%14.5%
50.5%
15.2%
41.3%
5.2%
43.9%
41.3%
0.0%
10.0%
20.0%
30.0%
40.0%
50.0%
60.0%
2002
-03
2003
-04
2004
-05
2005
-06
2006
-07
2007
-08
2008
-09
2009
-10
2010
-11
2011
-12
2012
-13
2013
-14
36.4%
38.4%41.2%
35.0%
25.2%
19.9%
10.0%
15.0%
20.0%
25.0%
30.0%
35.0%
40.0%
45.0%
Janu
ary
Febr
uary
Mar
ch
April
May
June July
Augu
st
Sept
embe
r
Oct
ober
Nove
mbe
r
Dece
mbe
r
Janu
ary
Febr
uary
2013-14 2014-15
3ILCL-ILSL Monthly Economy and Market Review – April 2015
Money Supply (Continued):
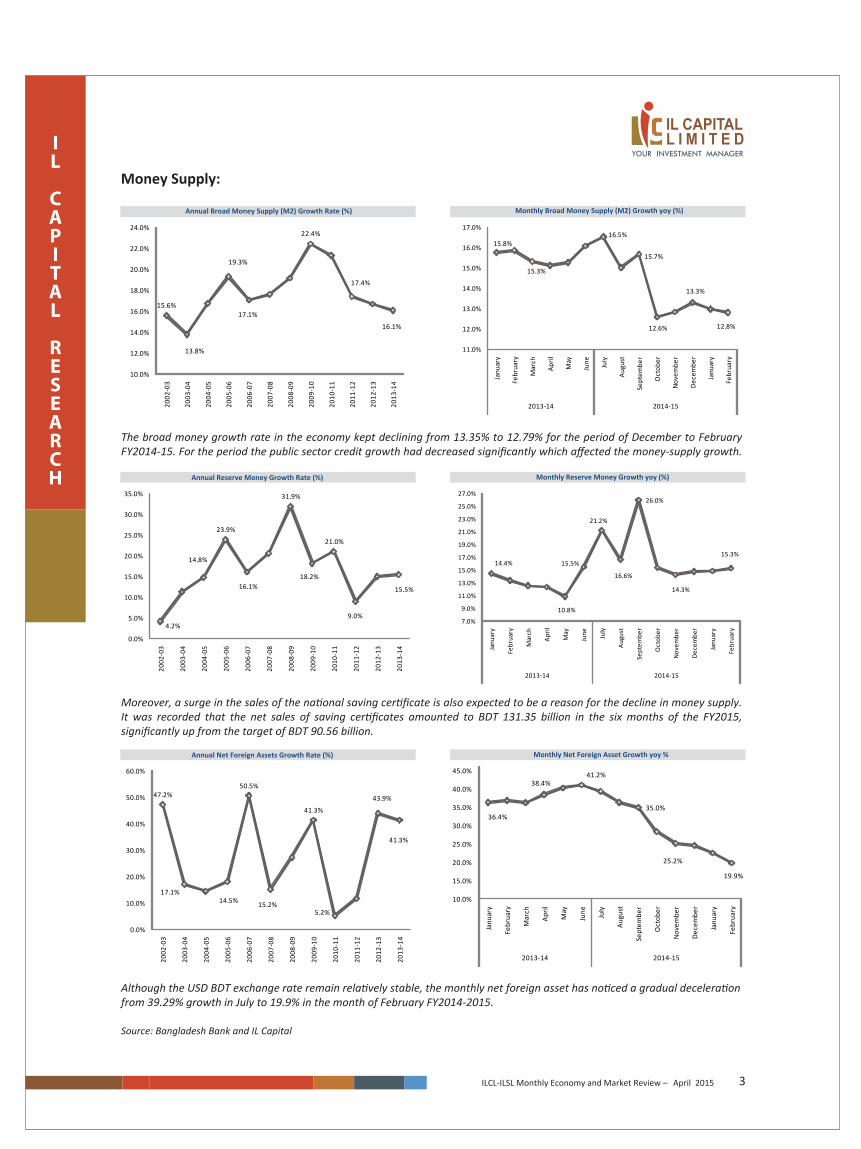
Source: Bangladesh Bank and IL Capital Research
Annual Public and Private Sector Credit Growth Rate (%) Monthly Public and Private Sector Credit Growth yoy %
Reserve:Annual Movement of Reserve (USD Bn) Monthly Movement of Reserve (USD Bn)
-4.4% -1.7%
33.6%
8.9%12.7%
24.9%
12.3%
-15.0%
-5.0%
5.0%
15.0%
25.0%
35.0%
45.0%
2002
-03
2003
-04
2004
-05
2005
-06
2006
-07
2007
-08
2008
-09
2009
-10
2010
-11
2011
-12
2012
-13
2013
-14
Public Sector Private Sector
February FY2015 has noticed a slight increase in the private sector credit growth with 13.6% growth from 13.3% in January FY2015, which also was a 17.2% rise on a Y-o-Y basis. This may indicate that the investors are optimistic about investment and gradually are involving with more investment activities. From the current condition the growth looks broadly stable and the outlook indicates that the growth rate could accelerate on the back of political easing.
The country’s foreign exchange reserve has crossed USD 22bn in March and with stable remittance inflow, it is expected to cross USD 24bn by April FY2015. The country is ranked second in the South Asian region in foreign exchange reserve, after India, which has a reserve of USD 339.99bn.This reserve is 43.8% of annual import for FY2013-14.
The reserves rose by more than USD 3bn in the last one year. The central bank data states that the reserves were USD 19.3bn March FY2014. The month to month drop in the reserves from USD 23bn in February FY2015 is expected to be associated with the clearance of import payments to Asian Clearing Union for the period of January to February by the central bank.
2.7 2.9 3.5 5.1
6.1 7.5
10.7 10.9 10.4
15.3
21.5
-
5.0
10.0
15.0
20.0
25.0
2003
-04
2004
-05
2005
-06
2006
-07
2007
-08
2008
-09
2009
-10
2010
-11
2011
-12
2012
-13
2013
-14
19.3 20.4 20.3
21.5 21.4 22.1 21.8 22.3
21.6 22.3 22.0
23.0 22.8
10.0
12.0
14.0
16.0
18.0
20.0
22.0
24.0
Mar
ch
April
May
June July
Augu
st
Sept
embe
r
Oct
ober
Nove
mbe
r
Dece
mbe
r
Janu
ary
Febr
uary
Mar
ch
2013-14 2014-15
11.6%
11.4%
8.8%
11.5%
6.1%
11.1%
13.6%
3.0%
5.0%
7.0%
9.0%
11.0%
13.0%
15.0%
Janu
ary
Febr
uary
Mar
ch
April
May
June July
Augu
st
Sept
embe
r
Oct
ober
Nove
mbe
r
Dece
mbe
r
Janu
ary
Febr
uary
2013-14 2014-15
Public Sector Private Sector
4ILCL-ILSL Monthly Economy and Market Review – April 2015

Source: Bangladesh Bank and IL Capital Research.
Exchange Rate:
FDI Inflow and Portfolio Investment:
Exchange Rate USD : BDT Monthly Exchange Rate USD : BDT
FDI Inflow (USD Mn) Monthly Portfolio Investment (BDT Crores)
57.9
61.4
69.0 68.8
71.2
79.1 77.6
55.0
60.0
65.0
70.0
75.0
80.0
85.0
2002
-03
2003
-04
2004
-05
2005
-06
2006
-07
2007
-08
2008
-09
2009
-10
2010
-11
2011
-12
2012
-13
2013
-14
77.8
77.6
77.5
77.4
77.9
78.0
77.8
77.3
77.4
77.5
77.6
77.7
77.8
77.9
78.0
Mar
ch
April
May
April
May
June July
Augu
st
Sept
embe
r
Oct
ober
Nove
mbe
r
Dece
mbe
r
Janu
ary
Febr
uary
Mar
ch
2013-14 2014-15
In the interbank money market, the USD was traded on an average of BDT 77.8, in the last two months. The central bank had been purchasing USD, initiating the current �scal year purchase of USD 2.9bn in July and recently purchasing around USD 20mn. The Treasury department of the Bangladesh Bank is expected to continue the procurement of dollars to maintain a positive tendency of the overall economic outlook.
According to Dhaka Stock Exchange, share selling by foreign investors surged due to unstable capital market conditions. The foreign investors had sold BDT 351.91 crore shares against buying BDT 319.61 crore in recent period. It is thought that substantially low recorded earnings from the �nancial sector have provoked the situation. Experts state that the volatility in the stock market is due to the political instability which is anticipated to ease up in the near future and bring back liquidity in the market.
Recently, the capital market leaders have discussed their immediate future actions and have decided to focus on issues of markettrends and the reasons behind the current volatility along with long-term policy.
960.6 913.0 779.0
1,194.9
1,730.6
1,495.5
-
200.0
400.0
600.0
800.0
1,000.0
1,200.0
1,400.0
1,600.0
1,800.0
2,000.0
2009
2010
2011
2012
2013
2014
(27.0)
0.2
(2.0) (31.8)
5.6 31.6 0.3 240.7
727.7 325.1
(702.1)
(2,029.5)
4,142.6
742.9
(4,690.4)
(5,000.0)
(4,000.0)
(3,000.0)
(2,000.0)
(1,000.0)
-
1,000.0
2,000.0
3,000.0
4,000.0
5,000.0
1999
-00
2000
-01
2001
-02
2002
-03
2003
-04
2004
-05
2005
-06
2006
-07
2007
-08
2008
-09
2009
-10
2010
-11
2011
-12
2012
-13
2013
-14
5ILCL-ILSL Monthly Economy and Market Review – April 2015
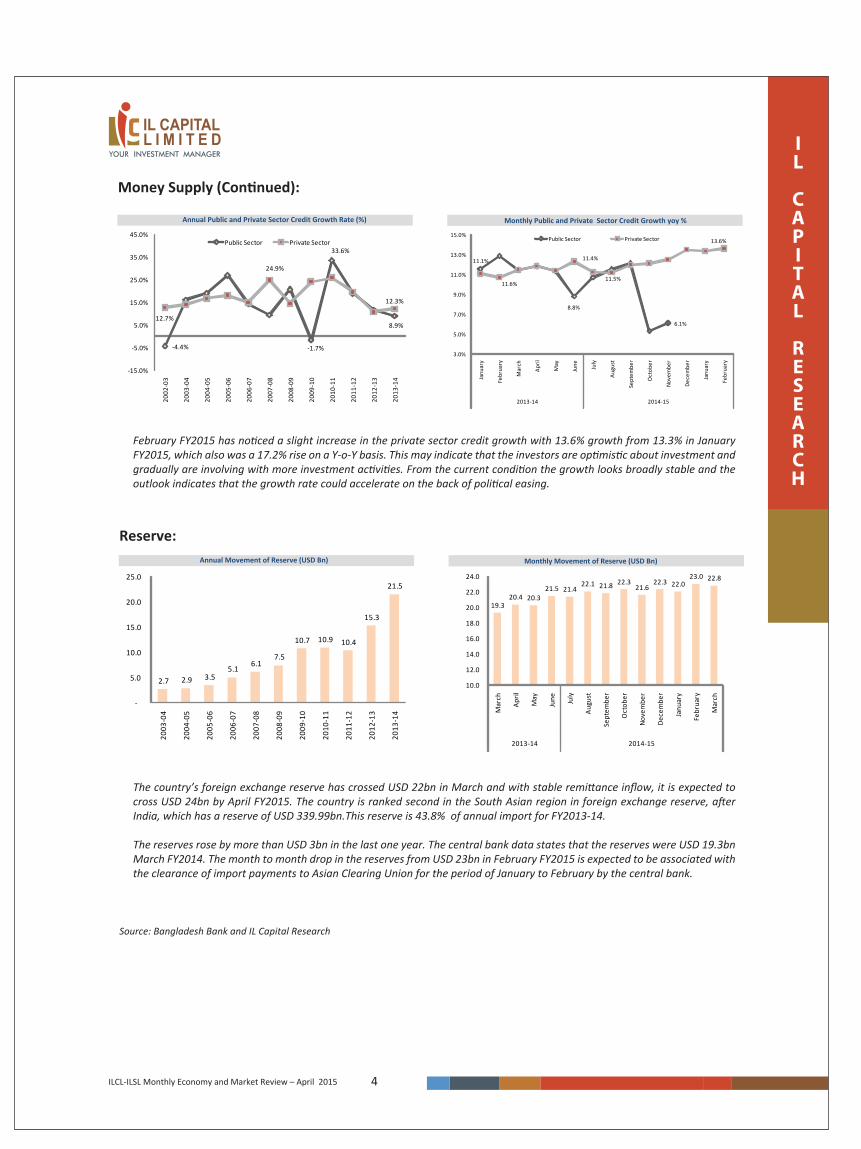
Source: Bangladesh Bank and IL Capital Research
International Trade:
Annual Trade Balance (USD Bn)
Monthly Movement of Export (USD Bn)Export (USD Bn)
Monthly Movement of Trade Deficit (USD Bn)
(2.1) (2.2)(3.2) (2.7)
(3.3)
(5.4)(4.7)
(5.2)
(9.5)
(7.6)(7.1)
(9.1)
(12.0)
(10.0)
(8.0)
(6.0)
(4.0)
(2.0)
-
2002
-03
2003
-04
2004
-05
2005
-06
2006
-07
2007
-08
2008
-09
2009
-10
2010
-11
2011
-12
2012
-13
2013
-14
(0.9)
(0.6)
(1.2) (1.2)
(0.8)
(0.4)
(0.2)
(1.5)
(1.0)
(1.5)
(0.9)
(1.2)
(0.7)
(0.6)
(1.6)
(1.4)
(1.2)
(1.0)
(0.8)
(0.6)
(0.4)
(0.2)
-
Janu
ary
Febr
uary
Mar
ch
April
May
June
July
Augu
st
Sept
embe
r
Oct
ober
Nove
mbe
r
Dece
mbe
r
Janu
ary
Febr
uary
2013-14 2014-15
With strong export growth and falling import, the trade de�cit is following a declining trend. In the export arena, the readymade garments export grew by 8.4% to USD 2bn in March despite political volatility. The government has set an export target of USD 26.9bn from the RMG sector for FY2014-15.To make the trade situation more amiable, Bangladesh and India have signed the �nal draft of a bilateral agreement on coastal shipping recently, to allow river vessels to travel between the two countries, andthe �nal agreement is expected to be signed when the Indian Prime Minister makes his visit to Bangladesh.
On the other hand, Bangladesh has pursued duty-free access for 17 additional products to China, to reduce trade imbalance between the two countries. According to the ministry of commerce, the trade de�cit between China and Bangladesh was almost USD 5.9bn in FY2012-13. At present, Bangladesh has duty bene�ts for over 4500 products to China under the Asia-Paci�c Trade Agreement. Moreover, China is the largest import destination for Bangladesh with products ranging from machineries,garments, chemicals and electrical equipment.
6.0 6.5 7.6 8.7
10.5 12.2
14.1 15.6 16.2
22.9 24.3
27.0 30.2
-10%
0%
10%
20%
30%
40%
50%
-
5.0
10.0
15.0
20.0
25.0
30.0
35.0
2001
-02
2002
-03
2003
-04
2004
-05
2005
-06
2006
-07
2007
-08
2008
-09
2009
-10
2010
-11
2011
-12
2012
-13
2013
-14
Export ( USD Billion) Export Growth Rate (%)
2.8
2.4 2.4 2.4
2.7 2.8 3.0
2.2
2.6
2.0
2.4
2.8 2.9
2.5 2.6
-10.0%
-5.0%
0.0%
5.0%
10.0%
15.0%
20.0%
1.7
1.9
2.1
2.3
2.5
2.7
2.9
3.1
Janu
ary
Febr
uary
Mar
ch
April
May
June July
Augu
st
Sept
embe
r
Oct
ober
Nove
mbe
r
Dece
mbe
r
Janu
ary
Febr
uary
Mar
ch
2013-14 2014-15
Export ( USD Billion) YOY Export Growth Rate (%)
Monthly Movement of Import (USD Bn)Import (USD Bn)
7.7 8.7 9.8 11.8
13.3 15.4 19.5 20.3 21.4
32.4 31.9 33.6
40.6
-20.0%
-10.0%
0.0%
10.0%
20.0%
30.0%
40.0%
50.0%
60.0%
-
5.0
10.0
15.0
20.0
25.0
30.0
35.0
40.0
45.0
2001
-02
2002
-03
2003
-04
2004
-05
2005
-06
2006
-07
2007
-08
2008
-09
2009
-10
2010
-11
2011
-12
2012
-13
2013
-14
Import (USD Billion) Import Growth Rate (%)
3.6
3.0
3.7 3.6 3.5
3.2 3.1
3.6 3.5 3.53.3
4.0
3.6
3.1
-10.0%-5.0%0.0%5.0%10.0%15.0%20.0%25.0%30.0%35.0%40.0%45.0%
2.0
2.5
3.0
3.5
4.0
4.5
Janu
ary
Febr
uary
Mar
ch
April
May
June July
Augu
st
Sept
embe
r
Oct
ober
Nove
mbe
r
Dece
mbe
r
Janu
ary
Febr
uary
2013-14 2014-15
Import (USD Billion) YOY Import Growth Rate (%)
6ILCL-ILSL Monthly Economy and Market Review – April 2015

Source: Bangladesh Bank and IL Capital Research
International Trade (Continued):
Remittance:Monthly Remittance (USD Bn)Annual Remittance (USD Bn)
Woven Garments 41.7%Knitwear 39.6%Jute 0.4%Jute Goods 2.5%Leather 1.3%Frozen Food 2.0%Agriculture 0.8%Engin. And Electronic Goods 1.5%Others 10.2%
Export Basket (July-March 2015)
Woven Garments
Knitwear
Jute
Jute Goods
Leather
Frozen Food
Agriculture
Engin. And Electronic Goods
Others
3.1 3.4 3.8 4.8
6.0
7.9
9.7 11.0
11.7 12.8
14.2
-5.0%
0.0%
5.0%
10.0%
15.0%
20.0%
25.0%
30.0%
35.0%
-
2.0
4.0
6.0
8.0
10.0
12.0
14.0
16.0
2002
-03
2003
-04
2004
-05
2005
-06
2006
-07
2007
-08
2008
-09
2009
-10
2010
-11
2011
-12
2012
-13
2013
-14
Remittence in (Billion USD) %Change Remittence (USD)
1.3 1.2
1.3 1.2 1.2 1.3
1.5
1.2 1.1 1.0
1.2 1.3
1.2 1.2
1.3
-20.0%
-10.0%
0.0%
10.0%
20.0%
30.0%
40.0%
-
0.2
0.4
0.6
0.8
1.0
1.2
1.4
1.6
Janu
ary
Febr
uary
Mar
ch
April
May
June July
Augu
st
Sept
embe
r
Oct
ober
Nove
mbe
r
Dece
mbe
r
Janu
ary
Febr
uary
Mar
ch
2013-14 2014-15
Remittence in (Billion USD) %Change Remittence (USD)
The in�ow of remittance has surged by 7.6% in the �rst nine months of the FY2014-15. The central bank has reported that the country received remittance of USD 6.68bn in July to March of the FY2014-15 from the gulf countries. Since Saudi Arabia �nally lifted the ban on the recruitment of Bangladeshi manpower in February 2015, more remittances is expected in thefuture period which will maintain the stability of BDT against USD.
U.A.E 18.7%K.S.A. 22.9%Kuwait 6.9%Other Middle East 12.4%U.S.A 15.7%U.K 4.8%Malaysia 8.6%Singapore 2.8%Italy 1.2%Others 6.0%
Remittance Portfolio (March 2015)
U.A.E
K.S.A.
Kuwait
Other Middle East
U.S.A
U.K
Malaysia
7ILCL-ILSL Monthly Economy and Market Review – April 2015

9ILCL-ILSL Monthly Economy and Market Review – December 2014
Interest Rate (Continued):Annual Call Money Interest Rate (%)
For further information
Call us at : +8801929996677-8 orEmail us at : [email protected]
www.il-capital.com
Source: Bangladesh Bank and IL Capital Research
Annual Call Money Interest Rate (%)
The banking industry insiders are anticipating that the spread may fall below 5.0% in the near future due to excess liquidity with banks. The central bank has been strictly monitoring the banks and has been advising them to cut down their lending rates to attract clients and facilitate investment opportunities. According to Bangladesh Bank, the spread has been only maintained by 20banks out of 56 banks and range between 5.0% to 10.29%.
Lending Rate , Deposit Rate and Spread (%)
9.6 10.2
4.4
11.2
12.8
8.4
4.0
5.0
6.0
7.0
8.0
9.0
10.0
11.0
12.0
13.0
14.0
2005
2006
2007
2008
2009
2010
2011
2012
2013
2014
7.2
6.3
6.7
8.4
7.8
8.6
7.7
5.0 5.5 6.0 6.5 7.0 7.5 8.0 8.5 9.0
Mar
ch
April
May
June July
Augu
st
Sept
embe
r
Oct
ober
Nove
mbe
r
Dece
mbe
r
Janu
ary
Febr
uary
Mar
ch
2013-14 2014-15
5.47
5.56
5.53
5.42
5.41
5.33
5.13
5.05
5.06
4.99
4.98
5.13
5.02
5.01
5.01
4.95
4.97
5.06
4.99
5.06
5.15
5.14
5.22
5.31
5.13
5.12
5.10
5.09
5.17
5.21
5.06
5.04
13.95
12.23
8.34
7.19 6.00
7.00
8.00
9.00
10.00
11.00
12.00
13.00
14.00
15.00
July
Augu
st
Sept
embe
r
Oct
ober
Nove
mbe
r
Dece
mbe
r
Janu
ary
Febr
uary
Mar
ch
April
May
June July
Augu
st
Sept
embe
r
Oct
ober
Nove
mbe
r
Dece
mbe
r
Janu
ary
Febr
uary
Mar
ch
April
May
June July
Augu
st
Sept
embe
r
Oco
tber
Nove
mbe
r
Dece
mbe
r
Janu
ary
Febr
uary
2012-13 2013-14 2014-15
Spread Advance Deposit
8ILCL-ILSL Monthly Economy and Market Review – April 2015

Although the DSEX suffered a loss in the last few months and even had nosed dived towards DSEX 4200 level in the previous month of March 2015, the current month market movement is indicating some shake ups and has already started to shoot up the index chart. The institutional investors have recently decided to play an active role to motivate the investors and assured them to gain back their level of confidence in the market.
The Financial and Reporting Act which is soon to be approved by the parliament may also boost up investor’s confidence in the near future. The market, although currently facing transparency issues, the related associations and regulators are constantly focusing on incorporating measures that will benefit the investors and gain their confidence to uphold a stable market.
The number of new beneficiary owner (BO) accounts is on the rise in recent months although the market was undergoing trouble time. It was gathered that almost 87,782 new BO accounts were opened in the first four months in 2015, making the total number of active BO accounts reach 32, 23,834 on April 30, according to CDBL. The rise in BO accounts is associated with the rise in initial public offering (IPO) in recent months. Already in FY2014-15, five new companies have raised funds through IPO. Approximately 21 companies have had gone through the IPO process in the past fiscal year. The IPO trend indicates that the companies in the market are set to mobilize funds, which will eventually help develop a bullish market trend.
Considering the region, it can be concluded that most robust equity returns in Asia have come from the south region in the year 2014. Indices in India, Indonesia, the Philippines, and Thailand were up by 20%, while Japan’s benchmark Nikkei 225 index was down 2.5%, and the MSCI Korea index was down 0.4%. Stocks in China and Taiwan have raise by 9% and 6.8% respectively. The rising stock price, slower economic growth and shifting of investments, are making the other smaller markets in the Southeast Asia more attractive to foreign investors.
There is a mixed picture of IPO and stock valuation in the region. Global experts suggests that the Southeast Asian countries can achieve a bullish market if economic conditions are maintained to perform in the current growth rates and if the fundamental stock prices remain less expensive for the investors.
In the South Asian region, majority of the countries IPOs have comparatively slowed down very recently. Singapore has IPO proceeds totaling USD 12.5 million this year, which was USD 2.56 billion last year. The attraction over the market is thought to have lessened after the decline in liquidity due to penny stocks scandal in 2013. On the other hand, in Malaysia the IPO proceeds amounted to USD 10.9 million, which was only a 1% rise from its previous year. Malaysia is one of Asia’s largest petroleum exporters. A drop in the fuel price actually made foreign investors sell Malaysian equities which dampened the country’s market conditions. An almost similar state is residing in Philippines, where there have not been any IPO proceeds for the current year. Thailand in contrast has rising IPO deals and in its long-term projections, the country plans to incorporate relaxed rules to promote itself as a fundraising center for companies in neighboring countries such as Cambodia and Laos.
Drawing back focus on the Bangladesh market, one can observe the demand for IPOs through the amount of over subscriptions rate. With the initiatives from the regulators encouraging more liberalization but strict monitoring system and with few blue-chip IPOs that are coming to be listed soon (Banglalink, Robi Axiata), the country’s stock exchange indeed dictates a bullish trend in near future.
An Overview of IPO Market: A Recent Snapshot from Home and South Asia
Source: IL Capital Research
IPO Proceeds in Southeast Asia (USD Mn)
40 11 13343
0
1403
0
1000
2000
3000
4000
5000
6000
Bang
lade
sh
Mal
aysia
Sing
apor
e
Indo
nesia
Phili
ppin
es
Thai
land
2013 2014 2015(as of April)
9ILCL-ILSL Monthly Economy and Market Review – April 2015

10ILCL-ILSL Monthly Economy and Market Review – April 2015
Sources: DSE and IL Capital Research
The benchmark index of Dhaka Stock Exchange (DSEX) was down by 10.7% in April 2015 and 16.8% Year-to-Date.
During the month of April 2015, Market (DSEX) closed down mainly driven by the down-trend in share prices of Life Insurance, NBFIs, General Insurance, Tannery & Footwear and Fuel & Power.
The major sectors that set backed during the month of April 2015 were Life Insurance (-23.7%), NBFIs (-21.6%) and General Insurance (-15.4%).
On the other hand, the major gainer sector was Ceramics (2.7%) in April 2015.
Among the companies traded in the Dhaka Stock Exchange (DSE), Gemini Sea Food (34.3%), Ifad Autos Limited (20.1%) and International Leasing & Financial Services Limited (9.1%) were the top gainers in April 2015.
On the other hand, major loser companies were Rangpur Dairy & Food Products Ltd. (-50.3%), Jute Spinners (-37.2%) and Phoenix Finance and Investments Ltd. (-34.6%) in April 2015.
During the month of April 2015 the average daily turnover in the public market of Dhaka Stock Exchange was up by 14.7% to BDT 3.26 bn form BDT 2.84 bn in March 2015.
Average daily turnover of Travel & Leisure sector increased by 281.3% followed by Ceramics (90.2%), Real Estate & services (55.2%), Pharma & Chemicals (37.3%) and Fuel & Power (29.7%) in April 2015 than that of March 2015.
However, average daily turnover of Cements, Banks, Mutual Funds, Tannery & Footwear and Telecommunication sectors declined by 45.7%, 33.5%, 27.2%, 21.6% and 15.1% respectively in the same period.
There are sectors that have outperformed DSEX Year-To-Date namely Foods by 27.2%, Pharma & Chemicals by 14.1% and Tannery & Footwear by 6.8% as of April 30th 2015.
On the other hand, Travel & Leisure, NBFIs and Insurances have underperformed DSEX Year-To-Date as of April 30th 2015 by 15.0%, 13.7% and 11.3% respectively.
Market capitalization of DSE decreased by 10.2% to BDT 2.34 trillion (USD 30.05 billion) as of April 30th 2015 from BDT 2.60 trillion (USD 33.48 billion) in March 31st 2015.
Two securities were listed in DSE in April 2015, which are: Bangladesh Steel Re-Rolling Mills and United Power Generation & Distribution Company under Engineering and Fuel & Power sector respectively.
MARKET UPDATE:
DSEX and Turnover movement in DSE
1000
3500
6000
8500
11000
13500
3350
3850
4350
4850
5350
5850
02-0
5-20
1315
-05-
2013
29-0
5-20
1311
-06-
2013
24-0
6-20
1309
-07-
2013
22-0
7-20
1304
-08-
2013
22-0
8-20
1305
-09-
2013
18-0
9-20
1301
-10-
2013
21-1
0-20
1303
-11-
2013
14-1
1-20
1327
-11-
2013
10-1
2-20
1324
-12-
2013
09-0
1-20
1423
-01-
2014
05-0
2-20
1418
-02-
2014
03-0
3-20
1416
-03-
2014
31-0
3-20
1413
-04-
2014
27-0
4-20
1411
-05-
2014
25-0
5-20
1405
-06-
2014
18-0
6-20
1402
-07-
2014
15-0
7-20
1404
-08-
2014
17-0
8-20
1428
-08-
2014
11-0
9-20
1424
-09-
2014
14-1
0-20
1427
-10-
2014
10-1
1-20
1423
-11-
2014
04-1
2-20
1418
-12-
2014
05-0
1-20
1518
-01-
2015
29-0
1-20
1511
-02-
2015
24-0
2-20
1509
-03-
2015
23-0
3-20
1506
-04-
2015
20-0
4-20
15
Trade Value (BDT mn) DSEX

11ILCL-ILSL Monthly Economy and Market Review – April 2015
Source: DSE and IL Capital Research
Source: DSE and IL Capital Research
Source: DSE and IL Capital Research
DSEX and Sectors Movement in DSE (Monthly) Average Tunrover Movement in DSE (Monthly)
Note: Sector movement considers changes in Market Capitalization of the sectors Note: Average Turnover excludes Block and Oddlot Market transaction
BDT mn USD mn Weight (%) BDT mn USD mn Weight (%)
Equity 2,311,997.1 29,736.3 98.9% 2,576,146.0 33,133.7 99.0% -10.3%
Mutual Fund 24,712.0 317.8 1.1% 27,221.6 350.1 1.0% -9.2%
Total 2,336,709.1 30,054.1 100.0% 2,603,367.7 33,483.8 100.0% -10.2%
Note: Exchange Rate USD 1 : BDT 77.75
Change (%)
Market Capitalization of DSE
Instruments30-Apr-15 31-Mar-15
-10.7%
-8.0%
-21.6%
-15.4%
-23.7%
-11.5%
-9.5%
-10.2%
-10.5%
-14.0%
-6.0%
2.7%
-2.8%
-21.9%
-13.6%
-15.6%
-14.3%
-5.9%
-21.3%
-10.2%
-9.2%
-30.0% -25.0% -20.0% -15.0% -10.0% -5.0% 0.0% 5.0% 10.0% 15.0%
DSEX
Banks
NBFIs
General Insurances
Life Insurances
Fuel and Power
Telecommunication
Pharma And Chemicals
Textiles
Engineering
Cement
Ceramics
Foods
IT
Miscellaneous
Tannery and Footwear
Travel & Leisure
Real Estate and Service
Paper & Printing
Jute
Mutual Funds
14.7%
-33.5%
3.1%
-12.7%
19.7%
29.7%
-15.1%
37.3%
9.1%
26.6%
-45.7%
90.2%
24.0%
28.6%
7.3%
-21.6%
281.3%
55.2%
11.4%
-44.3%
-27.2%
-100.0% -50.0% 0.0% 50.0% 100.0% 150.0% 200.0% 250.0% 300.0% 350.0%
DSEX
Banks
NBFIs
General Insurances
Life Insurances
Fuel and Power
Telecommunication
Pharma And Chemicals
Textiles
Engineering
Cement
Ceramics
Foods
IT
Miscellaneous
Tannery and Footwear
Travel & Leisure
Real Estate and Service
Paper & Printing
Jute
Mutual Funds
1 GEMINISEA 34.3% 1 RDFOOD -50.3%
2 IFADAUTOS 20.1% 2 JUTESPINN -37.2%
3 ILFSL 9.1% 3 PHOENIXFIN -34.6%
4 MHSML 8.4% 4 PRIMELIFE -33.3%
5 ACIFORMULA 8.1% 5 RAHIMAFOOD -32.8%
6 RAKCERAMIC 7.4% 6 MEGHNACEM -32.2%
7 SAIFPOWER 5.9% 7 GOLDENSON -31.8%
8 NORTHERN 4.7% 8 FAREASTFIN -31.2%
9 TUNGHAI 3.9% 9 NTLTUBES -30.2%
10 BANKASIA 3.0% 10 POPULARLIF -29.9%
Top Gainers This Month Top Losers This Month

65.0
90.0
115.0
140.0
165.0
Apr
-13
May
-13
Jun-
13
Jul-1
3
Aug
-13
Sep-
13
Oct
-13
Nov
-13
Dec
-13
Jan-
14
Feb-
14
Mar
-14
Apr
-14
May
-14
Jun-
14
Jul-1
4
Aug
-14
Sep-
14
Oct
-14
Nov
-14
Dec
-14
Jan-
15
Feb-
15
Mar
-15
Apr
-15
DSEX (rebased) Banks NBFIs Insurances
75.0
125.0
175.0
225.0
275.0
Apr
-13
May
-13
Jun-
13
Jul-1
3
Aug
-13
Sep-
13
Oct
-13
Nov
-13
Dec
-13
Jan-
14
Feb-
14
Mar
-14
Apr
-14
May
-14
Jun-
14
Jul-1
4
Aug
-14
Sep-
14
Oct
-14
Nov
-14
Dec
-14
Jan-
15
Feb-
15
Mar
-15
Apr
-15
DSEX (rebased) Fuel and Power Telecommunication Pharma And Chemicals
75.0
125.0
175.0
225.0
275.0
325.0
Apr
-13
May
-13
Jun-
13
Jul-1
3
Aug
-13
Sep-
13
Oct
-13
Nov
-13
Dec
-13
Jan-
14
Feb-
14
Mar
-14
Apr
-14
May
-14
Jun-
14
Jul-1
4
Aug
-14
Sep-
14
Oct
-14
Nov
-14
Dec
-14
Jan-
15
Feb-
15
Mar
-15
Apr
-15
DSEX (rebased) Textiles Engineering Cement
75.0
125.0
175.0
225.0
275.0
325.0
375.0
Apr
-13
May
-13
Jun-
13
Jul-1
3
Aug
-13
Sep-
13
Oct
-13
Nov
-13
Dec
-13
Jan-
14
Feb-
14
Mar
-14
Apr
-14
May
-14
Jun-
14
Jul-1
4
Aug
-14
Sep-
14
Oct
-14
Nov
-14
Dec
-14
Jan-
15
Feb-
15
Mar
-15
Apr
-15
DSEX (rebased) Foods IT Tannery and Footwear
35.0
85.0
135.0
185.0
235.0
285.0
Apr
-13
May
-13
Jun-
13
Jul-1
3
Aug
-13
Sep-
13
Oct
-13
Nov
-13
Dec
-13
Jan-
14
Feb-
14
Mar
-14
Apr
-14
May
-14
Jun-
14
Jul-1
4
Aug
-14
Sep-
14
Oct
-14
Nov
-14
Dec
-14
Jan-
15
Feb-
15
Mar
-15
Apr
-15
DSEX (rebased) Travel & Leisure Real Estate and Service Mutual Funds
12ILCL-ILSL Monthly Economy and Market Review – April 2015
Note: The sector Indices are market capitalization weighted indices. Should you require any further clarification over index calculation methodology, please don’t hesitate to contact IL Capital Research Team.
DSEX vs Sectors Movement (Base Value: 100)

13ILCL-ILSL Monthly Economy and Market Review – April 2015
Sources: www.bloomberg.com, www.imf.org, wikipedia.com, DSE and IL Capital Research
Sources: www.bloomberg.com, www.imf.org, wikipedia.com, DSE and IL Capital Research
PEG ratio = PE ratio of the major stock exchange of the country /GDP Growth of the country in 2013. We assume that listed companies' aggregate earnings growth is reflected in GDP growth rate of the country.
Price to Earning Ratio Market Cap. To GDP Ratio (%)
GDP Growth Rate in 2013 (%) PEG Ratio (PE Ratio to GDP Groth Rate)
As on April 30th 2015, Bangladesh (DSE) is trading at 14.4x PE, which is lower than that of Philippine (21.6x), India (20.0x) and Indonesia (21.1x). However, Bangladesh (DSE) is trading higher than that of Pakistan (10.3x), Sri Lanka (13.0x) and Vietnam (12.4x).
• The PEG (Price Earning Growth) Ratio of Bangladesh as on April 2015 is 2.4x which is lower than that of Singapore (3.8x), Malaysia (3.5x), Indonesia (4.0x) and India (4.3x). However, it is higher than that of Srilanka (2.1x) and Vietnam (2.3x).
•
14.4x
20.0x
10.3x
13.0x
21.6x
19.9x
16.7x
15.4x
12.4x
21.1x
Bang
lade
sh
Indi
a
Paki
stan
Sri L
anka
Phili
ppin
es
Thai
land
Mal
aysia
Sing
apor
e
Viet
nam
Indo
nesia
20%
40%
27%36%
73%
101%
87%
160%
28%
40%
Bang
lade
sh
Indi
a
Paki
stan
Sri L
anka
Phili
ppin
es
Thai
land
Mal
aysia
Sing
apor
e
Viet
nam
Indo
nesia
6.1%
4.7%
3.6%
6.3%
6.8%
2.9%
4.7%
4.1%
5.3% 5.3%
Bang
lade
sh
Indi
a
Paki
stan
Sri L
anka
Phili
ppin
es
Thai
land
Mal
aysia
Sing
apor
e
Viet
nam
Indo
nesia
2.4x
4.3x
2.9x
2.1x
3.2x
6.9x
3.5x3.8x
2.3x
4.0x
Bang
lade
sh
Indi
a
Paki
stan
Sri L
anka
Phili
ppin
es
Thai
land
Mal
aysia
Sing
apor
e
Viet
nam
Indo
nesia
Country Index Symbol Index Point 52-Week Low 52-Week High PE Ratio PEG Ratio M. Cap (USD bn)Bangladesh DSEX 4,047 4.02K 5.37K 14.4x 2.4x 30.1
India SENSEX 26,925 22.28K 30.02K 20.0x 4.3x 704.6
Pakistan KSE100 33,510 27.35K 35.06K 10.3x 2.9x 63.7
Sri Lanka CSEALL 7,185 6.19K 7.67K 13.0x 2.1x 23.1
Philippines PCOMP 7,715 6.64K 8.14K 21.6x 3.2x 198.0
Thailand SET 1,525 1.37K 1.62K 19.9x 6.9x 428.1
Malaysia FBMKLCI 1,825 1.67K 1.90K 16.7x 3.5x 296.8
Singapore FSSTI 3,475 3.15K 3.55K 15.4x 3.8x 431.7
Vietnam VNINDEX 565 0.51K 0.64K 12.4x 2.3x 47.9
Indonesia JCI 5,095 4.82K 5.52K 21.1x 4.0x 345.8
Regional Market Comparables

YOUR MONEY MANAGER
ILSL Research
Phone: +88-02-9577305 (Hunting); Fax: +88-02-9577691 www.ilslbd.com
Exercise Diligence, Independence and Thoroughness in Analysis
Ensure Loyalty and Fair Dealing to Clients
Uphold Professional and Ethical Manner
Conduct Investors’ Awareness Program on Regular Basis
Dedicated and Quali�ed Research Team
We Dig Through The Bottom...
YOUR MONEY MANAGER
NATURAL GAS INDUSTRY OF BANGLADESH Bangladesh has a long history of utilizing natural gas. Back in 1962 the first gas field of the Country was discovered on the bank of the Titas River in Brahmanbaria. Since then natural gas is playing a significant role for the Country’s socio-economic development. After independence, considering the economic impact of this sector the Government has ensured control over energy sector.
In 1980s, the Country’s exploration activities got momentum. During that time 12 exploration wells were drilled and 7 gas fields were discovered. With time, several policies e.g., National Energy Policy, Production Sharing Agreement (PSA) etc. were endorsed and eventually the sector become more structured. At present, Bangladesh Oil Gas and Minerals Corporation short named ‘Petrobangla’ operates oil and gas exploration, development, transmission, distribution and conversion along with development and marketing of minerals.
Present Natural Gas Reserve
Natural Gas reserve indicates those volumes of gas which are recoverable economically in the future using commercial methods and government regulations. Reservoir and Data Management Division of Petrobangla classifies reserves into three categories –
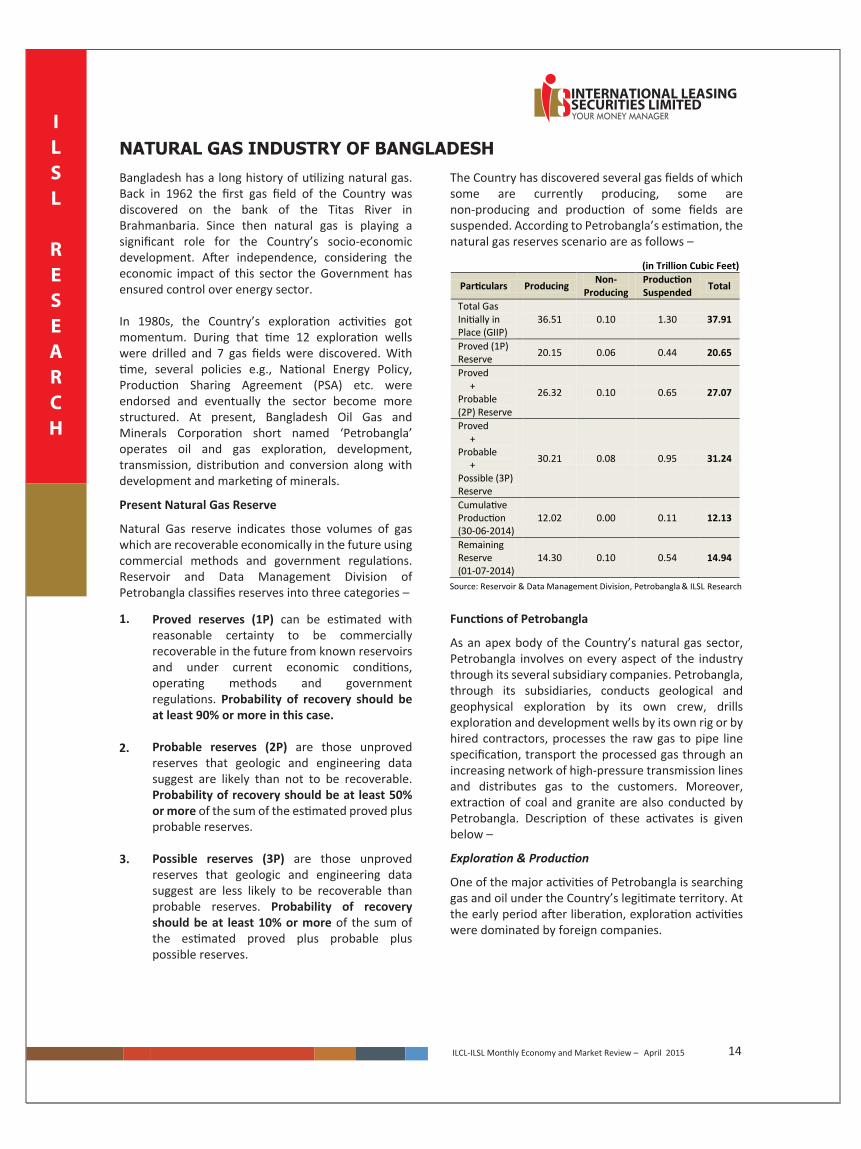
The Country has discovered several gas fields of which some are currently producing, some are non-producing and production of some fields are suspended. According to Petrobangla’s estimation, the natural gas reserves scenario are as follows –
Functions of Petrobangla
As an apex body of the Country’s natural gas sector, Petrobangla involves on every aspect of the industry through its several subsidiary companies. Petrobangla, through its subsidiaries, conducts geological and geophysical exploration by its own crew, drills exploration and development wells by its own rig or by hired contractors, processes the raw gas to pipe line specification, transport the processed gas through an increasing network of high-pressure transmission lines and distributes gas to the customers. Moreover, extraction of coal and granite are also conducted by Petrobangla. Description of these activates is given below –
Exploration & Production
One of the major activities of Petrobangla is searching gas and oil under the Country’s legitimate territory. At the early period after liberation, exploration activities were dominated by foreign companies.
14ILCL-ILSL Monthly Economy and Market Review – April 2015
ILSL
RESEARCH
Proved reserves (1P) can be estimated with reasonable certainty to be commercially recoverable in the future from known reservoirs and under current economic conditions, operating methods and government regulations. Probability of recovery should be at least 90% or more in this case.
Probable reserves (2P) are those unproved reserves that geologic and engineering data suggest are likely than not to be recoverable. Probability of recovery should be at least 50% or more of the sum of the estimated proved plus probable reserves.
Possible reserves (3P) are those unproved reserves that geologic and engineering data suggest are less likely to be recoverable than probable reserves. Probability of recovery should be at least 10% or more of the sum of the estimated proved plus probable plus possible reserves.
1.
2.
3.
(in Trillion Cubic Feet) Particulars Producing Non-
Producing Production Suspended Total
Total Gas Initially in Place (GIIP)
36.51 0.10 1.30 37.91
Proved (1P) Reserve 20.15 0.06 0.44 20.65
Proved +
Probable (2P) Reserve
26.32 0.10 0.65 27.07
Proved + Probable
+ Possible (3P) Reserve
30.21 0.08 0.95 31.24
Cumulative Production (30-06-2014)
12.02 0.00 0.11 12.13
Remaining Reserve (01-07-2014)
14.30 0.10 0.54 14.94
Source: Reservoir & Data Management Division, Petrobangla & ILSL Research
From 1980s Petrobangla actively started to explore new gas field. So far only about 82 exploration wells have been drilled, which resulted in discovery of 25 gas fields of which 27.07 TCF of Gas are recoverable. Out of these exploration wells, 20 are in the offshore with 2 discoveries and the rest 62 are on shore with 23 discoveries.
During 2009-13, 4,510 line-Km 2-Dseismic survey and 2,163 sq km 3-D seismic survey has been conducted. At the same time 7 exploratory wells have been drilled discovering 2 new gas fields. According to Petrobangla, in FY 2012-13, 19 (nineteen) gas fields were in production and out of 120 wells located in these gas fields, 93 are on stream.
At present, 3 (three) state owned oil exploration and producing companies are operating in the Country. These companies are – Bangladesh Gas Fields Company Limited (BGFCL), Sylhet Gas Fields Limited (SGFL) and Bangladesh Petroleum Exploration & Production Company Limited (BAPEX). Particular facts about these companies are presented below –
YOUR MONEY MANAGERILSL
RESEARCH
15ILCL-ILSL Monthly Economy and Market Review – April 2015
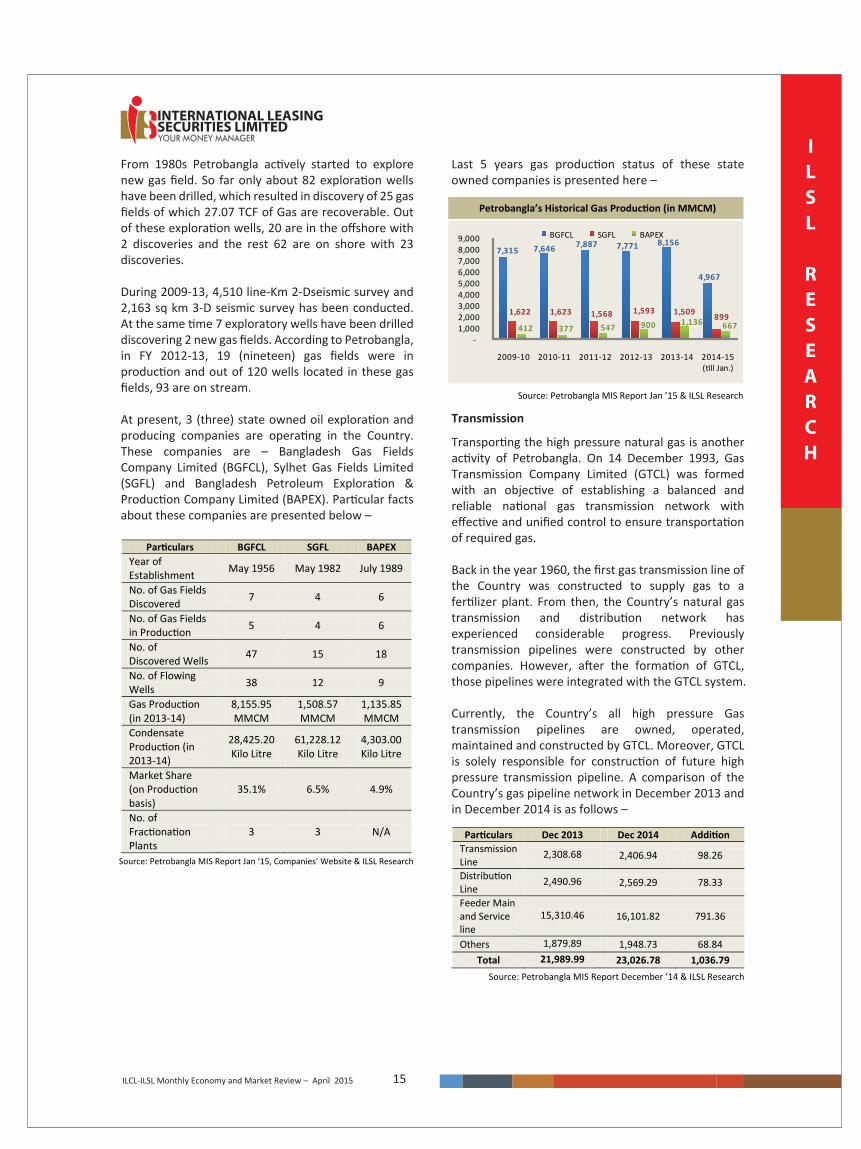
Last 5 years gas production status of these state owned companies is presented here –
Transmission
Transporting the high pressure natural gas is another activity of Petrobangla. On 14 December 1993, Gas Transmission Company Limited (GTCL) was formed with an objective of establishing a balanced and reliable national gas transmission network with effective and unified control to ensure transportation of required gas.
Back in the year 1960, the first gas transmission line of the Country was constructed to supply gas to a fertilizer plant. From then, the Country’s natural gas transmission and distribution network has experienced considerable progress. Previously transmission pipelines were constructed by other companies. However, after the formation of GTCL, those pipelines were integrated with the GTCL system.
Currently, the Country’s all high pressure Gas transmission pipelines are owned, operated, maintained and constructed by GTCL. Moreover, GTCL is solely responsible for construction of future high pressure transmission pipeline. A comparison of the Country’s gas pipeline network in December 2013 and in December 2014 is as follows –
Petrobangla’s Historical Gas Production (in MMCM)
Source: Petrobangla MIS Report Jan ’15 & ILSL Research
Particulars BGFCL SGFL BAPEX Year of Establishment May 1956 May 1982 July 1989
No. of Gas Fields Discovered 7 4 6
No. of Gas Fields in Production 5 4 6
No. of Discovered Wells 47 15 18
No. of Flowing Wells 38 12 9
Gas Production (in 2013-14)
8,155.95 MMCM
1,508.57 MMCM
1,135.85MMCM
Condensate Production (in 2013-14)
28,425.20Kilo Litre
61,228.12 Kilo Litre
4,303.00 Kilo Litre
Market Share (on Production basis)
35.1% 6.5% 4.9%
No. of Fractionation Plants
3 3 N/A
Source: Petrobangla MIS Report Jan ‘15, Companies’ Website & ILSL Research
7,315 7,646 7,887 7,771 8,156
4,967
1,622 1,623 1,568 1,593 1,509 899 412 377 547 900 1,136 667
-1,000 2,000 3,000 4,000 5,000 6,000 7,000 8,000 9,000
2009-10 2010-11 2011-12 2012-13 2013-14 2014-15 (till Jan.)
BGFCL SGFL BAPEX
Particulars Dec 2013 Dec 2014 Addition Transmission Line
2,308.68 2,406.94 98.26
Distribution Line
2,490.96 2,569.29 78.33
Feeder Main and Service line
15,310.46 16,101.82 791.36
Others 1,879.89 1,948.73 68.84 Total 21,989.99 23,026.78 1,036.79
Source: Petrobangla MIS Report December ’14 & ILSL Research
Distribution System Ltd. (JGTDSL), Bakhrabad Gas Distribution Company Ltd. (BGDCL), Paschimanchal Gas Company Ltd. (PGCL), Karnaphuli Gas Distribution Company Ltd. (KGDCL) and Sundarban Gas Company Ltd. (SGCL). Among these companies, commercial operation of Sundarban Gas Company Ltd. (SGCL) is yet to start. A side by side information table about these companies is given below –
Marketing
Petrobangla has formed 6 (six) marketing companies to ensure allocation of natural gas at the different parts of the Country. Each company has designated area for marketing natural gas. The customer basket of these companies is ranging from large power and fertilizer plants to small households and business.
The six marketing companies are – Titas Gas T&D Company Ltd. (TGTDCL), Jalalabad Gas Transmission &
16
ILSL
RESEARCH
YOUR MONEY MANAGER
ILCL-ILSL Monthly Economy and Market Review – April 2015
Particulars TGTDCL BGDCL JGTDSL PGCL KGDCL SGCL Date of Incorporation 20-Nov-1964 7-Jun-1980 1-Dec
N/A
-1986 29-Nov-1999 8-Feb-2010 23-Nov-2009
Commercial Operation Started 28-Apr-1968 20-May-1984 23-Apr-2000 1-Jul -2010
Commercial Operation does
not start yet
Franchise Area Greater Dhaka
and Greater Mymensingh
Chittagong Division,
greater Comilla and greater
Noakhali District
The greater Sylhet district
Rajshahi Division
Chittagong & Chittagong Hill
Tract
Khulna, Barisal and Part of
Dhaka Divisions
Gas Purchased (in 2013-14)
14,805.98 MMCM
3,059.12 MMCM
2,153.71 MMCM
1,036.57 MMCm
2,165.44 MMCM N/A
Gas Sold (in 2013-14)
14,739.45 MMCM
3,151.71 MMCM
2,142.96 MMCM
1,076.64 MMCM
2,339.6 MMCM N/A
Market Share (2013-14) 62.9% 13.4% 9.1% 4.6% 10.0% 0.0%
Total Length of Pipeline: Transmission 613.23 km 67.46 km 465.06 km 1.82 km - - Distribution 648.84 km 207.99 km 1,330.98 km 381.48 km - - Feeder Main and Service line 10,479.88 km 3,329.34 km 1,171.44 km 1,121.16 km 3,005 km -
Others 936.54 km 258.42 km 752.72 1.05 km - - Total Length of Pipeline 12,678.49 km 3,606.04 km 3,720.20 km 1,505.51 km 3,005 km N/A
Total No. of Customers: Power 35 15 13 6 5 - Fertilizer 3 1 1 - 4 - Captive Power 1,072 73 98 35 174 - Industry 4,583 157 95 80 1,040 - Commercial 10,913 2,140 1,633 319 2,787 - Tea Estate - - 93 - 1 - Brick Field 12 - - - 5 - CNG 330 87 53 28 65 - Domestic 1,790,836 344,007 198,897 102,809 501,056 - Total No. of Customers 1,807,784 346,480 200,883 103,277 505,137 N/A
Source: PB MIS Report Dec ‘14,Companies’ Website & ILSL Research

Mining
Before 1985 the Country’s mineral operation was run by Bangladesh Mineral Exploration & Development Corporation (BMEDC). On 11 April 1985, BMEDC was merged with Petrobangla. At present, Petrobangla is in charge for the mineral development in the country. The Geological Survey of Bangladesh (GSB), a permanent department of Ministry of Power, Energy and Mineral Resources, conduct the exploration part of minerals activity while subsequent development of economic deposits are undertaken by Petrobangla.
Currently Petrobangla has two underground mines, one for coal at Barapukuria which started commercial production in September 2005 and the other for hard rock at Maddhapara which started commercial production in May, 2007. Two separate companies were formed to operate the business. These companies are –
CNG/LPG
To commercialize the use of CNG in the transport sector, Rupantarita Prakritik Gas Company Limited (RPGCL) was established on 1 January 1987 as a subsidiary of Petrobangla. The company is also given the responsibility of extracting LPG from the wet gas stream and refines it for bottling and marketing. As private sector has started to enter into the industry, RPGCL is entrusting with more supervisory and
In addition to CNG business, the company also produced 6,249.55 Metric Tons LPG by processing 27.70 million litre Natural Gas Liquids (NLG) in its Fractionation plant at Kailashtilla during 2013-14.
Liquefied Natural Gas (LNG)
The Government took initiatives to minimize the intensity of natural gas crisis by importing LNG particularly to feed the Chittagong area. A memorandum of understanding (MoU) was signed with Qatar Petroleum on January 2011 to import annually 4.0 million tonnes of LNG for the use in the gas oriented industries including fertilizer factories and power plants. Recently, the Government has pursued time extension of the MoU with Qatar until 2017 to import LNG until it builds a receiving terminal.
As per Power & Energy Sector road map June 2012, the Government has plan to construct two separate LNG terminals at Moheshkhali island in the Bay of Bengal of which one will be land-based and another would be offshore. For this purpose an agreement has been signed between Petrobangla and US-based Excelerate Energy Ltd. to build the country's first floating LNG terminal with a capacity of 5.0 million tonne per year a re-gasification capacity of at least 500 million cubic feet per day (mmcfd). It will also have berthing and mooring facilities for LNG tankers with a capacity of 138,000-260,000 cubic metres. The contract will be awarded on a build-own-operate-transfer basis for 15 years and expected to finish the construction work by early 2017.
Moreover, to build an onshore LNG terminal at Matarbari on Moheshkhali Island Bangladesh's state-run Power Division Cell has selected three international firms for awarding the contract. These firms are Japan's Mitsui & Co. Ltd., India's Petronet LNG Ltd., and Royal Dutch Shell EP International Ltd. Among these firms, the bid winning company will
advisory roles over the private operators. Recent status of the Country’s CNG scenario is presented below –
ILSL
RESEARCH
YOUR MONEY MANAGER
17ILCL-ILSL Monthly Economy and Market Review – April 2015
Barapukuria Coal Mining Company Limited (BCMCL): The Company was formed on 4 August, 1998 and started partial production on 14 April, 2002. This mine has a capacity to produce about 01 (one) Million Metric Tons of coal per year. Cumulative Coal production from the mine up to December 2014 is 6.61 million Metric Tons. About 65% of the production has been used in a 250 MW coal fired power plant and rest to other domestic consumers.
Maddhapara Granite Mining Company Limited (MGMCL): To set up an underground hardrock mine at Maddhapara Dinajpur a company named Maddhapara Granite Mining Company Limited was incorporated on August 04, 1998. The Companies commercial production has started on 25th May, 2007. The mine has the capacity to produce about 1.65 million tons of hard rock per year. The mine has produced 2.60 million Metric Tons of granite till December 2014.
1.
2.
Particulars Number Total established CNG refilling stations in operation 587
CNG conversion workshop in operation 180 Total Number of Vehicles converted into CNG (as on 30 June 2014) 8,133
Total CNG run vehicles in Bangladesh 209,054 Source: RPGCL Website
changes in ownership and restructuring in the contracts have taken place. All of the onshore PSCs have matured from the exploration phase to production phase and the major areas of the blocks have been relinquished. As of April 2014, the PSC's are active in: production areas of blocks 12, 13 & 14 operated by Chevron, exploration ring fence of block 16 operated by Santos and development cum production area of block 9 by Tullow Oil in association with Niko resources and BAPEX.
At present, three IOCs are operating in the Country. These companies are – Santos, Chevron and Tullow. NIKO is another IOC having 5 wells available for production. However, since 01 May 2010 the production of Niko is temporarily suspended. As on December 2014, some basic information about currently operating IOCs are given below –
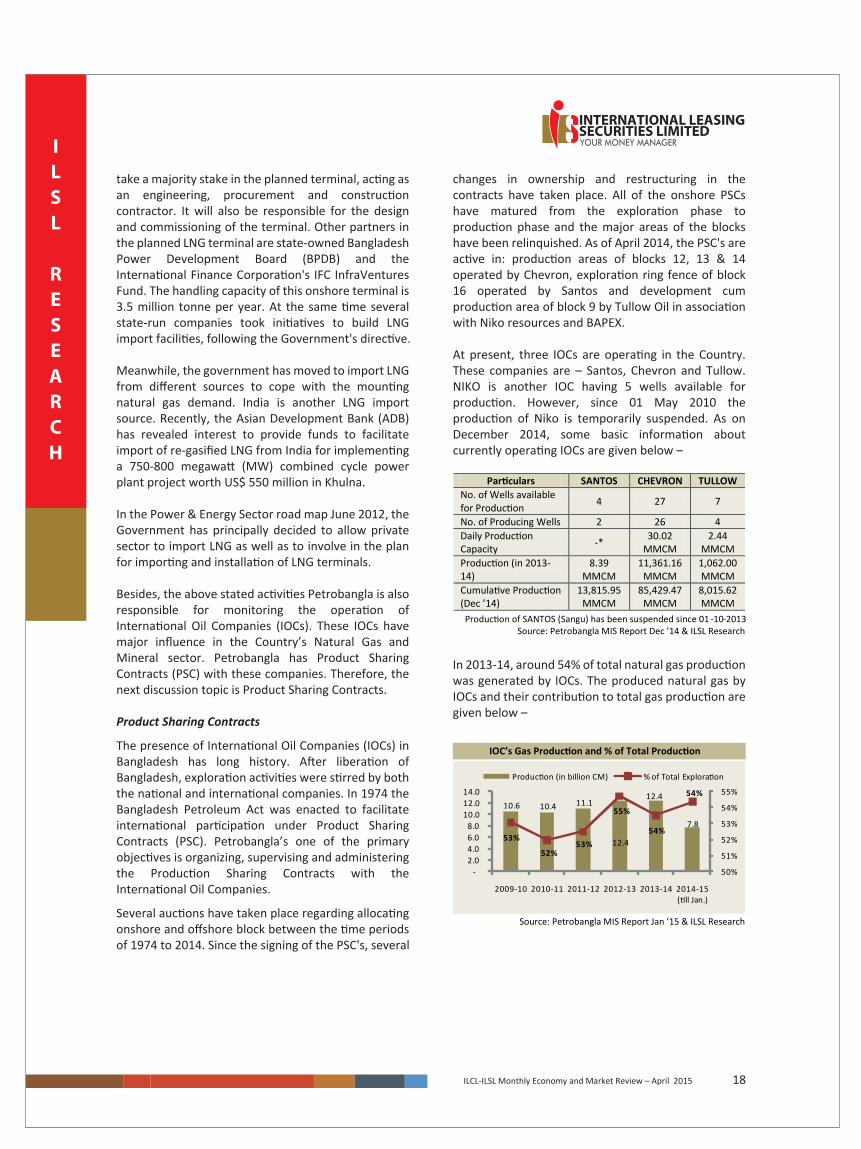
In 2013-14, around 54% of total natural gas production was generated by IOCs. The produced natural gas by IOCs and their contribution to total gas production are given below –
18
ILSL
RESEARCH
YOUR MONEY MANAGER
ILCL-ILSL Monthly Economy and Market Review – April 2015
take a majority stake in the planned terminal, acting as an engineering, procurement and construction contractor. It will also be responsible for the design and commissioning of the terminal. Other partners in the planned LNG terminal are state-owned Bangladesh Power Development Board (BPDB) and the International Finance Corporation's IFC InfraVentures Fund. The handling capacity of this onshore terminal is 3.5 million tonne per year. At the same time several state-run companies took initiatives to build LNG import facilities, following the Government's directive.
Meanwhile, the government has moved to import LNG from different sources to cope with the mounting natural gas demand. India is another LNG import source. Recently, the Asian Development Bank (ADB) has revealed interest to provide funds to facilitate import of re-gasified LNG from India for implementing a 750-800 megawatt (MW) combined cycle power plant project worth US$ 550 million in Khulna.
In the Power & Energy Sector road map June 2012, the Government has principally decided to allow private sector to import LNG as well as to involve in the plan for importing and installation of LNG terminals.
Besides, the above stated activities Petrobangla is also responsible for monitoring the operation of International Oil Companies (IOCs). These IOCs have major influence in the Country’s Natural Gas and Mineral sector. Petrobangla has Product Sharing Contracts (PSC) with these companies. Therefore, the next discussion topic is Product Sharing Contracts.
Product Sharing Contracts
The presence of International Oil Companies (IOCs) in Bangladesh has long history. After liberation of Bangladesh, exploration activities were stirred by both the national and international companies. In 1974 the Bangladesh Petroleum Act was enacted to facilitate international participation under Product Sharing Contracts (PSC). Petrobangla’s one of the primary objectives is organizing, supervising and administering the Production Sharing Contracts with the International Oil Companies.
Several auctions have taken place regarding allocating onshore and offshore block between the time periods of 1974 to 2014. Since the signing of the PSC's, several
Source: Petrobangla MIS Report Jan ’15 & ILSL Research
IOC’s Gas Production and % of Total Production
Particulars SANTOS CHEVRON TULLOW No. of Wells available for Production 4 27 7
No. of Producing Wells 2 26 4 Daily Production Capacity -* 30.02
MMCM 2.44
MMCM Production (in 2013-14)
8.39 MMCM
11,361.16 MMCM
1,062.00 MMCM
Cumulative Production (Dec ’14)
13,815.95 MMCM
85,429.47 MMCM
8,015.62 MMCM
Production of SANTOS (Sangu) has been suspended since 01Source: Petrobangla MIS Report Dec ’14 & ILSL Research
-10-2013
10.6 10.4 11.1
12.4
12.4
7.8 53%
52%53%
55%
54%
54%
50%
51%
52%
53%
54%
55%
-2.0 4.0 6.0 8.0
10.0 12.0 14.0
2009-10 2010-11 2011-12 2012-13 2013-14 2014-15 (till Jan.)
Production (in billion CM) % of Total Exploration

Supply Constraint
The supply of natural gas is not endless. Limited supply condition failed to meet the required demand. Petrobangla’s assessment indicates that, current supply of gas is around 2,380 MMCF per day which is nearly 650 MMCF shortages per day. According to Petrobangla, on January 2014, average daily gas
ILSL
RESEARCH
YOUR MONEY MANAGER
19ILCL-ILSL Monthly Economy and Market Review – April 2015
Increasing Demand
Natural Gas has substantial contribution in the Country’s socio economic development. From a single household to a large power plant, the benefit of natural gas is evident. According to Petrobangla, currently natural gas accounts for around 73% of commercial energy in the Country. Since the Country has maintained around 6% GDP growth over the last years; the annual demand of natural gas is also kept pace with the overall advancement of the economy. Petrobangla estimated that Natural Gas is substituting around USD 14.6 billion oil import annually.
According to Petrobangla’s estimation, current demand of natural gas is more than 3,000 MMCF per day of which around 80% are met through production. The demand is still mounting due to affordable price range, various usages and environment friendly features. Particularly establishment of gas fired power plants upsurge the requirement. For 2015-16, the Petrobangla has estimated that the Country’s demand for gas will be 3,800 MMCF per day.
In a Joint project by Ministry of Power, Energy and Mineral Resource of Bangladesh Government and United Nations Development Programme (UNDP), projected natural gas demand as follows –
Projection of Natural Gas Demand (in Billion Cubic Feet)
Source: Assessment of Investment and Financial Flows toMitigate Climate Change Effects in the Energy Sector May 2011
733 677 713 739 764 783 818 849 877 918
2015 2016 2017 2018 2019 2020 2021 2022 2023 2024
It is quite challenging to satisfy the entire demand with the Country’s existing gas fields. Therefore some initiatives have been taken to keep pace with continually increasing demand. By June 2016, gas production is planned to be increased by 595 MMCF per day. Of this augmentation, 480 MMCF per day will increase by June 2015 and rest 115 MMCF per day will increase by June 2016.
production was 2,332 MMCF registering 33% growth compared to that of January 2013.
Recently, Petrobangla has officially enhanced natural gas production capacity of Chevron-operated Bibiyana gas-field by 29.9% to 1,000 million cubic feet per day (MMCFD).
Gas Production in the Last 10 Years (in Billion Cubic Feet)
Source: Petrobangla & ILSL Research
527 562 601 654 703 709 744 801 820
506
2006 2007 2008 2009 2010 2011 2012 2013 2014 2015(upto Jan)
Sl. No.
Time Frame Gas Fields & Wells Flow
(MMCFD) 1
July ’14 To
June ‘15
Rashidpur # 8 25 2 Bibiyana (8 wells) 300 3 Titas # 23, 24 60 4 Rashidpur # 9,10 50 5 Begumganj # 1/A 15 6 Sundalpur # 2 15 7 Semutang # 1/A 15
Sub-Total 480 8
July ‘15 To
June ‘16
Rashidpur # 11 25 9 Sylhet # 9 10
10 Kailastila # 8 20 11 Titas # 25, 26 60
Sub-Total 115 Grand Total 595
Source:Petrobangla
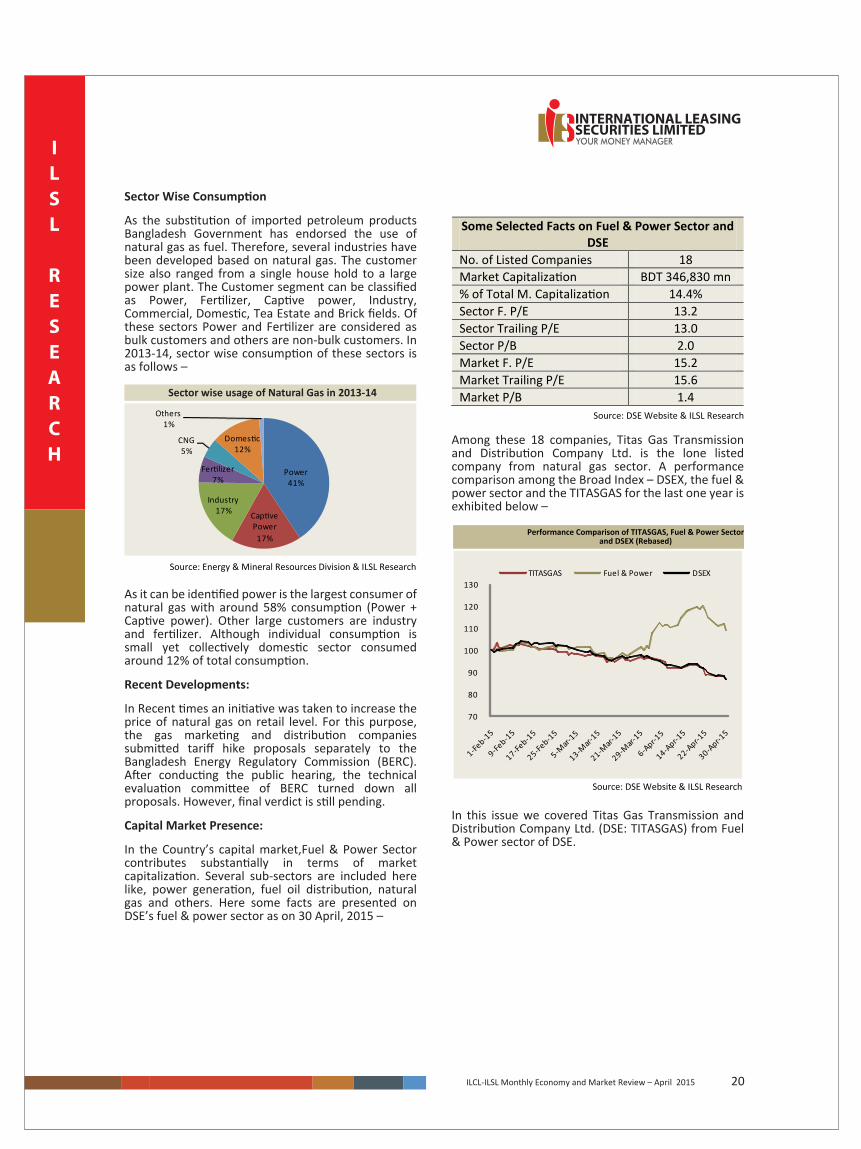
Sector Wise Consumption
As the substitution of imported petroleum products Bangladesh Government has endorsed the use of natural gas as fuel. Therefore, several industries have been developed based on natural gas. The customer size also ranged from a single house hold to a large power plant. The Customer segment can be classified as Power, Fertilizer, Captive power, Industry, Commercial, Domestic, Tea Estate and Brick fields. Of these sectors Power and Fertilizer are considered as bulk customers and others are non-bulk customers. In 2013-14, sector wise consumption of these sectors is as follows –
20
ILSL
RESEARCH
YOUR MONEY MANAGER
ILCL-ILSL Monthly Economy and Market Review – April 2015
As it can be identified power is the largest consumer of natural gas with around 58% consumption (Power + Captive power). Other large customers are industry and fertilizer. Although individual consumption is small yet collectively domestic sector consumed around 12% of total consumption.
Recent Developments:
In Recent times an initiative was taken to increase the price of natural gas on retail level. For this purpose, the gas marketing and distribution companies submitted tariff hike proposals separately to the Bangladesh Energy Regulatory Commission (BERC). After conducting the public hearing, the technical evaluation committee of BERC turned down all proposals. However, final verdict is still pending.
Capital Market Presence:
In the Country’s capital market,Fuel & Power Sector contributes substantially in terms of market capitalization. Several sub-sectors are included here like, power generation, fuel oil distribution, natural gas and others. Here some facts are presented on DSE’s fuel & power sector as on 30 April, 2015 –
Some Selected Facts on Fuel & Power Sector and DSE
No. of Listed Companies 18 Market Capitalization BDT 346,830 mn % of Total M. Capitalization 14.4% Sector F. P/E 13.2 Sector Trailing P/E 13.0 Sector P/B 2.0 Market F. P/E 15.2 Market Trailing P/E 15.6 Market P/B 1.4
Source: DSE Website & ILSL Research
Source: Energy & Mineral Resources Division & ILSL Research
Among these 18 companies, Titas Gas Transmission and Distribution Company Ltd. is the lone listed company from natural gas sector. A performance comparison among the Broad Index – DSEX, the fuel & power sector and the TITASGAS for the last one year is exhibited below –
Performance Comparison of TITASGAS, Fuel & Power Sectorand DSEX (Rebased)
Source: DSE Website & ILSL Research
In this issue we covered Titas Gas Transmission and Distribution Company Ltd. (DSE: TITASGAS) from Fuel & Power sector of DSE.
Power41%
Captive Power17%
Industry17%
Fertilizer7%
CNG5%
Domestic12%
Others1%
Sector wise usage of Natural Gas in 2013-14
70
80
90
100
110
120
130 TITASGAS Fuel & Power DSEX

Titas Gas Transmission and Distribution Company Limited (TITASGAS) was incorporated on November 20, 1964 with an objective to transmit and to distribute natural gas to the Dhaka City. Later on the franchise area of the Company has been extended to new areas of Greater Dhaka, Greater Mymensingh and Brahmanbaria which includes Dhaka Metropolitan city & suburbs. It is the largest gas transmission and distribution company in Bangladesh with 63% market share among the 6 operators under Petrobangla.
The Company started its commercial operation on 28 April 1968 by supplying gas to Siddhirganj Thermal Power Station. The first domestic gas connection was provided on October 1968. Initially 90% of its share was held by the Pakistan Government and rest 10% was held by the Pakistan Shell Oil Company. After the independence, entire shareholding of the Company was transferred to the Government of Bangladesh and eventually to Bangladesh Oil & Gas Corporation (Petrobangla).
As of June 30, 2014, the company sold 14,732.08 MMCM (Million Cubic Meter) gas. Total length of pipeline was 12,505.50 km and total number of customer stood at 1.72 million.The company got listed with the DSE and the CSE in 2008 under direct listing method.
The Company’s Board of Directors is consisted of nine members of whom two are independent members. All the members are appointed from energy & mineral resources division and different government organizations.Generally the Secretary of Energy & Mineral Resources Division leads the board.
Titas Gas Transmission and Distribution Company Limited
Company Overview
Shareholding Structure in 2013-14
Board of Directors
Source: DSE Website & ILSL Research
ILSL
RESEARCH
YOUR MONEY MANAGER
21ILCL-ILSL Monthly Economy and Market Review – April 2015
Shareholding structure
0%
Government75%
Institute16%
Public9%
Company Fundamentals (As of 30 April, 2015)
Market Cap (BDT mn) 64,892.9
Market weight 2.7%
No. of Share Outstanding (in mn) 989.2
Free-float 25.0%
Paid-up Capital (BDT mn) 9,892.0
3-month Average Turnover (BDT mn) 32.6
3-month Return -13.2%
Current Price (BDT) 65.6
52-week price range (BDT) 59.6 – 97.5
Sector Forward P/E 13.2
2011-12 2012-13 2013-142014-15 (9m
Ann.)
Sales 71,375 74,796 78,321 81,040
Profit After Tax 8,912 9,096 10,269 8,166
Assets 74,655 80,372 90,390 94,221
LT Debt 1,889 1,340 1,163 1,242
Equity 36,163 45,757 52,557 54,939
Dividend (C/B)% 30/5 35/- 38/- ---
Margin:
Gross Profit 15.4% 14.8% 15.5% 14.4%
Operating Profit 11.9% 11.2% 12.5% 9.7%
Pretax Profit 17.0% 16.6% 17.9% 14.2%
Net Profit 12.6% 12.3% 13.3% 10.1%
Growth:
Sales 4.3% 4.6% 4.1% 5.3%
Gross Profit -14.4% 0.1% 9.4% -2.4%
Operating Profit -20.1% -2.0% 16.0% -18.0%
Net Profit -2.9% 2.1% 12.9% -20.5%
Profitability:
ROA 13.3% 11.7% 12.0% 8.8%
ROE 27.7% 22.2% 20.9% 15.2%
Leverage:
Debt Ratio 3.1% 2.1% 1.5% 1.4%
Debt-Equity 6.4% 3.7% 2.6% 2.4%
Int. Coverage 97.1 121.9 169.2 164.1
Valuation:
Price/Earnings 7.9 8.9 7.4 7.9
Price/BV 2.0 1.8 1.4 1.2
EPS (BDT) 9.5 9.2 10.4 8.3
NAVPS (BDT) 36.6 46.3 53.1 55.5
DPS (BDT) 3.0 3.5 3.8 ---
Financial Information (BDT mn):
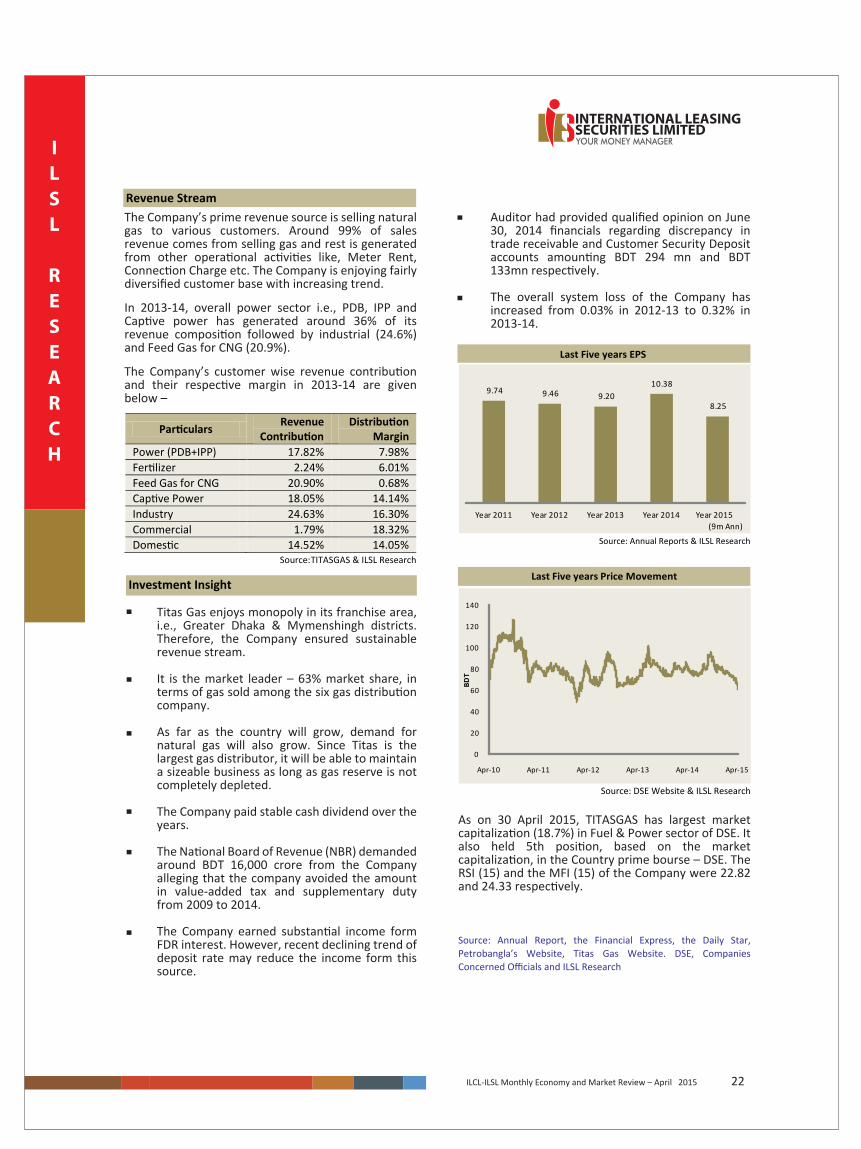
The Company’s prime revenue source is selling natural gas to various customers. Around 99% of sales revenue comes from selling gas and rest is generated from other operational activities like, Meter Rent, Connection Charge etc. The Company is enjoying fairly diversified customer base with increasing trend.
In 2013-14, overall power sector i.e., PDB, IPP and Captive power has generated around 36% of its revenue composition followed by industrial (24.6%) and Feed Gas for CNG (20.9%).
The Company’s customer wise revenue contribution and their respective margin in 2013-14 are given below –
As on 30 April 2015, TITASGAS has largest market capitalization (18.7%) in Fuel & Power sector of DSE. It also held 5th position, based on the market capitalization, in the Country prime bourse – DSE. The RSI (15) and the MFI (15) of the Company were 22.82 and 24.33 respectively.
Source: Annual Report, the Financial Express, the Daily Star, Petrobangla’s Website, Titas Gas Website. DSE, Companies Concerned Officials and ILSL Research
Revenue Stream
Last Five years EPS
Investment Insight
Titas Gas enjoys monopoly in its franchise area, i.e., Greater Dhaka & Mymenshingh districts. Therefore, the Company ensured sustainable revenue stream.
It is the market leader – 63% market share, in terms of gas sold among the six gas distribution company.
As far as the country will grow, demand for natural gas will also grow. Since Titas is the largest gas distributor, it will be able to maintain a sizeable business as long as gas reserve is not completely depleted.
The Company paid stable cash dividend over the years.
The National Board of Revenue (NBR) demanded around BDT 16,000 crore from the Company alleging that the company avoided the amount in value-added tax and supplementary duty from 2009 to 2014.
The Company earned substantial income form FDR interest. However, recent declining trend of deposit rate may reduce the income form this source.
Auditor had provided qualified opinion on June 30, 2014 financials regarding discrepancy in trade receivable and Customer Security Deposit accounts amounting BDT 294 mn and BDT 133mn respectively.
The overall system loss of the Company has increased from 0.03% in 2012-13 to 0.32% in 2013-14.
22
ILSL
RESEARCH
YOUR MONEY MANAGER
ILCL-ILSL Monthly Economy and Market Review – April 2015
Particulars Revenue Contribution
Distribution Margin
Power (PDB+IPP) 17.82% 7.98% Fertilizer 2.24% 6.01% Feed Gas for CNG 20.90% 0.68% Captive Power 18.05% 14.14% Industry 24.63% 16.30% Commercial 1.79% 18.32% Domestic 14.52% 14.05%
Source: TITASGAS & ILSL Research
Source: Annual Reports & ILSL Research
9.74 9.46 9.20 10.38
8.25
Year 2011 Year 2012 Year 2013 Year 2014 Year 2015 (9m Ann)
Source: DSE Website & ILSL Research
Last Five years Price Movement
0
20
40
60
80
100
120
140
Apr-10 Apr-11 Apr-12 Apr-13 Apr-14 Apr-15
BDT

MUTUAL FUND: MONTHLY UPDATE
ILSL
RESEARCH
YOUR MONEY MANAGER
23ILCL-ILSL Monthly Economy and Market Review – April 2015
Performance of Mutual Funds
Market Price
Cost Price
AIMS1STMF 36.19 14.24 20.5 56.6% 0.5% -23.2% 20 - 45.5 3.94 30/Jun/15 AIMSGRAMEEN1 29.34 12.3 17.3 59.0% -1.1% -21.0% 16.9 - 48.5 1.57 4/Sep/15 AIMSGRAMEENS2 18.34 11.28 9.0 49.1% -0.2% -14.3% 8.7 - 17.9 1.96 2/Sep/23 AIMSRELIANCE1 11.85 11.63 5.3 44.7% -0.3% -15.9% 5.6 - 9.6 0.44 7/Jul/21 AIMS
1STICB 1542.44 228.37 1005.2 65.2% -9.7% -4.4% 842.1 - 1184 0.05 31/Mar/15 ICB2NDICB 260.37 103.88 260.4 100.0% -11.6% -3.0% 235.7 - 329 0.01 30/Jun/15 ICB3RDICB 326.86 70.64 210.0 64.2% -8.0% -7.0% 188 - 254.9 0.02 30/Sep/15 ICB4THICB 251.37 79.81 180.5 71.8% -9.9% -6.4% 185.9 - 235 0.02 31/Dec/15 ICB5THICB 218.04 61.45 172.7 79.2% -8.9% -4.1% 140 - 205 0.02 31/Mar/16 ICB6THICB 51.52 27.59 55.5 107.7% -11.0% -4.0% 49.8 - 72.4 0.20 30/Jun/16 ICB7THICB 93.2 39.27 77.0 82.6% -10.2% -5.4% 75 - 105 0.06 30/Sep/16 ICB8THICB 61.4 34.25 61.1 99.5% -11.3% -4.2% 53.2 - 75 0.08 31/Dec/16 ICB
1STPRIMFMF 8.24 15.9 9.9 120.1% -0.4% -16.1% 9.1 - 20.7 1.29 17/Mar/16 ICB AMCLICB1STNRB 20.3 34.13 16.9 83.3% -9.9% -11.5% 15.7 - 31.9 0.07 28/Mar/17 ICB AMCLICB2NDNRB 9.13 14.94 5.6 61.3% -10.3% -16.4% 5.7 - 11 0.51 27/Jul/18 ICB AMCLICB3RDNRB 6.38 11.4 3.9 61.1% -9.6% -4.9% 3.7 - 5.5 0.34 24/May/20 ICB AMCLICBAMCL2ND 7.14 13.16 3.9 54.6% -9.6% -17.0% 3.8 - 6.8 0.15 28/Oct/19 ICB AMCLICBEPMF1S1 6.85 11.81 3.9 56.9% -9.4% -9.3% 3.6 - 6.1 0.23 18/Jan/20 ICB AMCLICBSONALI1 8.78 11.16 4.9 55.8% -6.3% -19.7% 4.7 - 9.5 0.17 12/Jun/23 ICB AMCLIFILISLMF1 8.65 11.47 5.1 59.0% -7.3% -13.6% 4.8 - 8 0.84 22/Nov/20 ICB AMCLPF1STMF 6.66 11.55 4.0 60.1% -9.0% -9.1% 4 - 6.3 0.11 9/May/20 ICB AMCLPRIME1ICBA 7.11 11.74 3.8 53.4% -8.7% -11.6% 3.7 - 6.1 0.14 2/Feb/20 ICB AMCL
AIBL1STIMF 9.41 10.89 4.2 44.6% -4.1% -4.5% 3.7 - 9 0.30 10/Jan/21 LR GlobalDBH1STMF 9.08 10.86 3.7 40.7% -3.8% -9.8% 3.7 - 6.7 0.43 7/Feb/20 LR GlobalGREENDELMF 9.35 10.59 3.7 39.6% -3.3% -11.9% 3.8 - 6.3 0.32 28/Sep/20 LR GlobalLRGLOBMF1 9.66 10.96 3.5 36.2% 2.5% 0.0% 3.3 - 7 0.69 19/Sep/21 LR GlobalMBL1STMF 9.19 10.9 3.4 37.0% -3.7% -15.0% 3.4 - 8.9 0.26 8/Feb/21 LR GlobalNCCBLMF1 9.19 10.9 3.4 37.0% -2.1% -5.6% 3.3 - 7.5 1.96 24/May/22 LR Global
1JANATAMF 10.22 11.3 4.2 41.1% -4.6% -8.7% 4.1 - 7.2 0.38 20/Sep/20 RACEABB1STMF 11.35 11 5.0 44.1% -3.8% -10.7% 4.5 - 7.5 0.04 29/Jan/22 RACEEBL1STMF 9.13 11.58 4.2 46.0% -5.7% -10.6% 4 - 7 0.25 19/Aug/19 RACEEBLNRBMF 9.6 10.9 4.0 41.7% -5.0% -4.8% 4 - 7.5 0.03 23/May/21 RACEEXIM1STMF 10.27 10.69 6.0 58.4% -4.6% -9.1% 5.7 - 9.3 0.00 16/Jul/23 RACEFBFIF 10.37 10.71 5.9 56.9% -3.1% -1.7% 5.4 - 10 0.01 19/Mar/22 RACEIFIC1STMF 9.87 11.21 4.0 40.5% -5.0% -7.0% 3.9 - 7.1 0.30 1/Apr/20 RACEPHPMF1 9.62 11.54 4.0 41.6% -5.1% -7.0% 3.9 - 6.7 0.67 29/Nov/20 RACEPOPULAR1MF 10.37 11.6 4.1 39.5% -4.0% -8.9% 3.9 - 6.9 0.91 19/Oct/20 RACETRUSTB1MF 9.89 10.9 4.1 41.5% -5.1% -10.9% 4 - 7.9 0.72 27/Jan/20 RACE
NLI1STMF 12.18 12.66 8.1 66.5% -3.9% -3.6% 6.7 - 9.7 0.42 27/Feb/22 VIPBSEBL1STMF 11.6 12.23 8.0 69.0% -5.0% -2.4% 6.6 - 9.4 0.43 23/May/21 VIPB
Source: DSE, ILSL Research
52-Week Price Range
Avg Monthly Turnover (BDT
mn)
Year of Redemption
Asset Manager
Name of FundNAV Per Unit @ Price
26 Feb, 2015
Close Price/NAV per Unit
% Change in NAV
% Change in Price
Mutual Fund Sector of DSE posted 8.63% loss over the month (29 March - 30 April, 2015), while the prime index of thebourse, DSEX, decreased by 10.2%. Price of 1 Mutual Fund remain unchanged and 40 Mutual Funds decreased over the period.On the other hand, NAV @ Market Price of 2 Mutual Funds increased and 39 Mutual Funds decreased. Out of 41 MutualFunds, 38 were traded below their respective NAV. LR Global Mutual Fund had the lowest Price/NAV ratio (38.2%) whereas1STPRIMFMF was traded at highest Price/NAV ratio (120.1%).
Mutual Fund Sector of DSE posted 8.63% loss over the month (29 March - 30 April, 2015), while the prime index of thebourse, DSEX, decreased by 10.2%. Price of 1 Mutual Fund remain unchanged and 40 Mutual Funds decreased over the period.On the other hand, NAV @ Market Price of 2 Mutual Funds increased and 39 Mutual Funds decreased. Out of 41 MutualFunds, 38 were traded below their respective NAV. LR Global Mutual Fund had the lowest Price/NAV ratio (38.2%) whereas1STPRIMFMF was traded at highest Price/NAV ratio (120.1%).

Mutual Fund : Monthly UpdateMonthly Top 10 AnalysisHighest Return % Change in NAV Lowest Return % Change in NAV Turover Leader Avg Turnover (BDT mn)LRGLOBMF1 2.5% 2NDICB -11.6% AIMS1STMF 3.9 AIMS1STMF 0.5% 8THICB -11.3% NCCBLMF1 2.0 GRAMEENS2 -0.2% 6THICB -11.0% GRAMEENS2 2.0 RELIANCE1 -0.3% ICB2NDNRB -10.3% GRAMEEN1 1.6 1STPRIMFMF -0.4% 7THICB -10.2% 1STPRIMFMF 1.3 GRAMEEN1 -1.1% ICB1STNRB -9.9% POPULAR1MF 0.9 NCCBLMF1 -2.1% 4THICB -9.9% IFILISLMF1 0.8 FBFIF -3.1% 1STICB -9.7% TRUSTB1MF 0.7 GREENDELMF -3.3% ICB3RDNRB -9.6% LRGLOBMF1 0.7 MBL1STMF -3.7% ICBAMCL2ND -9.6% PHPMF1 0.7
Monthly Price Return
Mutual Funds Trading at Premium/Discount
Performance of Asset Managers
Asset Manager % of Total AUMNAV @
Market Price/Cost Price
Paid-Up Capital
(BDT in mn)AIMS 14.2% 1.81 3,140 ICB 6.3% 3.40 178 ICB AMCL 11.7% 0.63 7,150 LR Global 17.3% 0.86 8,896 RACE 46.7% 0.92 22,181 VIPB 3.7% 0.95 1,501
Source: DSE, ILSL Research1,771 -4.6%
5,643 -8.8%8,354 -1.7%
22,508 -4.3%
Assets Under Management (AUM) (BDT mn)
Monthly Return on Portfolio
6,840 -0.1%3,037 -9.9%
0.0%
-1.7
%-2
.4%
-3.0
%-3
.6%
-4.0
%-4
.1%
-4.2
%-4
.4%
-4.5
%-4
.8%
-4.9
%-5
.4%
-5.6
%-6
.4%
-7.0
%-7
.0%
-7.0
%-8
.7%
-8.9
%-9
.1%
-9.1
%-9
.3%
-9.8
%-1
0.6%
-10.
7%-1
0.9%
-11.
5%-1
1.6%
-11.
9%-1
3.6%
-14.
3%-1
5.0%
-15.
9%-1
6.1%
-16.
4%-1
7.0%
-19.
7%-2
1.0%
-23.
2%
LRGL
OBM
F1FB
FIF
SEBL
1STM
F2N
DICB
NLI1
STM
F6T
HICB
5THI
CB8T
HICB
1STI
CBAI
BL1S
TIM
FEB
LNRB
MF
ICB3
RDNR
B7T
HICB
NCCB
LMF1
4THI
CBIF
IC1S
TMF
PHPM
F13R
DICB
1JAN
ATAM
FPO
PULA
R1M
FEX
IM1S
TMF
PF1S
TMF
ICBE
PMF1
S1DB
H1ST
MF
EBL1
STM
FAB
B1ST
MF
TRUS
TB1M
FIC
B1ST
NRB
PRIM
E1IC
BAGR
EEND
ELM
FIF
ILIS
LMF1
GRAM
EENS
2M
BL1S
TMF
RELI
ANCE
11S
TPRI
MFM
FIC
B2ND
NRB
ICBA
MCL
2ND
ICBS
ONA
LI1
GRAM
EEN1
AIM
S1ST
MF
120.
1%10
7.7%
100.
0%99
.5%
83.3
%82
.6%
79.2
%71
.8%
69.0
%66
.5%
65.2
%64
.2%
61.3
%61
.1%
60.1
%59
.0%
59.0
%58
.4%
56.9
%56
.9%
56.6
%55
.8%
54.6
%53
.4%
49.1
%46
.0%
44.7
%44
.6%
44.1
%41
.7%
41.6
%41
.5%
41.1
%40
.7%
40.5
%39
.6%
39.5
%37
.0%
37.0
%36
.2%
1STP
RIM
FMF
6THI
CB2N
DICB
8THI
CBIC
B1ST
NRB
7THI
CB5T
HICB
4THI
CBSE
BL1S
TMF
NLI1
STM
F1S
TICB
3RDI
CBIC
B2ND
NRB
ICB3
RDNR
BPF
1STM
FGR
AMEE
N1IF
ILIS
LMF1
EXIM
1STM
FIC
BEPM
F1S1
FBFI
FAI
MS1
STM
FIC
BSO
NALI
1IC
BAM
CL2N
DPR
IME1
ICBA
GRAM
EENS
2EB
L1ST
MF
RELI
ANCE
1AI
BL1S
TIM
FAB
B1ST
MF
EBLN
RBM
FPH
PMF1
TRUS
TB1M
F1J
ANAT
AMF
DBH1
STM
FIF
IC1S
TMF
GREE
NDEL
MF
POPU
LAR1
MF
MBL
1STM
FNC
CBLM
F1LR
GLO
BMF1
24
ILSL
RESEARCH
YOUR MONEY MANAGER
ILCL-ILSL Monthly Economy and Market Review – April 2015
Addressing Your Financial ConcernsIn today’s competitive world, each of you is looking for growth opportunities. While some of you are considering expansion of your existing business, others are looking for expansion in a new field. Some may feel that working capital management is the priority while others need to focus on financial efficiency. Many have suffered from high interest burden in the past while others are looking for scope to minimize tax burden to safeguard a substantial profit. Few need hands-on assistance to explore business opportunities with major industry players while others require a strategic plan to make an acquisition successful.
Yes, we are talking about financial restructuring and investment alternatives. And a lot of questions come and wait in mind. Which type of financing is the best solution? Is it going to fit the long term strategy of the organization? Is it sustain-able? Are you ready for this?
Faced with such dilemmas, what you need is an expert who can offer a wide array of financial services and benefits with comparative analyses of feasible alternatives.
Yes. IL Capital can do this for you. We o�er – • Issue Management & Underwriting • Loan Syndication & Private Equity • Merger & Acquisition • Advisory Services for any other Financial Restructuring requirement that our clients may have
Realizing Your Investment DreamWe are offering investment management solutions to both individuals and corporate entities. Our investment management team believes in continuous improvement in discovering profit making opportunities at appropriate levels of risk tolerance and liquidity need supported by detailed research and analysis.
Our team follows the economic trend, industry trend as well as individual companies and this enables it to identify profit-able investment opportunities for the clients well in advance of other market participants.
Please visit our website www.il-capital.com for further information.

Bangladesh is a top destination for producers leaving China: HSBCThe Daily Star, April 2, 2015
Bangladesh is one among the three countries that China-based factories are planning to shift their production facilities to, as the manufacture of low-cost products is increasingly becoming pricier in the world's second largest economy, according to an HSBC analy-sis. As China loses its edge in the lower end of the product scale, factories are moving to countries like Bangladesh, HSBC's recent look into Asian Economies revealed. HSBC's find is contrary to the popular belief that many Chinese factories are moving to India and Indonesia, as those are the next biggest markets in Asia where labour is still cheap. Chinese firms are making sufficient inroads into pricier areas, like smartphones and solar panels, to keep exports humming, opening up room for others to step in.
Import growth dives to 5.44pc in Jul-FebNew Age, April 04, 2015
The country’s import growth slackened to 5.44% in eight months of the current financial year 2014-15 against a 13.49% growth in the same period of the FY14 amid dull business caused by political unrest. The settlement of letters of credit in the July-February period of the FY15 stood at USD25.43 bn against USD24.12 bn during the same period of the FY14. The country had maintained a robust growth in the import financing in the last two financial years but it nosedived this financial year due to political unrest and uncertainty. LC opening in the eight months of the FY15 posted a growth of 8.14% in contrast to a 12.01-% growth in the same period of the FY14.
Remittance hits USD11.24b in nine monthsNew Age, April 04, 2015
The country’s inward remittance increased by 7.21% to USD 11.25 bn in the first nine months of the current financial year 2014-15 from USD 10.49 bn in the corresponding period of the FY14. The inward remittance had increased steadily in the first nine months of the FY15 as the banks had recently dealt a number of drawing arrangement with the foreign exchange houses due to the central bank initiatives. The inward remittances increased to USD 1.33 bn in March this year from USD 1.28 bn in the same month of 2014.
Interest rates on savings instruments may fall The Daily Star, April 6, 2015
Finance Minister AMA Muhith has hinted that the government may cut interest rates on savings instruments in the next fiscal year. Between July and February the sales of savings instruments soared 77.41% year-on-year to BDT 26,533 crore. The development is a massive setback for the government, which aimed to keep net borrowing through savings instruments within BDT 9,056 crore this fiscal year. The rate of interest on savings instrument is between 12% and 14%. In January, the weighted average interest rate on deposits was 7.26%, down from 8.34% a year ago. The government's expenditure on interest payment for savings instrument increased 23.68% to BDT 6,108 crore in the first eight months of the fiscal year, according to data from the Savings Directorate.
Export earnings rise by 3% in July-March periodDhaka Tribune, April 07, 2015 The country’s export earnings rose by nearly 3% riding on the RMG sector in the first nine months of the current fiscal year. In July-March of FY 2014-15, Bangladesh earned USD22.9bn by exporting goods which is 2.97% higher compared to the same period last year. RMG sector, the highest export earner, contributes over 81% to the total export earnings. As per the provisional data, woven sector earned USD9.55bn, which was 3.6% higher compared to the same period last year, while Knitwear earned USD9.05bn posting 2.7% growth. In March, the export earnings rose by over 7%, while in February the single month export growth was 5.15%.
Inflation up for 2nd month on political unrestNew Age, April 08, 2015
The general point-to-point inflation rose for the second month in March reaching 6.27% from 6.14% in February. The inflation rose for the second month because of rise in food prices amid political unrest. The BNP-led opposition alliance launched political movement between January-March demanding a fresh national elections but the movement has subsided in recent days. Earlier, inflation increased to 6.14% in February from 6.04% in January. The food inflation at national level stood at 6.37% in March, up from 6.11% in February. The non-food inflation at national level came down to 6.12% in the month from 6.20% in February.
B u s i n e s s N e w s f l a s h
Economy
25ILCL-ILSL Monthly Economy and Market Review – April 2015

IFC, govt to launch USD1b offshore BDT-linked bondThe Daily Star, April 20, 2015
The International Finance Corporation and the Bangladesh government are set to launch a USD1 bn offshore BDT-linked bond, a move that can help internationalise the currency in the long run. An IFC team led by its Executive Vice-President Jin-Yong Cai floated the idea of a BDT bond to Finance Minister AMA Muhith yesterday in a meeting on the sidelines of WB-IMF spring meetings in Washington DC, which the minister agreed to right away. In October 2013, IFC, the World Bank's private sector arm, launched an identical bond programme for India. The same model will be followed for Bangladesh The Bangladesh bond will be listed on London Stock Exchange, according to a finance ministry official.
ADB cuts GDP growth forecast to 6.1pcNewAge, April 22, 2015
The Asian Development Bank on Tuesday downsized the GDP growth projection for Bangladesh to 6.1% for the current fiscal year from 6.4% forecasted in September 2014 mainly due to ongoing political unrest in the country. According to the ADB report, agriculture growth will be at 3.3%, lower than its earlier projection of 3.5%, due to production loss of perishable noncereal products because of disruptions in supply, distribution and marketing. Growth in industry sector will also grow lower at 8.5% from its earlier projection of 9.2% because of political unrest. Services sector growth will fall slightly to 5.7% from 5.8% as business activities were affected by strikes and blockades. Increasing investment up to 35% of GDP is the major challenge to attaining a higher GDP growth trajectory and Bangladesh needs to maintain political stability and improve quality of governance to boost investment.
Reserve crosses USD24b as idle dollars keep mountingNew Age, April 30, 2015
The country’s foreign exchange reserves crossed USD24-bn mark for the first time on Wednesday as the Bangladesh Bank’s purchasing of US dollars from the local banks surpassed USD2.80 bn in this financial year amid slow business. BB kept intervening into the forex market so that the taka remained stable against the dollar amid lack of demand for greenbacks. The relatively good inflow of remittance and static growth in export earnings amid the dull import helped the rise in the reserves. BB purchased around USD50 mn from the local banks, taking the total dollar buying to USD2.83 bn in July-April.
Private sector credit growth reboundsDhaka Tribune, April 09, 2015
The country’s banking sector has seen rebound in private sector credit growth in February, thanks to negative government borrowing from the banking system and lower lending rate. The private sector credit growth rose to 13.6% in February from 13.3% in the previous month. The banking sector saw a fall in credit growth in the first month of the year from 13.5% in last December due to the ongoing political turmoil. On the other hand, public sector credit posted negative growth of 0.7% in February as the government project implementation remained slower amid political unrest. A drastic fall in government borrowing from the banking system over the last couple of months is also one of the factors that pushed the private sector credit growth higher.
GDP revised at 6.8pc in FY15New Age, April 09, 2015
The coordination council on macro-economy in a meeting on Wednesday decided to revise the country’s growth target of the gross domestic product at 6.8% in the outgoing fiscal year. The committee also fixed the GDP growth rate at 7.4% for the next fiscal year. The revised budget in the outgoing fiscal year had been fixed at BDT 2,40,000 crore from original BDT 2,50560 crore. The size of the next budget would be around BDT 3,00,000 crore.
FY15 borrowing through savings instruments to rise by 132%Dhaka Tribune, April 14, 2015
The government borrowing through national savings certificates would increase as high as 132% to BDT21,000 crore this fiscal year from the original estimate. Finance Division has revised up the estimate from the previous estimate of BDT9,056 crore,. But the government has to face a huge pressure now in the payment of interest against the savings instruments. The rates of interest range between 12% and 14%. The rates, however, will be reviewed for the next fiscal year and are expected to come down below 9. During July-February period this fiscal, the sales of saving instruments soared 77.41% year -on- year to BDT26,533 crore.
26ILCL-ILSL Monthly Economy and Market Review – April 2015
Moody’s rates Bangladesh’s outlook stable for 6th straight yearDhaka Tribune, April 30, 2015
The global rating agency Moody’s has rated Bangladesh’s outlook as stable for the sixth consecutive year. Moody’s Investors Service has projected Bangladesh’s outlook as stable again for the current year saying that the country’s growth volatility is lower than for almost all other countries rated by the global credit rating agency. Bangladesh is rated Ba3 with a stable outlook. Bangladesh’s Ba3 foreign currency government bond rating reflects its track record of macroeconomic stability, a modest debt burden, and limited external vulnerabilities with an ample foreign reserve buffer. The agency forecast that growth expanded by 6.1% in the fiscal year ended 30 June 2014, and is expected to rise at a similar pace this year.
Japan hints at joining Asian investment bankNew Age, April 09, 2015
Japan has hinted at joining the China-proposed Asian Infrastructure Investment Bank while Iran has been approved as a founding member of the AIIB, establishment of which has also been welcomed by World Bank president Jim Yong Kim, reports Xinhua and the AFP. Local media in Japan on Wednesday reported that the government had earmarked USD1.5 bn as its contribution to the AIIB. Japan, who hold China as its biggest trade and economic partner, hopes that its joining the AIIB could help improve ties between Tokyo and Beijing, which have soured of late owing to issues of territory and history. Asian investment bank starts with 57 membersNorway included despite frosty ties with ChinaNewage, April 16, 2015
Fifty-seven countries have been approved as founding members of a Chinese-backed infrastructure bank, Beijing said, and Norway was included despite frosty relations over a Chinese dissident’s Nobel prize. The last seven countries approved as founding members by Wednesday’s deadline were named by China’s finance ministry as Sweden, Israel, South Africa, Azerbaijan, Iceland, Portugal and Poland. The 57 inc the United Nations Security Council’s permanent five, 14 of the 28 European Union countries, and 21 members of the 34-strong Organisation for Economic Cooperation and Development. The line-up does not include the United States or Japan but represents a
diplomatic coup for China after close US allies such as Britain, France, Germany and Australia decided to take part even after Washington initially opposed them signing up.
Foreign investment in Bangladesh capital market doubled in 2014: Reportbdnews24.com, April 17, 2015
Taka gaining against the US Dollar and declining share prices in 2014 helped Bangladesh’s capital market to attract foreign investment twice the amount of 2013, a Bangladesh Bank report reveals. Last year, the Dhaka and Chittagong stock exchanges received about USD714 mn investment from 19 countries. American investors led the list with an investment of USD471.1 mn, which is 65.97% of the total foreign investment, according to the report. Swiss investors followed with USD120.8 mn and the UK with USD53.6 mn. Countries that invested in Bangladesh’s capital market last year include Bahrain, Belgium, Canada, Germany Hong Kong, Iceland, India, Japan, Luxembourg, New Zealand, Russia, Saudi Arabia, Singapore, Sri Lanka and Sweden. International investment body IFC, too, invested. However, in the same year, foreign investors withdrew about USD296.1 mn – out of USD347.4 mn they invested in 2013.
Dull business forces banks to go for more rate cutsNewage, April 18, 2015
Scheduled banks further cut rates of interest on lending in February as the businesspeople continued to show reluctance in receiving loan from the banking sector due to sluggish business amid political unrest. The weighted average interest rate on lending in the banking sector declined to 12.23%age points in February from 12.32%age points in January of this year. The lending rate in the banking sector hit a four-year low in February 2015 as the scheduled banks are compelled to decrease the rate massively due to a sluggish demand from the business people amid recent spates of political violence. The BB data showed that the weighted average interest rate on deposit of the banks had also decreased to 7.19%age points in February from 7.26%age points in January of 2015. The interest spread rate, the gap between the interest rates on credit and deposit, decreased to 5.04%age points in February from 5.06% age points in January.
Internatioal
Stock Market
Bank
27ILCL-ILSL Monthly Economy and Market Review – April 2015

NBFIs asked to keep 100pc provision against write-off loansNew Age, April 09, 2015
Bangladesh Bank on Wednesday asked non-bank financial institutions to keep 100% provision before declaring their defaulted loans of the bad or loss category write-off. The NBFIs, however, will be allowed to convert defaulted loans amounting to BDT 50,000 or less into write-off without filing any case with court. The management of the NBFIs would have to take prior approval from their respective board of directors to write-off the defaulted loans.
NBFI
Japanese steel giant Kobelco enters Bangladesh marketDhaka Tribune, April 29, 2015
The world’s leading Kobelco Welding, a group company of Japan’s Kobe Steel Limited, has announced its entrance into Bangladesh, eyeing the country’s fastest growing shipbuilding industry. The company is now selling its wielding equipment to the Western Marine Shipyard, the country’s leading shipbuilders, through its local dealer Tsi Marine Ltd. Bangladesh welding industry is mostly dominated by the use of manual welding equipment. However, this situation is expected to change as several industries have started demanding automated equipment to support higher productivity. More than hundred-year old, Kobe Steel is Japan’s fifth-largest and the world’s fifteenth-largest steelmaker with an annual turnover of around USD16 bn and employing some 36,000 people across the world. The company has plants in Japan, Thailand, Korea, Europe, Indonesia, India, Singapore and Malaysia.
Engineering
Govt to take USD44m loan from IDB for second submarine cable linksThe Daily Star, April 2, 2015
The government is set to take USD44 mn loans from the Islamic Development Bank under slightly harder terms to connect the nation to a second submarine cable. Once connected to the second submarine cable, SEA-ME-WE-5, the country's internet bandwidth will increase sevenfold from the existing 200 Gbps. SEA-ME-WE-5 is a consortium of 17 nations, where Bangladesh's share will be USD72.5 mn. Of the amount, Bangladesh will pay USD44 mn by taking the loan from IDB, payable in ten years after a three-year grace period and the rate of interest on the loan would come to 4.15%. The break-up of the interest is: the rate of interest for the loan will be six-month LIBOR+1.35%, which may amount to approximately 1.67%. LIBOR (London Inter-Bank Offer Rate) is the global benchmark for short-term loan. A joint venture of two companies -- Alcatel Lucent of France and NEC of Japan -- will build the second submarine cable line for the consortium, to whom BSCCL has already paid USD19.2 mn from its own fund.
Telecommunication
BB disburses USD19.15m to Midland Power CoThe Financial Express, April 1, 2015
The central bank disbursed a fund worth USD19.15 mn under its Investment Promotion and Financing Facility (IPFF) project Tuesday to Midland Power Company Limited through three private commercial banks. The banks are Eastern Bank Limited (EBL), Mutual Trust Bank Limited (MTBL) and Trust Bank Limited (TBL). The central bank has been implementing the project on behalf of the Finance Ministry to finance PPP (public private partnership) based infrastructure development projects since 2007. Apart from this power plant, the IPFF has financed USD154.72 mn equivalent to BDT 11.48 bn in nine power plants, one inland container depot, one IT infrastructure project and three water treatment plants till date through participating banks and financial institution.
BPC to see BDT 2,000cr profit as oil prices fall The Daily Star, April 14, 2015
Bangladesh Petroleum Corporation is making a whopping profit of BDT 13 to BDT 36 per litre on petroleum products on the back of the sliding global oil prices since June last year. The production cost of octane is BDT 56.85 per litre but the customers are buying it for BDT 99, giving the state-run corporation a profit of BDT 35.49 per litre. The profit margin is BDT 13.77 per litre for kerosene, BDT 14.68 for diesel, BDT 19.57 for furnace oil and BDT 18.75 for jet fuel. In other words, the state-run company is set to make more than BDT 2,000 crore in profits this fiscal year.
Fuel and Power
Note: Business Newsflash is a collection of news published in the top daily newspapers like The Daily Star, The Financial Express, The NewAge and Dhaka Tribune. IL Capital is not responsible for any discrepancy in the information provided in the news.
28ILCL-ILSL Monthly Economy and Market Review –April 2015

ILCL-ILSL Monthly Economy and Market Review – April 2015
Editorial Panel
Nehal Ahmed FCA Managing Director, IL Capital [email protected]
Saad Faisal Chief Operating Officer, IL Capital [email protected]
Md. Humayan Kabir, FCA Chief Operating Officer, ILSL [email protected]
IL Capital Research Team
Shama Rahman Assistant Manager, Investment [email protected]
Shohidul Islam Senior Executive [email protected]
ILSL Research Team
Rezwana Nasreen Head of Research [email protected]
Towhidul Islam Research Analyst [email protected]
Md. Tanvir Islam Sr. Research Analyst [email protected]
Mohammad Asrarul Haque Jr. Research Analyst [email protected]
Nurul Hai Head of Investment [email protected] and Corporate Advisory
Md. Mustafa Kamal Deputy Manager [email protected] Compliance & Risk Management
Disclaimer: This report is provided for information purposes only. It is not a complete analysis of every material fact respecting any stock or industry. Neither this report, nor any graph presented herein, should be construed as an offer to sell or a solicitation of an offer to acquire any stock or other investments. The company accepts no liability whatsoever for any direct or consequential loss arising from the use of this report or its contents. This report may not be reproduced, distributed or published by any recipient for any purpose.

International Leasing Securities Limited started its journey to provide diversified services to a wide range of customers.
International Leasing Securities Limited offers full-fledged high standard brokerage service with margin loan facility. It is also a full service Depository Participant (DP) of Central Depository Bangladesh Ltd. (CDBL). The brokerage service is designed to provide customers with necessary support in the stock market.
ILSL is dedicated to provide high level of professional and personalized services to its domestic and international customers. ILSL services are comprehensive in nature, including brokerage, margin loan, CDBL facilities, and research.
Value for our clients
We have formed a dedicated and professionally qualified research team so that our clients can have proper understanding of market dynamics and take informed investment decision.
To meet the objective we deliver plenty of enriched products and services to our clients. Our research coverage includes but not limited to listed company analysis, sector analysis and economy analysis of Bangladesh.
Currently our research basket has:
Daily Market Update: Clients can get information on market movement along with clarifications on overall market pulse.
Equity Note: Provide brief company insights based on fundamental analysis
Valuation Report: Deliver extended fundamental analysis on particular stock
IPO Note: Cover information regarding respective upcoming issue
Performance of mutual fund: Contain information about NAV of all Mutual Funds with comparison of previous week.
Corporate declaration: Includes information related to listed company (from DSE Website)
Monthly Publication: Comprises of economic update, market update, overview on any particular sector and snapshot over few stocks under the covered industry and business news
Macroeconomics Update: Offer review on Monetary Policy Statement (MPS), Budget etc.
YOUR MONEY MANAGER

YOUR MONEY MANAGERYOUR INVESTMENT MANAGER
Contact AddressPrinters Building (3rd Floor), 5 Rajuk Avenue, Dhaka-1000.
Phone: +88-02-9577305 (Hunting); Fax: +88-02-9577691www.ilslbd.com
Contact AddressPrinters Building (14th Floor), 5 Rajuk Avenue, Dhaka-1000.Phone: +88-02-9515573, Fax: +88-02-7117559www.il-capital.com
We Offer: Brokerage Services Custodial Services Margin Loan Facilities Research Services Value Added Services Internet Trading Real Time Portfolio Viewing Phone Banking SMS Services & E-mail
We Offer: Issue Management Underwriting Private Equity Capital Raising Loan Syndication Merger and Acquisition Bonds and Convertibles Margin Lending Non-Discretionary Investment Management Discretionary Investment Management
IL Capital Limited and International Leasing Securities Limited are subsidiaries of International Leasing and Financial Services LimitedIL Capital Limited and International Leasing Securities Limited are subsidiaries of International Leasing and Financial Services Limited
We Promise Customizedand
Efficient Investment Solutions ...
We Promise Customizedand
Efficient Investment Solutions ...