Embed Size (px)
Citation preview

WP/11/192
Economic Policies and FDI Inflows to
Emerging Market Economies
Elif Arbatli

© 2011 International Monetary Fund WP/11/192
IMF Working Paper
Middle East and Central Asia Department
Economic Policies and FDI Inflows to Emerging Market Economies
Prepared by Elif Arbatli
Authorized for distribution by Ralph Chami
August 2011
Abstract
This paper investigates the determinants of FDI inflows to emerging market economies,
concentrating on the effects of economic policies. The empirical analysis also addresses
the role of external push factors and of political stability using a domestic conflict events
database. The results suggest that lowering corporate tax rates and trade tariffs, adopting
fixed or managed exchange rate policies and eliminating FDI related capital controls
have played an important role. Domestic conflict events and political instability are found
to have significant negative effects on FDI, which highlights the role of incluside policies
to promote growth and avoid sudden stops of FDI inflows.
JEL Classification Numbers: F2
Keywords: FDI, Emerging Market Economies, Economic Policies
Author’s E-Mail Address:[email protected]
This Working Paper should not be reported as representing the views of the IMF.
The views expressed in this Working Paper are those of the author(s) and do not necessarily
represent those of the IMF or IMF policy. Working Papers describe research in progress by the
author(s) and are published to elicit comments and to further debate.
2
Contents Page
Abstract ......................................................................................................................................1
I. Introduction and Motivation ...................................................................................................3
A. FDI Inflows to Emerging Market Economies ...........................................................4
II. Empirical Framework And Data ...........................................................................................7 A. What Explains FDI Inflows?.....................................................................................7 B. Panel Regressions ....................................................................................................11
III. Conclusions ........................................................................................................................19
Figures
1. FDI Inflows to EMEs 1990–2008 ........................................................................................4
2. FDI Inflow Surges and Real GDP Growth in G-7 Countries ..............................................5
3. FDI Inflow Surges and Volatility (VIX Index)....................................................................6
4. FDI Inflows to EMEs ...........................................................................................................6
5. FDI Inflows to Selected EMEs ...........................................................................................6
Tables
1. System GMM Estimates—With Push and Fixed Pull Factors ..........................................14
2. System GMM Estimates—Political Factors ......................................................................15
3. System GMM Estimates—Macroeconomic Environment ................................................17
4. System GMM Estimates—Economic Policies ..................................................................18
References ................................................................................................................................20
Appendix ..................................................................................................................................23
3
I. INTRODUCTION AND MOTIVATION
FDI has increasingly been viewed by policy makers in developing and emerging market
economies (EMEs) as a tool to finance development, increase productivity and import new
technologies.1 In addition, the relative stability of FDI inflows constitutes a buffer against
sharp reversals in portfolio inflows during periods of crisis, such as the one experienced
in 2009. The global financial crisis marked the end of a significant inflow episode to EMEs.
An important policy question is, therefore, which factors (external and domestic) are
important in driving FDI inflows to EMEs. In this paper, we look at this question, studying
both the country-specific and the global factors that explain FDI in EMEs. The focus of the
analysis is on the effects of policy-driven variables, controlling for other factors such as the
global economic environment.
The data sample includes 46 countries and covers the period from 1990 to 2009 for most of
them, offering useful time series variation in inflows for individual countries and EMEs as a
whole. The sample also captures the global economic crisis and hence offers a preliminary
assessment of the effects of the crisis on FDI inflows to EMEs.
This paper is related to the previous literature on FDI inflows.2 It extends existing work by
focusing on the effects of a wide range of economic policies on FDI to EMEs. In addition to
using corporate tax rates and tariffs as possible policy variables that can promote FDI, this
paper also considers the effects of exchange rate policy and FDI-related capital account
restrictions. The paper also makes a careful attempt to quantify the effects of political
stability and conflict on FDI, using both professional risk indices and a domestic conflict
event database.
Country coverage and sample periods vary across studies, but openness, market size and
export orientation are usually found to be significant country-specific determinants of FDI
inflows.3 Regarding the role of institutions and the macroeconomic environment, Walsh and
1 There is an extensive empirical literature that has explored the effects of capital inflows and FDI in particular,
on economic growth in host countries. Although there is no uniformly strong evidence that FDI inflows
promote growth, many recent papers provide evidence that there are positive growth effects of FDI. Kose et. al.
(2009) argues that there can be threshold effects of financial and institutional development of an economy on
the effects of FDI flows and Alfaro et. al. (2004) finds that the development of financial markets affect whether
host countries benefit from FDI inflows.
2 Dabla-Norris et. al. (2010) use bilateral FDI inflow data from G-7 countries to a set of low and medium
income countries. They find that FDI flows are pro-cyclical with respect to growth rates in G-7 countries. The
credit conditions in G-7, proxied by the level of the real interest rate, are also found to play a role for both low
and medium income countries. The host country specific determinants of FDI such as institutional quality,
economic growth and lower government consumption to GDP ratio are found to affect FDI flows, but only for
medium-income countries. Campos and Kinoshita (2003) look at the determinants of FDI flows to transition
economies. 3 See for instance Lucas (1993) and Hein (1992).
4
Yu (2010) point out the importance of distinguishing between inflows into the primary
versus the secondary and tertiary sectors such as manufacturing and services, which may
have a different set of determinants.4 Most studies also agree on the significance of business
cycles in capital exporting advanced economies. The results in this paper are broadly
consistent with the previous literature, especially regarding the role of global push factors.
However, the paper finds a more important role of economic policies, especially corporate
tax rates, as drivers of FDI inflows.
The organization of the paper is as follows: The rest of this section provides a brief overview
of trends in FDI flows to EMEs. The next section discusses the determinants of FDI inflows
that will be considered in the empirical part of the paper, presents the empirical strategy and
discusses the main results for EMEs as a group. Section III draws some policy conclusions
and discusses possible extensions and improvements on the empirical approach.
A. FDI Inflows to Emerging Market Economies
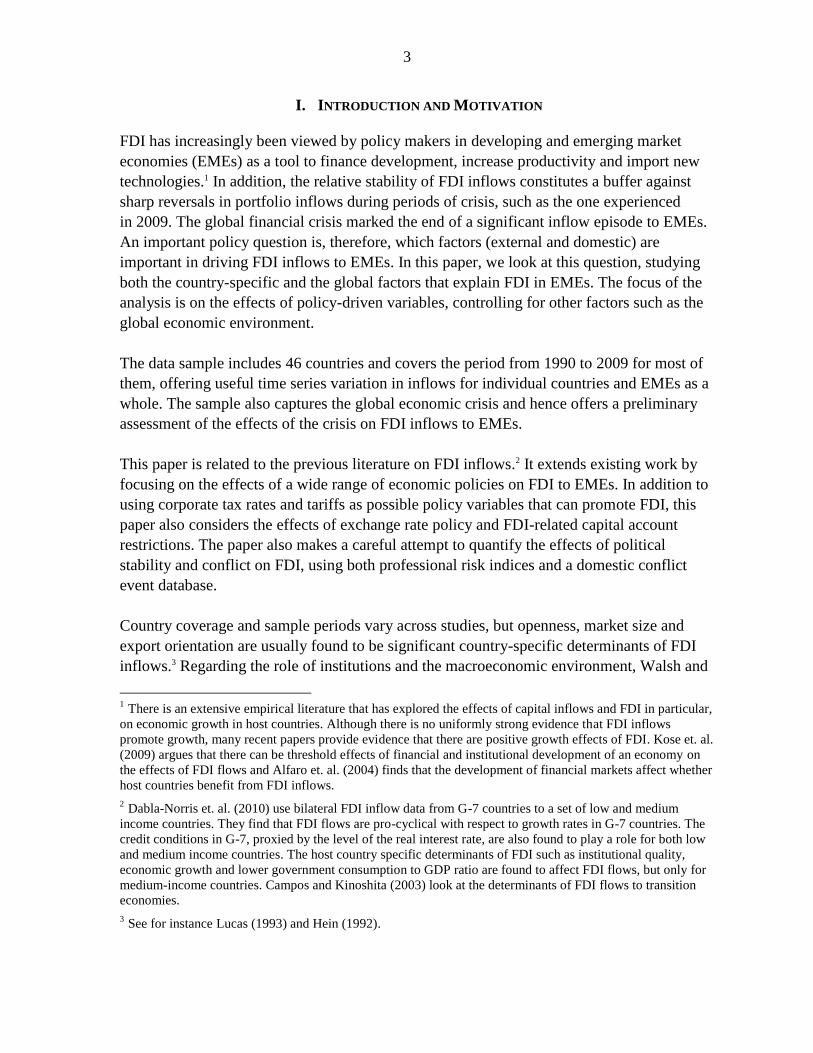
FDI inflows to EMEs increased substantially since the early 1990s. Total inflows as a
percentage of total emerging market GDP shows a sustained trend increase (Figure 1). 5 6
Although FDI inflows are perceived
to be more stable compared to other
types of foreign capital inflows, they
also have fluctuated significantly
over the sample period. In particular,
it is possible to identify two surge
episodes associated with a
significant and sharp rise in inflows.
The first such episode started
in 1990 and reached a peak in 1999.
Total flows declined starting in 2000
and reached a trough in 2003. The
second surge of flows took place during 2003–07 and reached a peak of 4 percent of total
emerging market GDP just before the global financial crisis in 2008.
Figure 1 also shows the evolution of the number of EMEs that had an FDI inflow episode
during that corresponding year. Inflow episodes are identified following the methodology
4 They find that investment flows to the primary sector are not related to macroeconomic variables, consistent
with their hypothesis. 5 Please refer to the Appendix for the list of 46 emerging market countries in the sample.
6 Foreign direct investment is defined as ―Direct Investment in Representative Economy, NIE‖ and comes from
the IMF’s International Financial Statistics. Data from the UNCTAD World Investment Report (WIR) is used
for the missing years for some countries.
5
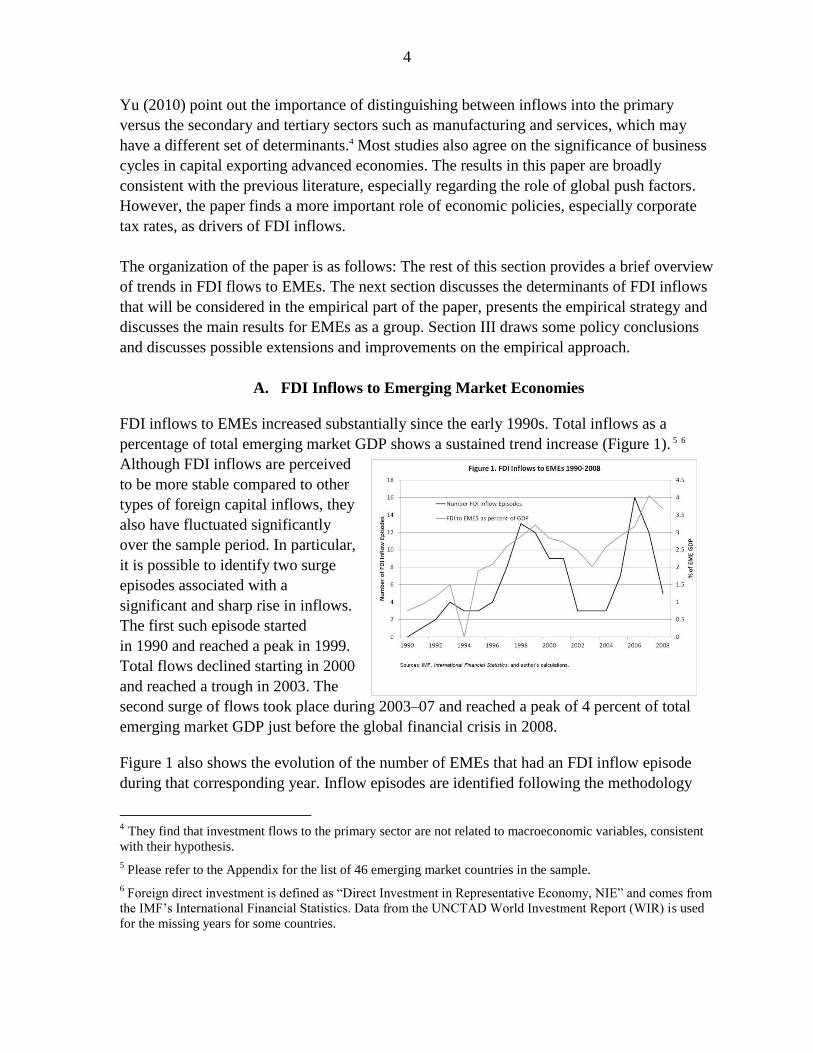
adopted in the October 2007 World Economic Outlook (WEO).7 The number of countries
that experienced inflow episodes
started to increase in 1995 and
reached its peak in 1998. Another
significant surge of inflows took
place during 2004–06, as the
number of EMEs that were in an
FDI inflow episode reached 16.
Looking at growth rates in G-7
countries—which are major FDI
exporters—over this period
suggests that FDI inflows to
EMEs were indeed related to
growth in developed economies
(Figure 2). A steady increase in
G-7 growth rates during
the 1990s coincided with the first
surge of flows and the slowdown
in 2000–01 seems to have played
a role in their decline. The
statistical analysis conducted in
the next section also captures the
pro-cyclicality in FDI inflows
with respect to developed country
business cycles. In addition,
persistently low global interest
rates during this period have also
played a role, making investment
projects and mergers and acquisitions cheaper to finance.
7 The WEO methodology (see Chapter 3, Managing Large Capital Inflows) identifies an inflow episode if in
any given year total capital inflows as percentage of GDP exceed trend inflows by more than one standard
deviation. Trend inflows for each country are calculated using the HP-filter with a smoothing parameter of 100.
If there are less than two years between two inflow episodes, we consider them to be part of the same inflow
episode. Please see Appendix for more details on the identification of episodes.
6
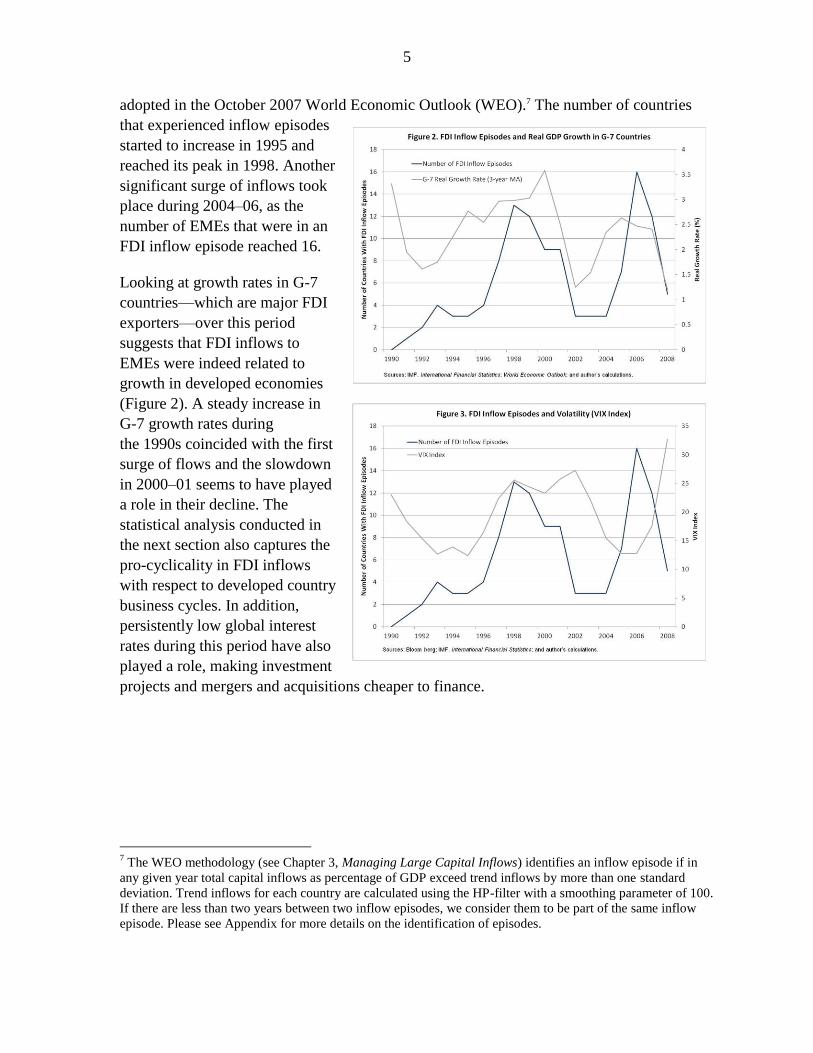
We find that global risk aversion and
heightened uncertainty also play a
significant role in explaining FDI
inflows. The unconditional
correlation between the VIX index
and FDI inflows is small, but during
certain periods such as after 2006,
one observes a significant negative
relationship.8 As Figure 3 shows, FDI
inflows plunged when uncertainty
increased to unprecedented heights.
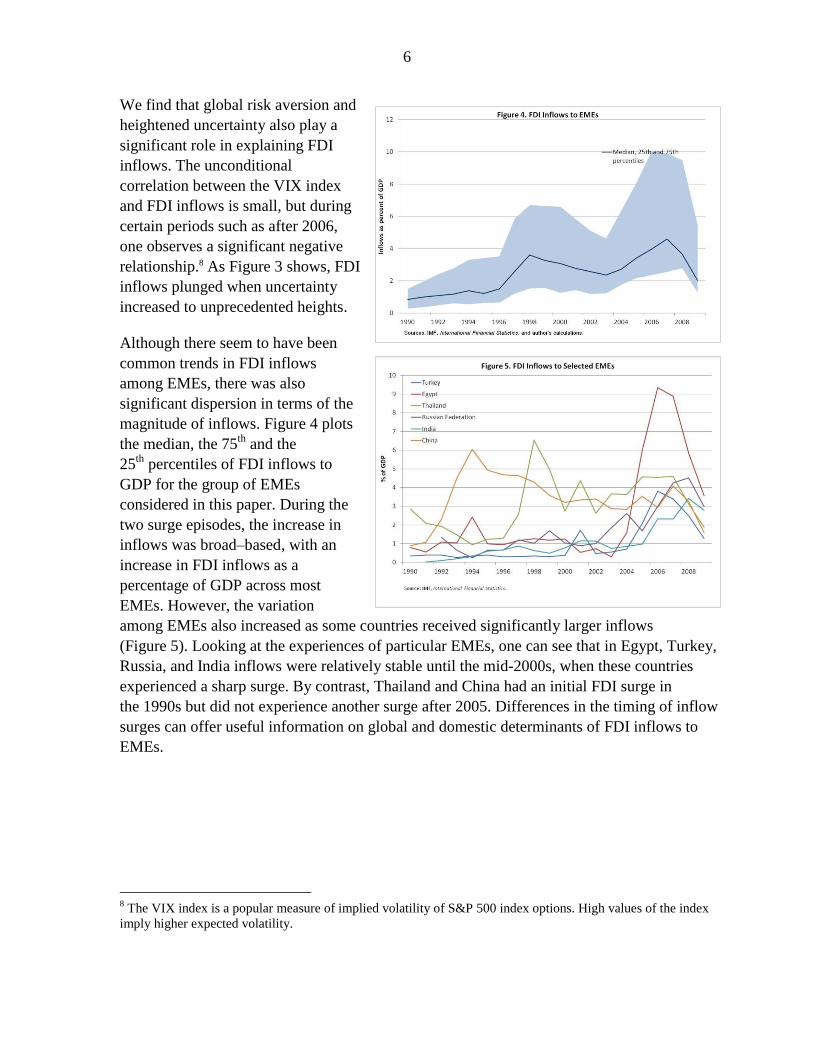
Although there seem to have been
common trends in FDI inflows
among EMEs, there was also
significant dispersion in terms of the
magnitude of inflows. Figure 4 plots
the median, the 75th
and the
25th
percentiles of FDI inflows to
GDP for the group of EMEs
considered in this paper. During the
two surge episodes, the increase in
inflows was broad–based, with an
increase in FDI inflows as a
percentage of GDP across most
EMEs. However, the variation
among EMEs also increased as some countries received significantly larger inflows
(Figure 5). Looking at the experiences of particular EMEs, one can see that in Egypt, Turkey,
Russia, and India inflows were relatively stable until the mid-2000s, when these countries
experienced a sharp surge. By contrast, Thailand and China had an initial FDI surge in
the 1990s but did not experience another surge after 2005. Differences in the timing of inflow
surges can offer useful information on global and domestic determinants of FDI inflows to
EMEs.
8 The VIX index is a popular measure of implied volatility of S&P 500 index options. High values of the index
imply higher expected volatility.
7
II. EMPIRICAL FRAMEWORK AND DATA
A. What Explains FDI Inflows?
The set of explanatory variables that we will use to explain cross-country and over-time
variations in FDI inflows can be split into two categories: global push factors and country-
specific pull factors. Many studies have concluded that global push factors are important in
explaining capital flows to emerging market economies. It is therefore important to control
for their effects in considering the role of domestic policies. The role of global economic
conditions has also gained importance with the recent global economic crisis and the
subsequent decline in FDI inflows. In our empirical strategy, common time trends across
countries with different fundamentals help identify the effects of such push factors. The
country-specific pull factors that we will consider are grouped under four main categories: 1)
fixed or structural factors such as whether the country is an oil exporter or not, its location
and the average level of education; 2) political factors including existence of conflict, labor
strikes, and/or protests; 3) macroeconomic factors such as inflation, the share of exports, and
the real exchange rate; and finally 4) economic policy variables including corporate tax rates,
tariff rates, exchange rate policy, and whether there are capital account restrictions.
Global Push Factors:
Growth in capital exporting countries: Real income growth in G-7 countries is used to
capture the effects of economic growth in capital exporting countries on FDI flows to EMEs.9
The expected effect of economic growth in G-7 countries on FDI flows to EMEs is
somewhat ambiguous. While higher income growth in G-7 countries provides an
environment that is more conducive to expansions into other markets and associated with
easier internal financing conditions, it may also make investment in the domestic economy
relatively more attractive. We use the 3-year moving average of real GDP growth in G-7
countries to account for lag effects due to implementation and planning times associated with
FDI.
9 G-7 countries have originated approximately 56 percent of total global FDI outflows during 2000-2008
according to FDI outflows data in the World Investment Report (2009) published by UNCTAD.
8
International liquidity: To capture the effects of credit conditions in advanced countries on
FDI flows, we use the average real (ex-post) interest rates in G-7 countries. Lower interest
rates are expected to increase FDI flows, making it easier for firms to finance investment
projects.10
Risk environment: The global risk appetite is also mentioned and used in the literature as a
common push factor that could affect FDI flows to EMEs. We use the natural logarithm of
the VIX index to capture the role of global risk appetite if any on FDI flows.
Country Specific Pull Factors:
1. Fixed or Structural Factors:
Size of domestic market: The size of the domestic market can play a role in attracting
horizontal FDI, where firms decide to invest in the host country to capture a share of the
domestic market. We use the log of the PPP-adjusted gross domestic product per capita in the
host country in 1989 to capture the effect of the size of the domestic market on FDI inflows.11
But this variable is also related to the capital-to-labor ratio and, hence, the productivity of
capital. Countries with a low level of per capita income might attract more inflows,
consistent with a higher marginal product of capital.
Education: We use the average years of school attainment in 1990, using a dataset
constructed by Barro and Lee (2010).
Role of Oil Sector: Given the importance of hydrocarbon sector related inflows for certain
EMEs, we control for this factor through a dummy which equals one if the share of oil
exports in total exports exceeds 20 percent.
Location: We construct dummies based on the location of the countries, including the Middle
East and North Africa, Asia, Latin America, and Central and Eastern Europe.
2. Political Environment and Institutions:
Legal, political and the institutional environment: A possible determinant of foreign direct
investment in a country is the quality of its legal, political and institutional environment.
Legal rights, contract enforcement, protection of investor rights are likely to be important for
an investor’s decision regarding bringing capital into a foreign country. Political stability and
whether there are internal or external conflicts also play a role since they affect economic
uncertainty, safety of invested capital and economic prospects of the host economy. There
10 Calvo, Leiderman and Reinhart (1996) found evidence for the effects of low US interest rates on foreign
investment in the 1990s.
11 We also considered population as a variable but it was highly insignificant.
9
are many sources of cross-country data that aim to capture differences across countries along
these dimensions, based on different sources of information. Most of these studies have
found an effect of political risk or corruption on FDI.12 However, it is important to note that
political risk and its relationship with FDI is complex and hard to quantify. We use several
political risk ratings published by ICRG.13 These ratings are subjective; however, they are
calculated consistently over time and across countries. The following components of political
risk are considered separately and also together as a composite: government stability, internal
and external conflict, law and order and bureaucracy quality.14 The ratings range from 0 to 12
or 0 to 4 depending on the particular risk component. For all components, a higher rating
indicates lower risk.
Conflicts, revolutions and labor strikes based on events: Given that the interpretation of
conflict indices can be challenging, it may be useful to use event based variables to look at
the effects of labor strikes, riots, and protests on FDI inflows.15 We use four domestic conflict
event variables from the Cross-National Time-Series Data Archive (CNTS).16 General strikes
(captures major strikes involving 1,000 or more workers and more than one employer aimed
at national government policies); major government crises (a rapidly developing situation
that threatens to bring down the current regime; revolutions (forced change in the top
government elite) and anti-government demonstrations.
3. Macroeconomic Environment
The macroeconomic environment and policies in EMEs improved consistently over the
sample period and in particular during the last decade, which can help explain the overall
positive trend and the sharp rise in inflows during the second half of 2000s. However, an
important challenge in looking at the effects of macroeconomic variables on FDI is the
feedback effect from FDI to macroeconomic variables, especially to economic growth.
12
Wei (2000) found that corruption played an important role in explaining bilateral FDI flows during 1994–
1996 from industrialized to developing countries. Faria and Mauro (2004) find that institutions affect the stock
of FDI using 55 developing and emerging market economies. Campos and Kinoshita (2008) find that financial
reform efforts, privatization, level of development and quality of infrastructure are significant determinants of
FDI in Eastern Europe and Latin America, and that reform efforts tend to be more powerful determinants of
FDI than reform outcomes.
13 ICRG is a company that produces risk ratings for a large group of countries and evaluates countries on the
basis of political, economic and financial risks. Alfaro et. al. (2004) also uses ratings for several ICRG
components to measure institutional quality.
14 See Appendix for a more detailed description of the components of political risk index.
15 Other empirical analyses that have explored the effects of different proxies such as the number of strikes or
riots (Schneider and Frey (1985)) and episode dummies for certain political events (Lucas (1993)).
16 See Appendix for the exact definition of the variables.
10
Real GDP Growth: High real GDP growth rates can attract FDI inflows, indicative of high
productivity in an economy. As mentioned above, there can also be feedback effects from
FDI (both current and past) on economic growth in return.
Inflation: We use a dummy variable that equals one if inflation during that year has been
higher than 10 percent.17 The inflation performance of EMEs, measured by the share of
countries that had less than 10 percent annual inflation improved significantly during the
sample period and several studies, including Dabla-Norris et. al. (2010), find a positive
impact of a low inflation environment on FDI inflows.
Exports to GDP: One of the key determinants of FDI inflows is the export orientation and
competitiveness of an economy. We use the share of exports to GDP (export) as a proxy for
the export orientation of a country over time. As noted by other studies as well, the effect of
export orientation on FDI inflows may be ambiguous since it would depend on whether FDI-
related production is meant to serve the export or the domestic market (in other words
whether it is vertical or horizontal FDI).
Real Exchange Rate: We use the change in the real exchange rate to assess the effects of
competitiveness on FDI flows. This may be more important if the investment is oriented
towards the export market.
4. Economic Policies:
Trade policy: We use the tariff rates imposed on manufactured goods as a proxy for the
extent of trade liberalization. The effect of tariffs on FDI may be different depending on its
nature (orientation toward the domestic market or exports).
Exchange rate classification: As previous studies have emphasized, exchange rate volatility
and flexibility can affect capital inflows. We thus use IMF’s de facto classification of
exchange rate arrangements which has 8 different regime classifications with higher numbers
corresponding to higher flexibility and combine them into three categories: fixed
(classifications 1-4), managed (classifications 5-7), and floating (classification 8) and
construct dummies for the different classifications.
Restrictions in capital account transactions related to FDI: Another potential determinant of
FDI inflows is the existence of FDI related capital account restrictions. We use two
indicators that exist in the AREAR database of IMF to account for the effects of such
restrictions: 1) whether there were any restrictions on FDI inflows 2) whether there were any
17
Many countries in the sample had episodes of hyper inflation during the sample. Also the relationship
between FDI and inflation is conjectured to be nonlinear; therefore, we use a binary indicator of inflation
performance.
11
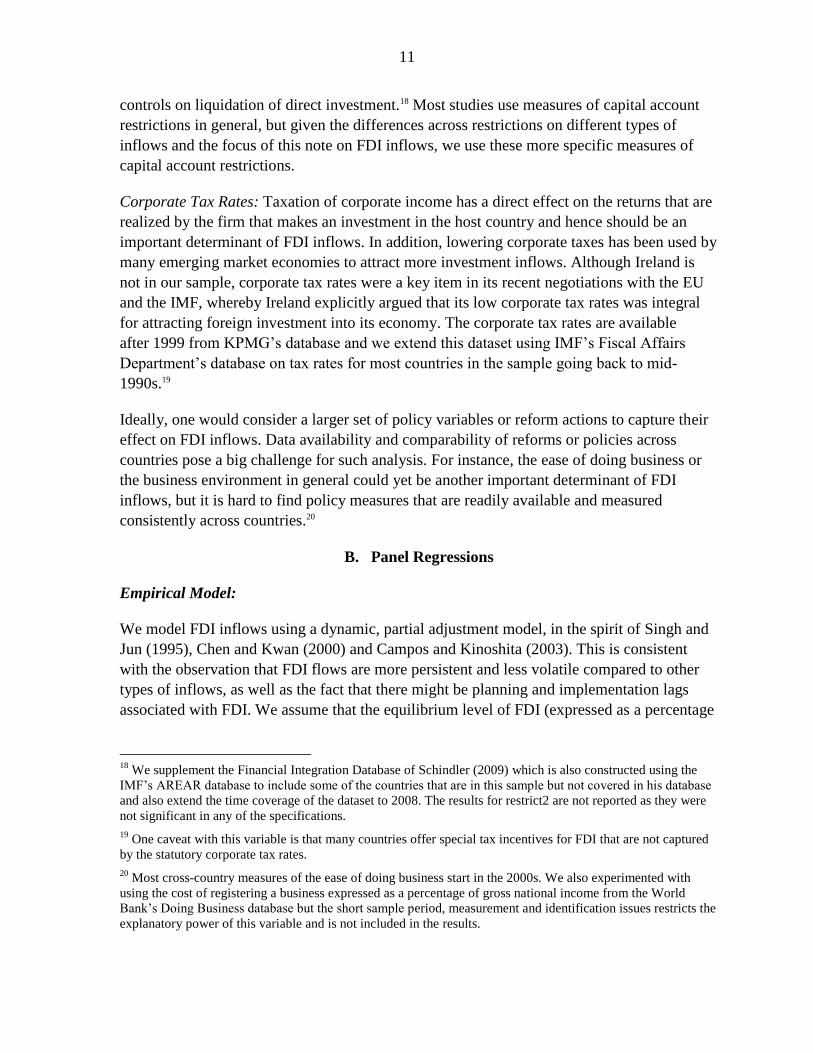
controls on liquidation of direct investment.18 Most studies use measures of capital account
restrictions in general, but given the differences across restrictions on different types of
inflows and the focus of this note on FDI inflows, we use these more specific measures of
capital account restrictions.
Corporate Tax Rates: Taxation of corporate income has a direct effect on the returns that are
realized by the firm that makes an investment in the host country and hence should be an
important determinant of FDI inflows. In addition, lowering corporate taxes has been used by
many emerging market economies to attract more investment inflows. Although Ireland is
not in our sample, corporate tax rates were a key item in its recent negotiations with the EU
and the IMF, whereby Ireland explicitly argued that its low corporate tax rates was integral
for attracting foreign investment into its economy. The corporate tax rates are available
after 1999 from KPMG’s database and we extend this dataset using IMF’s Fiscal Affairs
Department’s database on tax rates for most countries in the sample going back to mid-
1990s.19
Ideally, one would consider a larger set of policy variables or reform actions to capture their
effect on FDI inflows. Data availability and comparability of reforms or policies across
countries pose a big challenge for such analysis. For instance, the ease of doing business or
the business environment in general could yet be another important determinant of FDI
inflows, but it is hard to find policy measures that are readily available and measured
consistently across countries.20
B. Panel Regressions
Empirical Model:
We model FDI inflows using a dynamic, partial adjustment model, in the spirit of Singh and
Jun (1995), Chen and Kwan (2000) and Campos and Kinoshita (2003). This is consistent
with the observation that FDI flows are more persistent and less volatile compared to other
types of inflows, as well as the fact that there might be planning and implementation lags
associated with FDI. We assume that the equilibrium level of FDI (expressed as a percentage
18
We supplement the Financial Integration Database of Schindler (2009) which is also constructed using the
IMF’s AREAR database to include some of the countries that are in this sample but not covered in his database
and also extend the time coverage of the dataset to 2008. The results for restrict2 are not reported as they were
not significant in any of the specifications.
19 One caveat with this variable is that many countries offer special tax incentives for FDI that are not captured
by the statutory corporate tax rates.
20 Most cross-country measures of the ease of doing business start in the 2000s. We also experimented with
using the cost of registering a business expressed as a percentage of gross national income from the World
Bank’s Doing Business database but the short sample period, measurement and identification issues restricts the
explanatory power of this variable and is not included in the results.

12
of GDP) is a function of a set of push ( tX ) and pull ,( , )t i iY Y factors, as well as unobserved
fixed and time varying factors.
*
, , ,t i o t t i i i t ifdi c X Y Y e
The change in FDI flows is a function of the difference between this equilibrium FDI and
FDI flows in the previous year.
*
, 1, , 1,(1 )( )t i t i t i t ifdi fdi fdi fdi
*
, 1, ,(1 )t i t i t ifdi fdi fdi
The estimated model in its reduced form is given by:
, 0 1 1, 2 3 , 4 ,t i t i t t i i i t ifdi fdi X Y Y u
Where the 1 parameter determines the speed of adjustment to the equilibrium level of
FDI. If it equals zero, there is immediate adjustment and as it approaches one, FDI inflows
become more persistent.
Given that the lagged FDI inflows and ,t iY are correlated with the unobserved country fixed
effects, standard fixed effects methods would yield biased estimates especially if the time
dimension of the panel is small.21 In our panel data, we have a relatively long time series
(20 years) for most variables but the time dimension is still small relative to the cross-section
dimension of the data (46 countries), and the time dimension drops in many specifications.
Therefore, we prefer to use the GMM system estimator as opposed to fixed effects methods.
Another important issue is the possible correlation between (,t iY ) and (
,t i ) which requires
that we find appropriate instruments for the endogenous variables in (,t iY ). We therefore use
the two-step system GMM estimator of Blundell and Bond (1998); which is a popular
method for estimating dynamic panel models with fixed effects and endogenous regressors,
as in our benchmark method.
We assume that some country-specific pull factors (,t iY ) such as the corporate tax rate, tariff
rates and political risk are pre-determined with respect to the unobserved country specific
effects (,i t iu ). We use lags of exports to GDP ratio, real GDP growth, inflation dummy
and real exchange rate as instruments to account for a possible correlation between these
21
See Roodman (2006) for more details on estimation bias using fixed effects estimator.

13
variables and the unobserved fixed effects. Finally, the time-varying common push
factors ( tX ) are assumed to be exogenous.
Results:
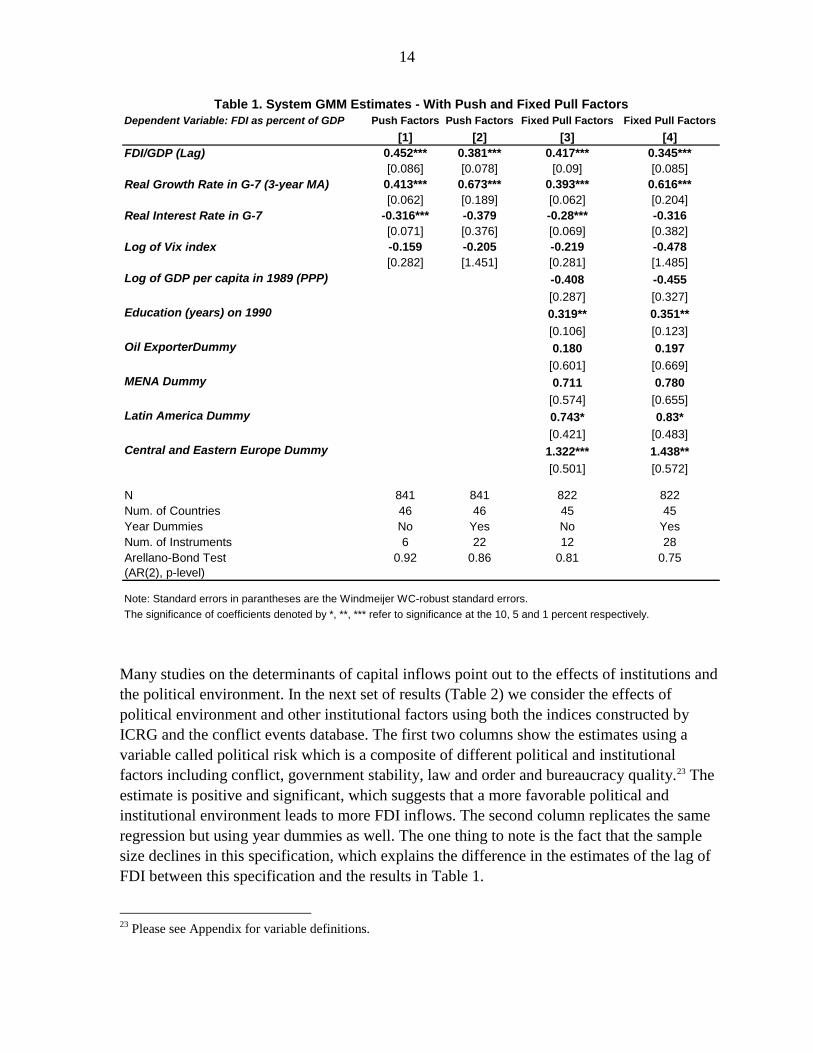
The results of the dynamic panel regression are shown in Table 1. We first include only the
global push factors and later add the country-specific structural or fixed factors.22 The first
column shows results for a specification where we include three common exogenous factors
(the 3-year moving average of the GDP weighted G-7 growth rate, the real average interest
rate in G-7 countries, and the VIX index to capture the effects of global uncertainty and the
risk environment). Consistent with previous studies, we find that FDI flows are pro-cyclical
with respect to growth in G-7 countries (a one percent increase in G-7 growth rates increased
FDI inflows by 0.4 percent of GDP), whereas an increase in real interest rates tends to lower
FDI flows. Market volatility and heightened uncertainty has a negative effect on FDI flows
but it is not significant in this specification. The second column runs the same regression
with time dummies to account for any correlation across countries that is not captured by the
three global factors. The results are not very different, except that the real interest rate
becomes insignificant in this specification.
Among the structural or fixed country-specific effects, GDP per capita in 1989 is significant
with a negative sign suggesting that the marginal productivity of capital might explain
differences in FDI inflows among emerging market economies. Education has a significant
positive effect on FDI; every additional year of schooling increases the FDI-to-GDP ratio by
about 0.3 percentage points. The oil and some of the location dummies are insignificant. It is
important to note that the Central and Eastern Europe dummy is highly significant and
positive (1.3–1.4 percent of GDP). This is not very surprising given their geographic
proximity to the European market and other unobserved characteristics that might be playing
a role such as institutions.
22 The Arellano-Bond test for autocorrelation rejects the existence of auto-correlation at conventional levels,
which suggests that the dynamic model’s moment assumptions are not violated. We use time restrictions to
limit the number of instruments. See Roodman (2008) for more on the issue of too many instruments in
dynamic panel models.
14
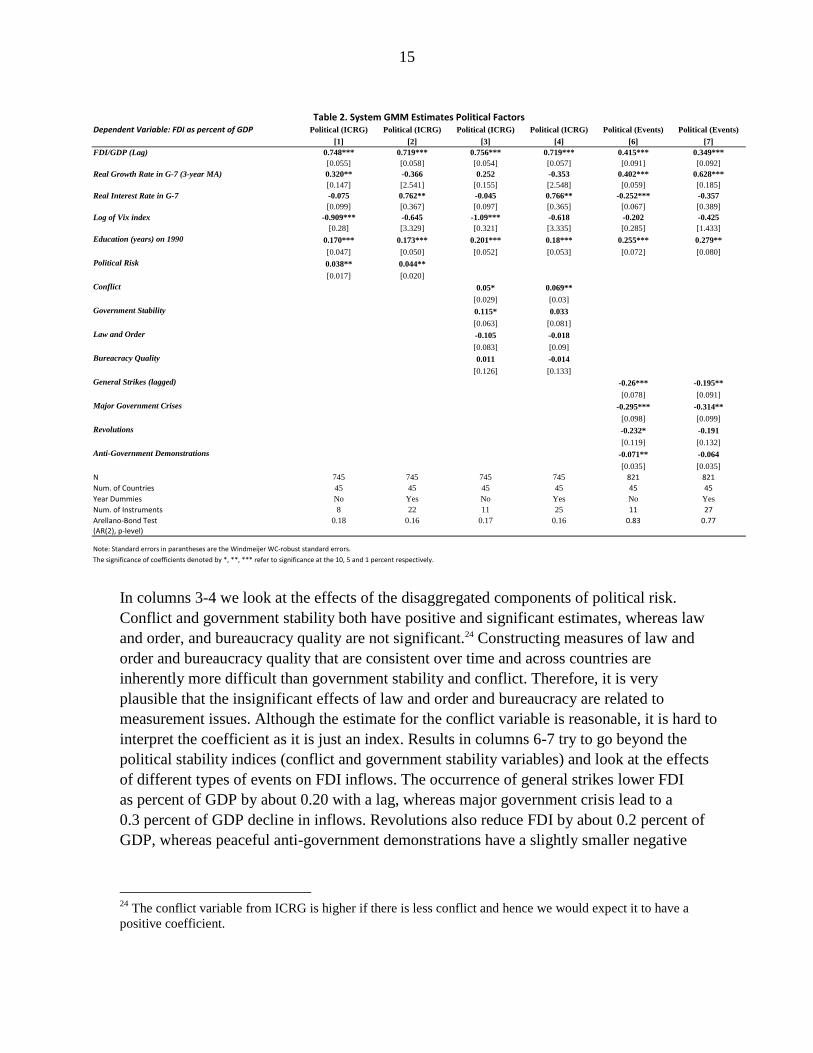
Many studies on the determinants of capital inflows point out to the effects of institutions and
the political environment. In the next set of results (Table 2) we consider the effects of
political environment and other institutional factors using both the indices constructed by
ICRG and the conflict events database. The first two columns show the estimates using a
variable called political risk which is a composite of different political and institutional
factors including conflict, government stability, law and order and bureaucracy quality.23 The
estimate is positive and significant, which suggests that a more favorable political and
institutional environment leads to more FDI inflows. The second column replicates the same
regression but using year dummies as well. The one thing to note is the fact that the sample
size declines in this specification, which explains the difference in the estimates of the lag of
FDI between this specification and the results in Table 1.
23
Please see Appendix for variable definitions.
Table 1. System GMM Estimates - With Push and Fixed Pull Factors
Dependent Variable: FDI as percent of GDP Push Factors Push Factors Fixed Pull Factors Fixed Pull Factors
[1] [2] [3] [4]
FDI/GDP (Lag) 0.452*** 0.381*** 0.417*** 0.345***
[0.086] [0.078] [0.09] [0.085]
Real Growth Rate in G-7 (3-year MA) 0.413*** 0.673*** 0.393*** 0.616***
[0.062] [0.189] [0.062] [0.204]
Real Interest Rate in G-7 -0.316*** -0.379 -0.28*** -0.316
[0.071] [0.376] [0.069] [0.382]
Log of Vix index -0.159 -0.205 -0.219 -0.478
[0.282] [1.451] [0.281] [1.485]
Log of GDP per capita in 1989 (PPP) -0.408 -0.455
[0.287] [0.327]
Education (years) on 1990 0.319** 0.351**
[0.106] [0.123]
Oil ExporterDummy 0.180 0.197
[0.601] [0.669]
MENA Dummy 0.711 0.780
[0.574] [0.655]
Latin America Dummy 0.743* 0.83*
[0.421] [0.483]
Central and Eastern Europe Dummy 1.322*** 1.438**
[0.501] [0.572]
N 841 841 822 822
Num. of Countries 46 46 45 45
Year Dummies No Yes No Yes
Num. of Instruments 6 22 12 28
Arellano-Bond Test 0.92 0.86 0.81 0.75
(AR(2), p-level)
Note: Standard errors in parantheses are the Windmeijer WC-robust standard errors.
The significance of coefficients denoted by *, **, *** refer to significance at the 10, 5 and 1 percent respectively.
15
Table 2. System GMM Estimates Political FactorsDependent Variable: FDI as percent of GDP Political (ICRG) Political (ICRG) Political (ICRG) Political (ICRG) Political (Events) Political (Events)
[1] [2] [3] [4] [6] [7]
FDI/GDP (Lag) 0.748*** 0.719*** 0.756*** 0.719*** 0.415*** 0.349***
[0.055] [0.058] [0.054] [0.057] [0.091] [0.092]
Real Growth Rate in G-7 (3-year MA) 0.320** -0.366 0.252 -0.353 0.402*** 0.628***
[0.147] [2.541] [0.155] [2.548] [0.059] [0.185]
Real Interest Rate in G-7 -0.075 0.762** -0.045 0.766** -0.252*** -0.357
[0.099] [0.367] [0.097] [0.365] [0.067] [0.389]
Log of Vix index -0.909*** -0.645 -1.09*** -0.618 -0.202 -0.425
[0.28] [3.329] [0.321] [3.335] [0.285] [1.433]
Education (years) on 1990 0.170*** 0.173*** 0.201*** 0.18*** 0.255*** 0.279**
[0.047] [0.050] [0.052] [0.053] [0.072] [0.080]
Political Risk 0.038** 0.044**
[0.017] [0.020]
Conflict 0.05* 0.069**
[0.029] [0.03]
Government Stability 0.115* 0.033
[0.063] [0.081]
Law and Order -0.105 -0.018
[0.083] [0.09]
Bureacracy Quality 0.011 -0.014
[0.126] [0.133]
General Strikes (lagged) -0.26*** -0.195**
[0.078] [0.091]
Major Government Crises -0.295*** -0.314**
[0.098] [0.099]
Revolutions -0.232* -0.191
[0.119] [0.132]
Anti-Government Demonstrations -0.071** -0.064
[0.035] [0.035]
N 745 745 745 745 821 821
Num. of Countries 45 45 45 45 45 45
Year Dummies No Yes No Yes No Yes
Num. of Instruments 8 22 11 25 11 27
Arellano-Bond Test 0.18 0.16 0.17 0.16 0.83 0.77(AR(2), p-level)
Note: Standard errors in parantheses are the Windmeijer WC-robust standard errors.
The significance of coefficients denoted by *, **, *** refer to significance at the 10, 5 and 1 percent respectively.
In columns 3-4 we look at the effects of the disaggregated components of political risk.
Conflict and government stability both have positive and significant estimates, whereas law
and order, and bureaucracy quality are not significant.24 Constructing measures of law and
order and bureaucracy quality that are consistent over time and across countries are
inherently more difficult than government stability and conflict. Therefore, it is very
plausible that the insignificant effects of law and order and bureaucracy are related to
measurement issues. Although the estimate for the conflict variable is reasonable, it is hard to
interpret the coefficient as it is just an index. Results in columns 6-7 try to go beyond the
political stability indices (conflict and government stability variables) and look at the effects
of different types of events on FDI inflows. The occurrence of general strikes lower FDI
as percent of GDP by about 0.20 with a lag, whereas major government crisis lead to a
0.3 percent of GDP decline in inflows. Revolutions also reduce FDI by about 0.2 percent of
GDP, whereas peaceful anti-government demonstrations have a slightly smaller negative
24
The conflict variable from ICRG is higher if there is less conflict and hence we would expect it to have a
positive coefficient.
16
effect.25 The results using both the ICRG indices and the events database suggest that
presence of conflict or major political instability has a large and negative effect on FDI
inflows.
In the next set of results (Table 3) we consider the effects of the macroeconomic environment
on FDI inflows. The first column shows the effect of inflation on FDI inflows, whereby we
use a dummy to indicate whether inflation was in single digits or not. The estimates suggest
that high inflation has a negative impact on FDI, but it is not statistically significant at
conventional levels. Although the choice of the inflation threshold is somewhat arbitrary, it is
meant to capture whether having single digit inflation has any effect on FDI and also
accounts for the conjecture that inflation has non-linear effects on FDI. In fact, in other
specifications (not reported) where we use the level or a moving average of the level of
inflation, the estimates become highly insignificant. Second and third columns add exports to
GDP and the real exchange rate respectively. In all of these specifications we use second and
third lags of the endogenous macroeconomic variables as instruments. The results also
suggest a positive but insignificant effect of exports to GDP. Real exchange rate appreciation
has a negative effect on FDI; however, it is also not significant.
25
We also tried to look at the effects of these events separately and got similar estimates and looking at their
cross correlations, one can see that they are not strongly correlated.
17
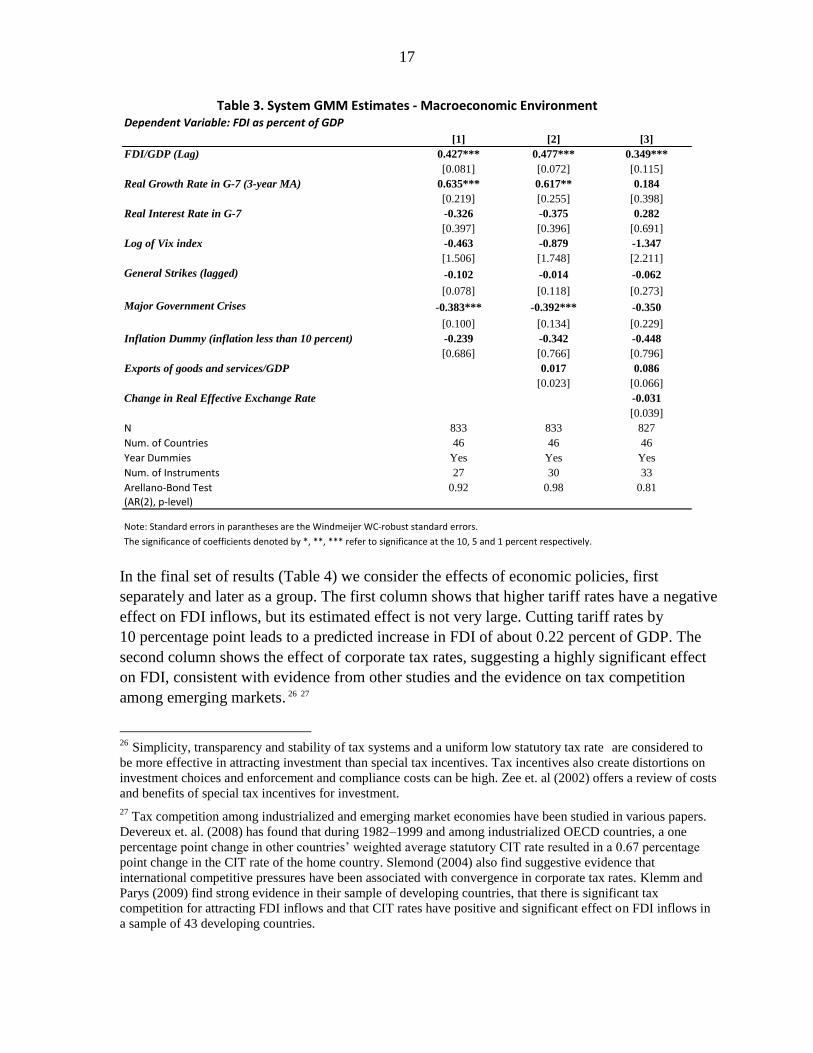
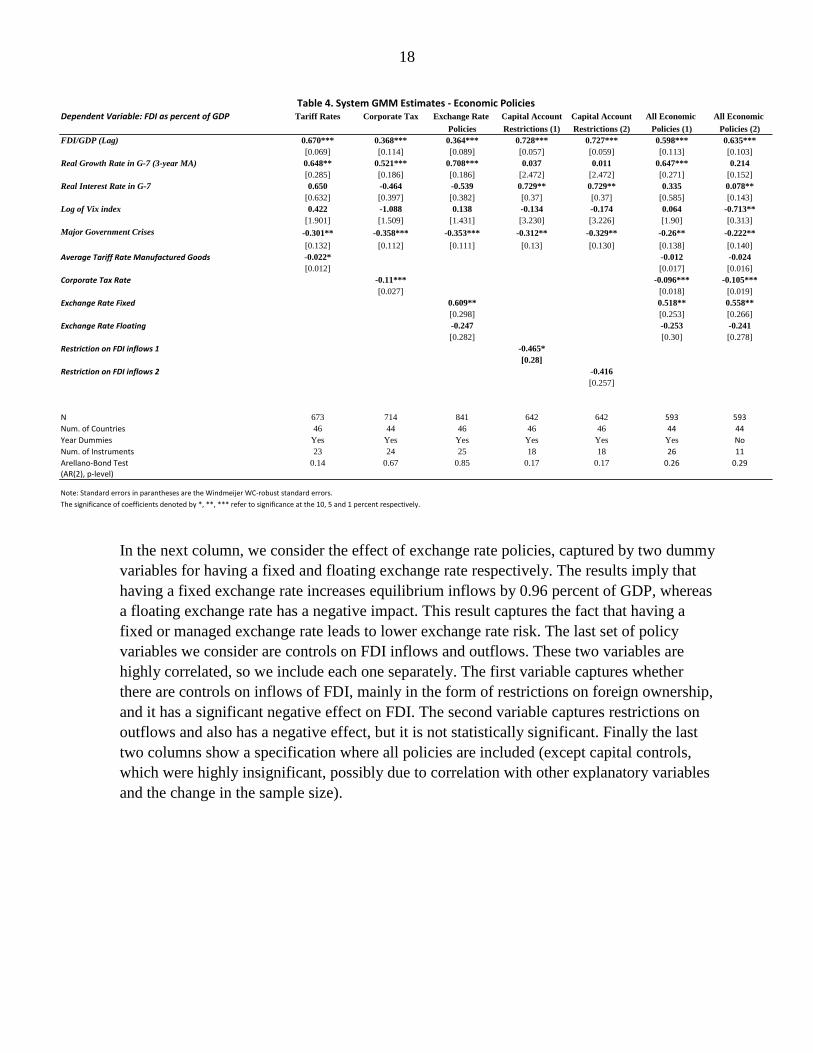
In the final set of results (Table 4) we consider the effects of economic policies, first
separately and later as a group. The first column shows that higher tariff rates have a negative
effect on FDI inflows, but its estimated effect is not very large. Cutting tariff rates by
10 percentage point leads to a predicted increase in FDI of about 0.22 percent of GDP. The
second column shows the effect of corporate tax rates, suggesting a highly significant effect
on FDI, consistent with evidence from other studies and the evidence on tax competition
among emerging markets. 26 27
26 Simplicity, transparency and stability of tax systems and a uniform low statutory tax rate are considered to
be more effective in attracting investment than special tax incentives. Tax incentives also create distortions on
investment choices and enforcement and compliance costs can be high. Zee et. al (2002) offers a review of costs
and benefits of special tax incentives for investment. 27
Tax competition among industrialized and emerging market economies have been studied in various papers.
Devereux et. al. (2008) has found that during 1982–1999 and among industrialized OECD countries, a one
percentage point change in other countries’ weighted average statutory CIT rate resulted in a 0.67 percentage
point change in the CIT rate of the home country. Slemond (2004) also find suggestive evidence that
international competitive pressures have been associated with convergence in corporate tax rates. Klemm and
Parys (2009) find strong evidence in their sample of developing countries, that there is significant tax
competition for attracting FDI inflows and that CIT rates have positive and significant effect on FDI inflows in
a sample of 43 developing countries.
Table 3. System GMM Estimates - Macroeconomic EnvironmentDependent Variable: FDI as percent of GDP
[1] [2] [3]
FDI/GDP (Lag) 0.427*** 0.477*** 0.349***
[0.081] [0.072] [0.115]
Real Growth Rate in G-7 (3-year MA) 0.635*** 0.617** 0.184
[0.219] [0.255] [0.398]
Real Interest Rate in G-7 -0.326 -0.375 0.282
[0.397] [0.396] [0.691]
Log of Vix index -0.463 -0.879 -1.347
[1.506] [1.748] [2.211]
General Strikes (lagged) -0.102 -0.014 -0.062
[0.078] [0.118] [0.273]
Major Government Crises -0.383*** -0.392*** -0.350
[0.100] [0.134] [0.229]
Inflation Dummy (inflation less than 10 percent) -0.239 -0.342 -0.448
[0.686] [0.766] [0.796]
Exports of goods and services/GDP 0.017 0.086
[0.023] [0.066]
Change in Real Effective Exchange Rate -0.031
[0.039]
N 833 833 827
Num. of Countries 46 46 46
Year Dummies Yes Yes Yes
Num. of Instruments 27 30 33
Arellano-Bond Test 0.92 0.98 0.81
(AR(2), p-level)
Note: Standard errors in parantheses are the Windmeijer WC-robust standard errors.
The significance of coefficients denoted by *, **, *** refer to significance at the 10, 5 and 1 percent respectively.
18
Table 4. System GMM Estimates - Economic PoliciesDependent Variable: FDI as percent of GDP Tariff Rates Corporate Tax Exchange Rate Capital Account Capital Account All Economic All Economic
Policies Restrictions (1) Restrictions (2) Policies (1) Policies (2)
FDI/GDP (Lag) 0.670*** 0.368*** 0.364*** 0.728*** 0.727*** 0.598*** 0.635***
[0.069] [0.114] [0.089] [0.057] [0.059] [0.113] [0.103]
Real Growth Rate in G-7 (3-year MA) 0.648** 0.521*** 0.708*** 0.037 0.011 0.647*** 0.214
[0.285] [0.186] [0.186] [2.472] [2.472] [0.271] [0.152]
Real Interest Rate in G-7 0.650 -0.464 -0.539 0.729** 0.729** 0.335 0.078**
[0.632] [0.397] [0.382] [0.37] [0.37] [0.585] [0.143]
Log of Vix index 0.422 -1.088 0.138 -0.134 -0.174 0.064 -0.713**
[1.901] [1.509] [1.431] [3.230] [3.226] [1.90] [0.313]
Major Government Crises -0.301** -0.358*** -0.353*** -0.312** -0.329** -0.26** -0.222**
[0.132] [0.112] [0.111] [0.13] [0.130] [0.138] [0.140]
Average Tariff Rate Manufactured Goods -0.022* -0.012 -0.024
[0.012] [0.017] [0.016]
Corporate Tax Rate -0.11*** -0.096*** -0.105***
[0.027] [0.018] [0.019]
Exchange Rate Fixed 0.609** 0.518** 0.558**
[0.298] [0.253] [0.266]
Exchange Rate Floating -0.247 -0.253 -0.241
[0.282] [0.30] [0.278]
Restriction on FDI inflows 1 -0.465*
[0.28]
Restriction on FDI inflows 2 -0.416
[0.257]
N 673 714 841 642 642 593 593
Num. of Countries 46 44 46 46 46 44 44
Year Dummies Yes Yes Yes Yes Yes Yes No
Num. of Instruments 23 24 25 18 18 26 11
Arellano-Bond Test 0.14 0.67 0.85 0.17 0.17 0.26 0.29(AR(2), p-level)
Note: Standard errors in parantheses are the Windmeijer WC-robust standard errors.
The significance of coefficients denoted by *, **, *** refer to significance at the 10, 5 and 1 percent respectively.
In the next column, we consider the effect of exchange rate policies, captured by two dummy
variables for having a fixed and floating exchange rate respectively. The results imply that
having a fixed exchange rate increases equilibrium inflows by 0.96 percent of GDP, whereas
a floating exchange rate has a negative impact. This result captures the fact that having a
fixed or managed exchange rate leads to lower exchange rate risk. The last set of policy
variables we consider are controls on FDI inflows and outflows. These two variables are
highly correlated, so we include each one separately. The first variable captures whether
there are controls on inflows of FDI, mainly in the form of restrictions on foreign ownership,
and it has a significant negative effect on FDI. The second variable captures restrictions on
outflows and also has a negative effect, but it is not statistically significant. Finally the last
two columns show a specification where all policies are included (except capital controls,
which were highly insignificant, possibly due to correlation with other explanatory variables
and the change in the sample size).
19
III. CONCLUSIONS
The global financial crisis has led to a substantial contraction in FDI inflows to emerging
market economies. Although other short-term inflows have resumed (at least more broadly),
FDI inflows have remained subdued in many countries. The extent to which inflows are
driven by domestic policies or other country-specific factors is an important policy question
given the role of FDI in financing investment. This paper found that both global push factors
and economic policies had a significant effect on FDI inflows for the set of emerging market
economies in our sample, especially during 2008–09 as G-7 growth rates declined and
uncertainty regarding future economic prospects increased.
Among the set of pull factors that were considered, lowering corporate tax rates and tariffs
and a stable exchange rate were found to be statistically important determinants of FDI
inflows. Accounting for the effects of policy changes or shifts was found to be useful in
explaining sharp increases in FDI inflows. Among other country-specific variables that are
more structural in nature, and hence changing more slowly education was found to be highly
significant. Political stability also appears to be a crucial factor in attracting FDI inflows.
Countries that are more prone to domestic conflict and political instability have experienced
lower FDI than other countries with similar characteristics. Although the analysis in this
paper does not concentrate on the sources of domestic conflict and instability, the significant
negative effects of domestic conflict on FDI suggests that economic policies that promote
inclusive growth may be highly important. Countries that experience repressed instability
may in the future face sudden stops of inflows, reversing previous gains from prudent
macroeconomic policies.
The empirical exercise presented in this paper fails to consider many potentially relevant
policy measures because of data limitations. Going forward, expanding the set of policy
variables included in the empirical exercise may yield useful insights. Our empirical work
also focuses exclusively on the impact of policies on FDI inflows, but does not investigate
factors that link higher FDI inflows with growth and social outcomes. As has been noted
elsewhere, the growth benefits of FDI accrue mainly through technology transfers, imports of
knowledge and managerial expertise, and spillovers to other industries and competition.
Additional actions are usually needed to ensure that these conditions materialize and that the
benefits of higher, FDI-induced growth are widely shared. Such measures include
investments in infrastructure and human capital (which also attract more FDI); improvements
in governance, labor market performance, and financial sector intermediation; and the
establishment of social safety nets to protect the most vulnerable.
20
REFERENCES
Alfaro, Laura, Areendam Chanda, Sebnem Kalemli-Ozcan and Selin Sayek, 2004, ―FDI and
Economic Growth: The Role of Local Financial Markets,‖ Journal of International
Economics, 64, 2004, pp. 84-112.
Alfaro, Laura, Sebnem Kalemli-Ozcan and Vadym Volosovch, 2007, ―Capital Flows in a
Globalized World: The Role of Policies and Institutions,‖ in Capital Controls and Capital
Flows in Emerging Economies: Policies, Practices and Consequences, edit. by Sebastian
Edwards, May 2007, pp. 19–72.
Barro, R. and Jong-Wha Lee, 2010, ―A New Data Set of Educational Attainment in the
World, 1950–2010, NBER Working Paper No. 15902.
Blundell, Richard and Stephen Bond, 1998, ―Initial Conditions and Moment Restrictions in
Dynamic Panel Data Models,‖ Journal of Econometrics, Vol. 87, pp. 115–143.
Borensztein, E., J. DeGregorio, and J-W. Lee, 1998, ―How Does Foreign Direct Investment
Affect Economic Growth?‖ Journal of International Economics, Vol. 45, pp.115–135.
Calvo, Guillermo, Leonardo Leiderman and Carmen M. Reinhart, 1996, ―Inflows of Capital
to Developing Countries in the 1990s, The Journal of Economic Perspectives, Vol. 10, No. 2,
(Spring, 1996), pp. 123–139.
Campos, Nauro F. and Yuko Kinoshita, 2003, ―Why Does FDI Go Where It Goes? New
Evidence From the Transition Economies,‖ IMF Working Paper 03/228.
Campos, Nauro F. and Yuko Kinoshita, 2008, ―Foreign Direct Investment and Structural
Reforms: Evidence from Eastern Europe and Latin America,‖ IMF Working Paper 08/26.
Cheng, L. and Y. Kwan, 2000, ―What are the Determinants of the Location of Foreign Direct
Investment? The Chinese Experience,‖ Journal of International Economics, Vol. 51, pp. 379–
400.
Chai, Jingquing, and Rishi Goyal, 2008, ―Tax Concessions and Foreign Direct Investment in
the Eastern Caribbean Currency Union,‖ IMF Working Paper 08/257.
Dabla-Norris, Era, Jiro Honda, Amina Lahreche and Genevieve Verdies, 2010, ―FDI Flows
to Low- Income Countries: Global Drivers and Growth Implications,‖ IMF Working Paper
10/132 (Washington: International Monetary Fund).
Demekas, Dimitri G., Balazs Horvath, Elina Ribakova and Yi Wu, 2005, ―Foreign Direct
Investment in southeastern Europe: How (and How Much) Can Policies Help?‖ IMF
Working Paper 05/110(Washington: International Monetary Fund).
21
Devereux, M. P., B. Lockwood and M. Redoano, 2008, ―Do Countries Compete Over
Corporate Tax Rates,‖ Journal of Public Economics, 92, pp.1210–1235.
Faria, Andre and Paolo Mauro, 2004, ―Institutions and the External Capital Structure of
Countries,‖ IMF Working Paper, 04/236(Washington: International Monetary Fund).
Hein, S., 1992, ―Trade Strategy and the Dependency Hypothesis: A Comparison of Policy,
Foreign Investment, and Economic Growth in Latin America and East Asia,‖ Economic
Development and Cultural Change 40 (3): 495–521.
International Monetary Fund, 2007, World Economic Outlook, Chapter 3,
October 200:Managing Large Capital Inflows (Washington).
International Monetary Fund, 2010, Western Hemisphere Department Regional Economic
Outlook, Spring 2010.
Klemm, Alexander and Stefan Van Parys, 2009, ―Empirical Evidence on the Effects of Tax
Incentives,‖ IMF Working Paper, 09/136 (Washington: International Monetary Fund).
Kose, Ayhan, Eswar Prasad, Kenneth Rogoff, and Shang-Jin Wei, 2009, ―Financial
Globalization: A Reappraisal,‖ Staff Papers, International Monetary Fund, Vol. 56 (1),
pp.8–62.
Kose, Ayhan, Eswar Prasad, and Ashley Taylor, 2009, ―Thresholds in the Process of
Financial Integration,‖ NBER Working Paper No. 14916.
Lucas, R., 1993, ―On the Determinants of Direct Foreign Investment: Evidence from East
and Southeast Asia‖ World Development, 21 (3): 391–406.
Piatkowski, Marcin and Mariusz Jarmuzek, 2008, ―Zero Corporate Income Tax in Moldova:
Tax Competition and Its Implications for Eastern Europe,‖ IMF Working Paper, 08/203
(Washington: International Monetary Fund).
Roodman, David, 2006, ―How to Do xtabond2: An Introduction to ―Difference‖ and
―System‖ GMM in Stata,‖ Center for Global Development Working Paper No: 103.
Roodman, David, 2008, ―A Note of the Theme of Too Many Instruments,‖ Center for Global
Development Working Paper No: 125.
Rummel, Rudolph J., 1963, ―Dimensions of Conflict Behavior Within and Between
Nations,‖ General Systems Yearbook, VIII, 1963, 1–50.
Schindler, Martin, 2009, ―Measuring Financial Integration: A New Data Set,‖ Staff Papers,
International Monetary Fund, Vol. 56, No.1, 2009, pp. 222–238.

22
Schneider, F. and B. Frey, 1985, ―Economic and Political Determinants of Foreign Direct
Investment,‖ World Development, 13 (2): 161–175.
Singh, Harinder and Kwang W. Jun, 1995, ―Some New Evidence on Determinants of Foreign
Direct in Developing Countries,‖ Policy Research Working Paper No: 1531, World Bank,
November 1995.
Slemond, Joel, 2004, ―Are Corporate Tax Rates, or Countries, Converging?‖ Journal of
Public Economics, 88, 1169–1186.
United Nations Conference on Trade and Development (UNCTAD), 2009, ―Assessing the
Impact of the Current Financial and Economic Crisis on Global FDI Flows,‖ April 2009.
Walsh, James P. and Jiangyan Yu, 2010, ―Determinants of Foreign Direct Investment: A
Sectoral and Institutional Approach,‖ IMF Working Paper 10/187.
Wei, S.J., 2000, ―Local Corruption and Global Capital Flows,‖ Brookings Papers on
Economic Activity, 2000 (2), pp.303–54.
Zee, H.H., J.G. Stotsky, and E. Ley, 2002, ―Tax Incentives for Business Investment: A
Primer for Policy Makers in Developing Countries,‖ World Development, Vol. 30(9), pp.
1497-1516.

23
APPENDIX
Identification of Inflow Episodes
For each country in the sample, we compute the deviation of FDI inflows as percent of GDP
from its trend (FDI gap) calculated by the HP-Filter with a smoothing parameter that equals
100. A year is identified as an inflow episode if the FDI inflow during that year has been
higher than the trend flow plus one standard deviation of the FDI gap for that country. If
there is less than two years between two episodes for any country, we treat all the adjacent
years as part of the same inflow episode. The table below lists the episodes that were
identified using this method for all the countries in our sample.
Table 1 - FDI Inflow Surges and The EME Country Coverage
Emerging Market Economies in Sample FDI Infow Episodes
Algeria 2001, 2004
Argentina 1999
Brazil 1998-2000
Bulgaria 2006-2007
Chile 1999
China,P.R.: Mainland 1993-1995
Colombia 1997, 2005-2008
Costa Rica 1998, 2006-2007
Croatia 1999-2001
Czech Republic 1999, 2002, 2005
Dominican Republic 1998, 2008
Ecuador 1998-1999
Egypt 2006-2007
El Salvador 1998, 2007
Estonia 1998, 2005
Guatemala 1998, 2001
Hungary 2007
India 2008
Indonesia 1996-1997, 2005
Israel 2000, 2006
Jamaica 1999-2003, 2008
Jordan 2000, 2005-2006
Kazakhstan 1993, 2001
Korea, Republic of 1998-2000, 2004
Latvia 1996-1997, 2006-2007
Lebanon 1997, 2003
Lithuania 2998, 2006
Malaysia 1992, 2007
Mexico 1995, 2001
Morocco 1994, 2003
Pakistan 1996, 2006-2007
Panama 1997-1998, 2006
Peru 1994-1996
Philippines 1998-2000, 2006
Poland 2000, 2006-2007
Romania 1998, 2004-2006
Russian Federation 1992, 1999, 2007-2008
Slovak Republic 2000-2002
South Africa 1997, 2001
Sri Lanka 1993, 1997
Thailand 1998-1999
Tunisia 1993, 2006
Turkey 2001, 2006-2007
Ukraine 2005
Uruguay 2006
Venezuela, Rep. Bol. 1991, 1997-1998
24
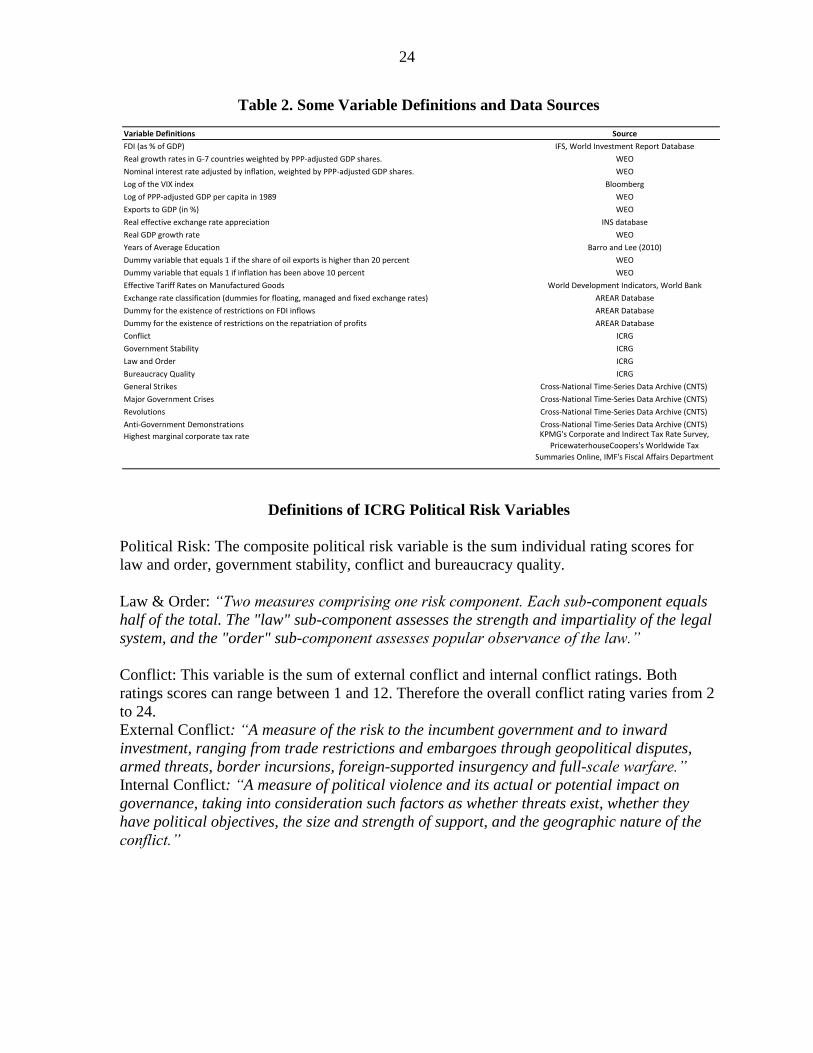
Table 2. Some Variable Definitions and Data Sources
Definitions of ICRG Political Risk Variables
Political Risk: The composite political risk variable is the sum individual rating scores for
law and order, government stability, conflict and bureaucracy quality.
Law & Order: “Two measures comprising one risk component. Each sub-component equals
half of the total. The "law" sub-component assesses the strength and impartiality of the legal
system, and the "order" sub-component assesses popular observance of the law.”
Conflict: This variable is the sum of external conflict and internal conflict ratings. Both
ratings scores can range between 1 and 12. Therefore the overall conflict rating varies from 2
to 24.
External Conflict: “A measure of the risk to the incumbent government and to inward
investment, ranging from trade restrictions and embargoes through geopolitical disputes,
armed threats, border incursions, foreign-supported insurgency and full-scale warfare.”
Internal Conflict: “A measure of political violence and its actual or potential impact on
governance, taking into consideration such factors as whether threats exist, whether they
have political objectives, the size and strength of support, and the geographic nature of the
conflict.”
Variable Definitions Source
FDI (as % of GDP) IFS, World Investment Report Database
Real growth rates in G-7 countries weighted by PPP-adjusted GDP shares. WEO
Nominal interest rate adjusted by inflation, weighted by PPP-adjusted GDP shares. WEO
Log of the VIX index Bloomberg
Log of PPP-adjusted GDP per capita in 1989 WEO
Exports to GDP (in %) WEO
Real effective exchange rate appreciation INS database
Real GDP growth rate WEO
Years of Average Education Barro and Lee (2010)
Dummy variable that equals 1 if the share of oil exports is higher than 20 percent WEO
Dummy variable that equals 1 if inflation has been above 10 percent WEO
Effective Tariff Rates on Manufactured Goods World Development Indicators, World Bank
Exchange rate classification (dummies for floating, managed and fixed exchange rates) AREAR Database
Dummy for the existence of restrictions on FDI inflows AREAR Database
Dummy for the existence of restrictions on the repatriation of profits AREAR Database
Conflict ICRG
Government Stability ICRG
Law and Order ICRG
Bureaucracy Quality ICRG
General Strikes Cross-National Time-Series Data Archive (CNTS)
Major Government Crises Cross-National Time-Series Data Archive (CNTS)
Revolutions Cross-National Time-Series Data Archive (CNTS)
Anti-Government Demonstrations Cross-National Time-Series Data Archive (CNTS)
Highest marginal corporate tax rate KPMG's Corporate and Indirect Tax Rate Survey,
PricewaterhouseCoopers's Worldwide Tax
Summaries Online, IMF's Fiscal Affairs Department

25
Government Stability: The point score ranges from 1 to 12.
“A measure of the government's ability to stay in office and carry out its declared
program(s), depending upon such factors as the type of governance, cohesion of the
government and governing parties, approach of an election, and command of the
legislature.”
Bureaucracy Quality: The score ranges from 1 to 4.
“Institutional strength and quality of the bureaucracy is a shock absorber that tends to
minimize revisions of policy when governments change. In low-risk countries, the
bureaucracy is somewhat autonomous from political pressure.”
Definitions of Domestic Conflict Events
Source of the data is the Cross-National Time-Series Data Archive (CNTS) which derives
most of its events from the New York Times. The event variable definitions have been
adopted from Rummel (1963).
General Labor Strikes: “Any strike of 1,000 or more industrial or service workers that
involves more than one employer and that is aimed at national government policies or
authority.”
Major Government Crises: “Any rapidly developing situation that threatens to bring the
downfall of the present regime – excluding situations of revolt aimed at such overthrow.”
Revolutions: “Any illegal or forced change in the top government elite, any attempt at such a
change, or any successful or unsuccessful armed rebellion whose aim is independence from
the central government.”
Anti-government Demonstrations: “Any peaceful public gathering of at least 100 people for
the primary purpose of displaying or voicing their opposition to government policies or
authority, excluding demonstrations of a distinctly anti-foreign nature.”