Embed Size (px)
Citation preview
AAsssseessssiinngg tthhee EEmmppllooyymmeenntt EEffffeecctt
ooff FFDDII IInnfflloowwss ttoo EEggyypptt::
DDooeess tthhee MMooddee ooff EEnnttrryy MMaatttteerr??
NADA MASSOUD LECTURER, THE BRITISH UNIVERSITY IN EGYPT
E-mail: [email protected]
IInntteerrnnaattiioonnaall CCoonnffeerreennccee oonn “TThhee UUnneemmppllooyymmeenntt CCrriissiiss iinn tthhee AArraabb CCoouunnttrriieess””
((1177--1188 MMaarrcchh 22000088,, CCaaiirroo-- EEggyypptt))
AASSSSEESSSSIINNGG TTHHEE EEMMPPLLOOYYMMEENNTT EEFFFFEECCTT OOFF FFDDII IINNFFLLOOWWSS TTOO EEGGYYPPTT:: DDOOEESS TTHHEE MMOODDEE OOFF EENNTTRRYY MMAATTTTEERR?? 11
NNAADDAA MMAASSSSOOUUDD
II.. IINNTTRROODDUUCCTTIIOONN::
Foreign direct investment (FDI) has dominated economic literature, especially the development areas of economics, over the last thirty years, due to the potential effects it has on the economy of a host country; these effects range from influencing the production, employment, income, prices, exports, imports, to affecting the economic growth, balance of payments, and general welfare of the host country. The importance of FDI also increased in the 1990s with the globalization of the international economy; many economists consider FDI one of the leading factors in the changing economic environment. Driven by this, Egypt has attempted to attract FDI since 1974 and has offered generous incentives to achieve this target. The Egyptian goal of attracting FDI was particularly motivated by low domestic savings rates accompanied by inefficient financial intermediation, which hampered Egypt's strategies to finance growth. The other motivation behind Egypt’s attempt to attract FDI was the opportunity to benefit from the direct and indirect effects of FDI on increasing demand for labour2. This is especially important given a chronic unemployment problem that the Egyptian economy suffers from3. However, Egypt lacks thorough studies on FDI in general and the assessment of the effects of FDI on employment in particular, which has affected the formulation of appropriate promotion policies for FDI in Egypt. Considering the importance of the unemployment problem in Egypt and the potential positive impact that FDI can have on employment generation on one hand, and the scarcity of studies covering the subject in Egypt on the other hand, this study assesses the effects of FDI on employment in Egypt. In this study, we test the hypothesis that Egypt’s experience with FDI (from the initiation of liberalized policies since 1974) does not show that FDI exerts a positive influence on employment. The study argues that this is because FDI is not an aggregate phenomenon, rather, FDI has different components: Greenfield FDI and mergers and acquisitions. These different components have different, if not contradicting effects, and should not be treated as a homogenous group under the title FDI. Thus, FDI is addressed as an aggregate, and it is also disaggregated by the modes of entry and the different sectoral distribution.
1 This is the first version of the paper. 2 FDI has a direct and indirect impact on domestic employment: It often generates new employment, especially in the case of Greenfield investments, and that is the direct effect. FDI also creates jobs through forward and backward linkages with domestic firms, and that is the indirect effect on employment in the host country (Asiedu 2003:5).
2
3 Unemployment in Egypt hovered around 10% over the last 20 years (Ministry of Planning)
A novelty of the study is the empirical investigation of the effects of FDI on employment on the basis of a broad panel of sectoral national accounts data for Egypt during the period 1974-2005. Such an investigation based on sectoral data has the advantage of increasing the number of observations, and thus the degrees of freedom, as opposed to aggregate data. For the purposes of the analysis, we estimate a reduced form function for the demand for labour; using variables that we think most affect the demand for labour in Egypt. The paper corrects for endogeneity and correlation problems in the econometrics framework of the utilized models by using Instrumental Variables (IV) technique. The study is divided into four sections in addition to an introduction and a conclusion. Following this introduction, section two reviews the status of the absorptive capacity of Egypt to see where Egypt stands in relation to the findings of the empirical literature that identified four main prerequisites for FDI to generate positive effects on the host country, these pre-requisites are: the stock of human capital; the size of the technology gap; the level of financial sector development; and the openness of the trade regime. Thus in section two we review these four prerequisites in Egypt. In section three, the labour demand function is introduced and we test the effect of FDI on employment in Egypt. FDI is treated as an aggregate, and we test the different hypotheses that were presented in the empirical literature on FDI and its relation with growth to see whether or not the effect of FDI inflows on growth in Egypt depends on the level of human capital stock, the country’s technology gap, its financial development, or the openness of its trade regime. Section four discusses the results of the econometric model and assesses FDI's effect on employment in Egypt.
IIII.. EEGGYYPPTT’’SS AABBSSOORRPPTTIIVVEE CCAAPPAACCIITTYY:: The absorptive capacity means the host country’s ability to absorb FDI, and hence benefit from its potential externalities. The empirical literature has shown that the effect of FDI on growth depends on the absorptive capacity of the host country which is determined mainly by four factors: The human capital quality of the host country; the level of technology used in domestic production in the host country; the level of financial sector development, and the degree of openness of the host countries trade regime. The level of education in the host country, or the human capital quality is important because if the domestic work force lacks sufficient schooling, the transfer of skills from TNCs to their employees may be hindered. The effect of the technology gap on the country's ability to benefit from spillovers is subject to different views; it is argued by many economists that if the technology gap between host and home country is too big, the externalities will not spread to the local companies, i.e., the gap will be too wide to bridge. However, some empirical research has found that externalities have a larger magnitude when there is a large technology gap.
3
The level of financial sector development is also of crucial importance for a country to benefit from FDI externalities as a lack of financial development can prevent domestic and
foreign firms from accessing the financial resources that are needed for the desired technological upgrading that may be triggered by the externalities of TNCs presence in the host country’s local market. The presence of sound efficient financial markets allows an efficient allocation of investments for technology enhancement. Finally, the existence of an open trade regime would also determine the effect of FDI on growth as it is argued that the openness of trade regime involves the transfer of technology. (See Krogstrup and Matar 2005: 7, Haskel et al 2002, and Thuy 2005). In this section we review the factors determining the absorptive capacity of Egypt for FDI.
- Human Capital
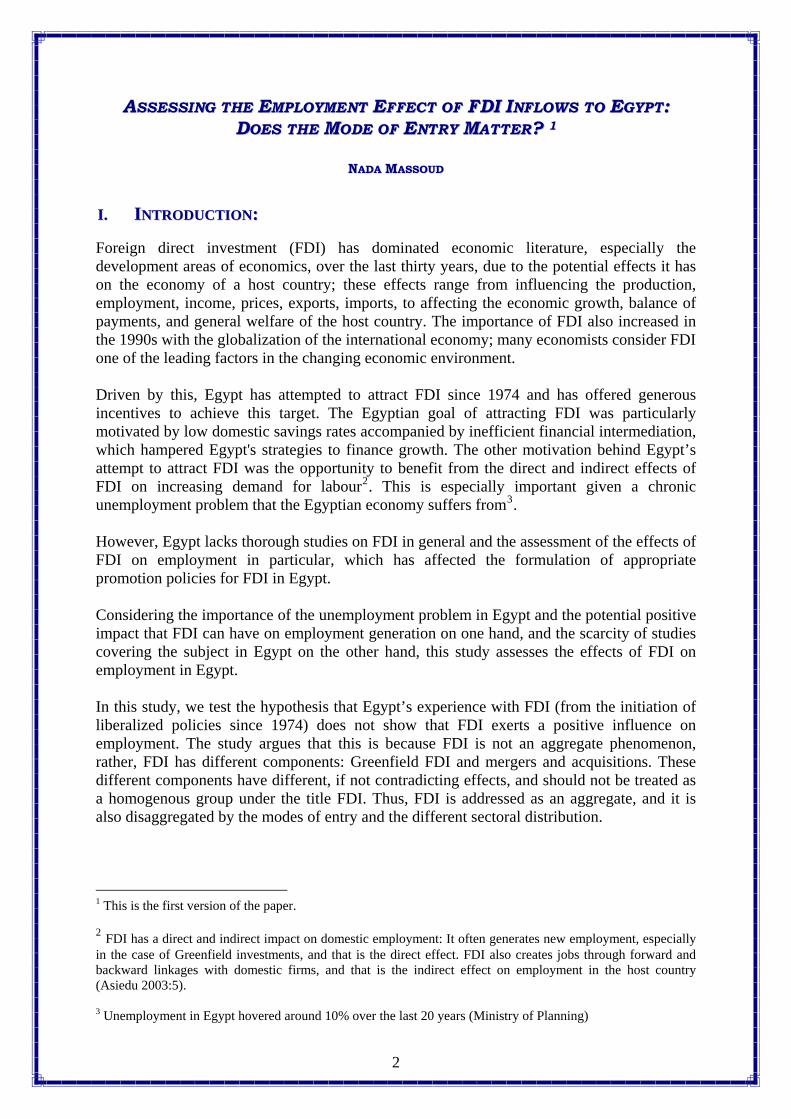
The quality of human capital, as measured by the average years of secondary schooling of the population, is one of the most mentioned absorptive capacity factors in the literature. It is argued that host countries are not in a position to reap positive externalities from FDI if they have an uneducated work force. We calculate the average years of secondary schooling of the population above 25 years, using the methodology applied by the educational attainment calculations from Barro and Lee 2000 for Egypt, and we can see from figure 1 that educational attainment has been increasing in Egypt over the studied period. However, whether or not that level of educational attainment is sufficient for Egypt to reap the benefits of FDI remains an empirical issue to be tested in the coming sections and chapters.
FFiigguurree 11:: HHuummaann CCaappiittaall QQuuaalliittyy iinn EEggyypptt (1974-2005), (Average Years of Secondary Schooling)(1974-2005), (Average Years of Secondary Schooling)
0.00
0.50
1.00
1.50
2.00
2.50
1974
1976
1978
1980
1982
1984
1986
1988
1990
1992
1994
1996
1998
2000
2002
2004
yrs
Source: Calculated based on the methodology of Barro and Lee 2000 using data from HDI 2005
4
- Technology Gap
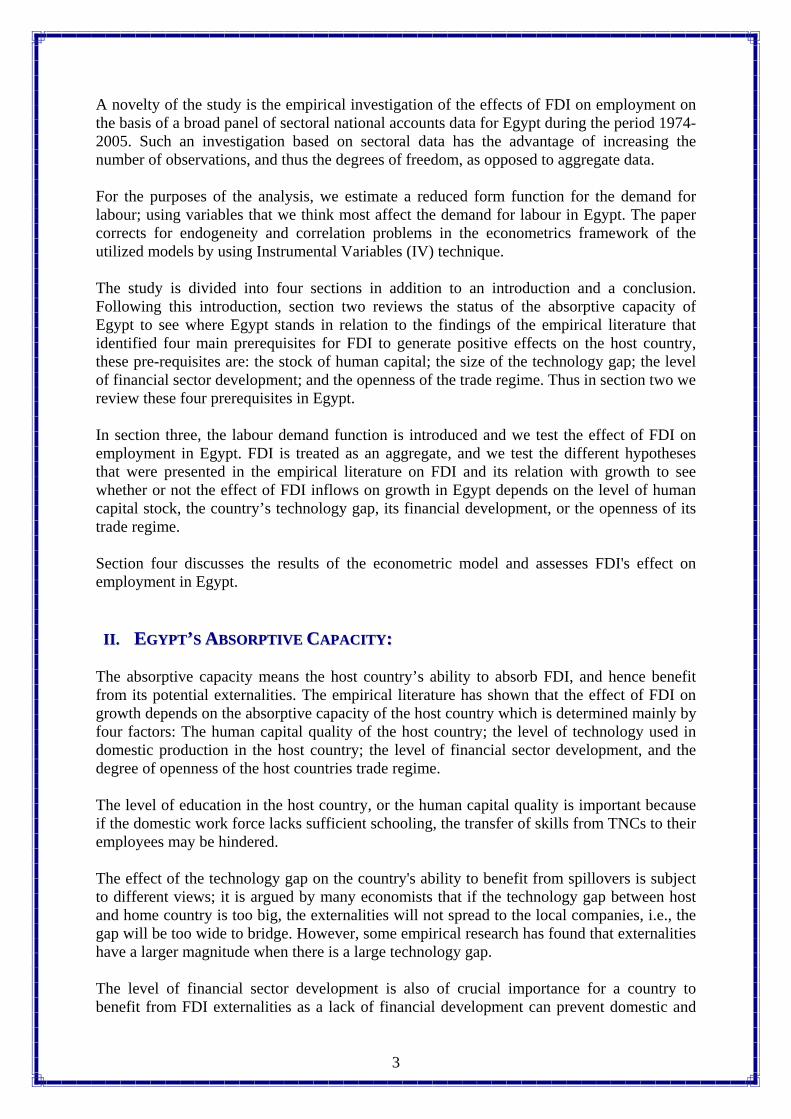
Krogstrup and Matar 2005 quote the conclusions on the effect of the technology gap on the host’s country ability to reap the potential positive spillovers from FDI that were reached by Li and Liu (2005). They use the ratio of the gap between US GDP per capita and host country GDP per capita relative to host country GDP per capita as proxy for the technology gap4, and they conclude that the lower the level of technological development of the host country, the smaller (or more negative) is the impact of FDI on such country. We apply their measure of the technology gap on Egypt during the period 1974-2005 using data from the WDI on the US GDP per capita and the Egyptian GDP per capita at constant 1995 US dollars. The results, as presented in figure 2, show that the technology gap of Egypt was above 200% in all years, however, it fluctuated a lot across the studied period and the empirical testing in the rest of this chapter and chapters six and seven will show how this wide technology gap or this level of technological development affects FDI's effect on growth in Egypt.
Figure 2: Technology Gap of Egypt (1974-2005)Figure 2: Technology Gap of Egypt (1974-2005)
0%
200%
400%
600%
800%
1000%
1200%
1400%
1974
1976
1978
1980
1982
1984
1986
1988
1990
1992
1994
1996
1998
2000
2002
2004
Source: Calculated from the IFS website data
- Financial Development
Many studies point to the development of the financial sector of the host country as one of the determinants for the absorptive capacity of the country to benefit from FDI spillovers, as it is argued that countries with well-developed financial markets gain significantly from FDI (Alfaro et al 2002). Sadik and Bolbol 2003 test the validity of this hypothesis and find that when the banking sector credit to the private sector is above 13% of GDP, FDI will start benefiting the host economy. Krogstrup and Matar 2005 also quoted the results reached by Hermes and Lensink 2003, who found that a certain degree of host country development of the financial system, measured as domestic credit to the private sector provided by the
5
4 The United States is taken is the benchmark for technological advancement as the US is the most technologically advanced country.
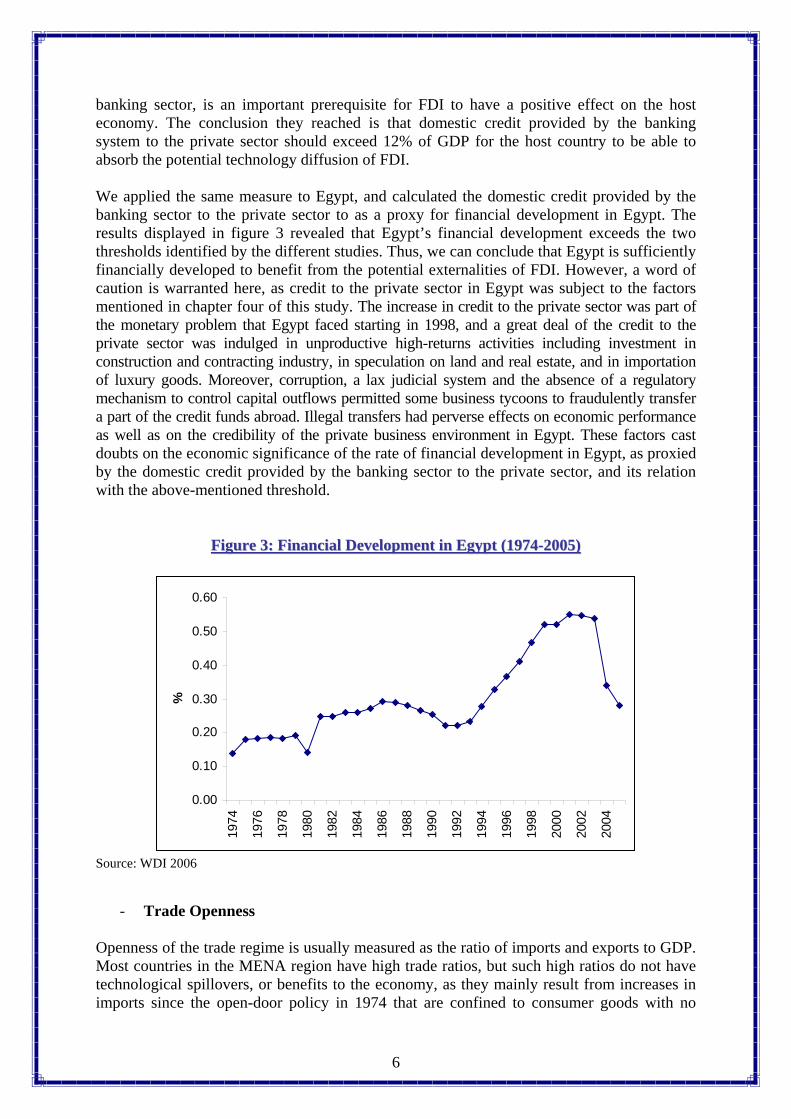
banking sector, is an important prerequisite for FDI to have a positive effect on the host economy. The conclusion they reached is that domestic credit provided by the banking system to the private sector should exceed 12% of GDP for the host country to be able to absorb the potential technology diffusion of FDI. We applied the same measure to Egypt, and calculated the domestic credit provided by the banking sector to the private sector to as a proxy for financial development in Egypt. The results displayed in figure 3 revealed that Egypt’s financial development exceeds the two thresholds identified by the different studies. Thus, we can conclude that Egypt is sufficiently financially developed to benefit from the potential externalities of FDI. However, a word of caution is warranted here, as credit to the private sector in Egypt was subject to the factors mentioned in chapter four of this study. The increase in credit to the private sector was part of the monetary problem that Egypt faced starting in 1998, and a great deal of the credit to the private sector was indulged in unproductive high-returns activities including investment in construction and contracting industry, in speculation on land and real estate, and in importation of luxury goods. Moreover, corruption, a lax judicial system and the absence of a regulatory mechanism to control capital outflows permitted some business tycoons to fraudulently transfer a part of the credit funds abroad. Illegal transfers had perverse effects on economic performance as well as on the credibility of the private business environment in Egypt. These factors cast doubts on the economic significance of the rate of financial development in Egypt, as proxied by the domestic credit provided by the banking sector to the private sector, and its relation with the above-mentioned threshold.
Figure 3: Financial Development in Egypt (1974-2005)Figure 3: Financial Development in Egypt (1974-2005)
0.00
0.10
0.20
0.30
0.40
0.50
0.60
1974
1976
1978
1980
1982
1984
1986
1988
1990
1992
1994
1996
1998
2000
2002
2004
%
Source: WDI 2006
- Trade Openness
6
Openness of the trade regime is usually measured as the ratio of imports and exports to GDP. Most countries in the MENA region have high trade ratios, but such high ratios do not have technological spillovers, or benefits to the economy, as they mainly result from increases in imports since the open-door policy in 1974 that are confined to consumer goods with no
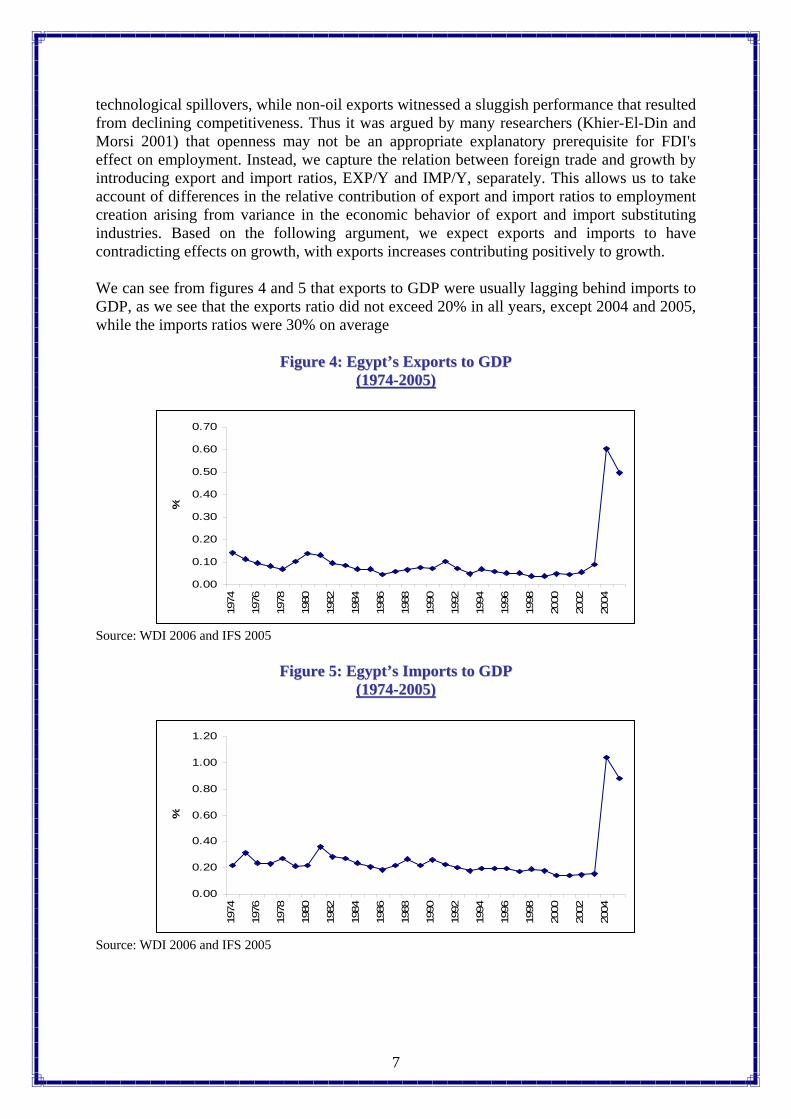
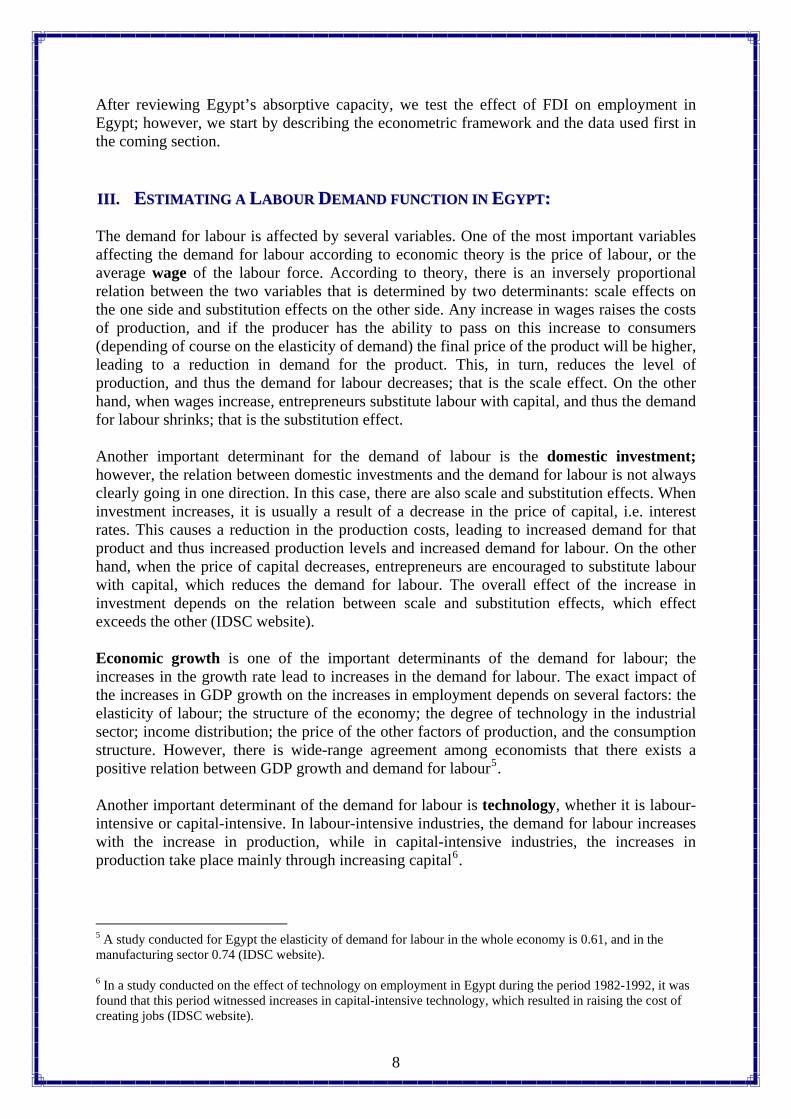
technological spillovers, while non-oil exports witnessed a sluggish performance that resulted from declining competitiveness. Thus it was argued by many researchers (Khier-El-Din and Morsi 2001) that openness may not be an appropriate explanatory prerequisite for FDI's effect on employment. Instead, we capture the relation between foreign trade and growth by introducing export and import ratios, EXP/Y and IMP/Y, separately. This allows us to take account of differences in the relative contribution of export and import ratios to employment creation arising from variance in the economic behavior of export and import substituting industries. Based on the following argument, we expect exports and imports to have contradicting effects on growth, with exports increases contributing positively to growth. We can see from figures 4 and 5 that exports to GDP were usually lagging behind imports to GDP, as we see that the exports ratio did not exceed 20% in all years, except 2004 and 2005, while the imports ratios were 30% on average
FFiigguurree 44:: EEggyypptt’’ss EExxppoorrttss ttoo GGDDPP (1974-2005)(1974-2005)
0.00
0.10
0.20
0.30
0.40
0.50
0.60
0.70
1974
1976
1978
1980
1982
1984
1986
1988
1990
1992
1994
1996
1998
2000
2002
2004
%
Source: WDI 2006 and IFS 2005
FFiigguurree 55:: EEggyypptt’’ss IImmppoorrttss ttoo GGDDPP
(1974-2005)(1974-2005)
0.00
0.20
0.40
0.60
0.80
1.00
1.20
1974
1976
1978
1980
1982
1984
1986
1988
1990
1992
1994
1996
1998
2000
2002
2004
%
Source: WDI 2006 and IFS 2005
7
After reviewing Egypt’s absorptive capacity, we test the effect of FDI on employment in Egypt; however, we start by describing the econometric framework and the data used first in the coming section. IIIIII.. EESSTTIIMMAATTIINNGG AA LLAABBOOUURR DDEEMMAANNDD FFUUNNCCTTIIOONN IINN EEGGYYPPTT::
The demand for labour is affected by several variables. One of the most important variables affecting the demand for labour according to economic theory is the price of labour, or the average wage of the labour force. According to theory, there is an inversely proportional relation between the two variables that is determined by two determinants: scale effects on the one side and substitution effects on the other side. Any increase in wages raises the costs of production, and if the producer has the ability to pass on this increase to consumers (depending of course on the elasticity of demand) the final price of the product will be higher, leading to a reduction in demand for the product. This, in turn, reduces the level of production, and thus the demand for labour decreases; that is the scale effect. On the other hand, when wages increase, entrepreneurs substitute labour with capital, and thus the demand for labour shrinks; that is the substitution effect. Another important determinant for the demand of labour is the domestic investment; however, the relation between domestic investments and the demand for labour is not always clearly going in one direction. In this case, there are also scale and substitution effects. When investment increases, it is usually a result of a decrease in the price of capital, i.e. interest rates. This causes a reduction in the production costs, leading to increased demand for that product and thus increased production levels and increased demand for labour. On the other hand, when the price of capital decreases, entrepreneurs are encouraged to substitute labour with capital, which reduces the demand for labour. The overall effect of the increase in investment depends on the relation between scale and substitution effects, which effect exceeds the other (IDSC website). Economic growth is one of the important determinants of the demand for labour; the increases in the growth rate lead to increases in the demand for labour. The exact impact of the increases in GDP growth on the increases in employment depends on several factors: the elasticity of labour; the structure of the economy; the degree of technology in the industrial sector; income distribution; the price of the other factors of production, and the consumption structure. However, there is wide-range agreement among economists that there exists a positive relation between GDP growth and demand for labour5. Another important determinant of the demand for labour is technology, whether it is labour-intensive or capital-intensive. In labour-intensive industries, the demand for labour increases with the increase in production, while in capital-intensive industries, the increases in production take place mainly through increasing capital6.
5 A study conducted for Egypt the elasticity of demand for labour in the whole economy is 0.61, and in the manufacturing sector 0.74 (IDSC website).
8
6 In a study conducted on the effect of technology on employment in Egypt during the period 1982-1992, it was found that this period witnessed increases in capital-intensive technology, which resulted in raising the cost of creating jobs (IDSC website).
FDI, with both its direct and indirect effects, is considered one of the main determinants of employment in the host country, as was mentioned earlier. The net effect of FDI on employment is one of the most important factors in assessing the overall effect of FDI on a host country. In 2005, around 11% of total employees in Egypt worked in TNCs or FDI related activities from the total employed labour force (CAPMAS 2005) The government was the main employer till the mid 1980s, and thus we include a binary variable that takes the value of one in the years when the government acted as the main employer in the economy, and zero in the rest of the years. The government’s hiring policies were not economic-oriented; rather they were based on socio-economic and security reasons that are exogenous to the model. Thus the binary variable is included as a shift variable. After reviewing the determinants of the demand for labour, we can estimate the demand function as follows: L = f (RW, GDI, GDP, T, FDI, GOV) (1) Where L is the labour force in Egypt, RW are the real wages in Egypt, GDI is the gross domestic investment, T is the technology, FDI is the foreign direct investment, and GOV is a dummy variable for the effect of the government employment. We can rewrite equation 1 into the following testable form: Log Lt = a0 + a1log RWt + a2log GDIt + a3log GDPt + a4log Tt + a5FDIt + a6GOVt (2) DATA DESCRIPTION The dataset we use for the empirical investigation are the sectoral national accounts of the Ministry of Planning of Egypt and GOFI. The empirical analysis is performed with a panel of annual data from 1974-2005 for 24 sectors of agriculture, manufacturing and services sectors and conforms to the 2-digit level ISTC classification, 2 sectors are agriculture, 9 sectors are manufacturing and 13 sectors are services. This sectoral approach for the determination of the sources of growth has several advantages. As compared with the estimation of cross-country growth regressions, as performed by many other authors, the cross-sectoral data set exhibits a much greater homogeneity. For instance, inconsistencies of data measurement and the omission of unobserved differences appears much less a problem in the cross-sectoral approach. On the other hand, if the cross-country analysis is confined to a more homogeneous group, for instance the MENA-countries, less observations and much less variance is left as for the disaggregated approach. This holds even more for a pure time-series analysis with aggregate data for Egypt.
9
We should note that there are variations in the economic performance and the distribution of FDI across the different sectors in Egypt. Manufacturing industries enjoy more growth and more FDI. With regards performance, we calculated the average growth in the value added per sector and the manufacturing sector (the average of its 9 sub-sectors) enjoyed an average growth of 10.2% over the period, followed by the service sector (with its 13 sub-sectors) with an average annual growth of the value added of 9.0%, and finally the agriculture sector (as an average of its two sub-sectors) witnessed an average annual growth of 8.2% over the studied period (MOP). As to the distribution of FDI, we find that the average annual growth of FDI inflows to the manufacturing sector over the period 1974-2005 was 2.6%, while FDI inflows to the services sector grew by an average annual rate of 2.5%, and the FDI inflows to the agriculture sector increased by an average annual of 2.4% over the period (MOP).
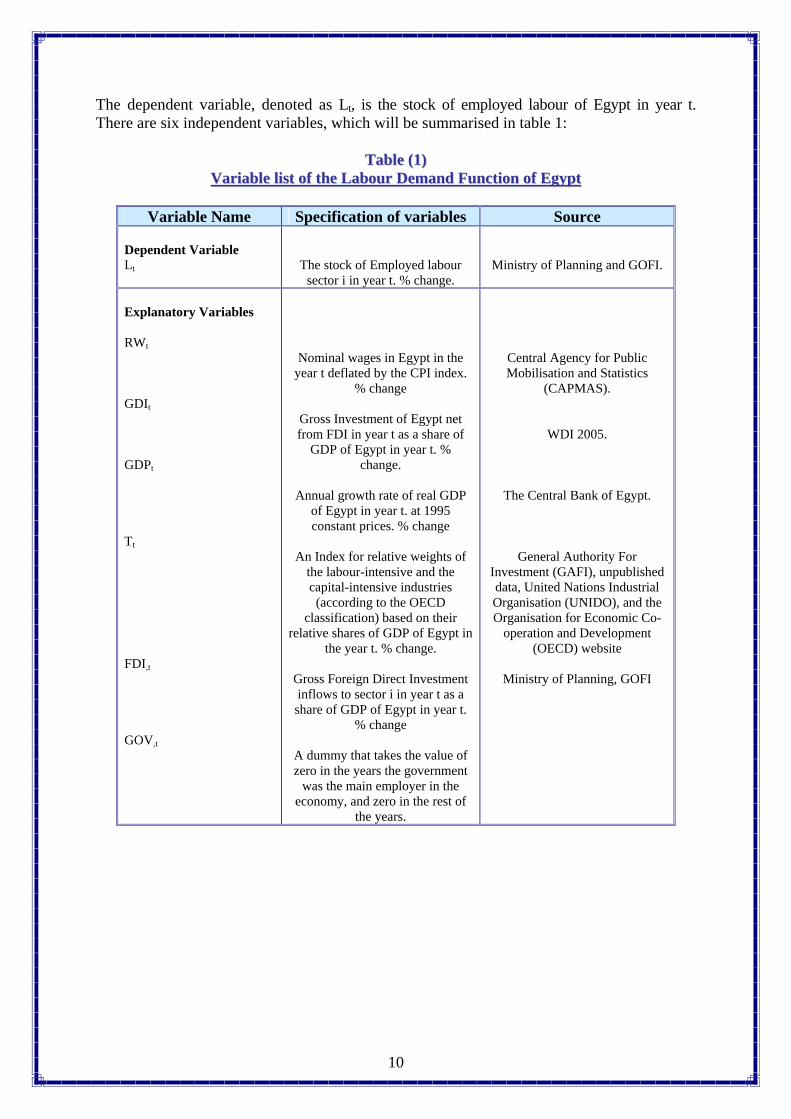
The dependent variable, denoted as Lt, is the stock of employed labour of Egypt in year t. There are six independent variables, which will be summarised in table 1:
TTaabbllee ((11)) Variable list of the Labour Demand Function of EgyptVariable list of the Labour Demand Function of Egypt
Variable Name Specification of variables Source
Dependent Variable Lt
The stock of Employed labour sector i in year t. % change.
Ministry of Planning and GOFI.
Explanatory Variables RWt GDIt GDPt Tt FDI,t GOV,t
Nominal wages in Egypt in the year t deflated by the CPI index.
% change
Gross Investment of Egypt net from FDI in year t as a share of
GDP of Egypt in year t. % change.
Annual growth rate of real GDP
of Egypt in year t. at 1995 constant prices. % change
An Index for relative weights of
the labour-intensive and the capital-intensive industries
(according to the OECD classification) based on their
relative shares of GDP of Egypt in the year t. % change.
Gross Foreign Direct Investment inflows to sector i in year t as a share of GDP of Egypt in year t.
% change
A dummy that takes the value of zero in the years the government
was the main employer in the economy, and zero in the rest of
the years.
Central Agency for Public Mobilisation and Statistics
(CAPMAS).
WDI 2005.
The Central Bank of Egypt.
General Authority For Investment (GAFI), unpublished data, United Nations Industrial Organisation (UNIDO), and the Organisation for Economic Co-
operation and Development (OECD) website
Ministry of Planning, GOFI
10
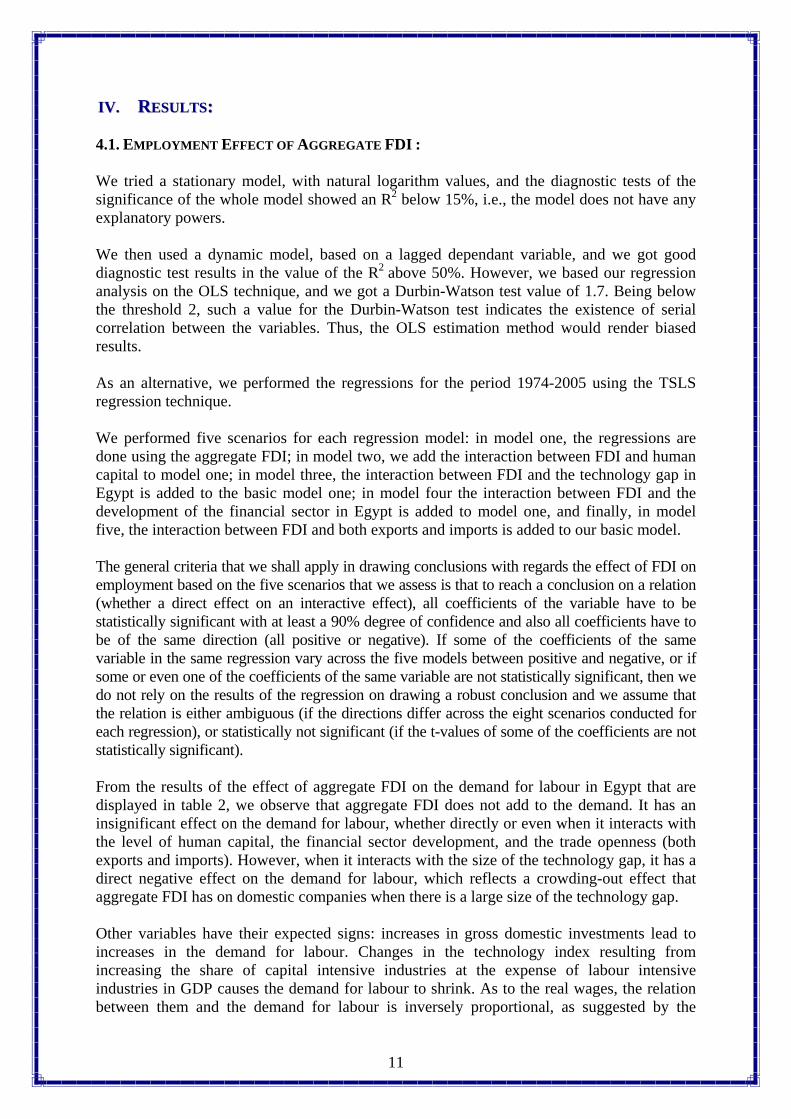
IIVV.. RREESSUULLTTSS:: 4.1. EMPLOYMENT EFFECT OF AGGREGATE FDI : We tried a stationary model, with natural logarithm values, and the diagnostic tests of the significance of the whole model showed an R2 below 15%, i.e., the model does not have any explanatory powers. We then used a dynamic model, based on a lagged dependant variable, and we got good diagnostic test results in the value of the R2 above 50%. However, we based our regression analysis on the OLS technique, and we got a Durbin-Watson test value of 1.7. Being below the threshold 2, such a value for the Durbin-Watson test indicates the existence of serial correlation between the variables. Thus, the OLS estimation method would render biased results. As an alternative, we performed the regressions for the period 1974-2005 using the TSLS regression technique. We performed five scenarios for each regression model: in model one, the regressions are done using the aggregate FDI; in model two, we add the interaction between FDI and human capital to model one; in model three, the interaction between FDI and the technology gap in Egypt is added to the basic model one; in model four the interaction between FDI and the development of the financial sector in Egypt is added to model one, and finally, in model five, the interaction between FDI and both exports and imports is added to our basic model. The general criteria that we shall apply in drawing conclusions with regards the effect of FDI on employment based on the five scenarios that we assess is that to reach a conclusion on a relation (whether a direct effect on an interactive effect), all coefficients of the variable have to be statistically significant with at least a 90% degree of confidence and also all coefficients have to be of the same direction (all positive or negative). If some of the coefficients of the same variable in the same regression vary across the five models between positive and negative, or if some or even one of the coefficients of the same variable are not statistically significant, then we do not rely on the results of the regression on drawing a robust conclusion and we assume that the relation is either ambiguous (if the directions differ across the eight scenarios conducted for each regression), or statistically not significant (if the t-values of some of the coefficients are not statistically significant). From the results of the effect of aggregate FDI on the demand for labour in Egypt that are displayed in table 2, we observe that aggregate FDI does not add to the demand. It has an insignificant effect on the demand for labour, whether directly or even when it interacts with the level of human capital, the financial sector development, and the trade openness (both exports and imports). However, when it interacts with the size of the technology gap, it has a direct negative effect on the demand for labour, which reflects a crowding-out effect that aggregate FDI has on domestic companies when there is a large size of the technology gap.
11
Other variables have their expected signs: increases in gross domestic investments lead to increases in the demand for labour. Changes in the technology index resulting from increasing the share of capital intensive industries at the expense of labour intensive industries in GDP causes the demand for labour to shrink. As to the real wages, the relation between them and the demand for labour is inversely proportional, as suggested by the
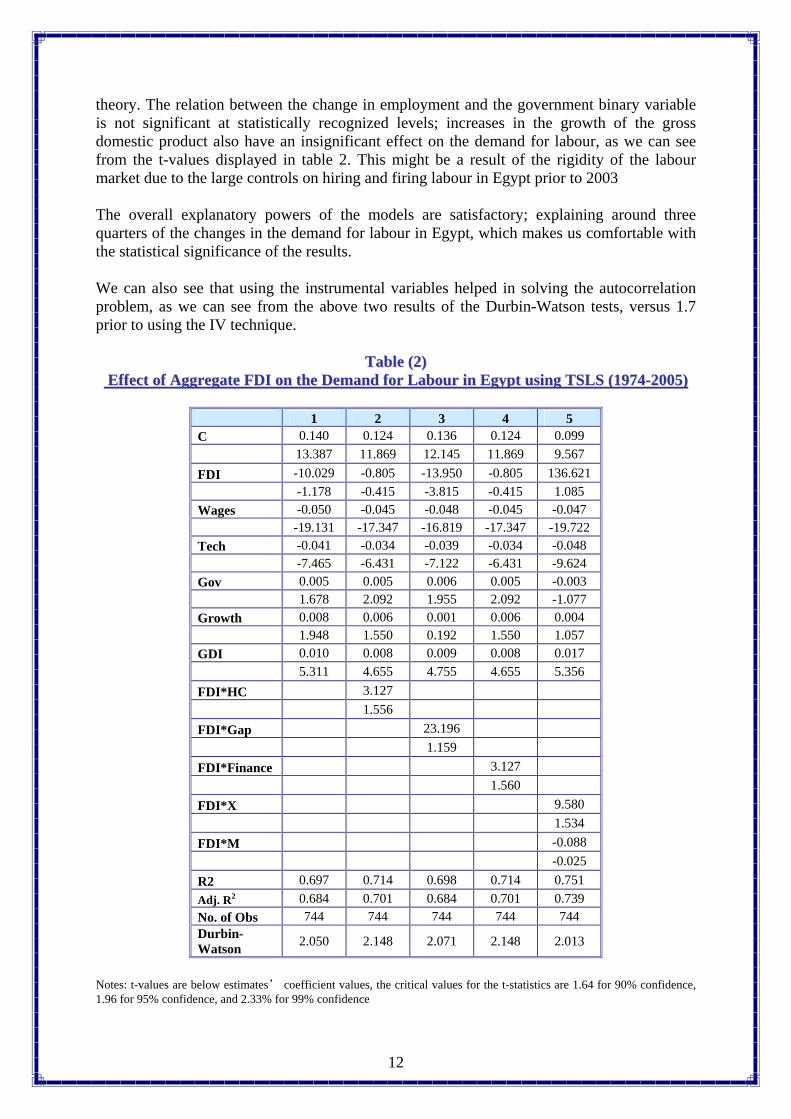
theory. The relation between the change in employment and the government binary variable is not significant at statistically recognized levels; increases in the growth of the gross domestic product also have an insignificant effect on the demand for labour, as we can see from the t-values displayed in table 2. This might be a result of the rigidity of the labour market due to the large controls on hiring and firing labour in Egypt prior to 2003 The overall explanatory powers of the models are satisfactory; explaining around three quarters of the changes in the demand for labour in Egypt, which makes us comfortable with the statistical significance of the results. We can also see that using the instrumental variables helped in solving the autocorrelation problem, as we can see from the above two results of the Durbin-Watson tests, versus 1.7 prior to using the IV technique.
TTaabbllee ((22)) Effect of Aggregate FDI on the Demand for Labour in Egypt using TSLS (1974-2005)Effect of Aggregate FDI on the Demand for Labour in Egypt using TSLS (1974-2005)
1 2 3 4 5 C 0.140 0.124 0.136 0.124 0.099 13.387 11.869 12.145 11.869 9.567 FDI -10.029 -0.805 -13.950 -0.805 136.621 -1.178 -0.415 -3.815 -0.415 1.085 Wages -0.050 -0.045 -0.048 -0.045 -0.047 -19.131 -17.347 -16.819 -17.347 -19.722 Tech -0.041 -0.034 -0.039 -0.034 -0.048 -7.465 -6.431 -7.122 -6.431 -9.624 Gov 0.005 0.005 0.006 0.005 -0.003 1.678 2.092 1.955 2.092 -1.077 Growth 0.008 0.006 0.001 0.006 0.004 1.948 1.550 0.192 1.550 1.057 GDI 0.010 0.008 0.009 0.008 0.017 5.311 4.655 4.755 4.655 5.356 FDI*HC 3.127 1.556 FDI*Gap 23.196 1.159 FDI*Finance 3.127 1.560 FDI*X 9.580 1.534 FDI*M -0.088 -0.025 R2 0.697 0.714 0.698 0.714 0.751 Adj. R2 0.684 0.701 0.684 0.701 0.739 No. of Obs 744 744 744 744 744 Durbin-Watson 2.050 2.148 2.071 2.148 2.013
12
Notes: t-values are below estimates’ coefficient values, the critical values for the t-statistics are 1.64 for 90% confidence, 1.96 for 95% confidence, and 2.33% for 99% confidence
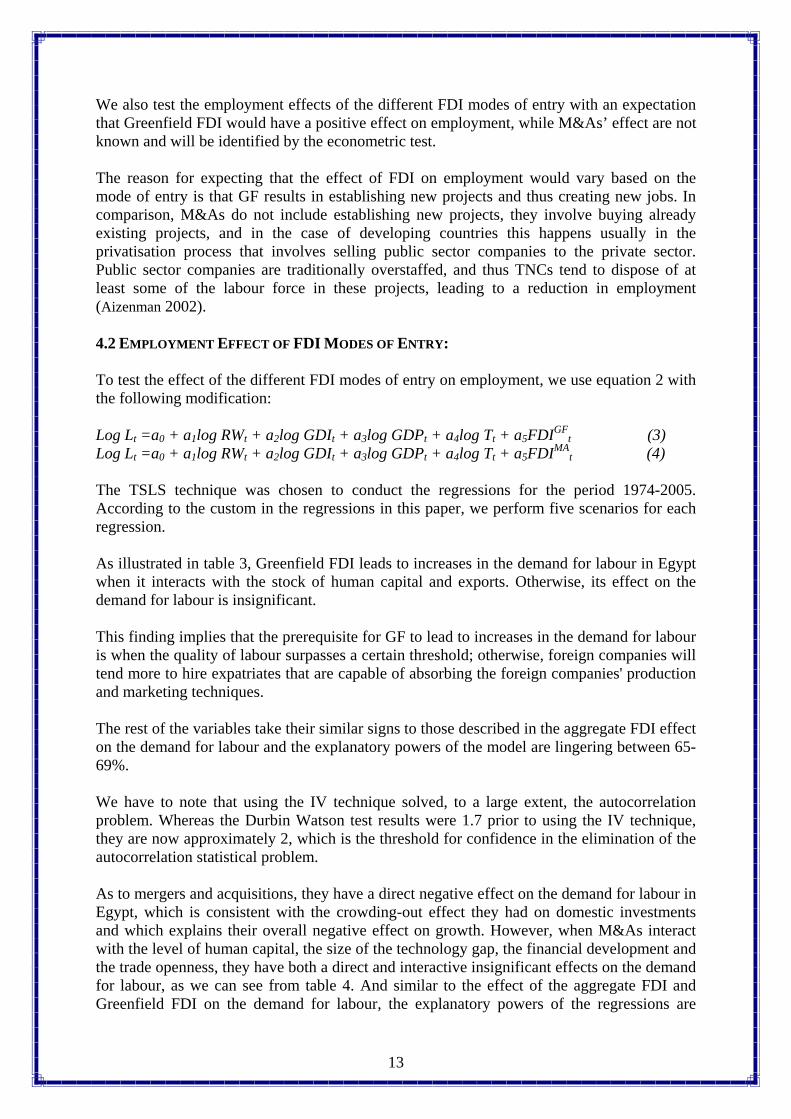
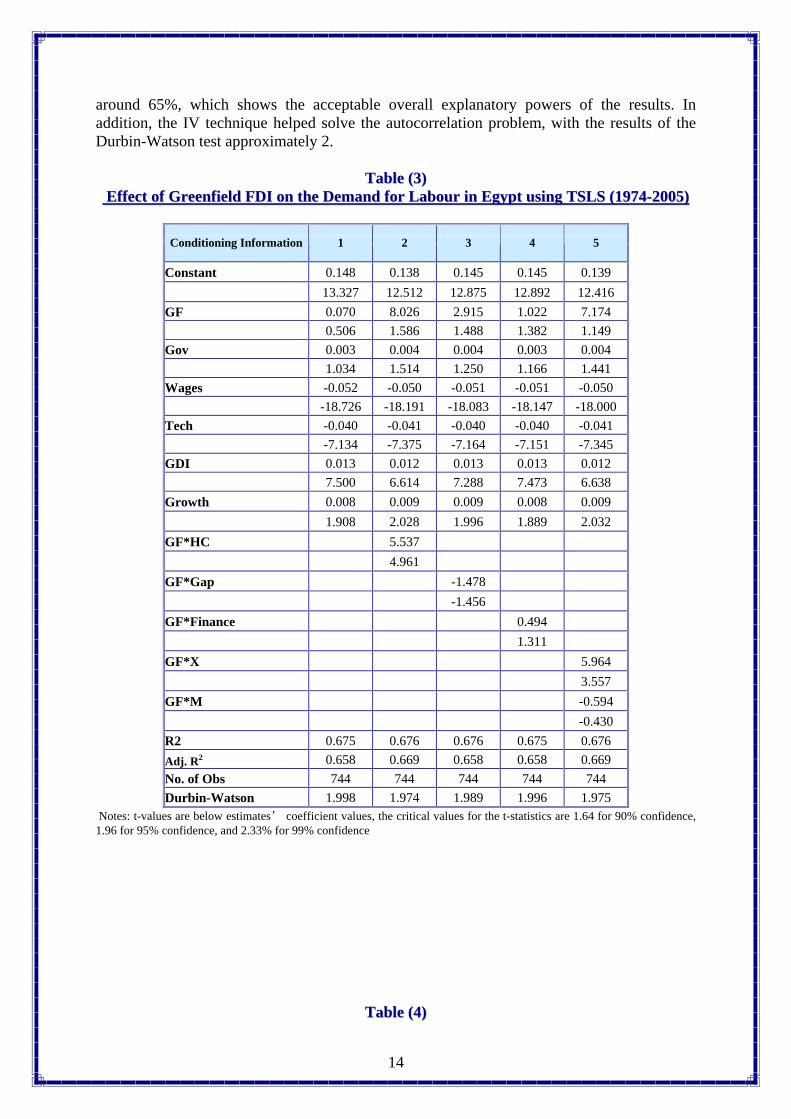
We also test the employment effects of the different FDI modes of entry with an expectation that Greenfield FDI would have a positive effect on employment, while M&As’ effect are not known and will be identified by the econometric test. The reason for expecting that the effect of FDI on employment would vary based on the mode of entry is that GF results in establishing new projects and thus creating new jobs. In comparison, M&As do not include establishing new projects, they involve buying already existing projects, and in the case of developing countries this happens usually in the privatisation process that involves selling public sector companies to the private sector. Public sector companies are traditionally overstaffed, and thus TNCs tend to dispose of at least some of the labour force in these projects, leading to a reduction in employment (Aizenman 2002). 4.2 EMPLOYMENT EFFECT OF FDI MODES OF ENTRY: To test the effect of the different FDI modes of entry on employment, we use equation 2 with the following modification: Log Lt =a0 + a1log RWt + a2log GDIt + a3log GDPt + a4log Tt + a5FDIGF
t (3) Log Lt =a0 + a1log RWt + a2log GDIt + a3log GDPt + a4log Tt + a5FDIMA
t (4) The TSLS technique was chosen to conduct the regressions for the period 1974-2005. According to the custom in the regressions in this paper, we perform five scenarios for each regression. As illustrated in table 3, Greenfield FDI leads to increases in the demand for labour in Egypt when it interacts with the stock of human capital and exports. Otherwise, its effect on the demand for labour is insignificant. This finding implies that the prerequisite for GF to lead to increases in the demand for labour is when the quality of labour surpasses a certain threshold; otherwise, foreign companies will tend more to hire expatriates that are capable of absorbing the foreign companies' production and marketing techniques. The rest of the variables take their similar signs to those described in the aggregate FDI effect on the demand for labour and the explanatory powers of the model are lingering between 65-69%. We have to note that using the IV technique solved, to a large extent, the autocorrelation problem. Whereas the Durbin Watson test results were 1.7 prior to using the IV technique, they are now approximately 2, which is the threshold for confidence in the elimination of the autocorrelation statistical problem.
13
As to mergers and acquisitions, they have a direct negative effect on the demand for labour in Egypt, which is consistent with the crowding-out effect they had on domestic investments and which explains their overall negative effect on growth. However, when M&As interact with the level of human capital, the size of the technology gap, the financial development and the trade openness, they have both a direct and interactive insignificant effects on the demand for labour, as we can see from table 4. And similar to the effect of the aggregate FDI and Greenfield FDI on the demand for labour, the explanatory powers of the regressions are
around 65%, which shows the acceptable overall explanatory powers of the results. In addition, the IV technique helped solve the autocorrelation problem, with the results of the Durbin-Watson test approximately 2.
TTaabbllee ((33)) Effect of Greenfield FDI on the Demand for Labour in Egypt using TSLS (1974-2005)Effect of Greenfield FDI on the Demand for Labour in Egypt using TSLS (1974-2005)
Conditioning Information 1 2 3 4 5
Constant 0.148 0.138 0.145 0.145 0.139 13.327 12.512 12.875 12.892 12.416 GF 0.070 8.026 2.915 1.022 7.174 0.506 1.586 1.488 1.382 1.149 Gov 0.003 0.004 0.004 0.003 0.004 1.034 1.514 1.250 1.166 1.441 Wages -0.052 -0.050 -0.051 -0.051 -0.050 -18.726 -18.191 -18.083 -18.147 -18.000 Tech -0.040 -0.041 -0.040 -0.040 -0.041 -7.134 -7.375 -7.164 -7.151 -7.345 GDI 0.013 0.012 0.013 0.013 0.012 7.500 6.614 7.288 7.473 6.638 Growth 0.008 0.009 0.009 0.008 0.009 1.908 2.028 1.996 1.889 2.032 GF*HC 5.537 4.961 GF*Gap -1.478 -1.456 GF*Finance 0.494 1.311 GF*X 5.964 3.557 GF*M -0.594 -0.430 R2 0.675 0.676 0.676 0.675 0.676 Adj. R2 0.658 0.669 0.658 0.658 0.669 No. of Obs 744 744 744 744 744 Durbin-Watson 1.998 1.974 1.989 1.996 1.975
Notes: t-values are below estimates’ coefficient values, the critical values for the t-statistics are 1.64 for 90% confidence, 1.96 for 95% confidence, and 2.33% for 99% confidence
TTaabbllee ((44)
14
)
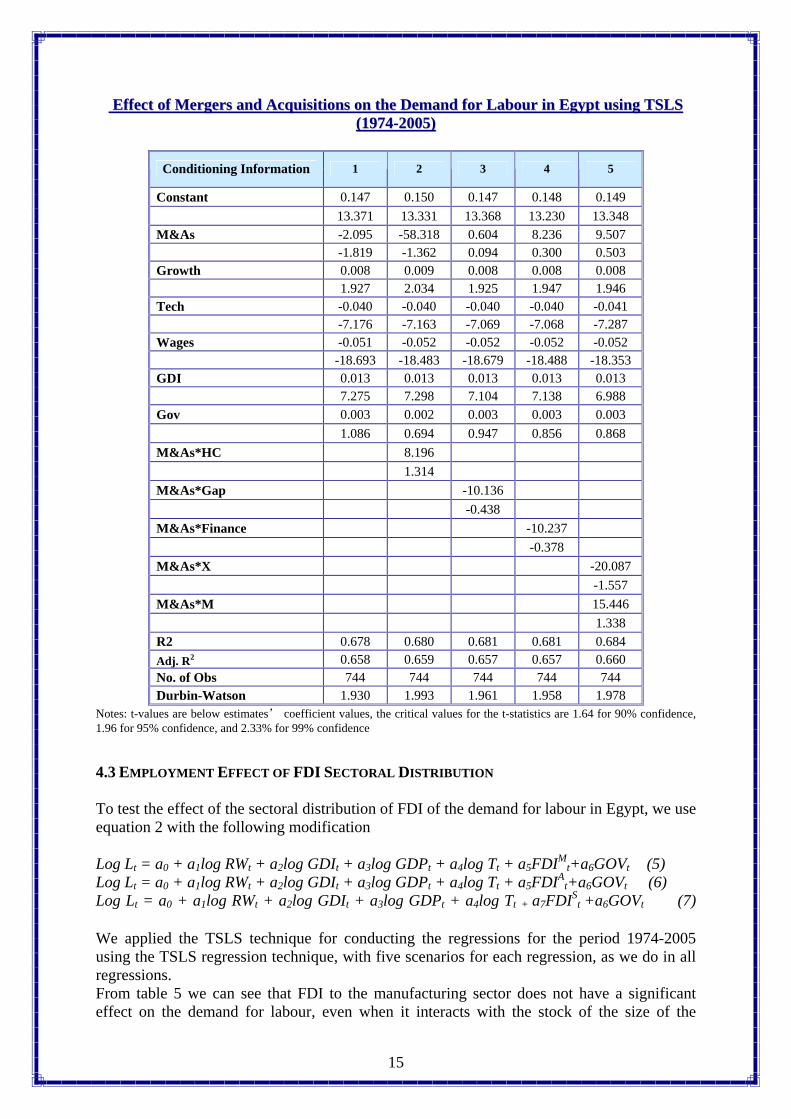
Effect of Mergers and Acquisitions on the Demand for Labour in Egypt using TSLSEffect of Mergers and Acquisitions on the Demand for Labour in Egypt using TSLS (1974-2005)(1974-2005)
Conditioning Information 1 2 3 4 5
Constant 0.147 0.150 0.147 0.148 0.149 13.371 13.331 13.368 13.230 13.348 M&As -2.095 -58.318 0.604 8.236 9.507 -1.819 -1.362 0.094 0.300 0.503 Growth 0.008 0.009 0.008 0.008 0.008 1.927 2.034 1.925 1.947 1.946 Tech -0.040 -0.040 -0.040 -0.040 -0.041 -7.176 -7.163 -7.069 -7.068 -7.287 Wages -0.051 -0.052 -0.052 -0.052 -0.052 -18.693 -18.483 -18.679 -18.488 -18.353 GDI 0.013 0.013 0.013 0.013 0.013 7.275 7.298 7.104 7.138 6.988 Gov 0.003 0.002 0.003 0.003 0.003 1.086 0.694 0.947 0.856 0.868 M&As*HC 8.196 1.314 M&As*Gap -10.136 -0.438 M&As*Finance -10.237 -0.378 M&As*X -20.087 -1.557 M&As*M 15.446 1.338 R2 0.678 0.680 0.681 0.681 0.684 Adj. R2 0.658 0.659 0.657 0.657 0.660 No. of Obs 744 744 744 744 744 Durbin-Watson 1.930 1.993 1.961 1.958 1.978
Notes: t-values are below estimates’ coefficient values, the critical values for the t-statistics are 1.64 for 90% confidence, 1.96 for 95% confidence, and 2.33% for 99% confidence 4.3 EMPLOYMENT EFFECT OF FDI SECTORAL DISTRIBUTION To test the effect of the sectoral distribution of FDI of the demand for labour in Egypt, we use equation 2 with the following modification Log Lt = a0 + a1log RWt + a2log GDIt + a3log GDPt + a4log Tt + a5FDIM
t+a6GOVt (5) Log Lt = a0 + a1log RWt + a2log GDIt + a3log GDPt + a4log Tt + a5FDIA
t+a6GOVt (6) Log Lt = a0 + a1log RWt + a2log GDIt + a3log GDPt + a4log Tt + a7FDIS
t +a6GOVt (7) We applied the TSLS technique for conducting the regressions for the period 1974-2005 using the TSLS regression technique, with five scenarios for each regression, as we do in all regressions.
15
From table 5 we can see that FDI to the manufacturing sector does not have a significant effect on the demand for labour, even when it interacts with the stock of the size of the
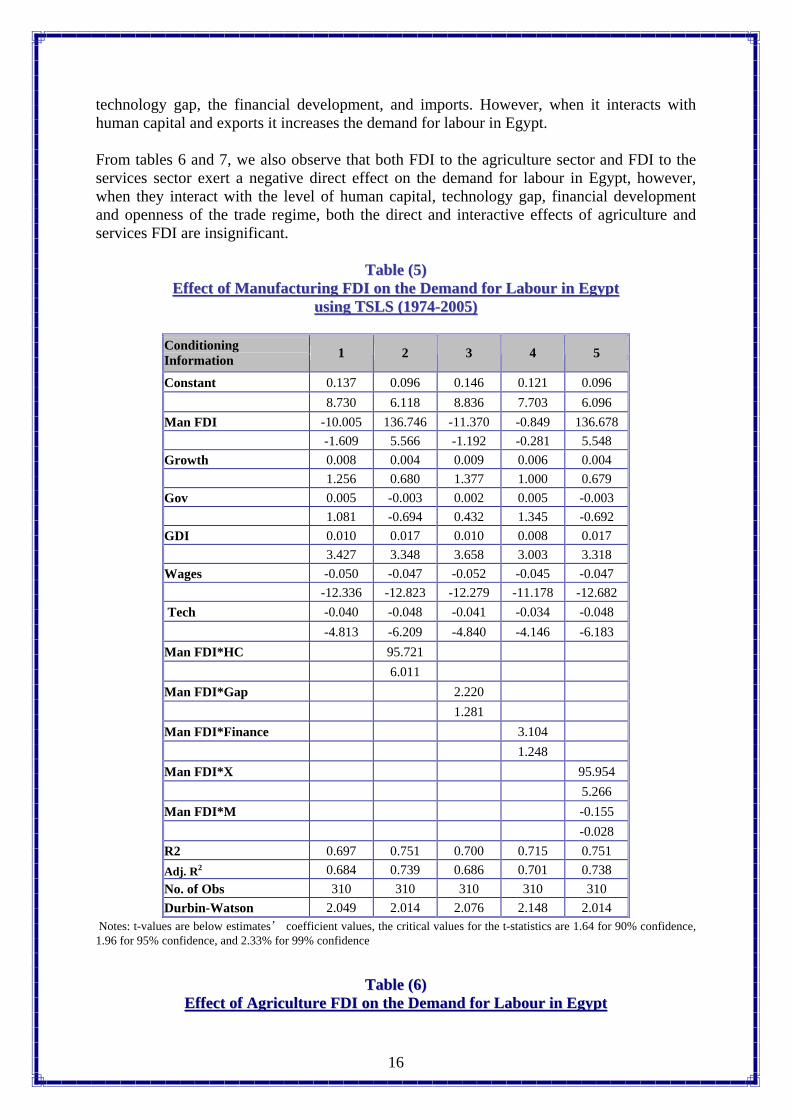
technology gap, the financial development, and imports. However, when it interacts with human capital and exports it increases the demand for labour in Egypt. From tables 6 and 7, we also observe that both FDI to the agriculture sector and FDI to the services sector exert a negative direct effect on the demand for labour in Egypt, however, when they interact with the level of human capital, technology gap, financial development and openness of the trade regime, both the direct and interactive effects of agriculture and services FDI are insignificant.
TTaabbllee ((55)) Effect of Manufacturing FDI on the Demand for Labour in Egypt Effect of Manufacturing FDI on the Demand for Labour in Egypt
using TSLS (1974-2005)using TSLS (1974-2005)
Conditioning Information 1 2 3 4 5
Constant 0.137 0.096 0.146 0.121 0.096 8.730 6.118 8.836 7.703 6.096 Man FDI -10.005 136.746 -11.370 -0.849 136.678 -1.609 5.566 -1.192 -0.281 5.548 Growth 0.008 0.004 0.009 0.006 0.004 1.256 0.680 1.377 1.000 0.679 Gov 0.005 -0.003 0.002 0.005 -0.003 1.081 -0.694 0.432 1.345 -0.692 GDI 0.010 0.017 0.010 0.008 0.017 3.427 3.348 3.658 3.003 3.318 Wages -0.050 -0.047 -0.052 -0.045 -0.047 -12.336 -12.823 -12.279 -11.178 -12.682 Tech -0.040 -0.048 -0.041 -0.034 -0.048 -4.813 -6.209 -4.840 -4.146 -6.183 Man FDI*HC 95.721 6.011 Man FDI*Gap 2.220 1.281 Man FDI*Finance 3.104 1.248 Man FDI*X 95.954 5.266 Man FDI*M -0.155 -0.028 R2 0.697 0.751 0.700 0.715 0.751 Adj. R2 0.684 0.739 0.686 0.701 0.738 No. of Obs 310 310 310 310 310 Durbin-Watson 2.049 2.014 2.076 2.148 2.014
Notes: t-values are below estimates’ coefficient values, the critical values for the t-statistics are 1.64 for 90% confidence, 1.96 for 95% confidence, and 2.33% for 99% confidence
TTaabbllee ((66)) Effect of Agriculture FDI on the Demand for Labour in EgyptEffect of Agriculture FDI on the Demand for Labour in Egyp
16
t
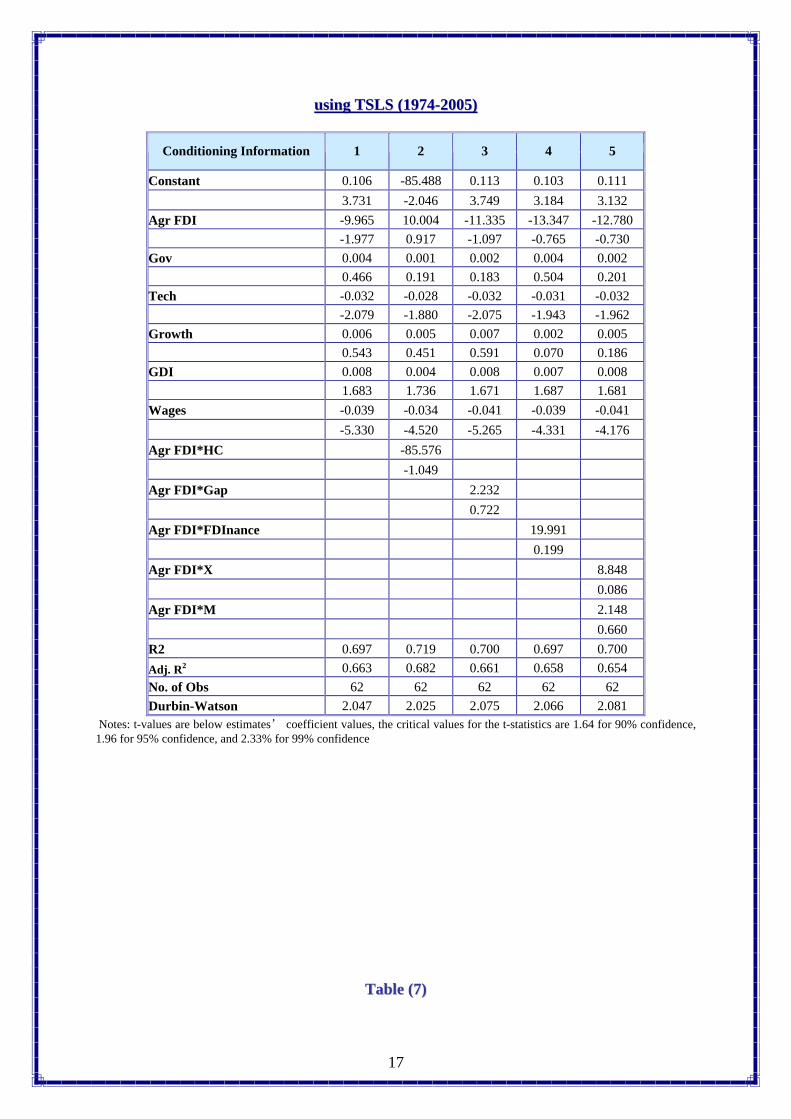
using TSLS (1974-2005)using TSLS (1974-2005)
Conditioning Information 1 2 3 4 5
Constant 0.106 -85.488 0.113 0.103 0.111 3.731 -2.046 3.749 3.184 3.132 Agr FDI -9.965 10.004 -11.335 -13.347 -12.780 -1.977 0.917 -1.097 -0.765 -0.730 Gov 0.004 0.001 0.002 0.004 0.002 0.466 0.191 0.183 0.504 0.201 Tech -0.032 -0.028 -0.032 -0.031 -0.032 -2.079 -1.880 -2.075 -1.943 -1.962 Growth 0.006 0.005 0.007 0.002 0.005 0.543 0.451 0.591 0.070 0.186 GDI 0.008 0.004 0.008 0.007 0.008 1.683 1.736 1.671 1.687 1.681 Wages -0.039 -0.034 -0.041 -0.039 -0.041 -5.330 -4.520 -5.265 -4.331 -4.176 Agr FDI*HC -85.576 -1.049 Agr FDI*Gap 2.232 0.722 Agr FDI*FDInance 19.991 0.199 Agr FDI*X 8.848 0.086 Agr FDI*M 2.148 0.660 R2 0.697 0.719 0.700 0.697 0.700 Adj. R2 0.663 0.682 0.661 0.658 0.654 No. of Obs 62 62 62 62 62 Durbin-Watson 2.047 2.025 2.075 2.066 2.081
Notes: t-values are below estimates’ coefficient values, the critical values for the t-statistics are 1.64 for 90% confidence, 1.96 for 95% confidence, and 2.33% for 99% confidence
TTaabbllee ((77)
17
)
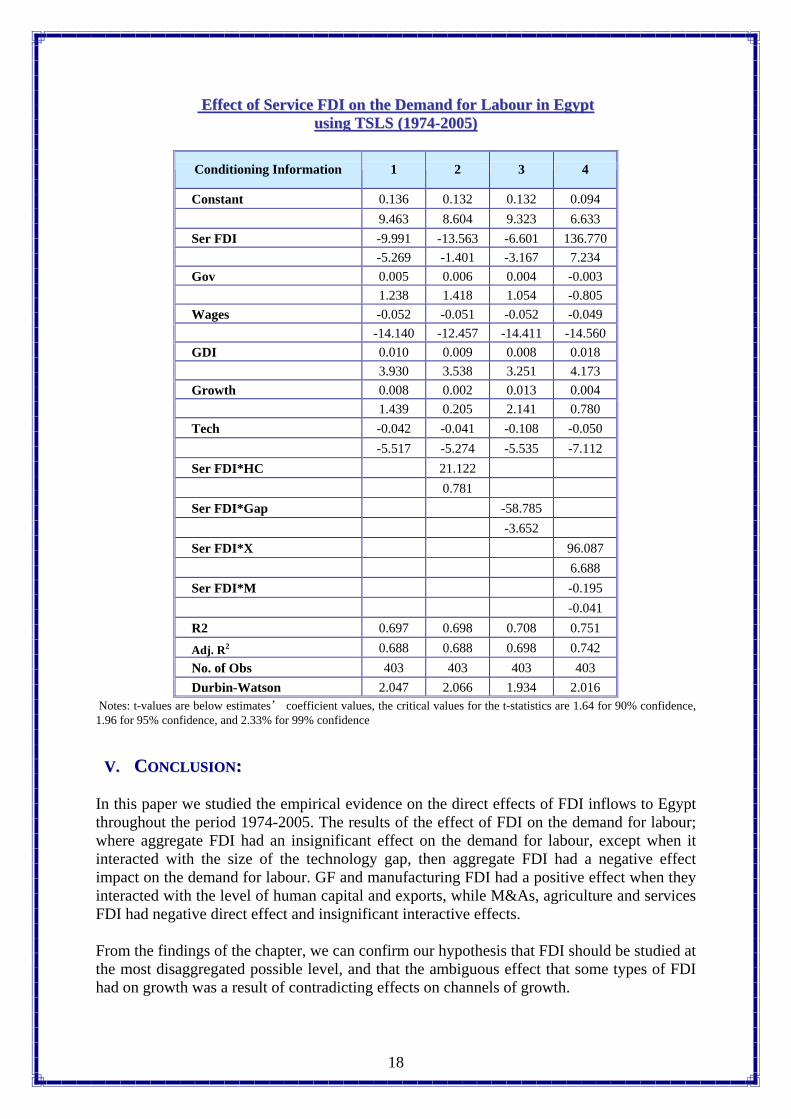
Effect of Service FDI on the Demand for Labour in EgyptEffect of Service FDI on the Demand for Labour in Egypt using TSLS (1974-2005)using TSLS (1974-2005)
Conditioning Information 1 2 3 4
Constant 0.136 0.132 0.132 0.094 9.463 8.604 9.323 6.633 Ser FDI -9.991 -13.563 -6.601 136.770 -5.269 -1.401 -3.167 7.234 Gov 0.005 0.006 0.004 -0.003 1.238 1.418 1.054 -0.805 Wages -0.052 -0.051 -0.052 -0.049 -14.140 -12.457 -14.411 -14.560 GDI 0.010 0.009 0.008 0.018 3.930 3.538 3.251 4.173 Growth 0.008 0.002 0.013 0.004 1.439 0.205 2.141 0.780 Tech -0.042 -0.041 -0.108 -0.050 -5.517 -5.274 -5.535 -7.112 Ser FDI*HC 21.122 0.781 Ser FDI*Gap -58.785 -3.652 Ser FDI*X 96.087 6.688 Ser FDI*M -0.195 -0.041 R2 0.697 0.698 0.708 0.751 Adj. R2 0.688 0.688 0.698 0.742 No. of Obs 403 403 403 403 Durbin-Watson 2.047 2.066 1.934 2.016
Notes: t-values are below estimates’ coefficient values, the critical values for the t-statistics are 1.64 for 90% confidence, 1.96 for 95% confidence, and 2.33% for 99% confidence
VV.. CCOONNCCLLUUSSIIOONN:: In this paper we studied the empirical evidence on the direct effects of FDI inflows to Egypt throughout the period 1974-2005. The results of the effect of FDI on the demand for labour; where aggregate FDI had an insignificant effect on the demand for labour, except when it interacted with the size of the technology gap, then aggregate FDI had a negative effect impact on the demand for labour. GF and manufacturing FDI had a positive effect when they interacted with the level of human capital and exports, while M&As, agriculture and services FDI had negative direct effect and insignificant interactive effects.
18
From the findings of the chapter, we can confirm our hypothesis that FDI should be studied at the most disaggregated possible level, and that the ambiguous effect that some types of FDI had on growth was a result of contradicting effects on channels of growth.
From the study we can draw two policy implications. The first is based on the finding that GF interacts with the stock of human capital and the exports share of GDP to increase employment in Egypt, which shows that the focus of any FDI promotion policy should be on enhancing growth rates, raising the quality of the human factor and increasing the competitiveness of the economy. The other policy implication that we can draw based on the findings of this paper is that Egypt should revise its privatization policy, as it was discovered from the analysis that M&As exert a negative effect on employment creation. Thus, the focus has to be on attracting GF FDI, and manufacturing FDI.
19
Thus the challenge for policy-makers in Egypt, as Nunnekamp (2002) puts it, should not be how to attract FDI in general, but rather how to attract FDI that benefits the national economy. Further research should be undertaken to identify the determinants of Greenfield FDI and the determinants of FDI to the manufacturing and services sectors to design policies geared towards promoting the kind of FDI that Egypt really needs.
REFERENCES:REFERENCES:
1. Abdel Latif, L. 1999. Global Trade Patterns, Foreign Direct Investment and Egypt's Export Strategy. USAID, Cairo, Egypt.
2. Abdel Salam, R. 2002. Human Capital as a Determinant of Foreign Direct Investment: Egypt's Case, http://www.economicswebinstitute.org
3. Aizenman, J. 2002. Volatility, Employment and the Patterns of FDI in Emerging Markets. Working Paper 9397, National Bureau for Economic Research.
4. Alfaro, L., A. Chanda, S. Kalemli-Ozcan and S. Sayek. 2002. FDI and Economic Growth: The Role of Local Financial Markets. Working Paper No. 01-083, Harvard Business School, http://ssrn.com/abstract=305762.
5. Altzinger, W. and C. Bellak. 1999. Direct Versus Indirect FDI: Impact on Domestic Exports and Employment. Working Paper No. 9, Vienna University of Economics and Business Administration, http://www.wu-wien.ac.at/inst/vw1/gee/workp.html
6. Asiedu, E. 2003. The Determinants of Employment of Affiliates of U.S. Multinational Enterprises in Africa. http://people.ku.edu/~asiedu/Multinational%20Employment.pdf
7. Barro, R. and J. Lee. 2000. International Data on Educational Attainment: Updates and Implications. Working Paper No. 42, Center for International Development at Harvard University, Cambridge, Mass, http://www2.cid.harvard.edu/cidwp/042.pdf.
8. Bhaumik, S.K.; S. Estrin and K. Meyer. 2004. Determinants of Employment Growth at MNEs: Evidence from Egypt, India, South Africa and Vietnam. Discussion Paper No. 1272, Institute for the Study of Labor, Germany.
9. Central Agency for Public Mobilisation and Statistics (CAPMAS), "Financial Statistics and Indicators of Organized Private Sector", Several issues.
10. Central Agency for Public Mobilisation and Statistics (CAPMAS), “Industrial Output Statistics”, Several Issues.
11. Ehwany, N.E. and H.L. Laithy. 2001. Poverty, Employment, and Policy-Making in Egypt. International Labor Office, Towards Decent Work in North Africa, No. 1.
12. Fawzy, Samiha. 2002. Investment Policies and Unemployment in Egypt. Working Paper No. 68, The Egyptian Center for Economic Studies.
13. General Authority for Investments (GAFI). 2004. Unpublished data.
14. General Organisation for Investments (GOFI), several reports
15. Haskel, J.; S. Pereira and M. Slaughter. 2002. Does Inward Foreign Direct Investment Boost The Productivity of Domestic Firms?. Working Paper No. 8724, National Bureau for Economic Research.
16. Hermes, Niels and Robert Lensink, 2003, Foreign Direct Investment, Financial Development and Economic Growth, Journal of Development Studies, 40(1), pp. 142-63
17. Information and Decision Support Center. 2003. Discrepancies in FDI Statistics in Egypt: Possible Solutions. http://www.idsc.org.eg.
18. Information and Decision Support Center. 2004a. A Model for Estimating the FDI Determinants in Egypt. http://www.idsc.org.eg.
19. Information and Decision Support Center. 2004b. Suggested Policies to attract FDI to Egypt. http://www.idsc.org.eg.
20
20. Information and Decision Support Center Statistics on Egypt, http://www.idsc.org.eg.
21. Institute of National Planning, Egypt. Egypt’s Human Development Report. Several Issues.
22. Iyanda, O. 1999. The impact of multinational enterprises on employment, training and regional development in Namibia and Zimbabwe: A preliminary assessment. Working Paper No. 84, Multinational Enterprises Programme, International Labour Office.
23. Kheir-El-Din, H. and T. Moursi. 1999. Sources of Economic Growth and Technical Progress in Egypt: An Aggregate Perspective. http://www.gdnet.org/pdf2/gdn_library/global_research_projects/explaining_growth/Egypt_growth_final.pdf
24. Krogstrup, S. and L. Matar. 2005. Foreign Direct Investment, Absorptive Capacity and Growth in the Arab World. Working Paper No: 02, Graduate Institute for International Studies, Geneva.
25. Lall, S. 2002. The Employment Impact of Globalisation in Developing Countries. International Policy Group, unit of the International Labour Office in the context of a United Kingdom DFID funded project on “Understanding Globalization, Employment and Poverty Reduction, Queen Elizabeth House, University of Oxford.
26. Li, Xiaoying, Liu, Xiaming, 2005. Foreign Direct Investment and Economic Growth: An Increasingly Endogenous Relationship. World Development 33, 393-407.
27. Massoud, Nada. 2006. Assessment of FDI Incentives in Egypt. Working Paper No. 0336, Economic Research Forum, http://www.erf.org.eg/uploadpath/pdf/0336_final.pdf
28. Myers, R. 2002. Policies for Increasing Productive Employment in Egypt. http://users.erols.com/rmyers1/PrdEmplPol.PDF
29. Nunnenkamp, P. 2002. To What Extent Can Foreign Direct Investment Help Achieve International Development Goals?. Working Paper No. 1128, Kiel Institute for World Economics.
30. Sadik, A.T. and A.A. Bolbol. 2000. Mobilizing Capital for Arab Economic Development, with Special Reference to the Role of FDI. Non-symbol paper 2000/4, Economic and Social Commission for Western Asia.
31. The Ministry of Planning, unpublished data
32. The Organisation for Economic Co-operation and Development (OECD) website
33. Thuy, L.T. 2005. Technological Spillovers from FDI: The Case of Vietnam. Technological Spillovers from FDI: The Case of Vietnam
21
34. United Nations Industrial Organisation (UNIDO) website