Embed Size (px)
Citation preview

THE ECONOMIC RECORD. VOL. 71. NO. 213. JUNE 1995. 132-144
Economic Growth and Convergence Across the Seven Colonies of Australasia: 186 1-1 99 1 *
PAUL CASHIN Depamnent of Economics,
Yale University, New Haven, USA
Have the poor economies of Australasia grown faster thm the rich ones? This question is analyzed for the seven colonies of Aus- tralasia for the period 1861-1991, and it is found t h the levels of per-cupita income across the colonies are converging to one another: the initially poor colonies have indeed grown faster. The cross-sectional dispersion of per-capita incomes also declined between 1861-1991, but most of this decline occurred in the pre- Federation 1861-1901 period, as the extent of dispersion in 1991 is very close to that attained in 1901.
I Introduction This paper undertakes an examination of the
trend of regional growth patterns across the seven colonies1 of Australasia (Australia* and New
’ I thank Xavier Sda-i-Matin.T.N. S r i n i m . Gustav Ranis. Etsuro Shioji. David Pwuou~. participants in the Yale Growth Workshop and two anonymous referees of this journal for their comments and suggestions. The financial support of a Doctoral Dissertation Fellowship of the A l h d P. Sloan Foundation. the Australian Pig Research and Development Cwpontion. and thc Victe rim Department of Agricultun is gntefully a c h w l - edged. The views expressed in this papcr are my own. and arc not necessarily shared by the government of Victoria
‘In this paper the terms ‘colony’ and ‘state’ will be used interchangeably to describe the seven regional economies of Australia and New Zealand. although the latter is not a state of Ausaalia. The Seven Australasian colonies and their dates of establishment arc: New South Wales (NSW, 1788). Tasmania GAS. 1804). Western Ausaalia (WA. 1829). South Australia (SA. 1836). New Zeahnd (NZ 1841), Victoria (VIC, 1851). and Queensland (QLD. 1859).
21n this paper I use the term ‘Australia’ in its modern sense. although the act of confedention did no( occur until 1901. Especially in the 1% century. and i m - ingly so in recent times. contemporary commentators use thcterm ‘Australasia’ to embrace the independently governed colonies on the continent of Australia and the adjacent islands of TAS and NZ.
Zealand) during the period 1861-1991. The eco- nomic growth of the Australasian colonies is of interest because of its unusual combination of the early orientation of economic activity towards specialization in the urban-based commercial/ manufacturing and service sectors of the economy; the extremely rapid rate of urbani- zation of colonial populations; the small size of these initial populations relative to the land area; large-scale migration (hence maintaining a higher than normal sham of the total population in the labour force); abundant natural resources (min- e d s and grazing land) accompanied by the invention and adoption of capital-intensive agri- cultural and mining technologies (which yielded very high labour productivity); dependence on large foreign cap id flows (domestic savings were supplemented by large flows of British savings); and heavy investment of these savings in the provision and maintenance of public infra- structure. This mix was so successful that by the early 1860s Australia and New Zealand had clearly surpassed the United Kingdom in attain- ing the highest GDP per capita among the (cur- rently) advanced capitalist countries, and maintained that position until they in turn were surpassed by the United States, sometime during the years of World War I (see 3utlin. 1970; Mad-
132
Q 1995. The Economic Society of Australia. ISSN 00134249.

I995 ECONOMIC G R O W AND CONVERGENCE ACROSS AUSTRALASIA 133
dison, 1982; Baumol, 1986; and De Long, 1988).3
The rapid growth of real GDP during the 19th and 20th centuries transformed the colonies of Australasia into prosperous regional economies of two independent countries. and this process of growth will be analyzed in this paper. However, most previous analyses of economic growth in Australasia had to be conducted at the national level (such as Dowrick and Nguyen. 1988). due to the absence of a consistently derived series for the agyegate incomes of the seven regional economies.
Whilst there are many studies of the interna- tional processes of growth and convergence for OECD countries (see Baumol. 1986; DeLong, 1988; Dowrick and Nguyen, 1989; and Barro, I99 1, among others), there are relatively few such works examining regional growth patterns within any given country. Exceptions have been: Easter- lin (1957, 1960). Williamson (1%5) and Barro and Sala-i-Martin (1992a) for the states of the United States of America; Williamson (1965) and Barro and Sala-i-Martin (1991) for the regions of Europe; Coulomb and Lee (1993) for the prov- inces of Canada; De Gregorio (1991) for several South American nations; and Barro and Sala-i- Martin (1992b) and Shioji (1993) for the prefec- tures of Japan.
By undertaking an analysis of the seven Aus- tralasian economies, it is hoped to minimize the problems which would arise if the various econ- omies exhibited different steady-state real GDP per capita. Given that all seven colonies are likely to possess similar levels of technology and similar preferences, and the fact that there has existed a relatively unfettered flow of both capital and labour across colony borders, one would expect all colonies to have similar levels of real per- capita GDP in the steady state. Accordingly, in this case absolute convergence should be closely approximated by conditional convergence.
Note that the closed economy model of conver- gence obviously cannot be applied literally to the
3Maddison’s (1977) data reveal that Australia’s GDP per capita as a percentage of US GDP per capita was 173 in 1870. while the corresponding figure for Britain relative to the US was 124. In 1890 (1913) the com- sponding figures were 145 (107) for Australia, and 103 (81) for Britain. By 1929 tbe figures were 74 for Australia and 67 for Britain, and Australia’s percapita income has largely remained at that percentage of US GDP per capita ever since.
Australasian colonies, because for given technoi- ogies convergence in both per-capita GDP and capital stocks will occur faster in open than in closed economies. However, as shown by Barro, Sala-i-Martin and Mankiw (1992), in the presence of imperfect capital markets which constrain only a fraction of physical capital to be able to serve as collateral for investment by governments and or individuals, GDP exhibits very similar behav- iour to that which would be predicted by the closed economy model of this paper. That is. partial capital mobility in an open-economy version of the neoclassical growth model can explain the gradual incidence of convergence in GDP. While these constraints on the role of col- lateral were undoubtedly present, the Australasian colonies were in the advantageous position of having, for much of the 1861-1991 period, the world’s largest net exporter of capital as their ‘mother’ country.
Answers to two key questions will be explored in this paper. First, did the initially poor colonies of Australasia subsequently grow faster than the initially rich colonies? Second, has the cross- sectional dispersion of percapita incomes across the colonies grown or diminished over the period of analysis? Evidence is found which supports the conjectures of the neoclassical growth model of Solow ( 1956) and Swan ( 1956): the poor colonies did indeed grow faster, and have been converging toward the rich colonies at a rate of about 1.2 per cent per year (assuming a common steady state for all colonies). There has also been a secular decline in the cross-sectional standard deviation of the logarithm of percapita incomes (that is, a decline in the coefficient of variation) over the period 1861-1991, and most of this decline occurred in the period 1861-1901.
Section Il sets out the concepts of convergence to be used in this paper, while Section 111 dis- cusses the data used. Section IV presents estimates of the speed of convergence of the poor colonies to the rich. and Section V presents estimates of the dispersion of percapita GDP across the col- onies. Finally, Section VI offers some concluding comments.
II Concepts of Convergence Barro and Sala-i-Martin (1992a) take a Cobb-
Douglas production function in units of effective labour, and a representative consumer with a utility function exhibiting constant intertemporal elasticity of substitution, log-linearize the resultant

134 ECONOMIC RECORD JUNE
equations of motion about the steady state and derive the dynamic equation for the average growth rate of percapita output, y. over any given interval between 0 and T:
T- l In(y#yg) = (1 - e - 4 T - 1 InG*/j,J + r. (1)
whm is the speed of converged . T is the length of the time in tmd, j is output per unit of effective labour. the superscript dcnotrs steady- state values. and x is the exogenous rate of labour- augmenting technical progress. In ( I ) convcrg~-e is conditional. as what drives B is the level of yo for each economy relative to its own j' and r, which need not be homogeneous across =on* mies. The probability of such homogeneity is, however, greattr for regions of a given counby. which arc more likely to share common levels of technology and common preferences?
If we assume the level of technology is Likely to be uncomlated with initial income, and that technologies are relatively homogeneous acfoss the Australasian colonies, then yo can be substi-
4For a Cobb-hglas production function in intensive form. where output per worker is a hrnction of capital per worker, and assuming a constant saving ratc (as do Solow. 1956. and Swan, 1956). thm is a clod-form solution for thc convergence coefficient = ( I - a) (I + n + 6). whcrc a i s the share of capital in outplt. n is thc rate of popuhon growth. 6 is thc depreciation rau, and I is the long-term growth ratc of GDP. In the case of a variable saving ratc ( w h m saving is a function of thc percapita capital stock) and production functions that arc not COWDouglas. B is determined by thc par- amctm of prefennces and technology. as well as by (5
x. n. and 6 For example. in the optimizing framcurork of thc Ramscy (1928) &I, an incread willingness to save (due eirhcr to a reduction in tbc me of time prefertMx or a fall in thc intertemporal elasticity of sub- stitutioci) along the transition to an economy's steady state will reduce B. The key notion here is thot the efftct on B does not depend on the level of the saving ratc. but on Ihc tendency for the saving rare to risc or fall as the economy develops; a rising saving rate along the transition lowen fl relative to that in the SaloarSwan model. and vice versa. See Barro and S a l a - i - M (1994) for funher dctails.
regions of a given c w q may break down if the def- inition of 'technology' is broadened to embrace mdow- mentsofnaturalnsounrsandgovemmentpolicieswhich a f f ~ t h c ~ ~ t u l n t o p r o d u c e n ( t h r w g h t h c c n f ~ t of propmy rights and the kvying of taxation). smadipity in lcsourcc endowments and differential fiscal policies call thus induce ~ e m o u s technology across ochcr- wise similar regional economies.
SThC wtion of homogeMous technology axvss
tuted for io in ( I ) . Accordingly, a version of (1) that applies for discrete periods for any given economy i gives the (geometric) average growth rate over the interval t - T and t as:
= c - T - 1 [ I ~ Q ~ , - ~ ) I ( I - e-a3 + pir (2)
where i indexes the economy, T is the length of the observation interval, t is time, yif-r is real per- capita GDP for each economy at tlme t - T, the beginning of the subperiod; yir is real per-capita GDP at time r. /3 is the convergence coefficient; pir is a distributed lag disturbance term, and C is a constant term with c = r + [(I - e-f l ) / g[ln(y.) + so]. which is independent of i if we assume all Australasian colonies have similar underlying preferences and technology, and so will have the same steady-state levels of real per- capita GDP and the Same steady-state growth rates: thus. I = xi and y * = yf. Note that in (2) it is assumed that pi, is distributed independently of both I ~ ( Y ~ , - ~ ) and pjp i f j .
There arc two measures of convergence which follow from equation (2). The first, known as konvergence. asks whether initially poor econ- omies tend to grow faster than initially rich ones (that is, whether there is mean reversion in the level of real percapita GDP across economies). Another concept is aconvergence, which consid- ers the decline of the cross-sectional dispersion of real GDP percapita over time. That is. it asks whether the standard deviation of the logarithm of percapita GDP (the coefficient of variation) is shrinking across economies. Barro and Sala-i- Martin (1992.a) note that konvergence is a nec- essary but not a sufficient condition for csconvergence. as a positive /3 will tend to reduce a, (the dispersion of Myif) in (2)), for a given distribution of pi,, but new exogenous shocks to pi, will tend to raise a,
An aggregate shock such as a large relative fall in the price of agricultural commodities would reduce the value of real output (akin to an income effect) in agriculture-based colonies. Conversely, it would raise the value of real output for those coloNes which did not have a relatively large agricultural sector. Such disturbances alter the dis- tribution of the error term, pip so that prf is no longer distributed independently of p. for c o b nies i andj, thus tending to raise 0, &mporarily above its steady-state value. a. However, given

I995 ECONOMIC GROWTH AND CONVERGENCE ACROSS AUSTRALASlA 135
that the steady-state distribution of pir does not change, following any given temporary shock a, + oover time.
Omitted variable bias can result if we do not control for these shocks. For example, such an aggregate shock to agricultural prices would dif- ferentially affect the more rural-based Australa- sian colonies. If such colonies were initially poor, then an adverse price shock would induce under- estimation of the subsequent speed of conver- gence, p, as the omitted (shock) variable would be positively correlated with initial income, yi,r-T6 Moreover, the main sectoral shift of employment in the colonial economies over this period was from agriculture to other sectors, prin- cipally mining. manufacturing and services. As economies develop, workers generally shift out of agriculture, and if these other sectors have higher labour productivity than agriculture, then this shift alone in the pattern of the workforce would gen- erate growth in those colonies with initially high shares of their labour force in agriculture (Kuznets, 1966). Hence the initial share of each colony's workforce employed in agriculture (agri,,-T) is included in the estimation of equation (2). to control for the sectoral composition of colonial production. This rural employment vari- able would also be expected to control for shocks which have common effects on subgroups of col- onies-such as a relative decline in the fortunes of the agriculture-based colonies in the 1890s due to drought conditions existing in Austnlia over much of that decade.
Ill Thr Dam No official estimates of the nominal GDP of the
six Australian colonies exist before. 1978. or for NZ prior to 1933. Neither arc there any other con- sistently derived calculations of such estimates for each of the colonies, as most economic historians in Australia and New Zealand have been content to focus their analysis on secular trends at the national level of both countries. Consequently, much of the data on colonial aggregate incomes used here are taken from Cashin (1993a. 19!33b), and were derived using data on monetary aggre-
6It is assumed here that y , repments real per-capita income from the production of goods and smices in economy i. and so changes in relative prices appear as changes in y , That is. assuming no quantities change. a fall in agricultural prices generates a lower growth rate of yi, in economics which are large agricultural producers.
gates and a technique first suggested by Doblin (1951) and Friedman (1961). This technique, which has b a n previously used by Leff (1972) and Hawke (1975), utilizes the income form of Fisher's (191 1) quantity equation:
M V = Y = PNy = Py' (3)
where M is the quantity of money (however defined), V is the income velocity of the circula- tion of money, P is the price index implicit in estimating national.income at constant prices, N is the number of pinons in the population. y' is national income in constant prices, y is per-capita national income in constant prices and Y is nominal national income. Given accurate figures for the monetary aggregate of choice (M). the use- fulness of the resulting estimates of nominal income (Y = Py') derived from (3) is contingent on an accurate determination of the annual income supported by a unit of money, V.
This monetary-based technique was used to derive estimates of 'national' income (as meas- ured by GDP): from 1861 to 1970 (for selected years) for each of the six Australian excolonies, which in 1901 became States of the Common- wealth of Australia; and from 1861 to 1921 (for selected years) for the seventh colony of New Zealand. which became in time an independent nation. It is important to note that the data on nominal GDP at market prices for the years 198 1, 1986 and 1991 for each of the six Australian economies have been taken from official ABS (1993a) estimates. Similarly, the data on NZ's nominal GDP at market prices for selected years of the period 1933-91 have beem taken from semi- official estimates (Department of Statistics, 1957; Easton, 1990) and official estimates (Department of Statistics, 1990, 1993)? The data cover selected years of the period 1861-1991 for all seven Australasian economies, more specifically the Australian census years of 186 I, 187 1. 188 1, 1891. 1901, 1911, 1921, 1933 (delayed due to the Great Depression). 1947 (delayed due to World
'Note that estimates of NZ's national income for the 1930s am semi-official in nature, and until 1947 arc for GNP. not GDP (we Dcparhllent of Statistics. 1957). Easton's (1990) nominal GDP estimates for the 1933- 46 period. which are used here. were exaapolated from tk official GNP estimates. and closely approximate those of Lineham (1%8) for the early years of this period. From 1947 official estimates of NZ's nominal GDP become available, and are used here.

136 ECONOMIC RECORD JUNE
War U). 1954, 1961. 1971: 1981. 1986 and 1991. In deriving the monetary-based estimates of
colonial GDP, the Australian income velocity of money (V,,) was first calculated for selected years over the period 1860-1970, using data taken from Butlin (1962) and Butlin and Sinclair (1984) on Australian GDP at market prices (U,), and Aus- tralian data on money stocks between 1860-1970 (Ma: taken from Butlin. Hall and White, 1971, and White, 1973). Then the colonial monetary aggre- gates (M; where i = NSW, VIC, QLD, WA. SA, TAS and NZ) were multiplied by Vq to yield esti- mates of nominal GDP at market pnces (pi in (3)) for each of the i colonial economies for selected years of the period 1860-1970).9Jo.
ualian colonies these nominal GDP values were then deflated by the implicit Australian GDP deflator (with basc year 191 1). taken from Butlin (1962) and Vamplew (1987) for 1861-1985 and ABS (1993b) for 198691. For NZ a volume GDP index (base ycar 191 1) was collstNcttd using the Nzf (New Zealand dollar)-bascd Cumnt price GDP data and an appropriately linked price index (with base year 1911), the laner comprising the consumer price index of Thompson and Nesbit- Savage (1994) for 1861-1914. the GDP deflator consm~~ted by Easton (1990) for 19 15-55. and the official GDP deflator of the Department of Statis- tics (1990, 1993) for 195691. The NZ volume GDP index was then applied to the AS (Australian
TO generate real GDP fig~rrs for the six Aw-
income data are actually calculated for 1970 rathalhan 1 9 7 1 , ~ 1970isthclasryearoftheAustm- lian mommy d a ~ of White (1973).
9Aus&alasian colonial monttary aggregates follow the mventioaal definition: M1 is cumacy held by thc non-bank public plus Cumnt (demand) deposits at -g (c- . )banks; Mz is M 1 plus fixd (time) deposits at trading hanks; M3 is M2 plus &posits at saving banks held by thc non-bank public. M3 is tbe moa#ary aggregate uscd for the Aushaliaa colonies. and is nct of intcrbanL and govermnent deposits. Notc that M1 is b e monetary aggrcgatc used for New zealand due to a lack of data on M3 prior to 1877. and is taken from Bloomfield (1984) for 1861, Rcscrve Bank of New Zealand (1990) and Sheppard. Guerin and
(1992) for 1990-91. The M 1 aggregates art thcn mul- tiplied by estimates of Ausaalian velocity of MI to yield NZ's nominal GDP.
%ata 011 cumncy held by the noa-bank public arc taken from the national estimka of Scbedvin (1973) and Vamplew (1987). which am divided into d o a i d statc estimates of cumncy holdings on bu basis of the respective colony shares in the national Popllatloa.
Lec (1990) for 1862-1989. and RMC BanL of NZ
dollar>based estimate of NZ's 1911 GDP to derive "2's real GDP (in 191 1 AS) for the period 1861-1991.11 For all colonies. these real colonial GDP estimates were then divided by the nspec- tive census-based population of each colony (taken from Vamplew. 1987; ABS. 1987, 1990. 1993a; Bloomfield 1984; and Department of Sta- tistics, 1992, 1993) to derive real percapita colonial GDP (in constant 1911 A$) at market prices. See Cashin (1993a, 1993b) for further details of the estimation procedure.
N AMtysis of PConvergence Across the Colonies
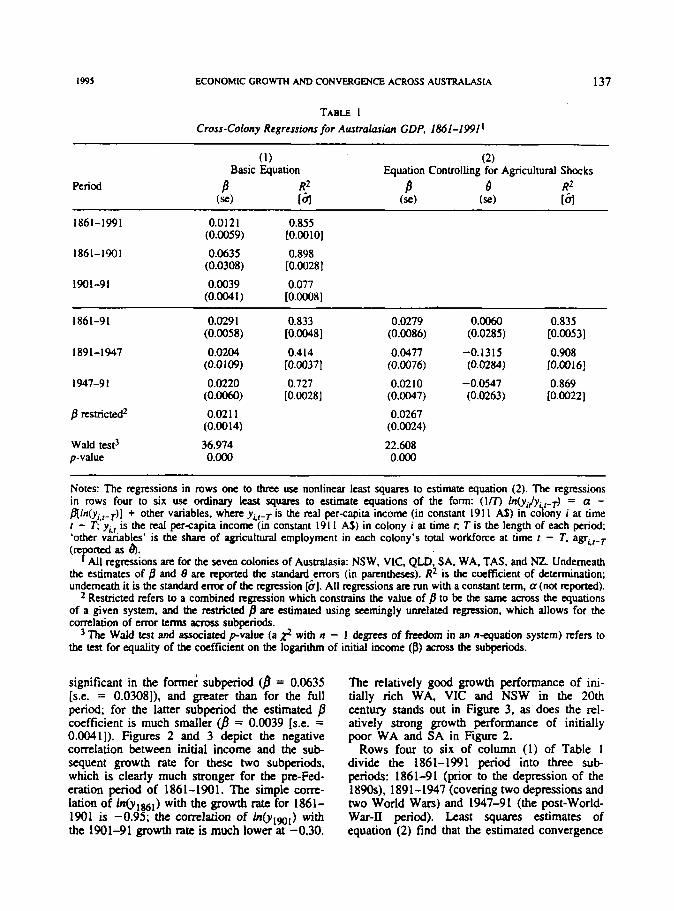
The task of this empirical section is to analyze the pattern of fionvergence of real per-capita GDP ac~oss the seven Australasian colonies. Column (1) of Table 1 reports the regression esti- mates of the convergence coefficient (8, in equation (2). and in all column (1) regressions only a constant term (not reported) and the loga- rithm of initial subperiod income are the explan- atory variables. Note that a positive coefficient for fi can be translated as initially poor colonies growing faster than initially rich ones.
The first row of column (1) in Table 1 reports the results for a single regression on the whole period, 1861-1991, and it is found that b = 0.0121 [s.e. 0.00591 is the result. with an adjusted R* of 0.855 and standard e m r of the regression of 0.0010. Such a value for b implies a half-life of the logarithm of percapita income (the time it takes for one half of the gap between any initial percapita income and the steady state percapita income to be closed) of about 57 yeus. This esti- mate of is statistically different from zero, and the negative cornlation (reflecting /3-convergence) between 1861-1991 growth rate can so be Seen in Figure 1: the simple correlation is -0.95. As expected. both WA and SA had below-average percapita incomes in 1861, and relatively high rates of growth of percapita incomes in the 131
Single-equation regressions are then run for both the 1861-1901 and 1901-91 subperiods. and it is found that B has the expected sign in both cases (rows two and three, column (1)). The s p e d of convergence is large and statistically
"As tfw Australian and New Zealand currencies trsdcd at par in 1911. the value of NZ's nominal GDP in that year was the same when measured in either cumncy.
h9ss') and the
years thereafter.
1995 ECONOMIC GROWTH AND CONVERGENCE ACROSS AUSTRALASIA 137
TABLE I Cross-Colony Regressions for Ausrralasian GDP, 1861-1991 I
(1) (2) Basic Equation Equation Controlling for Agricultural Shocks
B RZ (se) [a R2 B
13 (se) Period B
(=)
1861-1991 0.0121 0.855
1861-1901 0.0635 0.898
1901-91 0.0039 0.077
(0.0059) LO.00 101
(0.0308) [0.00281
(0.0041) [0.0008]
(0.0058) [0.00481 (0.0086) (0.0285) [0.0053]
(0.0 109) [0.0037] (0.0076) (0.0284) [0.0016]
I 86 1-9 1 0.029 1 0.833 0.0279 O.Oo60 0.835
I89 1-1 947 0.0204 0.414 0.0477 -0. I3 15 0.908
1947-9 I
mtrictedZ
0.0220 0.727 0.02 10 -0.0547 0.869 (O.Oo60) [0.00281 (0.0097) (0.0263) [0.0022] 0.02 1 1
(0.0014)
Wald test3 36.974 p-value O.OO0
0.0267 (0.0024)
22.608 O.Oo0
Notes: The regressions in rows one to three use nonlinear least squares to estimate equation (2). The regressions in rows four to six use ordinary lcast squans to estimate equations of the form: (lm In(yi,ly.,-T) = a - flln(yi,f-T)] + other variables. where y irr f is the rcal percapita income (in constant 191 1 AS) in colony i at time - T; y i f , i s the real percapita income (in constant 191 I A$) in colony i at time t, 7 is the length of each period;
‘other vanables’ is the share of agr icul td employment in each colony’s total workforce at time r - T. agrir-T
rM regressions are for the seven colonies of Australasia: NSW. VIC, QLD; SA. WA. TAS. and NZ. Underneath the estimates of B and 8 are rcponed the standard-emrs (in parentheses). R2 is the coefficient of determination; underneath it is the standard error of thc regression [o]. All regrrssions arc run with a constant term. a (not r e p o d ) .
Restricted refers to a combined regression which constrains the value of B to bc the same across the equations of a given system. and dre restricted are estimated using seemingly unrelated regression. which allows for the correlation of error terms acrws subperiods.
The Wald test and ass0ciated pvalue (a 2 with n - 1 degrees of freedom in an n-equation system) refers to the test for equality of the coefficient on the logarithm of initial income (f3) across the subperiods.
(re n tdas 4.
significant in the forme; subperiod (B = 0.0635 [s.e. = 0.0308]), and greater than for the full period; for the latter subperiod the estimated p coefficient is much smaller (B = 0.0039 [s.e. = 0.0041)). Figures 2 and 3 depict the negative correlation between initial income and the sub- sequent growth rate for these two subperiods, which is clearly much stronger for the pre-Fed- eration period of 1861-1901. The simple com- lation of h ~ ( y , ~ ~ ) with the growth rate for 1861- 1901 is -0.95; the correlation of h(yIw,) with the 1901-91 growth rate is much lower at -0.30.
The relatively good growth performance of ini- tially rich WA. VIC and NSW in the 20th century stands out in Figure 3, as does the rel- atively strong growth performance of initially poor WA and SA in Figure 2.
Rows four to six of column (1) of Table 1 divide the 1861-1991 period into three sub- periods: 1861-91 (prior to the depression of the 18%). 1891-1947 (covering two depressions and two World Wars) and 1947-91 (the post-World- War-II period). Least squares estimates of equation (2) find that the estimated convergence

138 ECONOMIC RECORD JUNE
FIGURE 1
Convergence of Real Per-Capita GDP: 1861 GDP and GDP Growth 1861-1991
0.01 9
0.01 8 -
5 0.017-
% 0.016- 6
0.015-
0.014- g 0 0.013-
g 0.012-
-
= WA
r
I r
r
U z
- Q 1
4 0.01 1 -
0.01 I I I I I I I I I I
3.7 3.8 3.9 4 4.1 4.2 4.3 4.4 4.5 4.6 4.7 4
Ln of 1861 Real GDP Per Capita 8
coefficients for all subperiods have the appropri- ate sign and all are significant, although the coef- ficient is relatively small (/3 = 0.0204 [s.e. = O.OlOS]) for the subpcriod 1891-1947.'* A multi- variate regression on the threeequation system yields in row seven a restricted estimate of /3 = 0.021 1 (s.c. = 0.0014). which, when tested for the null hypothesis of the same boefficient in all three subperiods. is rejected (Wald = 36.97, p value = O.OO0).
The apparent instability of the convergence coefficients in the three subperiods could reflect aggregate disturbances which differentially affected colonial GDP (as mentioned in Section II above). Accordingly, in column (2) of Table I the share of agricultural employment in each colony's total labour force (agri,-r) is added to the basic regression to conml for aggregate shocks. As a
"The simpk correlation between initial income and subsequmt p w t h is -0.91. -0.64, and -0.85 for the 1861-91. 1891-1947 and 1947-91 subperid. rrspcctively.
result, the estimated j? coefficient for the sub r- iod 1891-1947 is raised considerably (from r= 0.0204 to /3 = 0.0477). The restricted coefficient in the multivariate regression (row seven, column (2)) now has a value of /3 = 0.0267 [s.c. = 0.0024], while the null hypothesis of quality of the estimated fioefficients across the three sub- periods is again Ejected (Wald 22.61, pvalue = O.OO0). It appears that the agricultural employ- ment variable is unable to fully capture the influ- ence of agpgate shocks on the growth process, although it does provide information on the sec- toral pattern of colonial growth across the three subperiods.
The agricultural employment variable (reported as in column (2) of Table I) is negative and significant for the 1891-1947 and 1947-91 sub- periods. This indicates that, for example, during the agricultural price fall of the 1891-1947 sub- period, those states where the agricultural sector was a relatively large contributor to GDP had lower rates of growth of per-capita income (8 =

1993 ECONOMIC GROWTH AND CONVERGENCE ACROSS AUSTRALASIA 139
FIGURE 2 Convergence of Real Per-Capita GDP: 1861 GDP and GDP Growth 1861-1901
- cp 3
0.005- a
3.7 3.8 3.9 4 4.1 4.2 4.3 4.4 4.5 4.6 4.7 4 Ln of 1861 Real GDP Per Capita
8
-0.1315 [s.e. = 0.02841). This was also the case for the 1947-91 subperiod (8 = -0.0547 [s.e. = 0.02631). However, the coefficient on the share of agricultural labour was positive (8 = 0.0060 [s.e. = 0.02851) for the 1861-91 subperiod: with initial income in 1861 held constant, agricultural-based colonies had slightly higher rates of growth of percapita income.
Note that in row five of column (2) it is the period 1891-1947 which exhibits the largest con- vergence coefficient (b = 0.0477 [s.e. = 0.00761). The relative decline in agricultural commodity prices since the early 1890s hurt those economies specializing in such products. In 1891 QLD, WA and TAS had below-average per-capita incomes, yet each had a relatively large shan of their 1891 labour force in agriculture: the correlation of h(y1891) with ugr1891 is -0.78. Consequently, because of the positive correlation between the aggregate shock and initial income, in row five of column (1) was underestimated: it reflected the tendency of the poorer colonies to be agricultural
and hence to experience relatively slow growth during this subperiod.
While the shock to agriculture in the 1947-91 subperiod again affected the States differentially, unlike the 1891-1947 subperiod it exhibited little correlation with initial levels of State per-capita incomes. In 1947 QLD, WA and TAS were in economic circumstances similar to 1891, with above-average shares of agricultural employment, and below-average per-capita incomes. However, in 1947 NZ was clearly the richest (in percapita income terms) of all the colonies. and had a large share of its 1947 labour force in agriculture. Con- sequently, there was little systematic relation between Inbl947) and ugr1w7 (the correlation of the former with the latter is 0.102), and so con- trolling for the a gregate shock yields a similar point estimate of to that obtained in the absence of a g r I N T For the 1861-91 subperiod again agri- cultural-based colonies tended to be relatively poor (the correlation of with a g r I M 1 was -0.66). yet the positive shock to agriculture

140
d
6
2
r 0.0145-
z 0
- 0.014- cp 3 C
0.0135-
0.013
ECONOMIC RECORD JUNE
I
NZ
QLD I
I I I I 1
FIGURE 3 Convergence of Real Per-Capita GDP: 1901 GDP and GDP Growth 1901-91
0.016 I
35
meant that B in row four of column ( I ) was over- estimated; controlling for the aggregate shock lowered B in row four of column (2), because of the negative correlation between the agricultural shock and initial income. The estimated speed of convergence for the
Australasian colonies between 1861-1991 (B = 0.0121) is slower than that found in most earlier studies of regional economies: the states of the United States (B = 0.0249) between 1880-1988 by Barro and Sala-i-Martin (1992a ; the regions of European OECD countries ( B = 0.0178) between 1950-85 by Barro and Sala-i-Martin (1991); European and non-European OECD countries () = 0.0097) between 1971-88 by Cashin (1993a); the provinces of Canada (B = 0.024) between 1961-91 by Coulomb and Lec (1993); 98 (OECD and non-OECD) countries (B = 0.01 11) between 1960-85 by B m (1991); the prefectures of Japan (B = 0.034) between 1930-87 by Barro and Sala-i-Martin (1992b); and for Japan again ( B = 0.033) between 1960-
88 by Shioji (1993). Bmo and Sala-i-Martin (199 I ) hypothesized that the more heterogeneous the steady states to which a group of economies are converging, the slower the speed of conver- gence, even after controlling for the disparate steady states. That is. regions of a given country (such as the United States. Canada, Japan and Ausrral(as)ia) should exhibit the fastest conver- gence, followed by similar national economies (such as the OECD). followed by all national economies. While for some subperiods the present findings f i t into this hierarchy of conver- gence speeds, over the long sample period this does not appear to be the case for the Australa- sian colonies.
However, the fact that &convergence is observed in Australasia without controlling for differences in steady-state colonial growth rates or levels of percapita incomes is indicative of homo- geneity across colonies with respect to steady states (andor substantial labour mobility across colonies). yet heterogeneous initial levels of per-
1995 ECONOMIC G R O W AND CONVERGENCE ACROSS AUSTRALASIA 141
capita colonial incomes. Hence, absolute and con- ditional convergence in the Australasian colonies do appear to be almost synonymous.
It is well known that errors in the measurement of explanatory variables will result in biased regression estimates of key parameters. A candi- date for such errors is initial income, ln(yi,l-7), which is the sole explanatory variable (along with a constant term) on the right-hand side of the basic konvergence equation (2).13 As noted in Section 111, in calculating colonial nominal GDP use is made of the Australian income velocity of money (V,). This could impart a bias to the esti- mated /%coefficient on initial real per-capita colo- nial GDP in (2). to the extent that the individual colony velocities, Vi, are not closely approximated by V,. However, for constant income elasticity of money demand ( q ) there will be no bias as there is then a constant proportionate error in using the monetary-based technique, because all income measures will be scaled up by this error term; if q is increasing (decreasing) over time, then there would be a bias away from (towards) a finding of pconvergence. See Cashin (1993a. 1993~) for the technical derivation of these results.14
13Another cause of potential bias is the use of a national deflator to adjust nominal colonial GDP figures for the rate of change of prices. That is, where Pa (the rate of change of Austnlian [allcolony] prices) is used nther than Pi to derive real GDP for each colony from nominal colonial GDP. if prices differ across colonies at points in time, the cornlation between fa and the m r term will induce bias in the estimated coefficients. However, there are no available price series for the col- onies during the 1861-1900 period. and post-1900 data reveal that prices generally moved together in all colo- nies. Moreover. the use of a common (national) deflator for each colony at each point in time in cross-sectional analysis will affect only the constant term in each re ression.
q4As a check for the extent of any bias flowing from the use of monetary-based data the estimated conver- gence cocfficient for thc seven colonies over the 1981- 91 subperiod was -0.0016 [se. 0.024481 using the actual (ABS 1993a, Department of Statistics 1993) state income data. and 0.0098 [s.e. 0.04661 using the monetary-based data. while in neither case is conver- gence over this subperiod statistically different from zero, the results from either data set were similar, revding either very s d l &hvergence (actual income data), or very small fionvergence (monetary-based data).
V Analysis of 6Convergence Across the Colonies
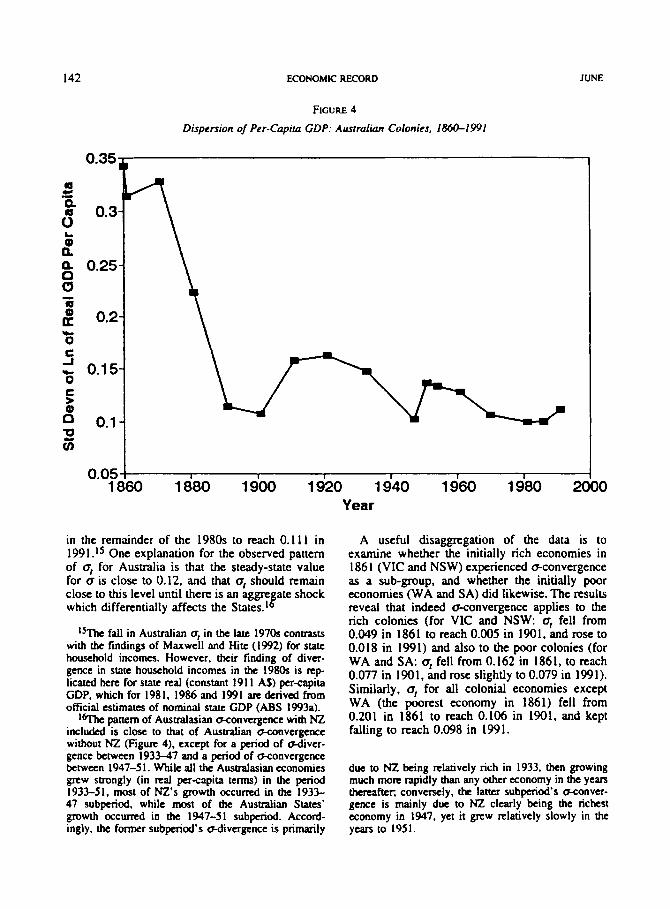
In examining the extent of monvergence acmss the seven Australasian regions the unweighted cross-sectional standard deviation of ln(yit). a,, was calculated for the period 1860- 1991. Figure 4 shows a secular downward trend for the dispersion of real per-capita GDP among the six Australian colonies, except for the sub- periods 1861-71. 1901-21 and 1947-51. The dis- persion (a,) declined from 0.342 in 1860 to reach 0.107 in 1901, but then rose to 0.162 by 1921. It then falls again to 0.102 by 1947. and subse- quently rises to 0.136 in 1951, before continuing its fall to 0.1 1 1 in 1991. A least squares regression of a, on a time trend and a constant term revealed that for the 1861-1991 period the cwfficient on the time trend was significantly negative (p = -0.01 1 [s.e. = 0.00281). For the 1861-1901 sub- period the coefficient was even larger @ = -0.0625 [s.e. = 0.01281). Similarly, for the 1921-91 subperiod, (where a, resumed its down- ward path after the 1901-21 divergence period), the coefficient is significantly negative (B = -0.0055 [s.e. = 0.00171). yet lower than for the 186 1 - I 90 I subperiod. The dispersion of real per- capita GDP across the colonies rose (see Cashin, 1993a. 1993c, for further details): between 186 1 - 7 I as a result of gold discoveries benefiting those colonies (VIC and NSW) which already had high initial real incomes; between 1901-21 due to the adverse fiscal effects of Federation on TAS (a rel- atively poor colony in 1901). and adverse terms of trade shocks arising from World War I, which differentially disadvantaged WA as an economy relatively more dependent on international trade; and between 1947-51 due to the Korean War- induced boom in commodity (particularly wool) prices, which again primarily benefited those State economies with already high real percapita GDPs (VIC and NSW). This process of a reduction in the cross-
sectional dispersion of percapita GDP for the Australian States is very similar to the pattern exhibited by the pfectures of Japan and the states of the United States, where the minimum value of a, was found to be 0.12 and 0.14, respec- tively (Barn, and Sala-i-Martin 1992b). An impor- tant similarity is that the minimum value of a, for the latter two countries was reached in the mid- 1970s and has since risen; likewise for Australia a, reached its minimum in 1981 at 0.099, stayed constant at 0.099 in 1986 and then rose slightly
142
B cn
0.05
ECONOMIC RECORD
I r I I 1 I
JUNE
FIGURE 4 Dispersion of Per-Capita GDP: Australian Colonies, 186&1991
DO
in the remainder of the 1980s to reach 0.1 11 in 199 I .15 One explanation for the observed pattern of a, for Australia is that the steady-state value for a is close to 0.12. and that a, should remain close to this level until there is an aggre ate shock which differentially affects the States. If
lsnK fall in Australian a, in the late 19705 contrasts with the findings of Maxwell and Hite (1992) for state household incomes. However. their finding of d iva - gencc in state household incomes in the 19805 is rep- licated hen for state real (constant 191 1 AS) percapita GDP. which for 1981. 1986 and 1 9 1 arc derived from official estimates of nominal s u e GDP (ABS 1993a).
panem of Australasian u-convergence with NZ included is closc to that of Ausbalian c%convergmce without NZ (Tigun 4). except for a period of d v e r - gencc between 193347 and a period of c%convcrgence between 1947-5 1 . While all the Ausealasian economies grew strongly (in real percapita terms) in the period 1933-51. most of NZ’s growth occurred in the 1933- 47 subperiod, while most of the Austd ian States’ growth occmd in the 1947-51 subperiod. Accord- ingly, the fonner subperiod’s 6divcrgencc is primarily
A useful disaggregation of the data is to examine whether the initially rich economies in 186 1 (VIC and NSW) experienced @convergence as a sub-group, and whether the initially poor economies (WA and SA) did likewise. The results reveal that indeed aconvergence applies to the rich colonies (for VIC and NSW: a, fell from 0.049 in 1861 to reach 0.005 in 1901. and rose to 0.018 in 1991) and also to the poor colonies (for WA and SA: a, fell from 0.162 in 1861, to reach 0.077 in 1901. and rose slightly to 0.079 in 1991). Similarly. a, for all colonial economies except WA (the poorest economy in 1861) fell from 0.201 in 1861 to reach 0.106 in 1901, and kept falling to reach 0.098 in 1991.
due to NZ k i n g relatively rich in 1933. then growing much morr rapidly than any other economy in the years thereafter. convmcly, the latter subperiod‘s 6convcr- gcncc is mainly due to NZ clearly being the richest economy in 1947. yet it grew relatively slowly in the years to 1951.

199s ECONOMIC G R O W AND CONVERGENCE ACROSS AUSTRALASIA I43
The potential for bias in measured oxonver- gence also arises from use of the monetary-based data. Where In(yi,) is measured with error for all r. if q > ! (money as a luxuy good) then the estimated a-convergence (or cxiivergence) will appear more rapid than the true @convergence (or cxiivergence); the opposite occurs for 7 < 1. and for q = 1 there is no bias in the measured dis- persion of cross-colony per-capita incomes. However, even when income levels are measured with error. 0, will always correctly track the direc- tion of movement in or1' Of course, it should again be noted that after 1933 (for NZ) and after 1978 (for the Australian States), official estimates of nominal colonial incomes are used in this anal- ysis. Accordingly, there is no monetary-based measurement error in the estimates of colonial GDP after these dates, and thus no distortion from this source to the observed patterns of honve r - gence and o-convergence.
VI Conclusion Have the initially poor economies of Australasia
grown faster than their initially rich counterparts? A key conclusion of this paper is that there has indeed been convergence in real per-capita GDP (pconvergence) across the colonial economies of Australasia during the period 1861-1991. More over, the Australasian colonies displayed homo- geneity across colonies with respect to steady-state per-capita income levels, yet exhibited heterogeneous initial levels of per-capita income. However, while convergence has occurred. the speed at which the initially poor colonies have caught up to the initially rich colonies is slower than those obtained in analyses of regional con- vergence in the United States. Canada and Japan.
There has also been a diminution of the stan- dard deviation of the logarithm of real per-capita GDP (a-convergence) across the colonies during
"As a check of the extent of any bias flowing from use of the monetary-based data. the standard error of the logarithm of real per-capita incomes (a) was cal- culated for all Seven colonies for 1981, 1986 and 1991. using both the monetary-based and actual (ABS. 1993a; Department of Statistics, 1993) state income data. Using the actual data there is miivergence for these years, as u, rises from 0.0920 in 1981 to 0.0924 in 1986 and 0.1036 in 1991; the monetary-based estimates also find a-divergence. with 6 rising tium 0.0969 to 0.1254 to 0.1466 for the same years. As expected, the monetary- based estimates magnify the extent of any actual move- ment in ub see Cashin (1993a. 1993c) for the technical derivation of this mulr
the period 186 1- 199 1. However, there are several subperiods of d v e r g e n c e when either the ini- tially rich colonies became richer or the initially poor colonies became poorer, due to various rei- ative price, endowment or fiscal shocks. This secular process of wonvergence appears to have continued even as late as the mid-1980s. although at levels of dispersion of per-capita incomes which were very close to those initially attained as early as 1901.
REFERENCES
Austnlian Bureau of Statistics (1987). Ausrralian Dem- ographic Trends 1986. Cat. #3 102.0. Commonwealth Government Printer, Cmbern
- (1990). Projections of the Populations of Australia. States and Territories 1989 to 2031, Cat. #3222.0, Commonwealth Government Printer, Canberra.
- (1993a). Australian Nalionai Accounts: state Accounrs 1991-1992. Cat. #5220.0. Commonwealth Government Printer, Canberra. - (1993b). Australb National Accounts: NatioM/
Income, Enpcnditure and Product, 1991-1992. Cat. #5204.0, Commonwealth Government Printer. Canberra.
B m , R.J. (1991). 'Economic Growth in a Cross- Section of Countries', Quurteriy Journal of Econom- ics 106.4074.
- and Sala-;-Martin. X. (1991). 'Convergence Across States and Regions', Brookings Papers on Economic Acriviry 1:1991. 107-58. - (1992a). 'Convergence', Journal of Polirical
Economy 100. 223-5 1. - (1992b). 'Regional Growth and Migration: A Japan- US. Comparison', Journal of the Japanese and the International Economies 6, 3 1246.
- (1994). Economic Growth. unpublished manuscript, forthcoming, McGraw Hill, New York.
- and Mankiw. G. (1992). 'Capital Mobility in Neo- classical Models of Growth'. Economic Growth Center Discussion Paper #666, Yale University.
Baumol. W. (1986). 'Productivity Growth, Convergence and Welfare: What the Long-Run Data Show', Amer- ican Economic Review 76. 1072-85.
Bloomfield, G.T. (1984). New zcolond: A Handbook of Historical Statistics, G.K. Hall and Company, Boston MA.
Butlin. N.G. (1%2). Australian Domestic Product. Investment and Foreign Borrowing. 1861-1 93W39, Cambridge University Ress. Cambridge UK. - (1970). 'Some Perspectives on Australian Economic
Development, 189&1%5'. in C . Foster (ed.). A M - tralian Economic Development in the Twentieth Century, George Allen and Unwin. Sydney, 266327.
- and Sinclair, W.A. (1984). 'Australian Gross Domes- tic Roduct 1788-1860: Estimates, Sources and

1 4 4 ECONOMIC RECORD IUNE
Methods', ANU Source Papers in Economic History #2, Austdian National University, Canberra-
Butlin. SJ.. Hall. A.R. and White. R.C. (1971). Awtra- lian Banking and Monetary Statistics 1817-1945. Reserve Bank of Australia Occasional Paper MA.
Cashin, P.A. (1993a). Essays on Economic Growth: The Effect of Government on Growth, and an Analysis of Growth in. and Convergence Across. thc Seven Col- onies of Australasia. unpublished Ph.D. dissertation, Department of Economics. Yale Univenity.
- (1993b). 'Using Dam on Money Stocks to Estimate Real Colonial GDP in the Seven Colonies of Aus- ualasia: 1861-1991'. Discussion Paper M87, Eco- nomic Growth Center, Yale University.
- (1993~). 'Economic Growth and Convergence Amss the Seven Colonies of Australasia: 1861- 1991'. Rscussion Paper *88. Economic Growth Center. Yale University.
Coulomb. S. and Lee. F. (1993). 'Regional Economic Disparities in Canada'. mimeo. Univenity of Ottawa.
De Gregorio, J. (1991). 'Economic Growth in Latin America'. IMF Working Paper. WP191fll. Interna- tional Monctvy Fund, Washington, D.C.
DcLong. B. (19881, 'Productivity Growth. Convergence and Welfm: Comment'. American Economic Review
Department of Statistics. New Zealand ( 1957). m c i u l Year-Book, 62nd edn. Government Printer. Wellington.
- (1990). Oficial 1990 Yearbook. 94th edition, Gov- ernment Printer. Wellington. - (1992). Key Sratisrics December 1991. Government
Pnnter. Wellington. - (1993). Oficial 1993 Yearbook. %th edition. Gov-
ernment Rinter. Wellington. Doblin, E.M. (1951). 'The Ratio of Income to Money
Supply: An International Survey', Review of Econom- ics and Statistics 33. 20 I - 13.
Dowrick, S. and Nguyen, D.T. (1988). 'A Re-Assess- ment of Australian Economic Growth in the Light of the Convergence Hypothesis'. AwrraIian Economic Papers 27. 196213.
- ( 1989). 'OECDComparative Economic Growth 1950- 1985'. A N r i c ~ Economic Review 79, 101&30.
Eastcrtin. R. (1957). 'Regional Growth and Income: Long Run Tendencies', in S. K m u and D. Thomas (eds). Population Redistribution and Economic Growth in the United Stures. American Philosophical Society. Philadelpllla - (1960). 'Interregional Differences in Per Capita
Income, Population and Total Income. 1840-1950'. in Conference on Research in Income and Weulrh, NBER Sbld ia in Income and Wealth. Volume 24. Cambridge MA.
Easton. B. (1990), 'A GDP Defla~or Series for New Zedand. 1913/14-197~' . Masscy Economic Papen, Masicy University.
Fisher. I. (191 I). 77te Purchasing Power of Money, Macmillan, New Yok
Sydney.
78. I 138-54.
Friedman. M. (1961). 'Monetay Data and National Income Estimates'. Economic Development and Cul- rural Change 9. 267-86.
Hawk. G.R. (1975). 'Income Estimation from Mone- tary Data: Further Explorations', Review of Income and Wealrh 21. 301-08.
Kuznets. S . (1966). Modern Economic Growrh: Rate, Structure and Spread. Yale University Press, New Haven CT.
Leff. N.H. (1972). 'A Technique for E s t i d n g Income Trends from Currency Data and an Application to Nineteenth Century Brazil'. Review of Income and Wealth 18. 355-68.
Lincham. B.T. (1968). p e w Zealand's Gross Domestic Product 191 8-38', New Zealand Economic Papers 2. 15-26.
Mddison. A. (1977). 'Phases of Capitalist Develop ment'. Banco Nazionale Del Lavoro Quanerly Review 121. 10338.
- (1982). Phases of Capiralisr Development, Oxford University Press, Oxford.
Maxwell. P. and Hire. J.C. (1992). 'The Recent Diver- gence of Regional Per-Capita Incomes: Some Evi- dence from Australia'. Growth anrl Change 23, 37- 53 .
R y n x y . F.P. (1928). 'A Mathematical Theory of Saving'. Economic Journal 38, 54349.
Reserve Bank of New Zealand (1990). 'Annual Esti- mates of MI and M3: 1862-1982'. Reserve Bonk Bulletin 53, 407-1 1.
- (1992). Reserve Bank Bulletin, December Quarter, Wellington.
Schedvin. C.B. (1973). 'A Century of Money in Australia'. Economic Record 49. 588-605.
Sheppard. D.K. Gucrin. K. and Let, S. (1990). ' N Z Monel~y Aggregates and the Total Assets of Leading Groups of Financial Institutions. 1862- 1982'. Money and Finance Group, Victoria Univer- sity of Wellington, Discussion Paper W11.
Shioji. E. (1993). 'Regional Growth in Japan', mimeo. Yale University.
Solow, R.M. (1956). 'A Contribution to the Theory of Economic Growth', Quarterly Journal of Economics 70.65-94.
Swan, T.W. (1956). 'Economic Growth and Capital Accumulation', Economic Record 3 2 334-61.
Thompson. BJ. and Ncsbit-Savage, R. (1994). 'New Zealand C O ~ S U I I W ~ ' Rice Index. 1847-1991'. Working Papcrs in Economics, University of Waihto.
Vamplew, W. (4.) (1987). Australians: Historical Sra- r i s k s . Fairfax. Symc and Weldon Ass0ci;Ues. Broad- way, NSW.
White, R.C. (1973). Austmlian BMking and Monetary Stahrics 1945-1970, Reserve Bank of Australia. Occasional Papcr WB, Sydney.
Williamsoo. J.G. (1965). 'Regional Inequality and the Process of National Development'. Economic Devel- opment and Cultural Change 13, 3-84.