Embed Size (px)
Citation preview


Economic Forecast
OUTPUT AND EMPLOYMENT WHAT THE TABLE SHOWS:
Washington’s GDP forecast is derived from
the national forecast by allocating output to
each of the 50 states based on employment
shares. So, forecast misses reflect surprises
in the aggregate forecast as well as
deviations in the state’s GDP share from the
employment share.
Washington’s economy matched the pace of
the national recovery in 2013.
KEY MESSAGES:
Washington’s economy is forecast to pick up
speed over the balance of 2014 and 2015, in
line with the rebound in the national
economy.
Note: GDP figures are based on quarterly values that are
interpolated from annual GDP estimates using quarterly
employment changes. Unbolded figures are reported actual
values and bold figures represent forecasts.
Sources: US Department of Commerce;
US Department of Labor.
May 26, 2014
Regional Perspectives: Washington Economic Outlook
Commercial Banking 2
2007 2008 2009 2010 2011 2012 2013 2014 2015
United States
Real GDP
$ billions (fourth quarter) $14,996 $14,575 $14,540 $14,942 $15,242 $15,540 $15,942 $16,501 $17,120
% change over the four quarters 1.9% -2.8% -0.2% 2.8% 2.0% 2.0% 2.6% 3.5% 3.8%
Nonfarm employment
Job count (fourth quarter) 138,246,000 135,493,667 129,877,667 130,652,000 132,642,667 134,853,667 137,247,667 139,694,848 141,679,460
% change over the four quarters 0.9% -2.0% -4.1% 0.6% 1.5% 1.7% 1.8% 1.8% 1.4%
Average monthly change 101,667 -229,361 -468,000 64,528 165,889 184,250 199,500 203,932 203,932
Washington
Real GDP
$ billions (fourth quarter) $307 $305 $303 $310 $318 $328 $337 $350 $364
% change over the four quarters 3.5% -0.4% -0.7% 2.2% 2.6% 3.2% 2.8% 3.6% 4.1%
Nonfarm employment
Job count (fourth quarter) 2,991,100 2,960,467 2,827,967 2,848,033 2,884,300 2,947,133 3,005,900 3,071,764 3,120,792
% change over the four quarters 2.6% -1.0% -4.5% 0.7% 1.3% 2.2% 2.0% 2.2% 1.6%
Average monthly change 6,256 -2,553 -11,042 1,672 3,022 5,236 4,897 5,489 4,086

The Economy’s Structure
PERCENT OF TOTAL GDP DERIVED FROM SELECTED INDUSTRIES WHAT THE CHART SHOWS:
The figure compares the relative importance
of selected industries to the state’s economy
with the national footprint of each industry
(state and national figures reflect the value
added of each industry as a percent of
aggregate state or US nominal GDP,
respectively).
Information technology (representing
Microsoft’s influence) contributes more to
the state’s economy than it does for the
national economy.
KEY MESSAGES:
Information technology will be an important
driver for the state, once drags related to the
housing bust pass.
Source: US Department of Commerce. Updated through
2011.
May 26, 2014
Regional Perspectives: Washington Economic Outlook
Commercial Banking 3
0
2
4
6
8
10
12
14
16
Agr
icul
ture
Min
ing
Util
ities
Con
stru
ctio
n
Dur
able
man
ufac
turin
g
Non
dudr
able
man
ufac
turin
g
Who
lesa
le tr
ade
Ret
ail t
rade
Tra
nspo
rtat
ion
Info
rmat
ion
Fin
ance
and
insu
ranc
e
Rea
l est
ate
Pro
fess
iona
l and
tech
nica
l ser
vice
s
Man
agem
ent o
f com
pani
es
Adm
inis
trat
ive
and
was
te m
anag
emen
t ser
vice
s
Edu
catio
nal s
ervi
ces
Hea
lth c
are
and
soci
al a
ssis
tanc
e
Art
s, e
nter
tain
men
t, an
d re
crea
tion
Hot
el a
nd fo
od s
ervi
ce
Oth
er s
ervi
ces
Gov
ernm
ent
US industry mix Washington industry mix
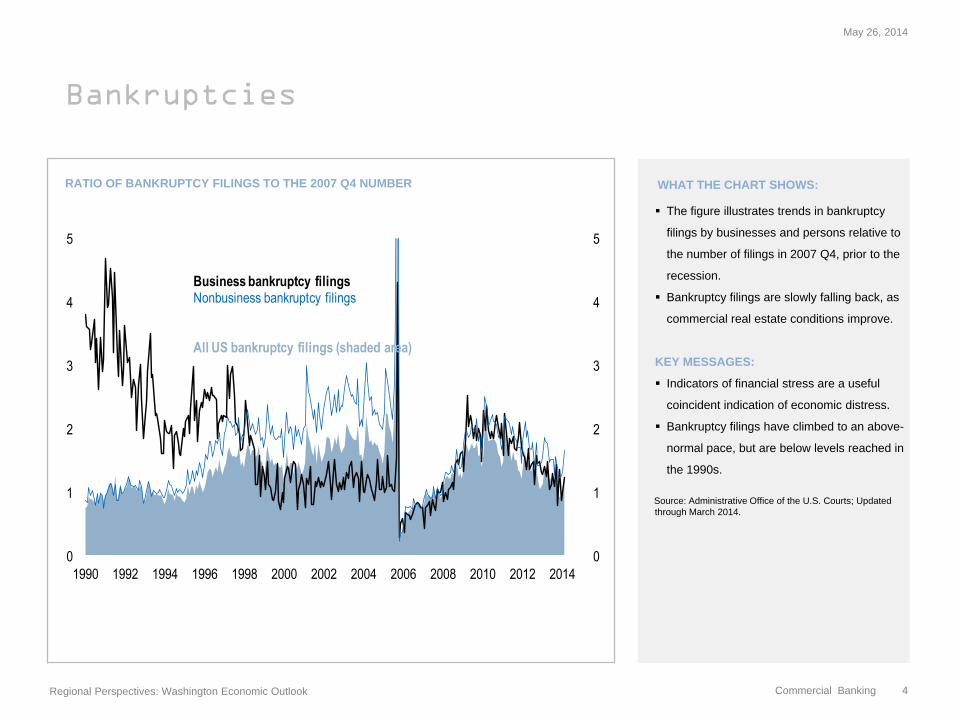
Bankruptcies
RATIO OF BANKRUPTCY FILINGS TO THE 2007 Q4 NUMBER WHAT THE CHART SHOWS:
The figure illustrates trends in bankruptcy
filings by businesses and persons relative to
the number of filings in 2007 Q4, prior to the
recession.
Bankruptcy filings are slowly falling back, as
commercial real estate conditions improve.
KEY MESSAGES:
Indicators of financial stress are a useful
coincident indication of economic distress.
Bankruptcy filings have climbed to an above-
normal pace, but are below levels reached in
the 1990s.
Source: Administrative Office of the U.S. Courts; Updated
through March 2014.
May 26, 2014
Regional Perspectives: Washington Economic Outlook
Commercial Banking 4
0
1
2
3
4
5
0
1
2
3
4
5
1990 1992 1994 1996 1998 2000 2002 2004 2006 2008 2010 2012 2014
Business bankruptcy filingsNonbusiness bankruptcy filings
All US bankruptcy filings (shaded area)

FRB SF Business Survey
REAL GDP (% CHANGE 12 MONTHS EARLIER) DIFFUSION INDEXES (0 = NO CHANGE) WHAT THE CHART SHOWS:
The San Francisco Federal Reserve Bank
survey of local businesses has recovered
from last summer’s lull, and that is a positive
omen for the economy’s future.
The index readings represent the net
difference in the percent expecting
improving conditions and those expecting
worsening conditions.
The survey points to moderate growth in the
quarters ahead.
KEY MESSAGES:
The business outlook remains positive in
Washington.
Sources: Federal Reserve Bank of San Francisco; US
Department of Commerce. Updated through April 2014
(surveys) and 2014 Q1 (GDP).
Note: diffusion indexes represent the percentage of respondents seeing an increase in activity plus one half of the percentage
reporting no change in activity.
May 26, 2014
Regional Perspectives: Washington Economic Outlook
Commercial Banking 5
-30
-25
-20
-15
-10
-5
0
5
10
15
20
25
30
-4
-2
0
2
4
6
8
10
1990 1992 1994 1996 1998 2000 2002 2004 2006 2008 2010 2012 2014
Washington real GDP (left scale)FRB-San Francisco tech impulse index (right scale)
Forecast

Private Business Surveys
REAL GDP (% CHANGE 12 MONTHS EARLIER) DIFFUSION INDEXES (50 = NO CHANGE) WHAT THE CHART SHOWS:
GDP growth in Washington state and the
Western Washington survey of purchasing
managers.
The survey of purchasing managers in the
western regions remains solid.
KEY MESSAGES:
The leading indicators are in positive
territory.
Sources: Institute of Supply Management; US Department
of Commerce. Updated through April 2014 (survey) and
2014 Q1 (GDP).
Note: diffusion indexes represent the percentage of respondents seeing an increase in activity plus one half of the percentage
reporting no change in activity.
May 26, 2014
Regional Perspectives: Washington Economic Outlook
Commercial Banking 6
25
30
35
40
45
50
55
60
65
70
75
-2
0
2
4
6
8
10
1990 1992 1994 1996 1998 2000 2002 2004 2006 2008 2010 2012 2014
Washington real GDP (left scale)
Western Washington NAPM index (right scale)
Forecast
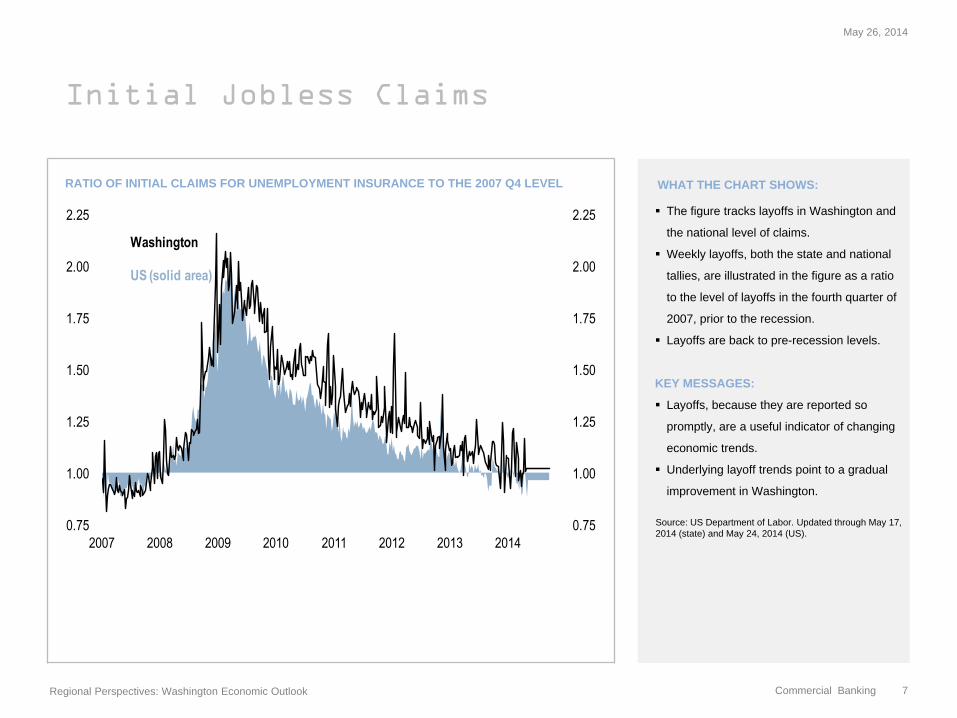
Initial Jobless Claims
RATIO OF INITIAL CLAIMS FOR UNEMPLOYMENT INSURANCE TO THE 2007 Q4 LEVEL WHAT THE CHART SHOWS:
The figure tracks layoffs in Washington and
the national level of claims.
Weekly layoffs, both the state and national
tallies, are illustrated in the figure as a ratio
to the level of layoffs in the fourth quarter of
2007, prior to the recession.
Layoffs are back to pre-recession levels.
KEY MESSAGES:
Layoffs, because they are reported so
promptly, are a useful indicator of changing
economic trends.
Underlying layoff trends point to a gradual
improvement in Washington.
Source: US Department of Labor. Updated through May 17,
2014 (state) and May 24, 2014 (US).
May 26, 2014
Regional Perspectives: Washington Economic Outlook
Commercial Banking 7
0.75
1.00
1.25
1.50
1.75
2.00
2.25
0.75
1.00
1.25
1.50
1.75
2.00
2.25
2007 2008 2009 2010 2011 2012 2013 2014
Washington
US (solid area)

Economic Growth
REAL GDP GROWTH (PERCENT CHANGE FROM FOUR QUARTERS EARLIER) WHAT THE CHART SHOWS:
Real GDP growth in Washington (the line in
the figure) is superimposed on top of US
real GDP growth (bars in the figure).
Washington’s economy did not contract as
sharply as the national economy in the
recession, but again is expanding in line with
national output growth.
KEY MESSAGES:
Growth in Washington is forecast to pick up
speed in 2014 and 2015.
Source: US Department of Commerce. Updated through
2012 (state) and 2014 Q1 (US). Quarterly estimates for
states after 2012 are interpolated from employment figures
(through April 2014), based on the historical correlation of
state and national employment changes.
May 26, 2014
Regional Perspectives: Washington Economic Outlook
Commercial Banking 8
-5
-4
-3
-2
-1
0
1
2
3
4
5
6
7
8
9
10
-5
-4
-3
-2
-1
0
1
2
3
4
5
6
7
8
9
10
90 91 92 93 94 95 96 97 98 99 00 01 02 03 04 05 06 07 08 09 10 11 12 13 14 15
WashingtonUS
Forecast

Economic Output
REAL GDP LEVEL (RATIO TO 2000 Q4) WHAT THE CHART SHOWS:
The figure illustrates the evolution of real
GDP of the state and the overall US
economy since the fourth quarter of 2000,
the peak of the previous business cycle—
that is, at any point in time the lines trace the
ratio of real GDP to its level in 2000 Q4.
Washington didn’t stumble as badly as the
national economy during the recession and
so is recovering from a higher elevation than
the national economy.
KEY MESSAGES:
Washington’s economy appears to be on the
mend.
Source: US Department of Commerce. Updated through
2012 (state) and 2014 Q1 (US). Quarterly estimates for
states after 2012 are interpolated from employment figures
(through April 2014), based on the historical correlation of
state and national employment changes.
May 26, 2014
Regional Perspectives: Washington Economic Outlook
Commercial Banking 9
0.95
1.00
1.05
1.10
1.15
1.20
1.25
1.30
1.35
1.40
1.45
0.95
1.00
1.05
1.10
1.15
1.20
1.25
1.30
1.35
1.40
1.45
2000 2001 2002 2003 2004 2005 2006 2007 2008 2009 2010 2011 2012 2013 2014 2015
Washington
US
Forecast

Employment Growth
NONFARM PAYROLL EMPLOYMENT (PERCENT CHANGE FROM 12 MONTHS EARLIER) WHAT THE CHART SHOWS:
The illustration above compares
Washington’s employment trend with the
nation’s.
Employment is expanding at a robust pace.
KEY MESSAGES:
The state’s job market is expected to
continue to expand at a respectable pace.
Source: US Department of Labor. Updated through April
2014 (state) and April 2014 (US).
May 26, 2014
Regional Perspectives: Washington Economic Outlook
Commercial Banking 10
-6
-5
-4
-3
-2
-1
0
1
2
3
4
5
-6
-5
-4
-3
-2
-1
0
1
2
3
4
5
90 91 92 93 94 95 96 97 98 99 00 01 02 03 04 05 06 07 08 09 10 11 12 13 14 15
WashingtonUS (shaded)
Forecast

Employment in Relative Terms
NONFARM PAYROLL EMPLOYMENT (RATIO TO THE 2000 Q4 LEVEL) WHAT THE CHART SHOWS:
The figure illustrates the evolution of
employment in the state compared with the
nation since 2000 Q4, the peak of the
previous business cycle. The lines trace out
the ratio of employment at the time to
employment in 2000 Q4.
Washington’s job market is performing well,
and the state’s employment base now is well
above the peak of the previous business
cycle.
KEY MESSAGES:
The employment picture is fairly positive.
Source: US Department of Labor. Updated through April
2014 (state) and April 2014 (US).
May 26, 2014
Regional Perspectives: Washington Economic Outlook
Commercial Banking 11
0.96
0.97
0.98
0.99
1.00
1.01
1.02
1.03
1.04
1.05
1.06
1.07
1.08
1.09
1.10
1.11
1.12
0.96
0.97
0.98
0.99
1.00
1.01
1.02
1.03
1.04
1.05
1.06
1.07
1.08
1.09
1.10
1.11
1.12
2000 2001 2002 2003 2004 2005 2006 2007 2008 2009 2010 2011 2012 2013 2014 2015
Washington
US
Forecast
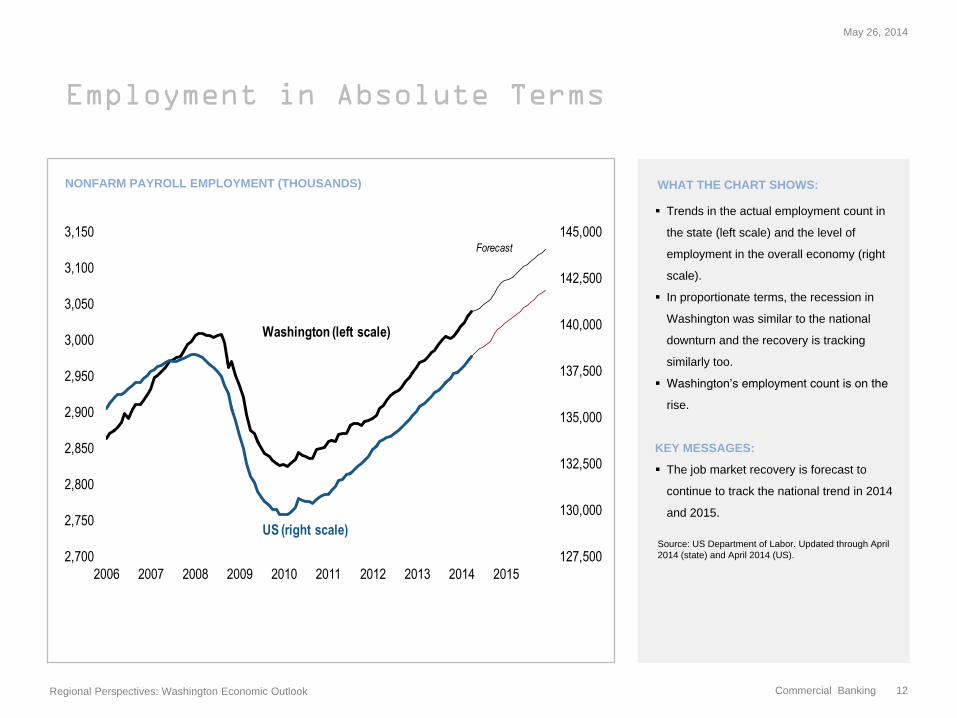
Employment in Absolute Terms
NONFARM PAYROLL EMPLOYMENT (THOUSANDS) WHAT THE CHART SHOWS:
Trends in the actual employment count in
the state (left scale) and the level of
employment in the overall economy (right
scale).
In proportionate terms, the recession in
Washington was similar to the national
downturn and the recovery is tracking
similarly too.
Washington’s employment count is on the
rise.
KEY MESSAGES:
The job market recovery is forecast to
continue to track the national trend in 2014
and 2015.
Source: US Department of Labor. Updated through April
2014 (state) and April 2014 (US).
May 26, 2014
Regional Perspectives: Washington Economic Outlook
Commercial Banking 12
127,500
130,000
132,500
135,000
137,500
140,000
142,500
145,000
2,700
2,750
2,800
2,850
2,900
2,950
3,000
3,050
3,100
3,150
2006 2007 2008 2009 2010 2011 2012 2013 2014 2015
Washington (left scale)
US (right scale)
Forecast

Intrastate Employment
NONFARM PAYROLL EMPLOYMENT IN SELECTED COMMUNITIES (RATIO TO 2000 Q4 LEVEL) WHAT THE CHART SHOWS:
Employment trends in local communities
across the state.
Lines are the cumulative percent change in
employment since 2000 Q4, the peak of the
previous business expansion.
KEY MESSAGES:
Employment trends in most communities are
beginning to stabilize.
Source: US Department of Labor. Updated through April
2014 (state) and April 2014 (US).
May 26, 2014
Regional Perspectives: Washington Economic Outlook
Commercial Banking 13
0.92
0.96
1.00
1.04
1.08
1.12
1.16
1.20
1.24
1.28
1.32
1.36
0.92
0.96
1.00
1.04
1.08
1.12
1.16
1.20
1.24
1.28
1.32
1.36
2001 2003 2005 2007 2009 2011 2013 2015
US forecast
US
Kennewick
Bellingham
Olympia
Tacoma
Wenatchee
Bremerton
Mt. Vernon
Spokane
Seattle-Bellevue
Seattle-Tacoma
Yakima
Longview
Washington forecast
Washington

Unemployment
UNEMPLOYMENT (PERCENT OF THE LABOR FORCE) WHAT THE CHART SHOWS:
Washington’s unemployment rate, compared
with the national average.
The state’s unemployment is receding in line
with the nation’s and is down to almost 6
percent.
KEY MESSAGES:
The unemployment rate is the single best
indicator of the relative economic
performance of a region.
The steep descent in the unemployment rate
implies that the economy is beginning to turn
up.
Source: US Department of Labor. Updated through April
2014 (state) and April 2014 (US).
May 26, 2014
Regional Perspectives: Washington Economic Outlook
Commercial Banking 14
0
2
4
6
8
10
12
0
2
4
6
8
10
12
1976 1979 1982 1985 1988 1991 1994 1997 2000 2003 2006 2009 2012 2015 2018
Washington
US (shaded)
Forecast

Relative House Prices
RATIO OF THE STATE’S HOUSE PRICES TO THE NATIONAL AVERAGE (1995 Q2 = 1.0) WHAT THE CHART SHOWS:
The figure tracks the relative price of houses
in the state and its neighbor versus the
nation—that is, it reflects the ratio of the
state price index to the national house price
index, with that ratio set to unity in the
summer of 1995. A drop in the line means
that house prices in the state lag the
national trend. States that did not suffer from
speculative conditions saw a decline in the
relative price of houses in this last decade.
House prices in Washington mirrored many
of the national trends but corrections
elsewhere and in local markets have
returned house prices back to normal
historical alignment.
KEY MESSAGES:
Real estate prices are stabilizing.
Source: FHFA. Updated through 2013 Q4.
May 26, 2014
Regional Perspectives: Washington Economic Outlook
Commercial Banking 15
0.8
0.9
1.0
1.1
1.2
1.3
0.8
0.9
1.0
1.1
1.2
1.3
1990 1992 1994 1996 1998 2000 2002 2004 2006 2008 2010 2012 2014
Washington
Oregon

Real Estate Markets
HOUSE PRICES IN SELECTED COMMUNITIES (RATIO TO THE 1995 Q2 LEVEL) WHAT THE CHART SHOWS:
The figure tracks the cumulative percentage
deviation in house prices since 1995 in
selected local markets and compares those
with the national average.
House prices are rising in key markets.
KEY MESSAGE:
House prices should begin to firm, in lagged
response to the recovering economy.
Sources: FHFA; Standard & Poor’s. Updated through
2013 Q4.
May 26, 2014
Regional Perspectives: Washington Economic Outlook
Commercial Banking 16
0.75
1.00
1.25
1.50
1.75
2.00
2.25
2.50
2.75
0.75
1.00
1.25
1.50
1.75
2.00
2.25
2.50
2.75
1990 1992 1994 1996 1998 2000 2002 2004 2006 2008 2010 2012 2014
US
Yakima
Spokane
Olympia
Kennewick-Richland-Pasco
Seattle
Bremerton
Bellingham
Seattle (Case-Shiller)

New Home Building
HOUSING STARTS (RATIO TO THE JULY 1990 LEVEL) WHAT THE CHART SHOWS:
The pace of new home building (housing
starts) in Washington, compared with the
national trends.
Housing activity is firming.
KEY MESSAGES:
Washington’s home building industry has
cleaned up many of the excesses from the
last decade and likely will be boosting
construction gradually going forward.
Source: Census Department. Updated through March 2014
(state) and April 2014 (US).
May 26, 2014
Regional Perspectives: Washington Economic Outlook
Commercial Banking 17
0.00
0.25
0.50
0.75
1.00
1.25
1.50
1.75
2.00
0.00
0.25
0.50
0.75
1.00
1.25
1.50
1.75
2.00
2000 2003 2006 2009 2012 2015
WashingtonUS
Forecast

Office Markets
PERCENT OF OFFICE SPACE THAT IS VACANT WHAT THE CHART SHOWS:
Office market conditions in selected
markets.
Vacancy rates in Seattle are beginning to fall
back, confirming the revival of the region’s
economy.
KEY MESSAGES:
Washington’s office markets tend to parallel
the trends in the national market, but
conditions in commercial real estate markets
are improving more rapidly in Seattle than in
the office market nationally.
Source: CB Richard Ellis (formerly CB Commercial Property
Information Systems), Office Vacancy Index of the United
States. Updated through 2014 Q1.
May 26, 2014
Regional Perspectives: Washington Economic Outlook
Commercial Banking 18
0
5
10
15
20
25
0
5
10
15
20
25
1990 1992 1994 1996 1998 2000 2002 2004 2006 2008 2010 2012 2014
Seattle
All metropolitan areas (shaded area)
0
5
10
15
20
25
0
5
10
15
20
25
1990 1992 1994 1996 1998 2000 2002 2004 2006 2008 2010 2012 2014
Seattle
All metropolitan areas (shaded area)

CONTACT:
James E. Glassman
Telephone: (212) 270-0778
© 2014 JPMorgan Chase & Co. All rights reserved. Chase, JPMorgan and JPMorgan Chase are marketing names for certain businesses of JPMorgan Chase & Co. and its subsidiaries worldwide
(collectively, “JPMC”). The material contained herein is intended as a general market commentary. To the extent indices have been used in this commentary, please note that it is not possible to
invest directly in an index. Opinions expressed herein are those of James Glassman and may differ from those of other J.P. Morgan employees and affiliates. This information in no way constitutes
J.P. Morgan research and should not be treated as such. Further, the views expressed herein may differ from that contained in J.P. Morgan research reports. The above
summary/prices/quotes/statistics have been obtained from sources deemed to be reliable, but we do not guarantee their accuracy or completeness.