Embed Size (px)
Citation preview

Assessment Tools A
KN
OW
•
M
EA
SU
RE
•
T
EL
L
•
EN
GA
GE
New Metrics Field Guide Measuring University Contributions to the Economy
MAY 2014
E C O N O M I C E N G A G E M E N T F R A M E W O R K

B APLU n Economic Engagement Framework
AcknowledgementsIn 2009, CICEP began a metrics project to expand how universities measure their contributions to regional and national economic growth. Over a five-year period, 75 individuals representing 54 institutions were involved as working group members or as sites willing to pilot the metrics. Funding to help support the national dialogue, which included a series of workshops and focus group discussions, was provided by the National Science Foundation’s (NSF) National Center for Science and Engineering Statistics (NCSES). Additional support was provided by the U.S. Department of Commerce, through three of its agencies: the Economic Development Administration (EDA), the National Institute for Standards and Technology (NIST), and the U.S. Patent and Trademark Office (USPTO). Other important national partners included the National Academy of Sciences and the National Governors Association.
Many individuals and organizations have contributed to the work described in this publication. APLU and CICEP are grateful for and wish to recognize the contributions of the following individuals, who participated in activities of the CICEP New Metrics working group at various times from 2009 through 2014. Institution and organization names reflect individuals’ affiliation at the time of their work on the APLU New Metrics working group.
This list of acknowledgements is duplicated on the APLU web site (www.aplu.org/CICEPNewMetrics), and we will endeavor to update affiliations as we receive new information.
Working Group ChairsDana Bostrom, Portland State UniversityElizabeth Hoffman, Executive Vice
President and Provost, Iowa State University
Dennis Hoffman, Arizona State University
Alexis Holzer, Washington State University (current co-chair)
Chitra Rajan, Iowa State UniversityDiana Robinson, Northern Illinois
University (current co-chair)Arjun Sanga, South Texas Technology
Management, University of TexasMary Walshok, University of California,
San DiegoDavid Winwood, University of Alabama
at Birmingham, UAB Research Foundation
Working Group MembersElizabeth Ambos, California State
UniversityJames Baker, Michigan Technological
UniversityBurton Bargerstock, Michigan State
UniversityIrma Becerra-Fernandez, Florida
International UniversityFrank Calzonetti, University of ToledoRod Casto, University of South FloridaW. Mark Crowell, University of VirginiaKevin Cullen, The University of GlasgowCarolyn Dahl, University of Alabama
SystemRichard Dunfee, American Association
of State Colleges and UniversitiesHenry Durand, University at BuffaloDavid Earwicker, California State
UniversityKarl Engelbach, University of California,
DavisNancy Franklin, The Pennsylvania State
UniversityJonathan Gagliardi, National
Association of System HeadsDavid Gard, Indiana UniversityOzlem Garibay, University of Central
Florida Michael Georgiopoulos, College of
Engineering and Computer Science, University of Central Florida
Kent Glasscock, Kansas State UniversityBirgit Green, Texas Tech UniversityJacquelyn Gervay Hague, University of
California DavisTeresa Helmlinger Ratcliff, North
Carolina State UniversityLyla Houglum, Oregon State UniversityRod Howe, Cornell UniversityFrank Jackson, Prairie View A&M
UniversityIrma Johnson, Kentucky State
UniversityAnne Kaplan, Northern Illinois
UniversityPaul Lachapelle, Montana State
UniversityMarnie LaVigne, University at BuffaloGeoffrey Maruyama, University of
MinnesotaDean McCorkle, The Texas A&M
University SystemJerry McGuire, University of North
Carolina at GreensboroGene Merrell, University of IdahoStephen Mosier, University of North
Carolina at CharlotteMatthew Mroz, State University of New
York (SUNY) Research FoundationMehmet Öztürk, Arizona State
UniversityChristopher Reese, California State
University, Fullerton
Joshua L. Rosenbloom, University of Kansas
Josh Trapani, Association of American Universities
Charles Triplett, Oregon University System
Kathleen Tweeten, North Dakota State University
Sherryl Weems, University at BuffaloJames Zuiches, North Carolina State
University
Participants in the New Metrics PilotAndrea Anderson, South Texas
Technology Management, University of Texas
Cristi Carson, University of Southern Maine
Dennis Cebulski, University of Michigan
Nicole Colomb, Virginia Commonwealth University
Kathy Felts, University of Missouri-Columbia
Erin Flynn, Portland State UniversityLinda Freed, University of Wisconsin,
OshkoshDavid Gard, Indiana UniversityMichael Georgiopoulos, University of
Central FloridaMary Givens, Boise State UniversityFrank Jackson, Prairie View A&M
UniversityLaura Jenski, University of South
DakotaAnne Kaplan, Northern Illinois
UniversityCameron McCoy, University of
OklahomaGene Merrell, University of IdahoMatthew Mroz, State University of New
York, (SUNY) Research Foundation, for SUNY College of Environmental Sciences and Forestry, SUNY Fredonia College, and University of Buffalo
David Owen, Southern Illinois University-Carbondale
John Provo, Virginia TechChitra Rajan, Iowa State UniversityJames Rankin, University of ArkansasMartin Shields, Colorado State
UniversityThomas Skalak, University of VirginiaMartha Taylor, Auburn UniversityCaroline Whitacre, The Ohio State
UniversityRhea Williamson, Humboldt State
UniversityDavid Winwood, University of Alabama
at Birmingham, UAB Research Foundation
Access this publication online at www.aplu.org/EEF.

Contents
About APLU ii
About CICEP iii
University Contributions to the Economy: Toward a Taxonomy v
The CICEP Economic Engagement Framework vi
Which Tools? ix
Background 1
Selecting the Right Metrics 3
Metrics and Logic Models: From Inputs to Impacts 11
Getting Started 15
Adding Value with CICEP New Metrics and Other Measures 17
Conclusion 19
Appendix A. CICEP New Metrics Annotations 21
Appendix B. The North America Industry Classification System (NAICS) 25

ii APLU n Economic Engagement Framework
About APLU
The Association of Public and Land-grant Universities (APLU) is a research, policy, and advocacy organization representing 235 public research universities, land-grant institutions, state university systems, and affiliated organizations. Founded in 1887, APLU is North America’s oldest higher education association, with member institutions in all 50 states, the District of Columbia, four U.S. territories, Canada, and Mexico. Annually, APLU member campuses enroll 4.7 million undergraduates and 1.3 million graduate students, award 1.1 million degrees, employ 1.3 million faculty and staff, and conduct $41 billion in university-based research.
APLU’s membership includes 204 campuses and 25 university systems, including 75 U.S. land-grant institutions. The association’s membership includes 23 historically black colleges and universities (HBCUs), of which 21 are land-grant institutions (19 under the 1890 Morrill Act, 2 under the 1862 Morrill Act). In addition, APLU represents six related higher education organizations, including the American Indian Higher Education Consortium (AIHEC), which serves the interests of the nation’s 33 American Indian land-grant colleges.
In 1963, the American Association of Land-Grant Colleges and Universities merged with the
National Association of State Universities to form the National Association of State Universities and Land-Grant Colleges. On March 30, 2009, the association adopted the name Association of Public and Land-grant Universities or APLU (the name of each letter is pronounced).
Today, APLU is dedicated to advancing learning, discovery and engagement. The association provides a forum for the discussion and development of policies and programs affecting higher education and the public interest.
Learn more about APLU at www.aplu.org.
Founded in 1887, APLU is North America’s oldest higher education association, with member institutions in all 50 states, the District of Columbia, four U.S. territories, Canada, and Mexico.

Assessment Tools iii
About CICEP
APLU’s Commission on Innovation, Competitiveness, and Economic Prosperity (CICEP) was created to help leaders of APLU member universities—including presidents and chancellors, senior research officers, provosts, other officers and their staffs—plan, assess, and communicate their institutions’ work in local and regional economic development. CICEP’s Strategic Framework is built around four areas of work:
ECONOMIC ENGAGEMENT LEADERSHIP. CICEP leads APLU efforts to promote, facilitate, support, and communicate about university economic engagement.
NATIONAL RESOURCE. CICEP is a nationally recognized resource for sharing best practices in economic engagement among public research universities’ officers and their teams. Themes for best practices include leadership engagement, innovation, entrepreneurship, technology transfer, commercialization, education and talent development, and cultivation of place in regions. CICEP also coordinates development of new tools and resources for public research universities to better measure their activities and contributions to the local, state, regional, and national economy.
CONVENER OF PARTNERSHIPS. CICEP acts as a key convener and collaborator to develop strong connections and partnerships among leadership of APLU member universities and with external partners from industry, government, and other science, research, and economic development focused organizations.
COMMUNICATION STRATEGIES. In consultation with university leaders and staff members responsible for economic engagement efforts, CICEP develops communication strategies to bring greater clarity and visibility to university economic development work. Strategies emphasize deepening industry, government, and public commitment to our universities and their role in economic prosperity.
Note: In December 2018 CICEP and APLU’s
Council on Engagement and Outreach integrated
to form the Commission on Economic and
Community Engagement.
Learn more at www.aplu.org/EEF.
University Contributions University Contributions to the Economy
CICEP was created to help leaders of APLU member universities plan, assess, and communicate their institutions’ work in local and regional economic development. CICEP’s Strategic Framework is built around four areas of work.

iv APLU n Economic Engagement Framework

New Metrics Field Guide v
APLU’s Commission on Innovation, Competitiveness, and Economic Prosperity (CICEP) views university contributions to the economy across a spectrum of activity—from educating students and creating the talent necessary for the 21st century workforce to developing innovation ecosystems and entrepreneurship, to enhancing social, cultural and community development. University contributions across this spectrum are summarized in the diagram below as Talent, Innovation, and Place. Note the arrows in the diagram, meant to communicate our belief that working toward the areas of overlap leads to a higher scale of impact of university economic engagement activity.
CICEP is interested in developing a taxonomy to describe the array of university economic engagement efforts. The top-level categories for this taxonomy would be the three circles in the diagram. Four additional categories would be named for each of the areas of overlap (talent + innovation, innovation + place, place + talent, and talent + innovation + place). We hope to include a complete version of the taxonomy in a future version of this publication. Meanwhile, we welcome your ideas and input on this taxonomy.
Visit www.aplu.org/APLUtaxonomy to review drafts of the taxonomy as we develop it, and to provide input on the taxonomy through a brief web-based survey.
University Contributions to the Economy TOWARD A TAXONOMY
vi APLU n Economic Engagement Framework
The assessment tools make up one part of a wider set of tools that has been developed by CICEP. Some of these tools are available now and others are still under development. As the Commission disseminates these tools and receives feedback, we will continue to re-design and develop as appropriate.
Please be sure to visit the APLU Economic Engagement Framework web page at www.aplu.org/EEF to provide us your feedback on the assessment tools and the other Economic Engagement Framework tools.
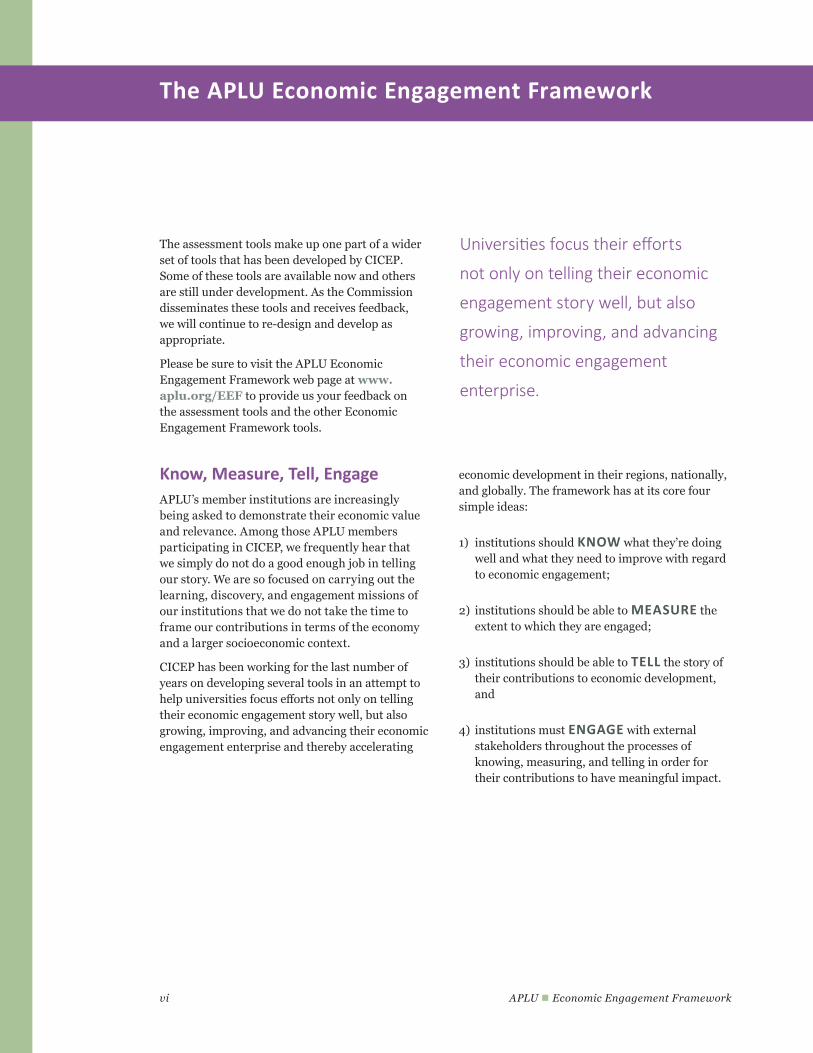
Know, Measure, Tell, EngageAPLU’s member institutions are increasingly being asked to demonstrate their economic value and relevance. Among those APLU members participating in CICEP, we frequently hear that we simply do not do a good enough job in telling our story. We are so focused on carrying out the learning, discovery, and engagement missions of our institutions that we do not take the time to frame our contributions in terms of the economy and a larger socioeconomic context.
CICEP has been working for the last number of years on developing several tools in an attempt to help universities focus efforts not only on telling their economic engagement story well, but also growing, improving, and advancing their economic engagement enterprise and thereby accelerating
The APLU Economic Engagement Framework
economic development in their regions, nationally, and globally. The framework has at its core four simple ideas:
1) institutions should KNOW what they’re doing well and what they need to improve with regard to economic engagement;
2) institutions should be able to MEASURE the extent to which they are engaged;
3) institutions should be able to TELL the story of their contributions to economic development, and
4) institutions must ENGAGE with external stakeholders throughout the processes of knowing, measuring, and telling in order for their contributions to have meaningful impact.
Universities focus their efforts
not only on telling their economic
engagement story well, but also
growing, improving, and advancing
their economic engagement
enterprise.

Assessment Tools vii
The suite of tools in the CICEP Economic Engagement framework helps each of these aspects—Know, Measure, Tell, and Engage. Examples:
n The Assessment Tools (www.aplu.org/APLUAssessmentTools), for example, help leaders understand (KNOW) their university’s strengths across a set of about 40 characteristics of economically engaged universities, and where improvements can be made. University leaders can build on this knowledge by setting priorities and planning further engagement.
n The CICEP New Metrics Field Guide (www.aplu.org/APLUNewMetrics) can help leaders identify the right measures and indicators to gauge the success of their economic engagement (MEASURE) and also helps them communicate (TELL) their story.
More information about each of the tools, and where they fit in the framework, is included below.
KNOW
TELL MEASURE
ENGAGE
Strategic Communications Toolkit
Economic Impact Guidelines
New Metrics Field Guide
Economic Engagement Assessment Tools
Innovation and Economic Prosperity Universities

viii APLU n Economic Engagement Framework
n As mentioned above, the Economic Engagement Assessment Tools (www.aplu.org/APLUAssessmentTools), comprising about 40 characteristics, help universities assess their own performance, and also provide opportunities for external stakeholders to provide input, regarding the university’s economic engagement.
n The CICEP New Metrics Field Guide (www.aplu.org/APLUNewMetrics) helps economic engagement leaders identify the right measures and indicators to use in evaluating the success of their economic engagement.
n The Economic Impact Guidelines (www.aplu.org/APLUImpactGuide) offer ideas about the best approach to assessing the economic impact of universities, with an emphasis on the use of input-output models, and can be employed in conjunction with a discussion on broader impacts.
n The Strategic Communications Toolkit provides resources to help economic engagement leaders work with university strategic
communications, community relations, and government relations offices to shape messages about the university’s contributions to the economy, and to deliver those messages to key audiences.
n APLU’s new Innovation and Economic Prosperity Universities designation and awards program (www.aplu.org/IEP) has become the primary dissemination mechanism for the APLU Economic Engagement Framework, and participation in the program is in itself a tool that universities can use in knowing, measuring, telling, and engaging. Participating universities can make use of other tools as part of an economic engagement self-study, and also demonstrate engagement with external stakeholders on key issues.
All these tools help universities understand the institution’s accomplishments in economic engagement, identify areas for improvement, and communicate it effectively with various stakeholders.
We encourage you to visit the APLU website (www.aplu.org/EEF) and explore the tools in the framework more closely.

New Metrics Field Guide ix
Which Tools?
The tools included in the CICEP Economic Engagement Framework work well when used together as part of a larger set of university efforts to define, plan, assess, and communicate about economic engagement efforts. They also work well as stand-alone tools to help you focus on a specific goal. Here are some scenarios that might sound like your institution, and recommended tools.
Our university is still figuring out what we mean by “economic engagement,” and trying to get a handle on all of the things that we do with regard to contributing to regional and national economic development.
n ECONOMIC ENGAGEMENT ASSESSMENT TOOLS. Use the self-study tool to engage people from across the campus who are involved in economic engagement; use the categories in the tool and responses on the “performance” scale to guide decisions about priority focus areas.
n NEW METRICS FIELD GUIDE. Use the field guide to find measures and metrics that might align with the kinds of contributions your institution is making or would like to make. Begin conversations among the appropriate departments on campus about what data are already available for the measures of interest, and what will be required to begin and maintain data collection where necessary.
n INNOVATION AND ECONOMIC PROSPERITY UNIVERSITIES DESIGNATION PROGRAM. We have found that institutions benefit from a structured program that requires a self-study on economic engagement to catalyze interest on campus. Participation in the IEP Universities designation program can be such a catalyst.
We have a pretty well defined economic engagement enterprise—we know what we’re doing but we want to get a better handle on how well we’re doing it, and we want to set some goals for improvement.
n NEW METRICS FIELD GUIDE. Use the field guide to find measures and metrics that might align with the kinds of contributions your institution is making. Prioritize campus efforts to collect data on these measures. Set goals for improving institutional measures.
n ECONOMIC IMPACT GUIDELINES. Perhaps your institution is planning to undertake an economic impact study, and the Economic Impact Guidelines provide expert help for such an undertaking. Even if you’re not planning to undertake a study, however, the Guidelines can help your institution identify the kinds of impact the university is having, and consider ways to best measure these impacts.
n INNOVATION AND ECONOMIC PROSPERITY UNIVERSITIES DESIGNATION PROGRAM. Again, the structured IEP Universities designation program requiring a self-study on economic engagement can help focus institutional efforts on identifying areas of impact and considering appropriate measures.
Our university needs to better understand what our external stakeholders are looking for from us with regard to economic engagement, what they think we’re doing well, and what priorities we should establish moving forward.
n ECONOMIC ENGAGEMENT ASSESSMENT TOOLS. Use the stakeholder input tool to find out what your external stakeholders think about your institution’s economic engagement efforts. Find out what your external stakeholders think the university is doing well, and also what they think should be the main priorities.
n INNOVATION AND ECONOMIC PROSPERITY UNIVERSITIES DESIGNATION PROGRAM. The IEP Universities designation program requires stakeholder engagement as part of the application preparation process. Use this program as an opportunity to plan and implement some focused stakeholder engagement around these issues.

x APLU n Economic Engagement Framework
We simply need to better communicate what our university is doing and the contributions we are making.
n ECONOMIC IMPACT GUIDELINES. The Economic Impact Guidelines provide a variety of ideas about how best to tell your university’s economic engagement story. It focuses on how you define and communicate about impact—whether through a traditional input/output economic impact study, or a variety of other ways to highlight impact.
n STRATEGIC COMMUNICATIONS TOOLKIT. The Strategic Communications Toolkit will give you ideas about how your
university can tell its story. The Toolkit includes examples from other universities as well as suggestions for developing messages.
n INNOVATION AND ECONOMIC PROSPERITY UNIVERSITIES AWARDS PROGRAM. If your institution has already garnered the IEP University designation, you qualify to participate in the awards program of the same name. Developing your award application will encourage you to refine some of your institution’s success stories, and if you win an award you will have another success to talk about!

New Metrics Field Guide 1
Background
If you are reading this field guide, chances are that you are struggling to find the right metrics to tell your story of economic engagement. While traditional metrics on patent and research expenditures, metrics on student completion rates, and conventional university economic impact reports have taken you to a certain point, you are still unable to fully address some of the new dynamics of university economic engagement. This field guide can help you take some simple steps to reinforce your university’s impact story. Furthermore, when used in conjunction with the full suite of tools in the APLU Economic Engagement Framework (www.aplu.org/EEF), the CICEP New Metrics Field Guide will help strengthen economic engagement communications, strategic planning, and performance reporting at your university.
Efforts to identify metrics that measure university contributions to regional and national economic growth have received considerable attention in recent years. One of the most recent of these is the New Metrics initiative undertaken by the Commission on Innovation, Competitiveness and Economic Prosperity (CICEP), one of seven commissions affiliated with the Association of Public and Land-grant Universities (APLU). CICEP was formed as a successor to APLU’s Commission on Technology Transfer (COTT). COTT recognized that while technology transfer and commercialization of university intellectual property are important economic functions of a modern university, there are many other university activities that contribute to the local, regional, national, and global economy. This broadened the scope from technology transfer to innovation, competiveness, and economic prosperity.
Almost immediately upon formation, CICEP began a project to identify ways to measure this broader set of economic engagement activities. Over a four-year period, 75 individuals representing 54 institutions were involved as working group members or as sites piloting the metrics (see the Acknowledgements at the beginning of this Field Guide for a list of these participants). Funding to help support the national dialogue, which included a series of workshops and focus group discussions, was provided by the National Science Foundation’s (NSF’s) National Center for Science and Engineering Statistics (NCSES). Additional support was provided by the U.S. Department of Commerce, through three of its agencies: the Economic Development Administration (EDA), the National Institute for Standards and Technology (NIST), and the U.S. Patent and Trademark Office (USPTO). Other important national partners included the National Academy of Sciences and the National Governors Association.
Details of the process used to identify the APLU New Metrics are available in reports posted on the APLU website (www.aplu.org/APLUNewMetrics). In brief, the first phase of

2 APLU n Economic Engagement Framework
this effort occurred between 2009 and 2011 when the CICEP Metrics Working Group discussed the range of possible economic engagement measures. Twice during this period the draft metrics were vetted by regional and national stakeholders and, by the end of 2011, 56 indicators were identified. A second phase began in early 2012 to narrow the list, which involved 23 volunteer institutions in collecting data and holding regional stakeholder meetings to better understand which of the 56 metrics external partners considered most useful. Following focus group discussions conducted in October 2012, a final set of 20 CICEP New Metrics was selected as the most valuable and feasible to collect. Work since then has largely focused on crafting this field guide to help universities understand and use metrics, including the 20 priority CICEP New Metrics and selected sets of supporting metrics. Overall, the goal of this field guide is to increase understanding of the resources available to universities in measuring their regional economic contributions.
This field guide is not intended to be an exhaustive compendium of all possible measurements of university economic engagement. As new data sources and innovative ways of using them emerge, so do new opportunities to tell a richer and more nuanced story of how institutions enrich and help transform their regions. For example, the APLU Council on Engagement and Outreach continues its work on identifying measures to evaluate university engagement in areas such as youth and family programs, community development and assistance, student volunteer programs, and other hard-to-quantify engagement activities. Other approaches take an even broader view, such as the Democracy Collaborative’s Anchor Dashboard (community-wealth.org/indicators) that identifies health, safety, and environment measures in addition to community-building and economic development ones. It is likely that a metrics framework with specific measures has already been developed to assist in telling any story your institution wishes to share with stakeholders.
It is likely that a metrics framework
with specific measures has already
been developed to assist in telling
any story your institution wishes to
share with stakeholders.
New Metrics Field Guide 3
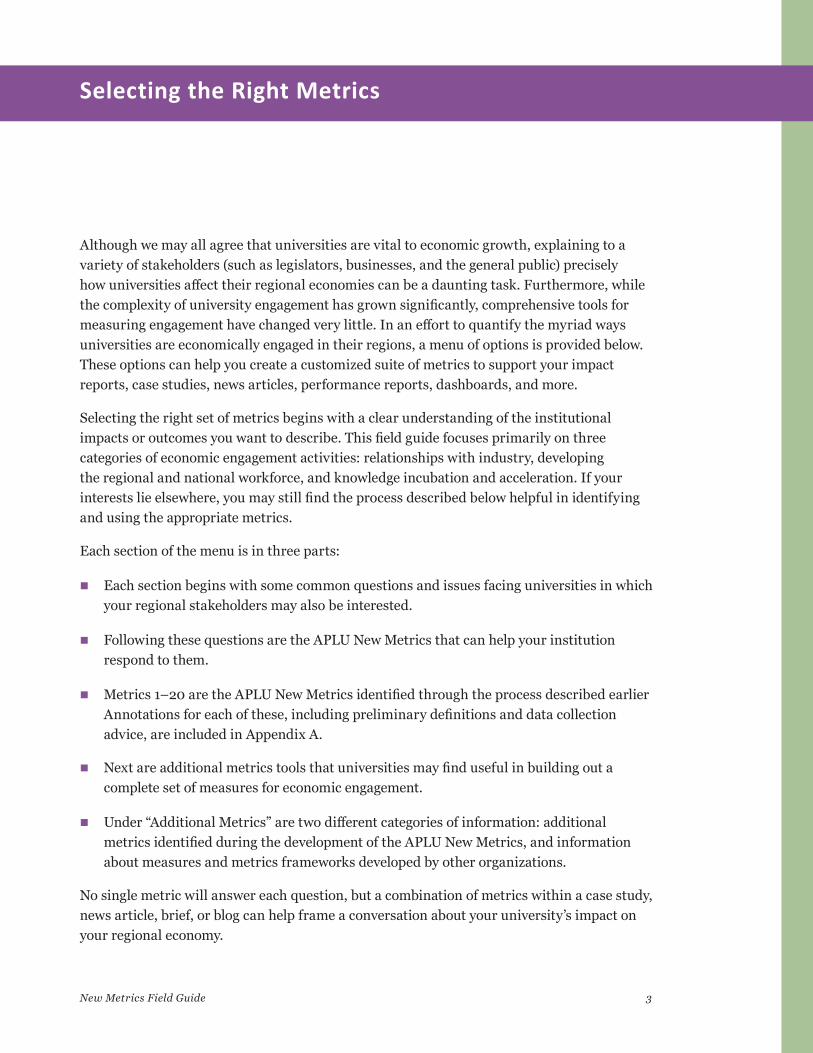
Although we may all agree that universities are vital to economic growth, explaining to a variety of stakeholders (such as legislators, businesses, and the general public) precisely how universities affect their regional economies can be a daunting task. Furthermore, while the complexity of university engagement has grown significantly, comprehensive tools for measuring engagement have changed very little. In an effort to quantify the myriad ways universities are economically engaged in their regions, a menu of options is provided below. These options can help you create a customized suite of metrics to support your impact reports, case studies, news articles, performance reports, dashboards, and more.
Selecting the right set of metrics begins with a clear understanding of the institutional impacts or outcomes you want to describe. This field guide focuses primarily on three categories of economic engagement activities: relationships with industry, developing the regional and national workforce, and knowledge incubation and acceleration. If your interests lie elsewhere, you may still find the process described below helpful in identifying and using the appropriate metrics.
Each section of the menu is in three parts:
n Each section begins with some common questions and issues facing universities in which your regional stakeholders may also be interested.
n Following these questions are the APLU New Metrics that can help your institution respond to them.
n Metrics 1–20 are the APLU New Metrics identified through the process described earlier Annotations for each of these, including preliminary definitions and data collection advice, are included in Appendix A.
n Next are additional metrics tools that universities may find useful in building out a complete set of measures for economic engagement.
n Under “Additional Metrics” are two different categories of information: additional metrics identified during the development of the APLU New Metrics, and information about measures and metrics frameworks developed by other organizations.
No single metric will answer each question, but a combination of metrics within a case study, news article, brief, or blog can help frame a conversation about your university’s impact on your regional economy.
Selecting the Right Metrics
4 APLU n Economic Engagement Framework
A. Relationships with Industry Measuring university engagement and alignment with industry through research and service to external clients
Below are questions representative of stakeholder interests regarding how universities are aligning their research and programming to assist business and industry. Following the questions are the CICEP New Metrics which can help quantify and reinforce the economic engagement activities of university-industry relationships.
A1: Questions
Q. Does your institution have a diverse research-funding portfolio?
Q. How is your university’s research aligning with the needs of X industry?
Q. Do companies in your region find value in a relationship with your university?
Q. How is your institution serving the needs of the industries in your region?
Q. How is your university increasing knowledge transfer in your region?
Q. How does your university support development of an innovation economy or ecosystem?
A2: CICEP New Metrics
Sponsored Research by Industry
1. Number of grants, contracts and sub-agreements from private sector entities
2. Dollar value of industry-sponsored research expenditures
3. Number of sponsored research projects by industry sector1
4. Dollar value of sponsored research expenditures by industry sector
5. Number of individual private sector entities funding research grants and contracts
Human Clinical Trials (for universities with medical, nursing, and/or pharmacy programs)
6. Number of active trials, by phase, during the reporting period
7. Number of subjects enrolled in clinical trials over the past 12 months
8. Total dollar value of sponsored research grants for which clinical trials were conducted
9. Number of protocols approved during the time period
10. Number of trials initiated during the time period
1 Appendix B includes information and recommendations to identify industry sectors using the North American Industry Classification System (NAICS).

Assessment Tools 5
Service to External Clients
11. Number of organizations served
12. Number of companies that provided on-site technical services
A3. Additional Metrics
ADDITIONAL METRICS IDENTIFIED BY CICEP
Sponsored Research by Industry
n Number of industry consortia agreements
n Number of participating private sector entities in university industry consortia
n Research expenditures by consortia members at the university
Service to External Clients
n Dollar value of contracts received by institution by type of sponsoring organization
n Number of facility use agreements
n Number of testing agreements
FRAMEWORKS BY OTHER ORGANIZATIONS
Network theory is being used to help us understand the value of university relationships with industry. Jason Owen Smith is among the leading network theory scholars and is investigating how it relates to the development of innovation systems. Those interested in other ways of thinking about university-industry relationships may find his work useful (www-personal.umich.edu/~jdos/research.html), particularly the U.S. Knowledge Economy project and the Networks, Innovation, Space, and Organizations project.
B. Developing the Regional and National Workforce Measuring university student employment from research, student participation in entrepreneurship, and alumni impact
Below are questions representative of stakeholder interests regarding how universities are aligning their education and entrepreneurial programming to support workforce development. Following the questions are the CICEP New Metrics that can help quantify and reinforce the economic engagement activities of workforce development.

6 APLU n Economic Engagement Framework
B1. Questions
Q. Does your institution provide industry-relevant educational opportunities and programs?
Q. How is your institution helping to prepare undergraduate students to enter the workforce?
Q. Is your institution creating an environment where students engage in entrepreneurial activities? How?
Q. Do your educational programs fit your region’s workforce needs?
Q. Are students involved in research projects? How?
B2. CICEP New Metrics
Student Employment on Funded Projects
13. Number of students paid through externally funded grants or contracts
Student Entrepreneurship
14. Number of entrepreneurship courses/programs (credit and non-credit)
15. Number entrepreneurship courses/programs requiring a capstone project
16. Number of student start-ups associated with courses, programs, competitions, clubs, university incubators, or other university-affiliated organizations
Alumni in the Workforce
17. Average wages of alumni living in-state
B3. Additional Metrics
ADDITIONAL METRICS IDENTIFIED BY CICEP
Student Employment on Funded Projects
n Total dollars paid to students
Student Entrepreneurship and Employment
n Number of individual student entrepreneurship-related competitions

Assessment Tools 7
n Number of students participating in competitions and related activities
Alumni in the Workforce
n Number of alumni living in state
n Average wages of alumni living in-state by industry sector
FRAMEWORKS BY OTHER ORGANIZATIONS
Student Employment on Funded Projects
n STAR METRICS (Science and Technology for America’s Reinvestment Measuring the Effect of Research Innovation, Competitiveness and Science) www.starmetrics.nih.gov
Other Student Employment and Student Entrepreneurship
n Number of individual student entrepreneurship-related competitions
n Number of students participating in competitions and related activities
n Number of students participating in internships, co-ops, externships, and other work-based learning experiences (by type of activity regardless of academic credit earned)
n Number of employers sponsoring/hosting students, by industry type
Alumni in the Workforce
n The Western Interstate Commission for Higher Education’s (WICHE’s) Multistate Longitudinal Data Exchange tracks data in a four-state region (Washington, Oregon, Idaho, and Hawaii) on the performance of high school graduates in postsecondary education and/or the workforce (www.wiche.edu/longitudinalDataExchange).
n The Gallup-Purdue Index (http://thegallupblog.gallup.com/2013_12_01_archive.html) attempts to measure employment outcomes largely in terms of quality of life. See APLU President Peter McPherson’s statement on the Gallup Purdue index here:
8 APLU n Economic Engagement Framework
www.aplu.org/page.aspx?pid=2850.
C. Knowledge Incubation and Acceleration Programs Measuring university contributions through support of innovation and technology development
Below are questions representative of stakeholder interests in how universities are aligning their research and programming to assist in technology transfer. Following the questions are the CICEP New Metrics which can help quantify and reinforce the economic engagement activities of commercialization.
C1. Questions
Q. Is your institution supporting technology transfer? How?
Q. How does your university support the creation of new companies?
Q. How does your university support the creation of new jobs?
Q. How does your university help increase investment in new companies?
C2. CICEP New Metrics
Incubation and Acceleration Program Success
18. Number of full time equivalent employees
Ability to Attract External Investment
19. Dollar amount of (equity) capital raised by clients and graduates from investors
20. Dollar amount of funding received from federal, state, or foundation sources; state or local matching programs; or other non-private sources
C3. Additional Metrics
ADDITIONAL METRICS IDENTIFIED BY CICEP
Incubation and Acceleration Program Success
n Rate of companies that are active after graduation (ratio of graduates still active over total number of graduates)
Ability to Attract External Investment

Assessment Tools 9
n Number of SBIR/STTR grants where the university is a partner
FRAMEWORKS BY OTHER ORGANIZATIONS In addition to the CICEP-identified metrics regarding knowledge incubation and acceleration, there are a number of resources that cover a wide variety of technology transfer activities and their contributions to the regional economy.
n AUTM STATT (Association of University Technology Managers, Statistics Access for Tech Transfer) is a self-reported, searchable, and exportable database of 20 years of academic licensing. Must be a participant of the licensing survey, a member of AUTM with a subscription to STATT, or a STATT subscriber to access this database (www.autm.net/source/STATT/index.cfm?section=STATT).
n Europe’s UNICO (http://ec.europa.eu/invest-in-research/pdf/download_en/library_house_2008_unico.pdf).
n RIAN (Regional Innovation Acceleration Network) Metrics That Matter—although these metrics and tools are intended for venture development organizations to measure their impact, they can be adapted to measure university impact in technology transfer and company creation (http://regionalinnovation.org/content.cfm?article=metrics-that-matter).
n Science and Technology Policy Institute (STPI) Innovation Framework—Measuring Innovation and Intangibles: A Business Perspective (http://scienceofsciencepolicy.net/publication/frameworks-measuring-innovation-initial-approaches-rose-shipp-stone).
n Commercialization Research on Innovation and Entrepreneurship (CRIE) Patent Data Repository—Organizes data for academics who need access to patent data; available at no cost to anyone with an ‘.edu’ email address (http://crie.org/web/crie/patent-data/).
More Helpful Resources
Complementary to all the metrics listed above, more tools are available for measuring economic engagement. Below are selected resources universities may adapt to use in their economic engagement messaging.
n The Triple Bottom Line Tool was developed by a team of researchers led by Dr. Janet Hammer from Portland State University and measures economic, societal, and environmental impacts (www.tbltool.org).

10 APLU n Economic Engagement Framework
n University of Northern Carolina at Chapel Hill professor Maryann Feldman has developed an online resource titled “Innovative Data Sources for Economic Analysis” which provides access to a variety of metrics (http://maryannfeldman.web.unc.edu/data-sources/).
n Student Achievement Measure (SAM) includes self-reported aggregate data on student progress to completion including transfer students and percentages of students still working toward a degree (www.studentachievementmeasure.org).
nOne of two criteria used by the National Science Foundation in the merit review of proposals addresses the broader impacts of the proposed activity. Examples provided by the NSF include:
o “Advance discovery and understanding while promoting teaching, training, and learning, for example, by training graduate students, mentoring postdoctoral researchers and junior faculty, involving undergraduates in research experiences, and participating in the recruitment, training, and professional development of K–12 mathematics and science teachers.
o Broaden participation of under-represented groups, for example, by establishing collaborations with students and faculty from institutions and organizations serving women, minorities, and other groups under-represented in the mathematical sciences.
o Enhance infrastructure for research and education, for example, by establishing collaborations with researchers in industry and government laboratories, developing partnerships with international academic institutions and organizations, and building networks of U.S. colleges and universities.
o Broaden dissemination to enhance scientific and technological understanding, for example, by presenting results of research and education projects in formats useful to students, scientists and engineers, members of Congress, teachers, and the general public.
o Benefits to society may occur, for example, when results of research and education projects are applied to other fields of science and technology to create startup companies, to improve commercial technology, to inform public policy, and to enhance national security” (www.nsf.gov/pubs/2007/nsf07046/nsf07046.jsp).

New Metrics Field Guide 11
n A plethora of data can be found on the United State Census Bureau website to provide regional context to data collected at your university (www.census.gov).
n The National Association of Development Organizations (NADO) Performance Metrics Matter publication outlines tools to create a Comprehensive Economic Development Strategy to increase economic impact (www.nado.org/performance-metrics-matter/).
n In October 2013, the Research Metrics Working Group of the U.S. Research Universities Futures Consortium published a report on research metrics (www.researchuniversitiesfutures.org/us-research-metrics-working-group-current-state-and-recommendations-oct2013.pdf). The report discusses the value and attributes of useful research metrics and describes a number of current research metrics initiatives.
n Research Excellence Framework 2014 provides a rubric to assess the quality of research at higher education institutions in the United Kingdom (www.ref.ac.uk).
n Excellence in Research for Australia (ERA) evaluates the quality of research at institutions of higher education in Australia in national benchmarking www.arc.gov.au/era/).

12 APLU n Economic Engagement Framework
Resources/ Impacts Activities Outputs Outcomes Impact
1 2 4
Your Planned Work Your Intended Results
Source: W.K. Kellogg Foundation (2004). Logic Model Development Guide: Using Logic Models to Bring Together Planning, Evaluation, and Action, p. 1.
Metrics have considerable descriptive power as stand-alone measures of institutional performance. However, by clarifying the relationships among the resources and activities used to support an institution’s economic engagement work and the expected results, universities are able to tell a more complete story about their contributions and value proposition to both internal and external stakeholders. Logic models are useful tools for doing this.
A basic logic model is illustrated in Figure 1. While logic models are often used for program evaluation purposes, they are easily adapted to explaining processes such as university economic engagement. The W.K. Kellogg Foundation describes five components that describe the connections between an institution’s planned work and the intended results. They are:
INPUTS: the human, financial, and organizational resources available for economic engagement.
ACTIVITIES: the processes, tools, technology, and actions used to bring about the intended results.
OUTPUTS: the direct products of engagement activities.
OUTCOMES: the changes that result from economic engagement over the short (one to three years) and long-term.
IMPACT: the fundamental changes occurring in organizations, communities, or systems as a result of the institution’s economic engagement activities.
Metrics and Logic Models: From Inputs to Impacts
Figure 1. The Basic Logic Model

Assessment Tools 13
Logic models are used in program evaluation because they describe a causal relationship: if a defined set of resources is used to support a prescribed set of activities, then one or more specific results will occur. This same equation can frame a university’s story of economic engagement in a way that is clear and accountable and reveals the “if-then” equation underlying an institution’s approach. The University of Wisconsin-Extension uses logic models to help clarify institutional goals, identify gaps in logic or knowledge, and track progress. They have extensive online resources available at www.uwex.edu/ces/pdande/evaluation/evallogicmodel.html.
Another logic model was developed by economists at Arizona State University (ASU) and informed the early work on the CICEP New Metrics. This model (Figure 2) identifies three types of economic effects that universities have on their local communities: the money that flows directly from institutions, employees, students, and parents into local economies; the individual and societal benefits associated with educational attainment; and the research and product development resulting from the knowledge and discovery process. Taken together, these three effects boost the host community’s aggregate income, enhance prosperity and quality of life, and foster job and business creation.2 CICEP is working with the Association of American Universities and the U.S. Bureau of Economic Analysis to develop guidelines for accurately conducting and using university economic impact studies (www.aplu.org/CICEPImpactGuide).
2 Hoffman, D. & Hill, K. (2009). The Contribution of Universities to Regional Economies. Tempe, AZ: Arizona State University. http://wpcarey.asu.edu/sites/default/files/uploads/center-competitiveness-and-prosperity-research/contributionuniv5-09.pdf
This model (Figure 2) identifies
three types of economic effects
that universities have on their local
communities.

14 APLU n Economic Engagement Framework
Figure 2. The Effects of Universities on Local Communities
Source: Hoffman and Hill, 2009, p. 2.
Employee Wage and Salaries
Institutional Expenditures on
Goods and Services
Expenditures by Students and Parents
Multiplier Effects
Enhanced Educational Attainment
Aggregate Income
Prosperity and Quality of Life
Quality Job and Business CreationKnowledge
and Discovery
Individual Income Enhancements
Spillovers to Other Workers
Non-Monetary Societal Benefits
Research Dollars
Innovation Technology and Product
Development
A
Direct Impact Knowledge Creation
Ultimate Outcomes
B
C
D
Benefits to Individuals and Society
A
B
C
D

Assessment Tools 15
Over the course of the CICEP New Metrics project, it has been noted that some of these metrics do not actually represent the long-term impacts or outcomes of university activities, but rather outputs, the direct products of program activities. Both outputs and outcomes have a role in accountability measurement and performance reporting; the key is to place them in a larger context. Figure 3 illustrates how this may be done. This logic model focuses more narrowly on the university knowledge transfer process. Research products are part of the inputs to this logic model, which uses knowledge transfer activities (outputs) to convert them into short- to medium-term economic activity (outcomes) and longer-term economic impact.
Figure 3. Logic Model of University Knowledge Transfer
Networks
Consultancy
CPD
Collaborative Research
Contract Research
Licensing
Spin-Out Formation
Teaching
Society Govt
Policy- makers
Source: University of Glasgow. In Holi, M., Wickramasinghe, R., van Leeuwen, M. (2008). Metrics for the Evaluation of Knowledge Transfer Activities at Universities. Cambridge: Library House.
Research Outputs
Research
NewKnowledge
Researchers
Knowledge
Knowledge
Other Factors
Other Factors
Income
TransferKnowledgeTransferActivites
EconomicActivity
EconomicImpact
Publications
Processes
Materials
Technology
Know-how
Innovation
Skills
Spin-outs
SMEs
Commercial Companies
Non-Comm. Companies
n Jobs
n New Products
nNew Services
n Turnover/ Revenue
n Profit
n R&D Expenditure
n % Turnover from New Products/ Services
While logic models are conceptually straightforward, they may require considerable discussion among stakeholders to clarify the causal relationships and value proposition. This conversation in itself can be helpful in raising awareness of economic engagement activities, aligning institutional goals and priorities, and shaping communication strategies and message points.

16 APLU n Economic Engagement Framework
Now that you know where to find metrics and how to organize them in a larger framework aimed at impact, there are five steps to implementing CICEP New Metrics or other measures found in this Field Guide: plan, collect, contextualize, communicate, and assess.
1. PLAN—Leadership at the president, chancellor, or provost level is essential in planning and implementing the APLU New Metrics (Part A of the APLU Assessment Tools— www.aplu.org/APLUAssessmentTools—can help gauge the perception of leadership). Effective planning requires engaging key internal and strategically selected external stakeholders in collecting, analyzing, and communicating information about the metrics. An important consideration will be the level of human and financial resources needed to collect the needed information for your desired result.
2. COLLECT—Data collection will likely be required from several areas of the university, so take the time to look at what your university is already collecting and where this data resides at your university. Each university will need to decide how to collect the most complete and accurate data possible while minimizing the burden on personnel. Data collection methods may include in-person interviews, mail-in responses, online survey tools, or other approaches.
3. CONTEXTUALIZE—After the CICEP New Metrics and complementary metrics have been collected, data must be contextualized for the messages you want to highlight. CICEP staff and members of CICEP’s leadership committees can provide guidance and examples of implementation by other universities. As a first step, it is recommended that you engage your campus communications team to collaborate on integrating CICEP New Metrics and other measures into news releases and marketing material.
4. COMMUNICATE—Audiences for the CICEP New Metrics and other measures may include local, state, and federal officials and elected representatives, business leaders, industry associations, chambers of commerce, community organizations, prospective students and parents, alumni, and the media. Each institution’s office of communication, news service, institutional research department, and other external affairs departments can help tailor the message to each audience. The CICEP Strategic Communications tools can help institutions with messaging, and participating in CICEP’s Innovation and Economic Prosperity Universities designation and awards program (www.aplu.org/IEP) can help institutions advertise and be recognized for their accomplishments.
Getting Started

Assessment Tools 17
5. ASSESS—Each institution should regularly assess the value of using metrics to communicate university economic contributions internally and externally. Using the APLU Assessment Tools (www.aplu.org/APLUAssessmentTools) consistently over time is an effective mechanism to gauge the effect of your metrics and communications efforts on your stakeholders.
There are five steps to implementing
CICEP New Metrics: plan, collect,
contextualize, communicate, and
assess..

18 APLU n Economic Engagement Framework
The CICEP New Metrics and other measures found in this Field Guide help universities communicate their understanding of, and contributions to, regional economic needs through knowledge and research expertise, workforce development, and innovation. There are four
important ways in which this can happen:
1. RAISING INSTITUTIONAL AWARENESS—Whether on campus or at the state capital, stakeholders want stories that portray the university as a unique contributor to the regional economy. Case studies and narratives illustrating university impact are powerful and even more compelling when supported by data. The CICEP New Metrics and other measures help raise institutional awareness when used in the following ways:
nDeveloping case studies and narratives that complement the CICEP New Metrics and other measures for publicity and promotion of the economic impact of the university.
n Holding internal forums across campus to gather input and support for the CICEP New Metrics and to identify other potential measures that communicate an institution’s profile and goals.
n Developing a university “economic engagement index” or dashboard that includes the data collected on the CICEP New Metrics and other relevant measures, updating the index annually, and sharing it with interested stakeholders.
2. ENGAGING STAKEHOLDERS—The CICEP New Metrics are an excellent tool upon which to base workshops and roundtable conversations. Bringing together university staff and faculty with external stakeholders strengthens collaboration for research, workforce development, technology transfer, and other partnership efforts. It also helps the university achieve such goals as:
n Gaining external perspectives on university engagement from diverse groups of regional stakeholders (e.g., legislators, industry leaders, business associations, chambers of commerce, alumni, etc.) using the CICEP New Metrics, or other measures, as a topic of conversation.
n Identifying activities that are important to stakeholders but not currently measured by the university with respect to economic impact, and exploring ways to measure and document these activities.
Adding Value with CICEP New Metrics and Other Measures
Assessment Tools 19
Adding Value with CICEP New Metrics and Other Measures 3. ALIGNING INSTITUTIONAL GOALS AND PRIORITIES—Stakeholder input can be used to inform universities about financial and human capital investments. This can occur by:
n Establishing a baseline for the CICEP New Metrics or other measures that can be used both for assessment and planning to help describe the role of the institution in the regional economy to external stakeholders.
n Creating a logic model for assessing the value of the university’s economic impact and innovation activities and exploring the return on invested time and resources.
n Collaborating with other higher education institutions in your region to prepare a report with aggregated impact data using the CICEP New Metrics and other measures and presenting it to regional stakeholders.
n Benchmarking with other peer institutions to share ideas about collecting and using the CICEP New Metrics and other measures. Creating a community of practice enables participating institutions to share and learn from one another in a context of candor and confidentiality.
4. DEVELOPING COMMUNICATIONS TOOLS—Go beyond traditional university communications by:
n Meeting with the university public affairs office to discuss how the CICEP New Metrics and other measures can be publicized as an important initiative.
n Visualizing the data:
o Mapping university services and assets throughout the region. Example: www.umsystem.edu/about-us
o Incorporating graphs and charts to create accessible visualizations for a wide variety of audiences. Many Eyes (www-958.ibm.com/software/analytics/manyeyes/) and visual.ly (http://visual.ly) are helpful resources for thinking about how to visualize your data.
n Writing a story for the APLU Public Universities Advance America website www.universityimpact.org. CICEP staff and participating institutions can provide useful information about writing and publishing a story on this site.
n Staying informed and engaged with other universities. CICEP has established social media to connect peers across institutions. These include:
o Twitter: @APLUEngagement
o www.linkedin.com/groups/APLU-Innovation-4344464?trk=myg_ugrp_ovr
20 APLU n Economic Engagement Framework
Postsecondary institutions are doing much to serve their students and communities in ways that promote social and economic growth. Our colleges and universities are playing an increasingly pivotal role in maintaining national competitiveness in a ‘knowledge economy,’ a phrase that eloquently illustrates the convergence of social and economic capital in the 21st century. However, shifts create tensions, and this particular case is no different.
It’s plainly visible that the expectations of society have grown and pivoted to reflect contemporary demands. There are myriad factors, including intensified global competitiveness, uncertainty resulting from a prolonged and severe economic recession, changes in expectations of postsecondary education around greater inclusivity, and the proliferation of data and access to it, that have contributed to a growing desire for greater accountability, transparency, and effectiveness among our postsecondary institutions.
These expectations carry with them opportunities and challenges. Therefore the intent of this Field Guide is to expand universities’ thinking about how metrics can help tell the story of institutional economic engagement, raise awareness about these activities among internal and external stakeholders, and help align institutional goals and priorities for greater impact. This guide has only scratched the surface of the frameworks, approaches, and tools that universities are using to integrate metrics into their planning, communication, and engagement activities.
To help navigate this landscape, institutions must increase their capacity to translate data into knowledge that can be used to spark action and demonstrate impact. CICEP is committed to continuing and expanding this conversation and invites you to add your experiences and ideas. Please visit the APLU New Metrics web page (www.aplu.org/cicepnewmetrics) for the latest developments and for more information about how you can share your suggestions and questions.
Conclusion

Assessment Tools 21

22 APLU n Economic Engagement Framework
The definitions included here represent suggestions from various stakeholders who developed, implemented, or reviewed the 20 metrics that emerged from the work of the CICEP Metrics Working Group. They have been included in this version of the metrics guide to help institutions develop definitions and data collection procedures that work best for them. CICEP is interested in collecting information from institutions that have adopted or adapted these metrics in measuring their performance. We are particularly interested in understanding the ways in which you adapt these definitions locally. Please visit the APLU New Metrics web page (www.aplu.org/APLUNewMetrics) for more information about how you can share your experiences.
A. Relationships with Industry
Sponsored Research by Industry
1. Number of grants, contracts and sub-agreements (including federal pass-through dollars) from private sector entities (including consortia, trade associations, etc.)
DEFINITION: The total number of funding agreements from private or industry sources. This does not include federal or state funding sources. Federal pass-through funds are awards made to an institution from a private sector entity that is funded, in total or in part, by federal agencies.
2. Dollar value of sponsored research expenditures by private sector entities (including consortia, trade associations, etc.)
DEFINITION: Total dollar amount of all funding agreements received from private sector sponsors. The private sector includes the personal sector (households) and corporate sector (companies) that are separate from state or federal government.
3. Number of sponsored research projects by industry sector (include source/explanation of industry sectors used by institution)
DEFINITION: The total number of direct funding agreements from private or industry sources by industry sector. Sector should be identified using the North American Industry Classification System (NAICS). (See Appendix B for more information on using NAICS codes in the CICEP New Metrics context.) This does not include federal or state funding sources. Federal pass-through funds are awards made to an institution from a private sector entity that are funded, in total or in part, by federal agencies and should not be included in this count.
APPENDIX A. CICEP New Metrics Annotations

Assessment Tools 23
4. Dollar value of sponsored research expenditures by industry sector
DEFINITION: Using the count obtained in number 3 above (number of sponsored research projects by industry sector), identify the aggregate dollar amount of the funding agreements in each industry sector identified.
5. Number of unique private sector entities funding research grants and contracts (including consortia, trade associations, etc.)
DEFINITION: The total number of all agreements listing a unique or discrete private sector entity as the counterparty. This includes consortia, cooperatives, trade association, other associations, etc. Consortia and other like partners should be counted as single entities.
Human Clinical Trials
6. Number of active trials during reporting period by phase (capture all possible data, including non-FDA approval protocols; differentiate by phases and/or FDA approval (or not) to the extent possible
DEFINITION: The total number of clinical trials by phase (see below) occurring during reporting time period. The number of non-FDA approval protocols also should be indicated.
Phase 0: Pharmacodynamics and Pharmacokinetics
Phase 1: Screening for safety
Phase 2: Establishing the testing protocol
Phase 3: Final testing
Phase 4: Post-approval studies
7. Number of subjects participating in clinical trials (active trial participants, only)
DEFINITION: The total number of human subjects participating in the clinical trials counted in metric number 6 above, regardless of phase.
8. Dollar value of sponsored research expenditures for/on clinical trials
DEFINITION: Total dollar amount of all expenditures related to the total number of clinical trials identified in metric number 6 (above).
9. Number of protocols approved during time period
DEFINITION: Count of the total amount of clinical trial protocols approved but not yet started during the identified reporting period.

24 APLU n Economic Engagement Framework
10. Number of trials initiated during time period
DEFINITION: Count of the total amount of new clinical trials commencing during the identified reporting period.
Service to External Clients
11. Number of organizations served
DEFINITION: Count of the total amount of external for-profit or not-for-profit entities served by the university (e.g., American Cancer Society, Habitat for Humanity, regional economic development organizations, etc.) during the reporting period. This number should reflect the extent to which university expertise or specialized resources help to support activity through the provision of testing facilities or analytical services, fee-for-services work (including technical assistance, contractual education and training, and diverse programs provided through any university service). These services may be provided in university facilities and/or on-site at a client’s place of business.
12. Number of companies provided on-site technical services
DEFINITION: Count of the total amount of companies contracting with the university not for research, but for technical assistance, training, and problem-solving utilizing university facilities during the reporting period.
B. Developing the Regional and National Workforce
Student Employment on Funded Projects
13. Number of students paid through externally funded grants or contracts
DEFINITION: Count of the total number of undergraduate and graduate students receiving a wage for work related to an externally funded grant or contract during the reporting period.
Student Entrepreneurship
14. Number of entrepreneurship courses/programs (credit and non-credit)
DEFINITION: Count of the total number of academic course offerings focused on entrepreneurship either for credit or non-credit during the reporting period.
15. Number of entrepreneurship courses/programs requiring a capstone project (e.g., business plan, elevator pitch)
DEFINITION: The total number of courses identified in metric 14 (above) that require a final project.
Assessment Tools 25
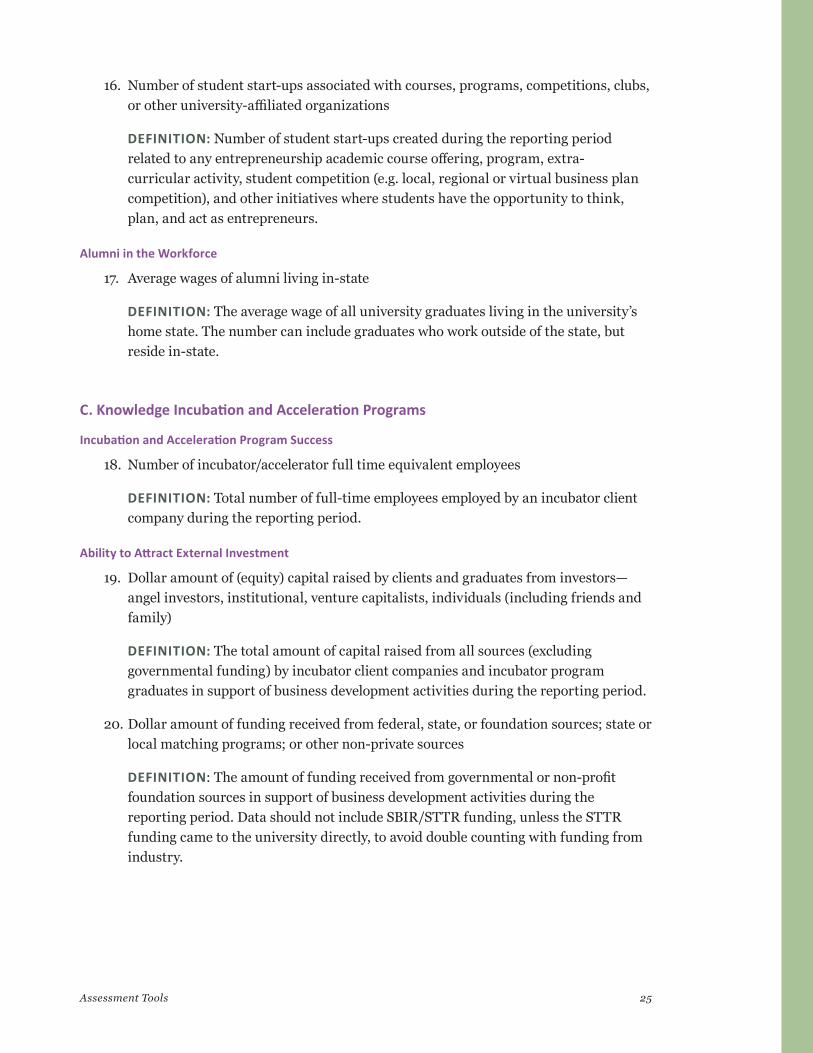
16. Number of student start-ups associated with courses, programs, competitions, clubs, or other university-affiliated organizations
DEFINITION: Number of student start-ups created during the reporting period related to any entrepreneurship academic course offering, program, extra-curricular activity, student competition (e.g. local, regional or virtual business plan competition), and other initiatives where students have the opportunity to think, plan, and act as entrepreneurs.
Alumni in the Workforce
17. Average wages of alumni living in-state
DEFINITION: The average wage of all university graduates living in the university’s home state. The number can include graduates who work outside of the state, but reside in-state.
C. Knowledge Incubation and Acceleration Programs
Incubation and Acceleration Program Success
18. Number of incubator/accelerator full time equivalent employees
DEFINITION: Total number of full-time employees employed by an incubator client company during the reporting period.
Ability to Attract External Investment
19. Dollar amount of (equity) capital raised by clients and graduates from investors—angel investors, institutional, venture capitalists, individuals (including friends and family)
DEFINITION: The total amount of capital raised from all sources (excluding governmental funding) by incubator client companies and incubator program graduates in support of business development activities during the reporting period.
20. Dollar amount of funding received from federal, state, or foundation sources; state or local matching programs; or other non-private sources
DEFINITION: The amount of funding received from governmental or non-profit foundation sources in support of business development activities during the reporting period. Data should not include SBIR/STTR funding, unless the STTR funding came to the university directly, to avoid double counting with funding from industry.
26 APLU n Economic Engagement Framework
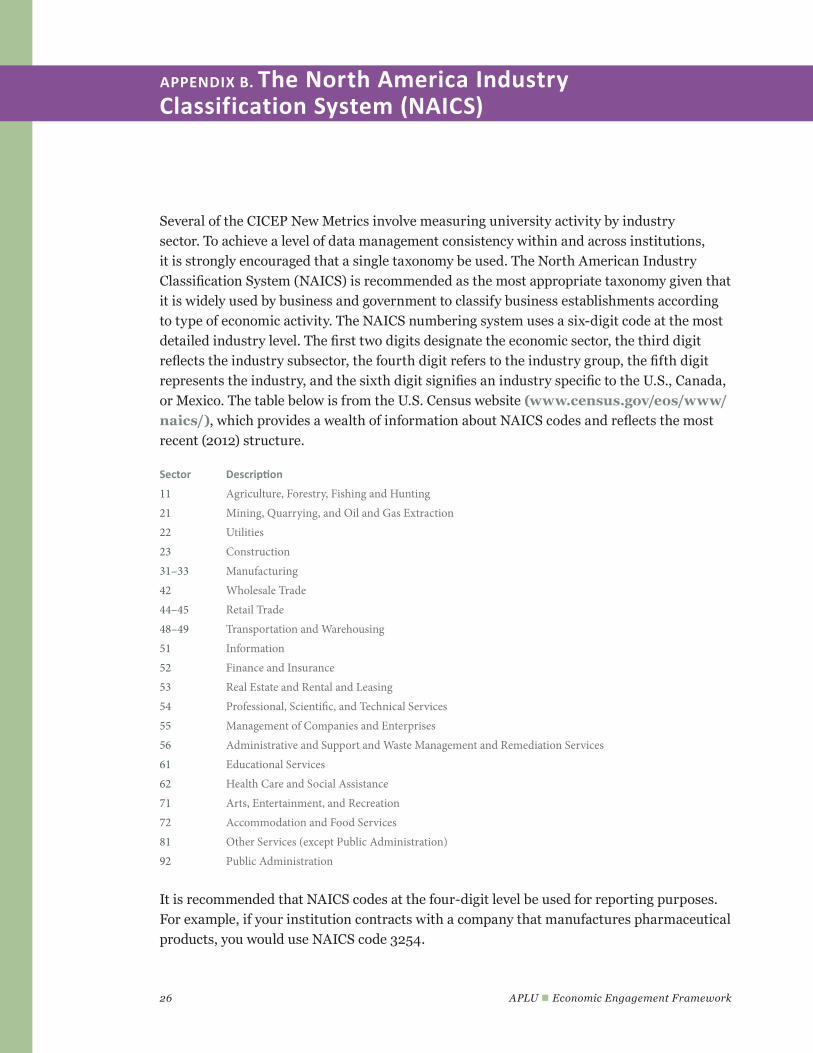
Several of the CICEP New Metrics involve measuring university activity by industry sector. To achieve a level of data management consistency within and across institutions, it is strongly encouraged that a single taxonomy be used. The North American Industry Classification System (NAICS) is recommended as the most appropriate taxonomy given that it is widely used by business and government to classify business establishments according to type of economic activity. The NAICS numbering system uses a six-digit code at the most detailed industry level. The first two digits designate the economic sector, the third digit reflects the industry subsector, the fourth digit refers to the industry group, the fifth digit represents the industry, and the sixth digit signifies an industry specific to the U.S., Canada, or Mexico. The table below is from the U.S. Census website (www.census.gov/eos/www/naics/), which provides a wealth of information about NAICS codes and reflects the most recent (2012) structure.
Sector Description
11 Agriculture, Forestry, Fishing and Hunting21 Mining, Quarrying, and Oil and Gas Extraction22 Utilities23 Construction31–33 Manufacturing42 Wholesale Trade44–45 Retail Trade48–49 Transportation and Warehousing51 Information52 Finance and Insurance53 Real Estate and Rental and Leasing54 Professional, Scientific, and Technical Services55 Management of Companies and Enterprises56 Administrative and Support and Waste Management and Remediation Services61 Educational Services62 Health Care and Social Assistance71 Arts, Entertainment, and Recreation72 Accommodation and Food Services81 Other Services (except Public Administration)92 Public Administration
It is recommended that NAICS codes at the four-digit level be used for reporting purposes. For example, if your institution contracts with a company that manufactures pharmaceutical products, you would use NAICS code 3254.
APPENDIX B. The North America Industry Classification System (NAICS)

Assessment Tools 27
APPENDIX B. The North America Industry Classification System (NAICS)

28 APLU n Economic Engagement Framework

1307 New York Avenue, N.W. Suite 400 Washington, DC 20005 (202) 478-6040 www.aplu.org
@APLU_NEWS
@APLUENGAGEMENT
Access this publication online at www.aplu.org/EEF