Embed Size (px)
Citation preview

Economic Development Policy Paper
TranPlan 21
Amended in 2007
State of Montana Department of Transportation

Montana Department of Transportation – TranPlan 21Economic Development Policy Paper Page 1
Montana Department of Transportation
Economic Development Policy Paper
Table of Contents
I. Introduction.....................................................................................................2
A. Background ...........................................................................................2
B. Changes Since the Original TranPlan 21 ..............................2
II. Strategic Considerations and Trends and Their Implication for Transportation and Economic Development ...........................5
A. Geography..............................................................................................5
B. Population Trends .............................................................................8
C. Economic Trends through the 1990s....................................15
D. Forecasts of Future Growth.......................................................20
III. Economic Development Issues .......................................................33
A. Issues Raised by the Public, Stakeholders, and Industry Representatives ............................................................33
B. Economic And Growth Issues Raised By Technical Analysis .................................................................................................35
IV. Policy Goals and Actions....................................................................37
Attachment A: Methods Used to Estimate Future Output of Commodity Industries

Montana Department of Transportation – TranPlan 21 Economic Development Policy Paper
Page 2
I. Introduction
This paper presents policy goals and actions for the Montana Department of Transportation (MDT), which support development of Montana’s economy. This policy paper amends the Economic Development policy paper adopted as part the 2002 update to Montana’s long-range multimodal transportation plan, TranPlan 21.
The policy paper is organized into the following sections:
II. Strategic Considerations and Trends and their Implications for Transportation and Economic Development. This section presents the result of a technical assessment of Montana’s economic trends and their implications for MDT’s role in transportation.
III. Economic Development Issues. This section lists the most important economic development issues for MDT to consider when planning, investing in, and operating elements of Montana’s transportation system. These issues are identified through technical analysis and a program of public and stakeholder input.
IV. Policy Goals and Actions. This section lists the potential range of actions that MDT could take to address issues raised by the technical analysis and stakeholder input.
A. Background MDT’s current plan supports economic development by recognizing that Montana’s economy has long been dependent on agriculture and natural resources. The transportation system supports this economy by providing the infrastructure through which major commodities such as grains, livestock, lumber, natural gas, oil, coal, and copper are exported from the state. Over recent decades, the national and Montana economies have been changing with the introduction of new technologies and production methods, the establishment of small manufacturing industries, and the increasing importance of both household and business demands for services.
In 1995, the initial TranPlan 21 recognized these trends, and observed that Montana faced significant transportation challenges that varied by region. For example, in western and southwestern Montana, there was a growing demand for transportation services to support the new service economy. Declining populations and slow economic trends in the eastern and north-central regions of Montana posed challenges to the State in maintaining the quality of the transportation system.
B. Changes Since the Original TranPlan 21 Findings in the original TranPlan 21 were based on trends in the early 1990s. Most apply today, but changes have occurred. Below are key extracts from the initial document that still apply, amended where appropriate:

Montana Department of Transportation – TranPlan 21 Economic Development Policy Paper
Page 3
• Montana’s historic natural resource industries are expected to continue to remain significant to the state’s economy and its transportation system. Automated production processes have enabled Montana industries to maintain or increase output while reducing employment and wages. Automation of production maintains the importance of the transportation system for shipping commodities although it reduces employment and income in the regions of the State where these industries are dominant. This, in turn, reduces travel demand for both the highway system and for air transportation service.
• Trends suggest more value-added production from Montana’s resource base, particularly the production of wood products. This trend may lead to diverting a portion of rail demand for bulk commodities to truck demand for smaller-sized, but higher-valued goods. In the case of lumber, despite the emergence of the log-home industry in the Bitterroot Valley, there appears to have been limited increase in truck traffic of value-added wood products. This is mainly because all segments of Montana’s wood products industry are declining. . . The estimated annual lumber production in 2001 was just over 1.1 million board feet, a 6 percent decline from 2000; and plywood production fell to an estimated 555 million square feet in 2001, a 4.5 percent decline from the previous year. Accordingly, gross state product generated from lumber and wood products declined by 38 percent in real value between 1990 and 1999. However, growth in other types of value-added production such as specialty grains that require product identification will generate new travel demands.1
• Though wood products was the largest manufacturing industry in Montana, the manufacturing sector appears to be diversifying, led by the growing industries of petroleum and coal products, furniture and fixtures, instruments, and apparel. Trends through the 1990s reinforce this finding.
• Manufacturing is also decentralizing from urban to rural areas, indicating truck traffic volumes will increase on Montana’s rural highways, particularly in the southern part of the State, near metropolitan areas.
• Services grew rapidly in Montana from the mid-1970s to the early 1990s, even at times when Montana’s traditional resource industries were stagnant. Services continued to grow through the 1990s.
• Tourism to Montana grew from the mid-1980s as expected, though upswings and downswings were envisioned. Montana’s visitors primarily come by car, leading to concerns about conditions of secondary roads and traffic volumes near key destinations. The number of non-resident visitors to Montana has increased by 14 percent from 1993 to 2001 and expenditures have also increased by 14 percent in constant dollars.2
• The population is forecast to grow more rapidly in Montana’s urban areas than in the state as whole.
1 Sources: Bureau of Economic Analysis, U.S. Department of Commerce; and Montana Economic Outlook Seminar, 2002, University of Montana. 2 Institute for Tourism and Recreation Research, University of Montana.

Montana Department of Transportation – TranPlan 21 Economic Development Policy Paper
Page 4
• Data from the U.S. Bureau of Economic Analysis indicate that Montana’s overall economic growth, as measured by Gross Domestic Product (GDP) was quite robust, as was the growth of peer western states. Between 2003 and 2006, Montana’s GDP increased at an average annual rate of 4.22 percent. The Rocky Mountain region, at 4.64 percent per year, grew faster than any other region of the U.S. (3.36 percent). Nationally, Montana ranked eleventh in actual GDP growth over the 2003 to 2006 period. The fifteen states in the Rocky Mountain, Far West, and Southwestern regions accounted for eight of the nation’s top ten fastest growing states in GDP. These figures suggest that Montana, between 2003 and 2006, participated in widespread economic growth in the western part of the U.S.
• Broadly, the forces driving economic growth in Montana and the west are expected to continue. Economic and demographic projections completed for the State of Montana by NPA Data Services anticipate average annual population growth of about one percent, and employment growth of about 1.5 percent per year. NPA projections anticipate that Montana will have 1,197,400 people and 865,000 jobs by the year 2030

Montana Department of Transportation – TranPlan 21 Economic Development Policy Paper
Page 5
II. Strategic Considerations and Trends and Their Implication for Transportation and
Economic Development
In order to manage and develop a transportation system that supports the State’s economy today and in the future, MDT needs to consider the State’s geography, population, and economy. In the past, these three features have combined to produce an extensive transportation system in Montana oriented towards shipping bulk commodities by highway and rail to terminals and then out of state. The highway system developed to provide farm and ranch to market access. Geography, population, and economy remain key considerations in determining current and future transportation demands in Montana. Their implications for economic development are discussed in turn.
A. Geography The following geographic realities are important considerations in determining how to support economic development through transportation in Montana:
• Scale of the State Montana spans 147,046 square miles, making the State the fourth largest in the United States in overall size and land area (behind Alaska, Texas, and California).
• Topography Montana’s internal waterways cover 1,490 square miles, which is 26th among states. Montana’s one percent ratio of water to land area is 40th among the 50 states. The average ratio of the 50 states is 7.1 percent. Compared to other states that are heavily dependent on the shipment of bulk commodities, MDT has no inland waterways that are used for shipping these commodities.
• Distance from markets Montana’s industry is a long distance from markets. Commodities that originate in Montana are shipped an average of 711 miles per ton, nearly three times the United States average of 240 miles per ton. The average distances per ton of cargo originating in Idaho, North Dakota, and South Dakota are 317 miles, 319 miles, and 469 miles, respectively. Wyoming, however, transports its goods an average of 856 miles per ton.3
3 Source: 1997 Commodity Flow Survey, U.S. Department of Transportation and U.S. Department of Commerce.

Montana Department of Transportation – TranPlan 21 Economic Development Policy Paper
Page 6
• Location in low population region Montana has a relatively small economy, as do its neighboring states. Therefore, compared to their competitors, which Montana businesses have smaller local and regional markets in which to sell goods and services the neighboring Canadian provinces have larger populations and economies, giving them a competitive advantage.
• East-west orientation The transportation system in many parts of the State, most notably in eastern Montana, is oriented east-west. At the regional and national levels, Montana is a bridge state for motor carriers.
1. Transportation Implications
a. Competitive disadvantage due to distance from market Transporting goods to markets is more difficult and costly for businesses in Montana than those in other states, presenting a competitive disadvantage for the state. The “gap” between Montana and the rest of the nation in the distance products are shipped has grown between 1993 and 1997 from 347 miles per ton to 471 miles per ton.4 As seen in Exhibit II–1, between 1993 and 1997, Montana saw the commodities it produces and ships increase by 16 percent, which is on par with the national rate of increase.
Exhibit II–1: Change in Miles per Ton of Shipments, 1993 to 1997 Increase (Decrease) 1993-1997
1997 Tons Shipped
1997 Miles per Ton Tons Shipped Miles
per Ton Montana 95,778 711 16% 19% Idaho 47,764 317 3% (-22%) North Dakota 87,831 319 45% 7% South Dakota 36,853 469 46% 92% Wyoming 275,466 856 (-6%) 0% U.S. 11,089,733 240 14% (-4%) Sources: 1993 and 1997 Commodity Flow Surveys, U.S. Department of Transportation, and U.S. Department of Commerce. Calculations by EDR Group.
An increase of miles per ton is not necessarily bad, as it could indicate national and international demand for products produced in-state, such as Gateway Computers shipped from South Dakota.5 However, without such a dynamic
4 Sources:1993 and 1997 Commodity Flow Surveys, U.S. Department of Transportation and U.S. Department of Commerce. 5 Commodity Flow Surveys measure distances shipped within the United States. For exports, the CFS accounts for shipments to borders or ports.
Montana Department of Transportation – TranPlan 21 Economic Development Policy Paper
Page 7
change in product mix and demand, the data indicates that producers in Montana are faced with higher costs for shipping than national competitors.
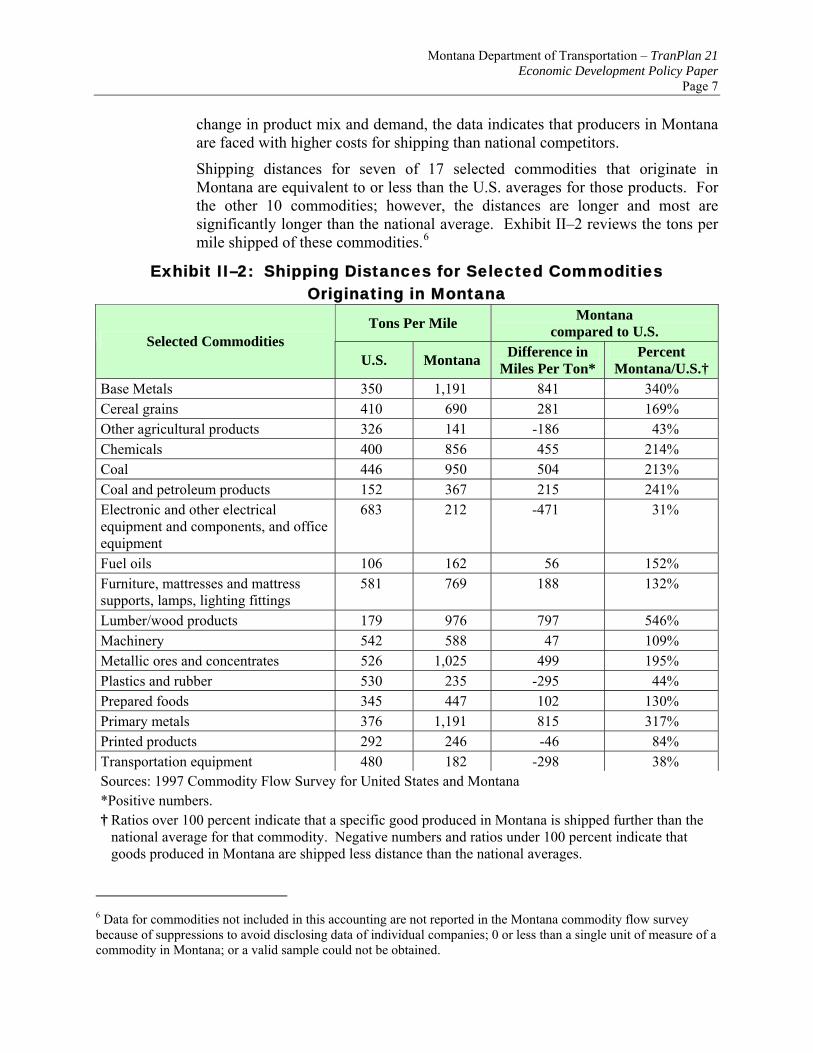
Shipping distances for seven of 17 selected commodities that originate in Montana are equivalent to or less than the U.S. averages for those products. For the other 10 commodities; however, the distances are longer and most are significantly longer than the national average. Exhibit II–2 reviews the tons per mile shipped of these commodities.6
Exhibit II–2: Shipping Distances for Selected Commodities Originating in Montana
Tons Per Mile Montana compared to U.S.
Selected Commodities U.S. Montana Difference in
Miles Per Ton* Percent
Montana/U.S.† Base Metals 350 1,191 841 340% Cereal grains 410 690 281 169% Other agricultural products 326 141 -186 43% Chemicals 400 856 455 214% Coal 446 950 504 213% Coal and petroleum products 152 367 215 241% Electronic and other electrical equipment and components, and office equipment
683 212 -471 31%
Fuel oils 106 162 56 152% Furniture, mattresses and mattress supports, lamps, lighting fittings
581 769 188 132%
Lumber/wood products 179 976 797 546% Machinery 542 588 47 109% Metallic ores and concentrates 526 1,025 499 195% Plastics and rubber 530 235 -295 44% Prepared foods 345 447 102 130% Primary metals 376 1,191 815 317% Printed products 292 246 -46 84% Transportation equipment 480 182 -298 38% Sources: 1997 Commodity Flow Survey for United States and Montana *Positive numbers. † Ratios over 100 percent indicate that a specific good produced in Montana is shipped further than the
national average for that commodity. Negative numbers and ratios under 100 percent indicate that goods produced in Montana are shipped less distance than the national averages.
6 Data for commodities not included in this accounting are not reported in the Montana commodity flow survey because of suppressions to avoid disclosing data of individual companies; 0 or less than a single unit of measure of a commodity in Montana; or a valid sample could not be obtained.

Montana Department of Transportation – TranPlan 21 Economic Development Policy Paper
Page 8
Montana’s geography also virtually eliminates water transportation as an effective mode for shipment. The 1997 Commodity Flow Survey (CFS) shows that 6.1 percent of all national tonnage is transported by water. These tons account for 14 percent of the ton-miles incurred within the United States, but only 1.2 percent of the value of shipped tonnage. Thus, water is a cost-effective way to transport bulk commodities that are relatively low value per unit. Montana is not able to use waterway transportation, and the 1997 CFS does not report any tonnage shipped by water. Historically, Montana industry has compensated by constructing and maintaining railways to ship bulk commodities.
b. Continued and increased reliance on air transportation services The use of air transportation services and telecommunications technology provides the means to overcome Montana’s distance from markets. Montana’s geography indicates the increased importance of air transportation services. This includes both business-related travel and shipping. The air transportation sector is particularly important for the growing high-end services that can contribute to economic development. Such sectors include business services, finance, insurance, real estate, and consulting.
These service industries require efficient roadway connections among population centers within Montana. In addition, access to and from airports is necessary to facilitate in-state commerce, business travel among states, and tourist travel.
B. Population Trends Due to its low population and large land area, the population density of Montana is among the lowest in the United States. However, demographic and population growth trends in the State will significantly affect the demand for transportation in Montana. The number of people, their ages, and where they live, are important considerations for MDT’s long-range planning. In turn, population trends must be considered when assessing the State’s economy because Montana’s growing industries typically need to be located in, or close to, the population centers.
Montana’s population was reported in the 2000 census at 902,195, which is 0.3 percent of the United States and 22 percent of the five-state region. In land area, Montana covers 4 percent of the nation, and 31 percent of the region. Montana is among the country’s least populated states and 48th in the nation, with about six people per square mile (ahead of Alaska and Wyoming). By comparison, the per square mile densities of the United States and Montana’s four border states are about 80 and 10, respectively (Source: Northeast-Midwest Institute).7
Montana Department of Transportation – TranPlan 21 Economic Development Policy Paper
Page 9
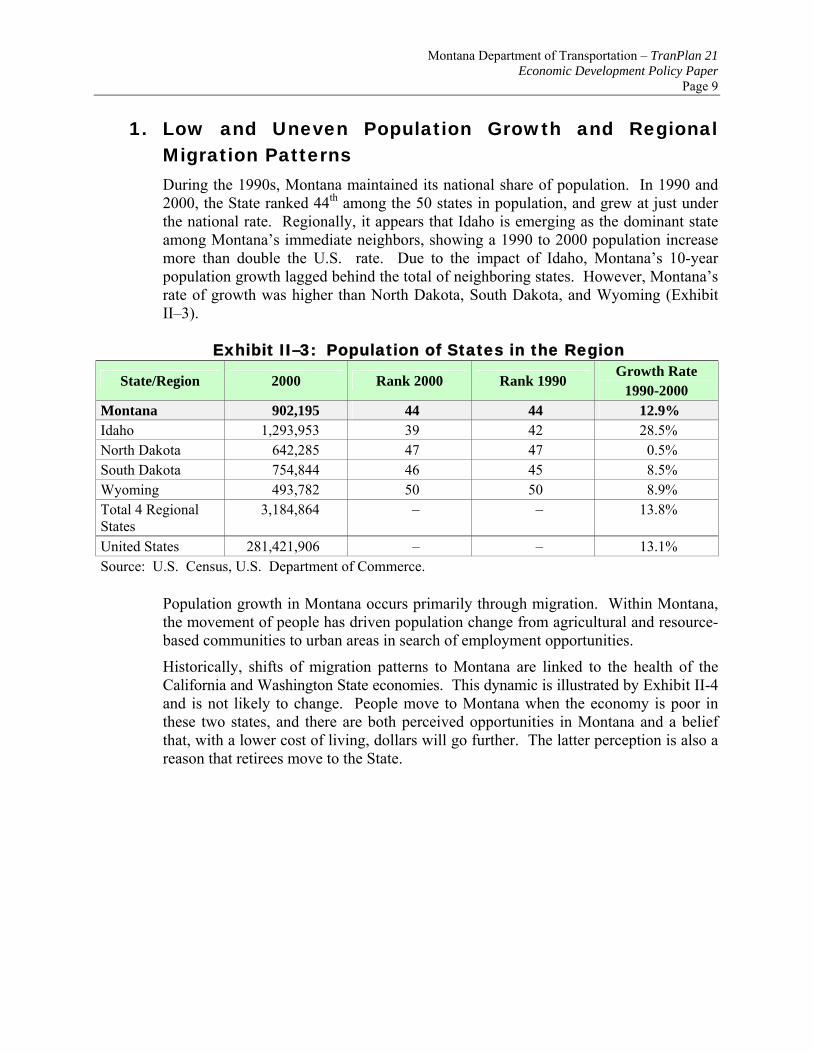
1. Low and Uneven Population Growth and Regional Migration Patterns During the 1990s, Montana maintained its national share of population. In 1990 and 2000, the State ranked 44th among the 50 states in population, and grew at just under the national rate. Regionally, it appears that Idaho is emerging as the dominant state among Montana’s immediate neighbors, showing a 1990 to 2000 population increase more than double the U.S. rate. Due to the impact of Idaho, Montana’s 10-year population growth lagged behind the total of neighboring states. However, Montana’s rate of growth was higher than North Dakota, South Dakota, and Wyoming (Exhibit II–3).
Exhibit II–3: Population of States in the Region
State/Region 2000 Rank 2000 Rank 1990 Growth Rate
1990-2000 Montana 902,195 44 44 12.9% Idaho 1,293,953 39 42 28.5% North Dakota 642,285 47 47 0.5% South Dakota 754,844 46 45 8.5% Wyoming 493,782 50 50 8.9% Total 4 Regional States
3,184,864 – – 13.8%
United States 281,421,906 – – 13.1% Source: U.S. Census, U.S. Department of Commerce.
Population growth in Montana occurs primarily through migration. Within Montana, the movement of people has driven population change from agricultural and resource-based communities to urban areas in search of employment opportunities.
Historically, shifts of migration patterns to Montana are linked to the health of the California and Washington State economies. This dynamic is illustrated by Exhibit II-4 and is not likely to change. People move to Montana when the economy is poor in these two states, and there are both perceived opportunities in Montana and a belief that, with a lower cost of living, dollars will go further. The latter perception is also a reason that retirees move to the State.

Montana Department of Transportation – TranPlan 21 Economic Development Policy Paper
Page 10
Exhibit II–4: Migration from California and Washington to Montana
-3000
-2000
0
1000
2000
3000
4000
5000
6000
1986 1987 1988 1989 1990 1991 1992 1993 1994 1995 1996 1997 1998 1999
-0.02
-0.01
0
0.01
0.02
0.03
0.04
0.05
0.06
Net In-Migration to MT
Source: U.S. Internal Revenue Service and Bureau of Economic Analysis, U.S. Department of Commerce.
2. Population Growth is Concentrated in a Few Counties Montana is and will continue to be a rural state. According to 2000 Census data, Montana does not have a city with a population of 100,000. The most populated county in the state was Yellowstone, with 129,350 people, followed by Missoula County with 95,800 and Cascade County with 80,350. In the 1990s, the proportion of the population in these urban counties was little changed.
Growth in Montana’s seven urban counties was an aggregate of 16.5 percent through the 1990s, which is slightly higher than the statewide average. These counties, however, show three different population patterns:
• Strong urbanization trends are seen in Flathead and Gallatin counties, where population increased by 25.8 percent—twice the state average.
• Growth was slightly faster than the State in Lewis and Clark and Yellowstone counties, with an overall population increase of 14.9 percent.
• Silver Bow and Cascade counties were subject to de-urbanization in the 1990s, with an aggregate growth rate of 3 percent.
3. Growth Trends Continue to Favor Western Montana While the state’s broad population growth pattern shows a shift from east to west, a division of the state into regions and sub-regions indicates a somewhat more diverse growth pattern. County-level estimates from U.S. Census between 2000 and 2006
-1000
% Job Change CA & WA

Montana Department of Transportation – TranPlan 21 Economic Development Policy Paper
Page 11
suggest that the state’s population is growing around its cities and alpine-amenity areas. Much recent growth appears to be centered in and around the states larger urban areas, with larger cities spreading farther into their surrounding, multi-county territories. Urban areas in the state’s premier alpine-amenity areas grew fastest. The fastest pace of recent (2000-2006) growth has been where urban and high-amenity alpine conditions converge.
MDT subregion boundaries are shown in Figure II-5. In the 2000 to 2006 period, population growth was fastest around Bozeman and Kalispell (sub-regions that include these cities and the state’s two National Parks.) Population in the Bozeman area grew at a remarkably rapid rate of 2.3 percent per year between 2000 and 2006; and the Kalispell sub-region at 1.7 percent. Three other relatively urbanized areas, around Helena, Missoula, and Billings also added population at about 1 percent per year, which is moderately fast as regional population growth goes.

Montana Department of Transportation – TranPlan 21 Economic Development Policy Paper
Page 12
Exhibit II–5: MDT Region Boundaries
Source: Montana Department of Transportation.
Other regions lost population over the period. Remarkably, the Butte area, which is both in western-Montana and urbanized, declined at about 0.9 percent per year. Population losses here seem attributable to a number of specific industrial shocks. (The Butte region is the historic industrial heart of Montana. In the last century, its prominence in mining copper and other metals made it a true global force. Over decades, that city-region has seen various declines in mining. In recent years, the region suffered the total collapse of the Montana Power Company and its descendant firm, Touch America. These industrial events have put out thousands of workers, and that seems to be the main factor in the area’s population decline. Nonetheless, the region includes an attractive city, is rich in industrial infrastructure, excels in livestock production, has a large skilled workforce, and has high amenity value.) This area’s development path is the greatest anomaly in the East (declining) -West (growing) interpretation of the state’s population growth.
Census estimates indicate that the Great Falls area, which is anchored by a metropolitan area, also saw had modest population losses over the 2000-2006 period averaging about 0.3 percent per year.

Montana Department of Transportation – TranPlan 21 Economic Development Policy Paper
Page 13
The more isolated rural areas of eastern and central Montana also showed population losses between 2000 and 2006, according to Census estimates. These areas of the state are most reliant on agriculture and energy industries and lack close access to larger cities. The state’s steepest population decline was in the northeastern area, which showed about a l percent annual rate of population loss; the southeastern area declined at about 0.7 percent per year; the central area at about 0.5 percent, and the north-central area at about 0.35 percent. A recent industrial resurgence in these areas of the state may stabilize and even reverse these downward population trends. Several recent reports indicate that energy investments are booming, and that agricultural prices and outputs have been quite strong.
4. Aging Population Montana’s population has been aging at a faster pace than the nation is as a whole. The median age of Montanans increased compared to the national median, from 0.9 years above the median in 1990 to 2.2 years above in 2000. With a median age of 37.5 years, Montana’s population is older than each of its neighboring states by 1.3 to 4.3 years. In the last decade, the median age in North Dakota, South Dakota, and Wyoming all moved from below to above the national average, only Idaho saw its median age become younger compared to the U.S. population.
Montana also has a lower proportion of younger workers (those aged 18 to 44) and a higher percentage of mature workers (aged 45-64) than each of its neighboring states and the nation. (See Exhibit II–6.)
Exhibit II–6: Percent of Population by Age Group Percent of Population (2000) Years
State/Region/U.S. Under 18 18-44 45-64 65 and
Over Median
Age 2000 Median
Age 1990 Montana 25.5 36.7 24.4 13.4 37.5 33.8 Idaho 28.5 38.7 21.5 11.3 33.2 31.5 North Dakota 25.0 38.6 21.6 14.7 36.2 32.4 South Dakota 26.8 37.6 21.2 14.3 35.6 32.5 Wyoming 26.1 38.2 24.0 11.7 36.2 32.1 United States 25.7 39.9 22.0 12.4 35.3 32.9 Source: U.S. Census.
By age cohort, Montana’s population has fewer young workers, aged 25 to 44, than it did in 1990, and 50 percent more mid-aged to older workers (ages 45 to 64). The more urban the area, the higher rate of growth is seen for this latter age group. The State’s 12 percent growth in elderly (65 and older) was proportionate with Montana’s overall population change. It was also proportionate in the quickly urbanizing Flathead, Gallatin, and Missoula counties, but growth among senior cohorts was greater than population change in the aggregate of Lewis & Clark, Yellowstone, Silver Bow, and Cascade Counties. (See Exhibit II–7.)

Montana Department of Transportation – TranPlan 21 Economic Development Policy Paper
Page 14
Exhibit II–7: Change in the Age Structure of Montana’s Population, 1990 to 2000
State Totals Strong
Growth Urban Counties*
Moderate Growth Urban Counties**
Stagnant Urban Counties***
Pop. 2000
Change 1990-2000
Pop. 2000
Change 1990-2000
Pop. 2000
Change 1990-2000
Pop. 2000
Change 1990-2000
Total 2000 902.2 13% 189.2 26% 185.1 15% 115.0 3% Under 25 320.4 9% 73.0 23% 64.3 10% 39.7 -1% 25-44 236.8 -5% 63.4 6% 50.6 -4% 29.3 -14% 45-64 225.4 50% 32.4 71% 46.6 54% 29.4 37% 65+ 119.5 12% 20.4 26% 23.6 20% 16.5 5% Source: NPA Data Services. *Flathead, Gallatin, and Missoula Counties. **Lewis & Clark and Yellowstone Counties. ***Silver Bow and Cascade Counties.
5. Transportation Implications Population and the level of economic activity determine travel demand. Travel in Montana breaks down into the following demands: daily commuting for work, school, and other commitments; business travel (not commuting) by Montanans or by out of state visitors; and personal or vacation travel by both Montanans and visitors. The implications of these demographic trends are:
• For most of the State travel demand, growth due to population change will not reduce travel times and create congestion at the statewide or regional levels. Combined population and land area indicates that travel (distinct from commodity shipments) is not burdened by congestion and travel times are already at their minimums (LOS A or B).8
Population and income are indicators of the demand for personal travel by Montana’s citizens. As we look at changes among transportation districts, we can hypothesize that the aggregate demand for personal travel has increased in western and southwestern Montana, held steady (or perhaps moderately increased) in the central regions of the State, and decreased in eastern Montana.
• Montana counties experiencing the bulk of the State’s population growth will continue to experience reduced service levels on their arterial system. Capacity concerns are concentrated in a few counties.
• Aging population will increase the importance of public transportation, age-related safety provisions, and other strategies for meeting the needs of the
8 If congestion is a problem anywhere, it would be localized in peak hour traffic at key intersections in the several of Montana’s cities.

Montana Department of Transportation – TranPlan 21 Economic Development Policy Paper
Page 15
elderly. Montana’s aging population has implications for transportation programs to serve the State’s elderly citizens. If a greater proportion of the population is unable to drive, or is restricted in driving, due to infirmities generally associated with aging, then the State and communities may be called on to provide increasing amounts of public transportation to assure that Montanans can remain mobile.
• In large parts of Montana, residents will have to drive further to access services. Population trends indicate that smaller communities will continue to lose services and that Montanans will have to drive longer distances to regional service centers. This will increase the importance of winter maintenance for many communities.
• Montanans will be driving longer distances to work as businesses need to recruit over a larger geographic area. An aging population with fewer citizens in prime working age (the 18 to 44 and 45 to 64 cohorts) may impede future economic growth if the in-state labor pool supply is restricted and/or fosters an increase of VMT in Montana as people drive longer distances to work. If a labor shortage does arise, however, then there may be a perception that jobs are available, leading to additional migration from Washington, California, and elsewhere.
C. Economic Trends through the 1990s Montana’s economy underwent key changes in the 1990s.
1. Decline in Importance of Farming, Mining, and Manufacturing for Montanans Between 1990 and 1999, employment in the goods-producing sectors of farming, mining, and manufacturing increased by four percent, but personal income decreased in constant dollars by three percent. Collectively, the direct impact of these sectors decreased in importance for Montanans, falling from 15 percent to 12 percent of the State’s employment and from 10 percent to 8 percent of the total personal income.
Recent price and production patterns of key natural resources, such as wheat, cattle, and timber, present uneven growth patterns in Montana. On the positive side, the price per bushel of Montana’s wheat has been rising since 1998 and is above 1991 levels, although it is still significantly beneath the decade’s 1994-1995 highs. Cattle prices have been on a “roller-coaster” since 1986, recording steep price rises from 1986 to 1991, a precipitous decline from 1993 to 1996 and a dramatic rise since that point, which leaves Montana’s steer and heifer cattle prices at record highs in 2001. From a transportation perspective, however, higher unit prices may translate into smaller supplies, meaning less wheat or cattle to transport. This is certainly true for wheat in Montana, which in 2001 recorded its lowest output since 1998, and was 13 percent beneath its 2000 level. In addition, Montana’s volumes of timber board feet cut and

Montana Department of Transportation – TranPlan 21 Economic Development Policy Paper
Page 16
timber board feet sold have declined from more than 500 million feet cut and 400 million feet sold in 1989 to approximately 100 million board feet cut and sold in 2001.
Exhibit II–8 shows the performance of Montana’s large export industries measured by changes in employment and gross state product (GSP). Note that metal mining and coal mining lost employment during the 1990s, but gained income (in constant dollars) over the decade – indicating that these industries are mechanizing and still producing considerable income for Montana. However, lumber and wood products and oil and gas extraction lost both employment and income over the decade. Both sectors declined in absolute numbers, and Montana’s lumber and wood products industry lost market share in the United States, perhaps signifying that these industries are declining in Montana.
Exhibit II–8: Performance of Key Core Industries in Montana Changes during the 1990s
Sector % Employment Increase/Decrease
% Income Increase/Decrease
Position Relative to the National Industry
Metal Mining (26) 66
Montana’s employment declined faster than the U.S. and GSP increased less than the U.S.
Coal Mining
(15) 128
Montana’s employment declined slower than the U.S.; and GSP increase was greater than the U.S. increase.
Lumber and Wood Products
(15) (38)
Montana’s employment declined, while the U.S. employment increased. Montana’s GSP decreased steeper than the U.S. decreased.
Oil and Gas Extraction (10) (39)
Employment in Montana declined more slowly than the U.S. decline. GSP increased in the U.S. but declined in Montana
Farms
5 15
Employment in Montana rose, while remaining flat across the U.S. GSP, however, increased at a higher rate nationally than in Montana.
Source: U.S. Bureau of Economic Analysis. Note: The forestry sector saw an increase of employment in Montana, but at a slower rate than the
nation as a whole. Income data from BEA is not available for this sector.
2. Automation in Basic Industries Supplants Employment and Personal Income There were significant capital investments in farming and manufacturing during the 1990s. This is resulting in healthy industries where industry income rises, but
Montana Department of Transportation – TranPlan 21 Economic Development Policy Paper
Page 17
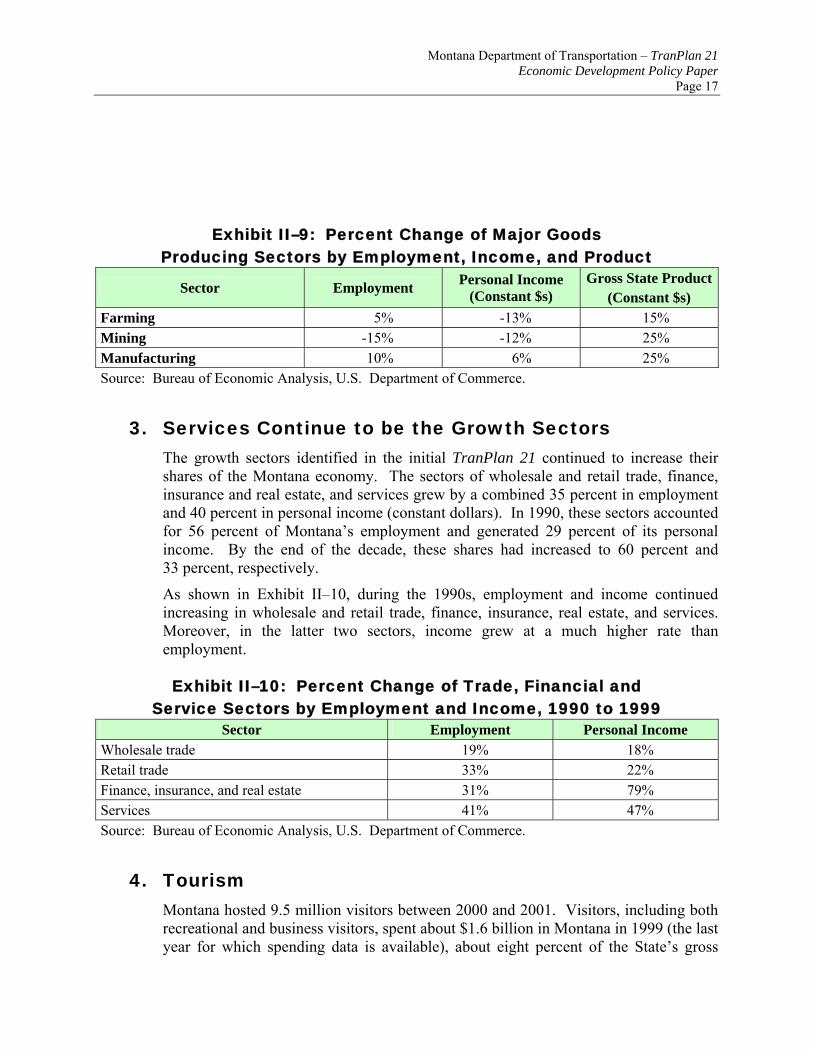
Exhibit II–9: Percent Change of Major Goods Producing Sectors by Employment, Income, and Product
Sector Employment Personal Income (Constant $s)
Gross State Product(Constant $s)
Farming 5% -13% 15% Mining -15% -12% 25% Manufacturing 10% 6% 25% Source: Bureau of Economic Analysis, U.S. Department of Commerce.
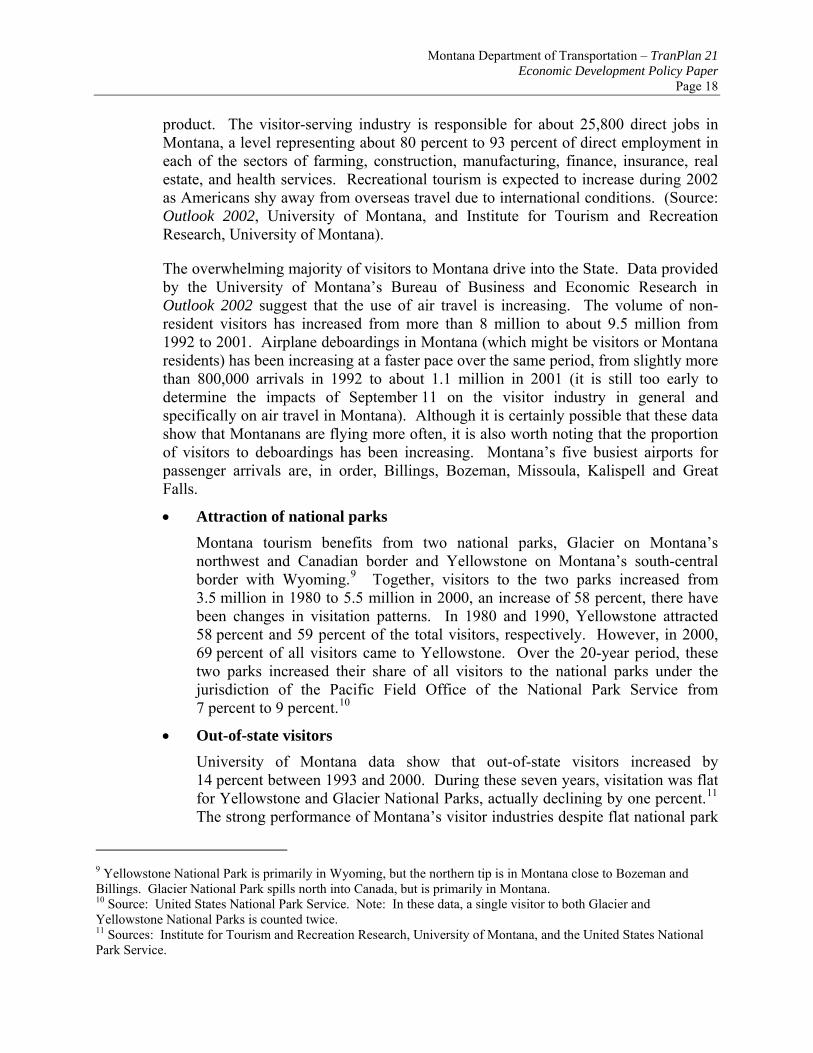
3. Services Continue to be the Growth Sectors The growth sectors identified in the initial TranPlan 21 continued to increase their shares of the Montana economy. The sectors of wholesale and retail trade, finance, insurance and real estate, and services grew by a combined 35 percent in employment and 40 percent in personal income (constant dollars). In 1990, these sectors accounted for 56 percent of Montana’s employment and generated 29 percent of its personal income. By the end of the decade, these shares had increased to 60 percent and 33 percent, respectively.
As shown in Exhibit II–10, during the 1990s, employment and income continued increasing in wholesale and retail trade, finance, insurance, real estate, and services. Moreover, in the latter two sectors, income grew at a much higher rate than employment.
Exhibit II–10: Percent Change of Trade, Financial and Service Sectors by Employment and Income, 1990 to 1999
Sector Employment Personal Income Wholesale trade 19% 18% Retail trade 33% 22% Finance, insurance, and real estate 31% 79% Services 41% 47% Source: Bureau of Economic Analysis, U.S. Department of Commerce.
4. Tourism Montana hosted 9.5 million visitors between 2000 and 2001. Visitors, including both recreational and business visitors, spent about $1.6 billion in Montana in 1999 (the last year for which spending data is available), about eight percent of the State’s gross
Montana Department of Transportation – TranPlan 21 Economic Development Policy Paper
Page 18
product. The visitor-serving industry is responsible for about 25,800 direct jobs in Montana, a level representing about 80 percent to 93 percent of direct employment in each of the sectors of farming, construction, manufacturing, finance, insurance, real estate, and health services. Recreational tourism is expected to increase during 2002 as Americans shy away from overseas travel due to international conditions. (Source: Outlook 2002, University of Montana, and Institute for Tourism and Recreation Research, University of Montana).
The overwhelming majority of visitors to Montana drive into the State. Data provided by the University of Montana’s Bureau of Business and Economic Research in Outlook 2002 suggest that the use of air travel is increasing. The volume of non-resident visitors has increased from more than 8 million to about 9.5 million from 1992 to 2001. Airplane deboardings in Montana (which might be visitors or Montana residents) has been increasing at a faster pace over the same period, from slightly more than 800,000 arrivals in 1992 to about 1.1 million in 2001 (it is still too early to determine the impacts of September 11 on the visitor industry in general and specifically on air travel in Montana). Although it is certainly possible that these data show that Montanans are flying more often, it is also worth noting that the proportion of visitors to deboardings has been increasing. Montana’s five busiest airports for passenger arrivals are, in order, Billings, Bozeman, Missoula, Kalispell and Great Falls.
• Attraction of national parks Montana tourism benefits from two national parks, Glacier on Montana’s northwest and Canadian border and Yellowstone on Montana’s south-central border with Wyoming.9 Together, visitors to the two parks increased from 3.5 million in 1980 to 5.5 million in 2000, an increase of 58 percent, there have been changes in visitation patterns. In 1980 and 1990, Yellowstone attracted 58 percent and 59 percent of the total visitors, respectively. However, in 2000, 69 percent of all visitors came to Yellowstone. Over the 20-year period, these two parks increased their share of all visitors to the national parks under the jurisdiction of the Pacific Field Office of the National Park Service from 7 percent to 9 percent.10
• Out-of-state visitors University of Montana data show that out-of-state visitors increased by 14 percent between 1993 and 2000. During these seven years, visitation was flat for Yellowstone and Glacier National Parks, actually declining by one percent.11 The strong performance of Montana’s visitor industries despite flat national park
9 Yellowstone National Park is primarily in Wyoming, but the northern tip is in Montana close to Bozeman and Billings. Glacier National Park spills north into Canada, but is primarily in Montana. 10 Source: United States National Park Service. Note: In these data, a single visitor to both Glacier and Yellowstone National Parks is counted twice. 11 Sources: Institute for Tourism and Recreation Research, University of Montana, and the United States National Park Service.

Montana Department of Transportation – TranPlan 21 Economic Development Policy Paper
Page 19
attendance indicates a positive trend for business travel and tourism in the state. Montana has considerable interest in continuing to develop the skiing industry as a winter counter-balance to national park and other summer visitations. Ski visits to Montana grew from about 750,000 in the 1991-92 winter to roughly 950,000 in 1998-99, but these ski visit figures have been flat since then, although it appears that increasingly more Montanans are skiing. The role of Montanans is important in maintaining the infrastructure of the skiing industry as a base for a possible resurgence in out-of-state winter vacationers. (Source: Outlook 2002, University of Montana).
5. Changes in the Transportation Sector Reflect Changes in Montana’s Population and Economy An aging population and three strongly urbanizing counties, coupled with changes from commodity industries to trade, services, and financial sectors, as well as changes within the commodity sectors, have affected transportation in Montana. We can, in part, measure these changes by examining employment and income changes in various transportation industries in the state. In the 1990s:
• Trucking and warehousing increased by 22 percent in employment and 18 percent in income.
• Railroads declined two percent in both employment and income.
• Air transportation employment grew by 39 percent, with a 21 percent increase in income.
• Local and interurban transportation saw an employment growth of 30 percent and income growth of 18 percent.
6. Opportunities for Economic Diversification The major sectors upon which Montana’s economy has been dependent tend to be cyclical industries providing limited opportunities for employment and economic diversification. Montana must look to other sectors for economic diversification.
During the 1990s, Montana had 12 export-oriented industries that grew faster than the national average in employment over the decade and experienced a growth (after accounting for inflation) in gross state product. Engineering and management form services has a higher ratio of gross state product in Montana than in the national economy. While these industries are small in Montana, they indicate areas of growth potential. These industries may or may not continue to grow, and “rate of growth” can be misleading when comparing a large industry to a small one, or, in some cases, a tiny one. Nevertheless, Montana’s young industries have established a toehold in the state, and represent opportunities for growth. These industries are listed in Exhibit II-11.

Montana Department of Transportation – TranPlan 21 Economic Development Policy Paper
Page 20
Exhibit II–11: Growing Montana Export-Oriented Industries Finance, insurance, and real estate Industrial machinery Electrical equipment Chemicals Instruments Leather products Rubber and plastic products Transportation equipment Furniture Fabricated metal products Paper products Engineering and management services
D. Forecasts of Future Growth The Montana Department of Commerce purchases population and economic forecasts from NPA Data Services, Inc. The forecasts run to 2030 and include population by age group, employment at one-digit levels of the standard industrial classification system, and earnings of workers and proprietors in these sectors.12 The following subsections summarize our analysis of these forecasts.
1. Population is Forecast to Grow at the National Rate By 2030, the population of Montana is projected by NPA to increase to over 1.2 million, an overall growth rate of 29 percent from 2000. This is near the projected national growth rate of 30 percent for the same time period.
2. Montana Will Continue to Age Faster Than the U.S. As a Whole The population of Montana age 65 and over is projected to increase by over 110 percent compared to a national rate of 84 percent.
3. Population Growth Will Be Concentrated in the Urban Counties Uneven growth will continue across the State. The population in fast growth counties such as Flathead and Gallatin counties is projected to increase by over 75 percent; whereas other urban counties, such as Silver Bow and Cascade counties are projected to experience a negative population change from 2000 to 2030. The remaining urban counties (Lewis & Clark, Missoula, and Yellowstone counties) are projected to experience slow to moderate population growth during this time period.
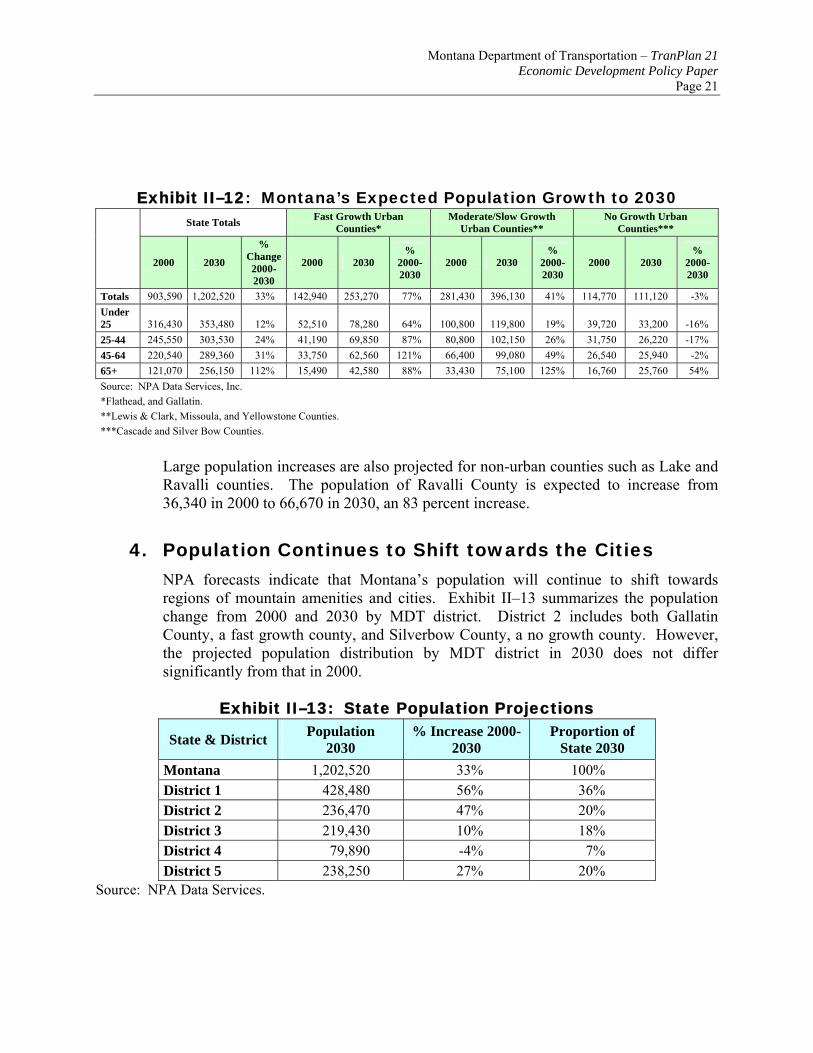
As shown in Exhibit II–12, the population of all age groups is expected to increase in Gallatin and Flathead counties. The age 45 to 64 group is projected to double, increasing by 121 percent from 2000 to 2030. In Lewis & Clark, Missoula, and Yellowstone counties, the population of all age groups is expected to increase with the
12 Department of Commerce Officials question the mining data provided by NPA. They believe that NPA may be undercounting this sector.
Montana Department of Transportation – TranPlan 21 Economic Development Policy Paper
Page 21
Exhibit II–12: Montana’s Expected Population Growth to 2030 State Totals Fast Growth Urban
Counties* Moderate/Slow Growth
Urban Counties** No Growth Urban
Counties***
2000 2030
% Change 2000-2030
2000 2030 %
2000-2030
2000 2030 %
2000-2030
2000 2030 %
2000-2030
Totals 903,590 1,202,520 33% 142,940 253,270 77% 281,430 396,130 41% 114,770 111,120 -3% Under 25 316,430 353,480 12% 52,510 78,280 64% 100,800 119,800 19% 39,720 33,200 -16% 25-44 245,550 303,530 24% 41,190 69,850 87% 80,800 102,150 26% 31,750 26,220 -17% 45-64 220,540 289,360 31% 33,750 62,560 121% 66,400 99,080 49% 26,540 25,940 -2% 65+ 121,070 256,150 112% 15,490 42,580 88% 33,430 75,100 125% 16,760 25,760 54% Source: NPA Data Services, Inc. *Flathead, and Gallatin. **Lewis & Clark, Missoula, and Yellowstone Counties. ***Cascade and Silver Bow Counties.
Large population increases are also projected for non-urban counties such as Lake and Ravalli counties. The population of Ravalli County is expected to increase from 36,340 in 2000 to 66,670 in 2030, an 83 percent increase.
4. Population Continues to Shift towards the Cities NPA forecasts indicate that Montana’s population will continue to shift towards regions of mountain amenities and cities. Exhibit II–13 summarizes the population change from 2000 and 2030 by MDT district. District 2 includes both Gallatin County, a fast growth county, and Silverbow County, a no growth county. However, the projected population distribution by MDT district in 2030 does not differ significantly from that in 2000.
Exhibit II–13: State Population Projections
State & District Population 2030
% Increase 2000-2030
Proportion of State 2030
Montana 1,202,520 33% 100% District 1 428,480 56% 36% District 2 236,470 47% 20% District 3 219,430 10% 18% District 4 79,890 -4% 7% District 5 238,250 27% 20%
Source: NPA Data Services.

Montana Department of Transportation – TranPlan 21 Economic Development Policy Paper
Page 22
5. Statewide Employment is Forecast to Grow Slowly, but Employment and Income From Services will Grow Faster than the National Rate The Montana economy is expected to grow by 220,000 jobs between 2000 and 2025, or 39 percent above its current employment base, generating income of over $9 billion, nearly doubling the State’s 2000 level (an increase of 96 percent in constant dollars is projected). Montana is projected to increase its national market share of the goods producing sectors of farming, mining, and manufacturing, as well as the retail sector, which is important to serve the visitor industry.
Projections over the 25-year period indicate that:
• Farm employment is expected to drop by 13 percent, but real farm income will rise by 25 percent. National totals are 13 percent and 22 percent, respectively.
• Mining employment is expected to rise by 47 percent, with income increasing by 106 percent. Nationally, mining employment is predicted to increase by 35 percent and income by 89 percent.
• Manufacturing employment is forecast to increase by 6 percent and earnings by 54 percent, which is greater than the national forecasts of a two percent rise in employment and 43 percent in income.
• Retail employment is forecast to grow 43 percent and income by 104 percent compared to national growth rates of 38 percent and 94 percent.
• Jobs in finance, insurance, and real estate are forecast to increase by one-third, and income to more than double. Nationally, job growth in this service sector will exceed Montana’s, growing at 39 percent, but national income growth will lag behind Montana at a 95 percent increase.
• Montana’s service sector will grow by 55 percent in employment and 124 percent in income. These rates are equivalent to national projections of 56 percent in jobs and 118 percent in income.
• Other sectors that by themselves are not significant drivers of transportation demand account for 66,000 of the predicted job gains in Montana (37 percent growth) and $5 billion in new income (93 percent growth).
6. Economic Forecasts Indicate Growth in the Value of Bulk Commodities to be Shipped Out of the State and an Increase in Manufactured Products that are Likely to be Trucked or Flown Out of the State Exhibit II–14 lists the major industries in Montana and potential manufacturing growth industries based on trends in the 1990s and forecast data. Large percentage increases are due to small bases of manufacturing output in 1998.

Montana Department of Transportation – TranPlan 21 Economic Development Policy Paper
Page 23
Exhibit II–14: Estimates of Montana’s Future Output in Selected Manufacturing Industries by 2025
Estimated Range of Output
by Value in 2025 ($millions)*
Lower Bound Percent Change in Value
1998-2025 Major Industries Farming 4,364 92% Wood products 1,881 – 2,520 55% Metal mining† Coal Mining‡ Oil mining§ Petroleum products§ Forestry Products║ Industries of Potential Growth Opportunity Food processing 985 – 1320 35% Furniture 186 – 250 511% Pulp and paper 437 – 586 59% Printing and publishing 499 – 669 132% Chemicals and allied 382 – 512 149% Rubber and plastic products 200 – 268 2329% Leather products 20 – 27 1731% Fabricated metal 195 – 261 239% Industrial machinery 1,091 – 1,462 703% Electrical equipment 137 – 183 256% Transportation equipment 325 – 436 695% Scientific instruments 142 – 190 421%
Source: Calculated by Economic Development Research Group, using economic sector forecasts from NPA Data Services, Inc. and extrapolation of 1980-88 detailed industry trends from U.S. Bureau of Economic Analysis.
*The lower bound of the range is a linear extension of 1990-98 output trends to 2025. The higher bound is scaled up so that the sum of all manufacturing industries agrees with NPA’s projected change in overall personal income generated by manufacturing sector in 2025.
†The mining sector is notoriously volatile and 1998 was a particularly poor year for metal mining and oil extraction. The metal mining industry is now thriving; oil, however, has not fared well recently.
‡The coal mining industry enjoyed a very strong decade. Projecting output from the 1990s on a straight line would result in a 541 percent increase of output value.
§Petroleum products is generally a strong industry in Montana, but the value of output fell in 1998, making extrapolation from that year particularly unreliable
║Forestry products is a strong industry in Montana that also had an off-year in 1998.

Montana Department of Transportation – TranPlan 21 Economic Development Policy Paper
Page 24
7. Economic Growth and Potential for Diversification is Concentrated in the Parts of Montana Experiencing Population Growth Exhibit II–15 shows the location of key commodity industries by the transportation district in which they are concentrated. A single asterisk (*) denotes the location of more than 20 percent of an industry and two asterisks (**) indicates the location of more than 50 percent of an industry. The small but growing industries are most concentrated in Districts 1 and 2.
Exhibit II–15: Locations Where Key Montana Industries Are Concentrated
Transportation District: 1 2 3 4 5 Largest Industries Farm Products * * * Forestry Products ** Metallic Mining ** Coal ** ** Fuel oils * * * Coal and petroleum products ** Wood Products ** Small but Growing Industries Printing & Publishing * * * Paper Products ** Food Products * * * Leather Products * * * Industrial Machinery ** Fabricated Metal * * Chemicals * * * Furniture * * * Rubber & Plastics * * * Electrical Equipment ** Instruments * * Transportation Equipment ** * Source: U.S. Departments of Commerce, Bureau of Economic Analysis, with estimates of withheld data provided by Minnesota Implan Group.
Montana Department of Transportation – TranPlan 21 Economic Development Policy Paper
Page 25
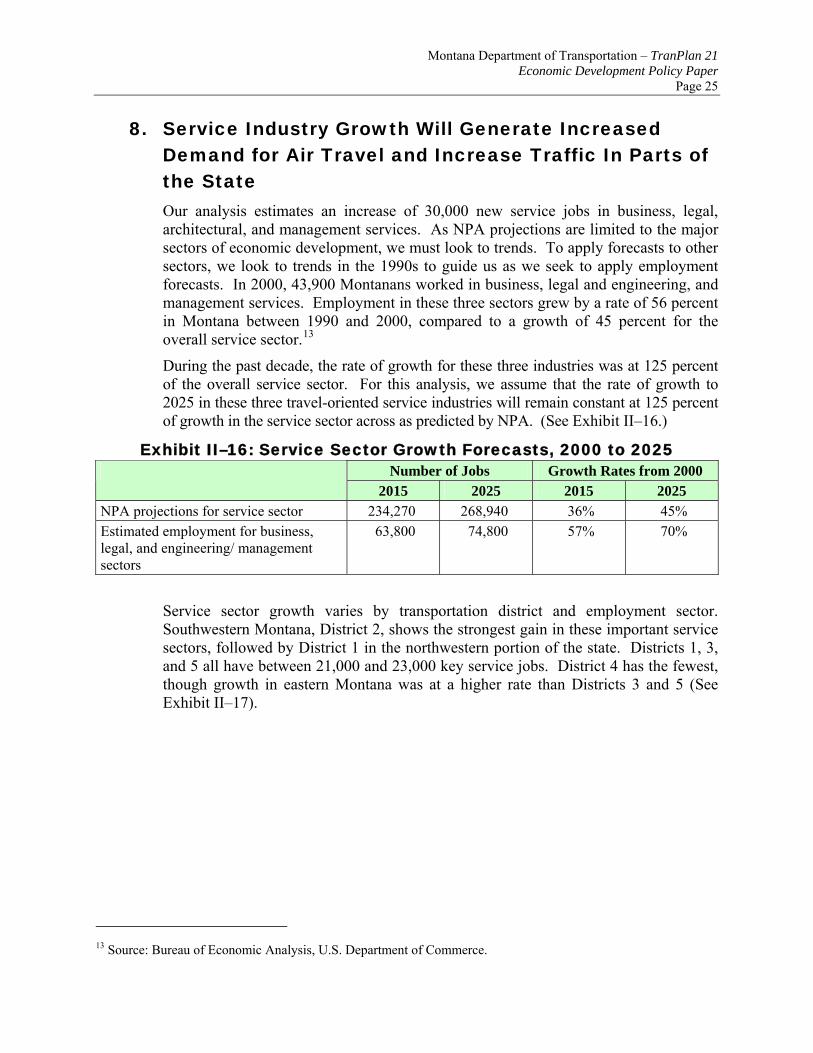
8. Service Industry Growth Will Generate Increased Demand for Air Travel and Increase Traffic In Parts of the State Our analysis estimates an increase of 30,000 new service jobs in business, legal, architectural, and management services. As NPA projections are limited to the major sectors of economic development, we must look to trends. To apply forecasts to other sectors, we look to trends in the 1990s to guide us as we seek to apply employment forecasts. In 2000, 43,900 Montanans worked in business, legal and engineering, and management services. Employment in these three sectors grew by a rate of 56 percent in Montana between 1990 and 2000, compared to a growth of 45 percent for the overall service sector.13
During the past decade, the rate of growth for these three industries was at 125 percent of the overall service sector. For this analysis, we assume that the rate of growth to 2025 in these three travel-oriented service industries will remain constant at 125 percent of growth in the service sector across as predicted by NPA. (See Exhibit II–16.)
Exhibit II–16: Service Sector Growth Forecasts, 2000 to 2025 Number of Jobs Growth Rates from 2000
2015 2025 2015 2025 NPA projections for service sector 234,270 268,940 36% 45% Estimated employment for business, legal, and engineering/ management sectors
63,800 74,800 57% 70%
Service sector growth varies by transportation district and employment sector. Southwestern Montana, District 2, shows the strongest gain in these important service sectors, followed by District 1 in the northwestern portion of the state. Districts 1, 3, and 5 all have between 21,000 and 23,000 key service jobs. District 4 has the fewest, though growth in eastern Montana was at a higher rate than Districts 3 and 5 (See Exhibit II–17).
13 Source: Bureau of Economic Analysis, U.S. Department of Commerce.

Montana Department of Transportation – TranPlan 21 Economic Development Policy Paper
Page 26
Exhibit II–17: Employment in Key Services by District
FIRE Pro. Services Hotel Totals Urban Counties
District 1 -17% 92% 18% 41% Flathead, Missoula District 2 49% 78% 80% 70% Gallatin, Silver Bow District 3 21% 55% -7% 34% Lewis & Clark, Cascade District 4 9% 62% 48% 37% None District 5 24% 36% 36% 32% Yellowstone Statewide 14% 63% 34% 41% Source: U.S. Departments of Commerce, Bureau of Economic Analysis, with estimates of withheld data provided by Minnesota Implan Group. Note: FIRE is Finance, Insurance, and Real Estate. “Hotel” is Hotel and Lodging Places. “Pro. Services” is the total of four service sectors: Professional Services, Business Services, Legal Services, and Educational Services.
9. Montana’s International Exports Performed
Significantly Better Than Other States’ Exports Through the Port of Sweet Grass The ports of Sweet Grass in Montana and Coutts in Alberta on the Canadian side of the border connect Montana with Calgary and Edmonton. These ports comprise by far the dominant route for Montanan-Canadian trade, handling 75 to 80 percent of imports into Montana and exports from Montana. The Port of Sweet Grass is on I-15 (approximately 35 miles north of Shelby). I-15 also directly connects Sweet Grass with Great Falls (116 miles from the Port), Helena (204 miles), and Butte (268 miles). Butte and Shelby connect the Port of Sweet Grass to Montana’s principal international truck freight routes of I-90 and I-15, respectively.
• Major ports in Montana Goods originating in the 50 states and Puerto Rico pass through the Port of Sweet Grass into Canada. The leading originating state is Texas, which is the origin of 29 percent of the value of goods exported through the Port, followed by California, Oklahoma, and Illinois. Montana ranks fifth. In 2000, Montanans sent $163.3 million of cargo through Sweet Grass, accounting for about 5 percent of exports from that Port. Montana, however, saw an increase of 83 percent (in nominal dollars) of the value of its exports from 1997 through 2000. As Exhibit 11-18 shows, Montana’s rate of growth is 20 times higher than the Port average and is significantly higher than goods originating from other states. Moreover, the value of Montanan goods exported through Sweet Grass accounts for more than 30 percent the State’s foreign shipments.

Montana Department of Transportation – TranPlan 21 Economic Development Policy Paper
Page 27
Exhibit II–18: Goods Exported through the Port of Sweet Grass
State of Origin Annual 2000 Percent of Total in 2000
Change 1997-2000, Nominal $s
Change 1997-2000
(Constant 1997 $)Texas $1,002,525,083 29% 16% 8% California 544,552,933 16% 39% 30% Oklahoma 200,682,284 6% -2% -9% Illinois 172,285,839 5% -33% -38% Montana 163,298,843 5% 83% 71% Other States 1,346,813,881 39% -10% -16% Total All States $3,430,158,863 100% 4% -3% Source: Massachusetts Institute for Social and Economic Research.
Based on interviews, it appears that four other ports along the Canadian border in Montana are significant to the state. The two other 24-hour truck ports on the Canadian border are Raymond in eastern Montana (District 4), and Roosville (District 1), which is the only port between the continental divide and Idaho. The Port of Roosville recently upgraded its facilities and primarily services the lumber industries on both sides of the border. U.S. customs has a deliberate policy of funneling imports to Sweet Grass and Raymond. The Port of Piegan, just east of the divide on Route 89 (District 3 in Glacier County), has 5 to 10 percent of the activity seen in Sweet Grass, according to a U.S. customs official. Just west of Piegan, at Glacier National Park, is the Port of Chief Mountain, open from May through September. This port transports very little cargo, but is a major tourist and visitor route into Montana.
10. Transportation Implications In summary, Montana’s primary industries and the potential growth industries in the state include the following characteristics.
• Major industries in the state are based on extraction of natural resources and produce bulk commodities: farm products, forestry products, coal and metal mining, lumber and oil, and gas.
• Montana’s major and growing industries include manufacturers of natural resources: petroleum and coal products, wood products, food and kindred products, chemicals, rubber and plastics, leather products, paper products, and furniture.
• Some of Montana’s small and growing sectors are manufacturers of technology products, through not necessarily high tech, including industrial machinery, fabricated metal products, electrical/electronic equipment, transportation equipment, and instruments.
• Additional major and growing industries serve tourism, as well as internal demand: eating and drinking establishments, hotels and lodging places and amusements,

Montana Department of Transportation – TranPlan 21 Economic Development Policy Paper
Page 28
and technology products. Other industries are positioned to export services: engineering and managerial services, finance insurance, and real estate.
These trends have the following implications for Montana’s transportation system:
• The transportation system must continue to meet the needs for shipping high volume and low value commodities.
Looking at all modes of transportation, Montana shipped 0.9 percent of tonnage originating in the United States in 1997, but Montana’s shipments accounted for only 0.2 percent of the value of national commodity flows. This indicates an economy based on high volume and low value. Exhibit II–19 below lists commodities shipped in the United States and Montana that accounted for more than 2.5 percent of the value of shipments in their respective economies. Note that more commodity industries in Montana supply 2.5 percent of value to the state economy than industries do in the national economy. Note also, however, that the dominant industry listed below for the United States is electronics, which provides more than 12 percent of the value of all shipments nationally, and 2.9 percent in Montana. Coal accounts for 57 percent of all tonnage originating in Montana, but less than five percent of the value of these shipments.

Montana Department of Transportation – TranPlan 21 Economic Development Policy Paper
Page 29
Exhibit II–19: Montana Commodities by Value of Shipment, 1997 United States Montana
Commodity % of Total Value
Shipped
Commodity % of Total Value
Shipped Electronic/other electrical equipment and components and office equipment
12.5 Gasoline and aviation turbine fuel 12.2
Motorized and other vehicles (including parts)
8.2 Wood products 9.9
Miscellaneous manufactured products 6.1 Fuel oils 5.5 Machinery 6.0 Other prepared foodstuffs and fats and
oils 5.2
Textiles, leather, and articles of textiles or leather
5.5 Base metal in primary or semi-finished forms and in finished basic shapes
4.9
Other prepared foodstuffs and fats and oils
5.0 Cereal grains 4.8
Base metal in primary or semi-finished forms and in finished basic shapes
4.1 Coal 4.6
Plastics and rubber 4.0 Machinery 4.6 Printed products 3.7 Mixed freight 4.3 Mixed freight 3.3 Coal and petroleum products, n.e.c. 3.2 Articles of base metal 3.3 Miscellaneous manufactured products 3.1 Pharmaceutical products 3.2 Printed products 2.9 Gasoline and aviation turbine fuel 3.1 Electronic and other electrical
equipment and components and office equipment
2.9
Chemical products and preparations, n.e.c.
3.0 Metallic ores and concentrates 2.9
Meat, fish, seafood, and their prep. 2.6 Motorized and other vehicles (including parts)
2.7
Miscellaneous manufactured products 3.1 Printed products 2.9 Source: 1997 Commodity Flow Survey for Montana and the United States. Note: Commodities listed account for more than 2.5% of value of shipment originating from the U.S. and Montana.
Montana Department of Transportation – TranPlan 21 Economic Development Policy Paper
Page 30
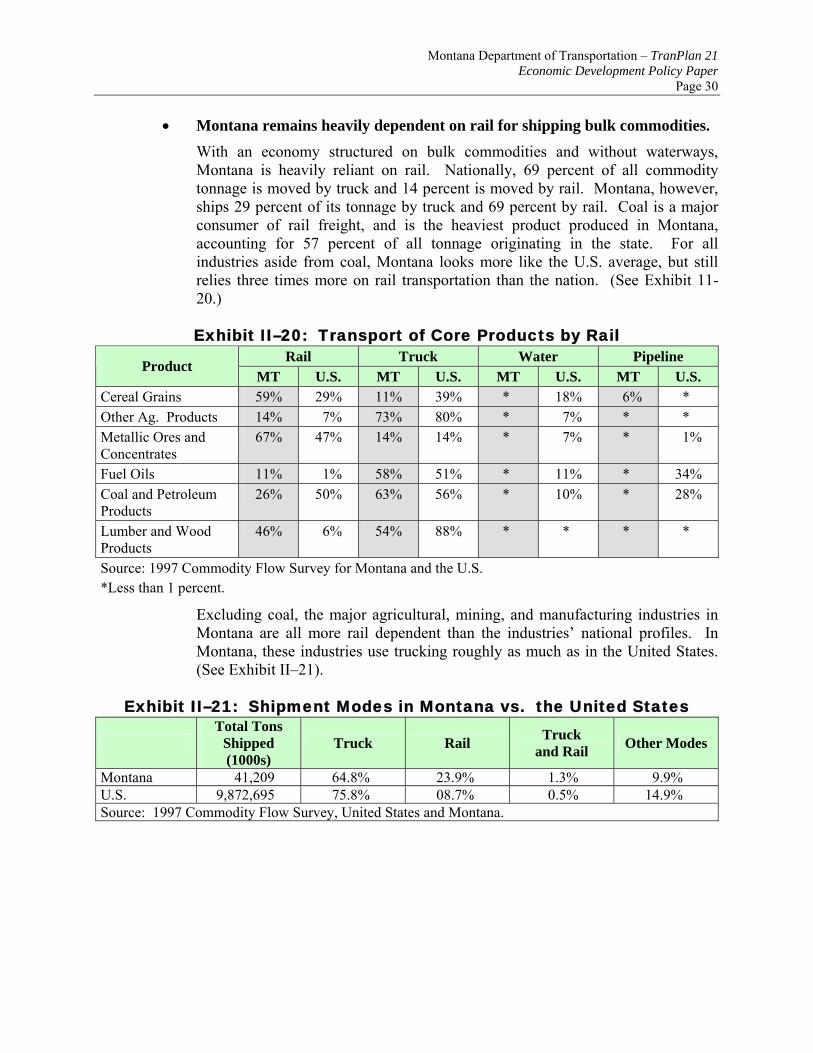
• Montana remains heavily dependent on rail for shipping bulk commodities. With an economy structured on bulk commodities and without waterways, Montana is heavily reliant on rail. Nationally, 69 percent of all commodity tonnage is moved by truck and 14 percent is moved by rail. Montana, however, ships 29 percent of its tonnage by truck and 69 percent by rail. Coal is a major consumer of rail freight, and is the heaviest product produced in Montana, accounting for 57 percent of all tonnage originating in the state. For all industries aside from coal, Montana looks more like the U.S. average, but still relies three times more on rail transportation than the nation. (See Exhibit 11-20.)
Exhibit II–20: Transport of Core Products by Rail Rail Truck Water Pipeline
Product MT U.S. MT U.S. MT U.S. MT U.S.
Cereal Grains 59% 29% 11% 39% * 18% 6% * Other Ag. Products 14% 7% 73% 80% * 7% * * Metallic Ores and Concentrates
67% 47% 14% 14% * 7% * 1%
Fuel Oils 11% 1% 58% 51% * 11% * 34% Coal and Petroleum Products
26% 50% 63% 56% * 10% * 28%
Lumber and Wood Products
46% 6% 54% 88% * * * *
Source: 1997 Commodity Flow Survey for Montana and the U.S. *Less than 1 percent.
Excluding coal, the major agricultural, mining, and manufacturing industries in Montana are all more rail dependent than the industries’ national profiles. In Montana, these industries use trucking roughly as much as in the United States. (See Exhibit II–21).
Exhibit II–21: Shipment Modes in Montana vs. the United States
Total Tons
Shipped (1000s)
Truck Rail Truck and Rail Other Modes
Montana 41,209 64.8% 23.9% 1.3% 9.9% U.S. 9,872,695 75.8% 08.7% 0.5% 14.9% Source: 1997 Commodity Flow Survey, United States and Montana.

Montana Department of Transportation – TranPlan 21 Economic Development Policy Paper
Page 31
• Economic diversification and service sector growth will increase demand for truck transportation. Measured by tonnage shipped, trucking is the dominant transportation mode of those small goods producing industries in Montana that grew faster than the national rate during the 1990s. Service sector growth will increase demand for truck transportation.
• Intermodal package delivery is required by growth industries. Growth industries within Montana use trucking and truck-air intermodal transport services. Air transportation and “parcel services, U.S. Post Office and couriers,” which contain both air and trucking components, will become increasingly important in shipping lightweight, high value goods. To illustrate this, Exhibit 11-22 provides the national rates because state data for many of the small Montana industries are not revealed. Note the dramatic difference in percentage trucked for both instruments and electronics when comparing tonnage to value by mode.
Exhibit II–22: National Transportation Patterns during the 1990s By Tons By Value
Commodity Truck Rail Air Truck Rail Air
Parcel, U.S.
Postal Service/ Courier
Electrical/electronic 85% 1% 2% 56% – 10% 28% Instruments 68% – 5% 37% – 11% 48% Rubber/Plastics 75% 19% – 79% 8% 1% 8% Furniture 94% 1% – 91% – 1% 5% Paper Products 78% 18% – 83% 10% – 3% Machinery 88% 2% 1% 77% 2% 3% 13% Chemicals 53% 27% – 66% 8% 2% 15% Leather Products 77% – 1% 63% – 2% 30% Transp. Equipment 71% 15% – 59% 12% 9% –
• Increased air travel to deliver producer services and increased regional travel demand to deliver and consume services.
Industries that generate significant business travel are found within the sectors of finance, insurance, real estate, and services. These sectors all showed robust gains in Montana – the State showed indications of catching up to the national profile in these sectors. Employment in finance, insurance and real estate, and engineering and management services outpaced national growth in the 1990s by 31 percent to 22 percent in the former and 53 percent to 29 percent in the latter. These industries are all forecast to grow considerably over the next 20 years.

Montana Department of Transportation – TranPlan 21 Economic Development Policy Paper
Page 32
These services generate considerable business-related travel. Travel is required to deliver the services and often to purchase the services. In Montana, this probably means growing air travel into and out of the most rapidly urbanizing counties where these businesses are located.

Montana Department of Transportation – TranPlan 21 Economic Development Policy Paper
Page 33
III. Economic Development Issues
The technical analysis detailed above and the TranPlan 21 public and stakeholder issue identification provide the agenda of plan update issues addressed in this policy paper. These issues are summarized in this section.
A. Issues Raised by the Public, Stakeholders, and Industry Representatives The TranPlan 21 process used survey results, stakeholder meetings, public open houses, and other information sources to identify issues of importance to Montanans to be addressed in the plan update. The overall results from this issues identification process are presented in a separate document. The issues raised that specifically relate to MDT’s role in economic development are summarized below.
1. MDT’s Role • Economic development should become a factor in MDT’s transportation
investment decisions. Input indicated that Montanans want MDT to consider economic development in project selection and prioritization. In most parts of the state, there is a general sentiment that the transportation system is not a barrier to economic development.
• MDT needs to produce more detailed economic impacts and benefits studies. Public input expressed concern that MDT should consider economic benefits versus costs in making investment decisions. MDT should be cautioned not to make politically driven investment decisions that are not the best use of public funds.
• Montanans’ top priorities for MDT’s role in economic development are:
− Improving commercial air service to Montana.
− Funding projects to boost business relocation to Montana.
− Maintaining or updating Montana’s existing transportation system.
Surveys and public input identified these priorities for economic development action.
• Retain existing and promote new freight rail service to support the Eastern Montana economy. There is considerable concern that Montana will experience a new round of branch line closures as the rail industry consolidates grain terminals. Further,

Montana Department of Transportation – TranPlan 21 Economic Development Policy Paper
Page 34
many in the agricultural industry are concerned about their shipping costs and level of rail service. There is strong interest in identifying governmental actions to preserve rail service and to enhance competition.
• Montana agricultural interests remain concerned about lack of competition with the BNSF. A large majority of the grain shipped from Montana is transported by the Burlington Northern Santa Fe (BNSF) Railroad. The cost of shipping represents about one-third of the value of the crop. Grain producers are interested in opportunities to increase competition and reduce rates. This issue is being addressed by the Governor’s Office. BNSF believes that there is competition with motor carriers and that they are responsive to their customers and the marketplace.
• The Montana agriculture industry needs support from MDT in the effort to control noxious weeds. MDT’s past plans to control noxious roadside vegetation have recently been integrated. MDT is in the process of developing a statewide Integrated Roadside Weed Management Strategy. It is in draft form and will be completed by February 2003. This Strategy puts into action and is based on The Montana Weed Management Plan (2001) and the National Invasive Species Management Plan (2001). The development process is being done with the help of Montana Weed Control Association (MWCA) and the Montana Department of Agriculture.
• Two-lane highways should be expanded to four lanes to attract business. Through public involvement surveys and at some of the open houses, the desire to expand two-lane highways to four lanes to promote economic development was expressed. However, other participants in these meetings are concerned that such activities would offer limited economic benefit and take resources from meeting other, more pressing highway needs.
• Economic growth in urban areas is different from economic growth in rural areas; infrastructure alone does not guarantee economic development. There appears to be recognition by a number of transportation stakeholders that building roads will not in itself result in economic development. Therefore, MDT’s role can be most effective in creating an environment that supports economic development by managing the existing system efficiently and exercising its administrative responsibilities with the needs of business in mind.
• MDT’s continued support for Missouri River ferries is critical to rural economics.
Without MDT support, the Missouri River ferries might cease operating, which would negatively impact local economics.

Montana Department of Transportation – TranPlan 21 Economic Development Policy Paper
Page 35
2. Tourism • MDT should give short-term consideration to accommodate visitors and
residents during Lewis and Clark Bicentennial. Since the Bicentennial may bring in 6-8 million more visitors to Montana between 2003 and 2006, the transportation system must be ready.
• Better directional signage would help tourism. Current signage is not effective at drawing people off the highways and into Montana’s communities and businesses.
• Rest areas need to be open year-round and should offer more amenities, such as visitor information kiosks and Internet access. There is considerable stakeholder belief that MDT should do more to enhance the visitor experience and support tourism through the operation of rest areas.
• A scenic byway program promoting Montana’s uniqueness could attract tourism and more funding. There are a number of initiatives that aim to increase the length of time visitors stay in the State by attracting them to additional destinations. Identifying, enhancing, and marketing scenic routes are initiatives that the visitor industry is seeking to pursue.
B. Economic And Growth Issues Raised By Technical Analysis The technical analysis identified the following issues to be considered in TranPlan21.
• The principal transportation-related barrier Montana industry faces is distance from markets. The economic analysis demonstrated that the primary transportation-related competitive disadvantage that Montana faces is its distance from markets. The current transportation system provides an extensive network for getting products to markets. There do not appear to be any corridor or segment-level capacity constraints on this network. Analysis indicates that the highway system does not provide any significant barriers to the performance of Montana’s basic industries. Growth forecasts indicate that future constraints will occur in Montana’s most urban counties.
Further, economic growth analysis indicates that in Montana’s lagging regions new infrastructure is unlikely to eliminate the competitive disadvantages of these areas, namely the size of and level of skills in the work force, the long distance to market, and the scarcity of inputs and access to raw materials. MDT is undertaking a Highway Reconfiguration Study that will examine this issue in more detail.

Montana Department of Transportation – TranPlan 21 Economic Development Policy Paper
Page 36
• Montana’s basic industries are heavily dependent on motor carrier and rail services in the existing transportation system. Montana industry ships large volumes of low value, bulk commodities. The cost of shipping is a high proportion of the costs of doing business. Montana has a strong interest in ensuring that it has a regulatory and administrative environment that supports motor carrier efficiency. Current industry is dependent on the efficient use of the existing transportation system. Basic industries are becoming more productive as agricultural and mining output has increased with decreasing employment levels.
• Montana has a strong policy interest in the preservation of rail services to support existing industry. TranPlan 21 analysis indicated the continued importance of rail services to Montana’s economy. This is most notable for mining and agricultural commodities.
• To support economic development Montana will need to expand the transportation system in the faster growing parts of the State. Growth over the next 20 years will be concentrated in those communities that are already the fastest growing. Further, the industries that offer the greatest opportunities for diversification are most likely to locate in these areas. Therefore, there will be transportation system development needs to make these locations competitive and to accommodate the growth that occurs there.
• The modal implications of economic growth trends are increased importance of:
− Package delivery and highway freight.
− Air-highway intermodal freight.
− Air transportation service.
Montana’s faster growing industries and those that offer the best prospects for economic diversification will generate increased demands for truck and air transportation.
• Through planning, investment, and policy action, Montana will need to ensure that new requirements for motor carriers, air transportation, and intermodal services are addressed. Analysis indicates that manufacturing growth and service economy growth will require a transportation system that continues to allow efficient freight mobility as growth occurs. In addition, MDT will need to address new intermodal demands as they occur. This will likely include both air-truck and truck-rail connectivity.
• Growth will be concentrated in the most urban counties requiring corridor planning and management. Economic and population growth analysis indicates that growth will be geographically concentrated and that MDT will need to ensure effective corridor planning and management to accommodate this growth and maintain mobility.

Montana Department of Transportation – TranPlan 21 Economic Development Policy Paper
Page 37
IV. Policy Goals and Actions
This section lists the actions that MDT could take to address issues raised by the technical analysis and stakeholder input. These actions that support economic development are as follows:
• Supportive actions: these are actions to help retain the existing foundations of the economy by preserving efficient operation of the transportation system.
• Reactive actions: these are actions that are demand-driven. They respond to new needs created by the ongoing economic transitions that Montana is experiencing.
• Proactive actions: these are actions that seek to maximize new economic opportunities. They involve investing in strategic improvements to the transportation system and supporting state and local economic development initiatives to generate economic diversification.
• Informational actions: these are actions that clarify and communicate what transportation investments can and cannot accomplish in support of economic development.
• Institutional actions: these are the organizational actions necessary for MDT to strengthen its capacity to support economic development.
The roles that MDT can take to support economic development fall into three categories:
• Investments in transportation infrastructure. These investments are constrained by state and federal law depending on the funding source.
• Policy support and advocacy. This role does not involve funding a particular mode but involves advocacy or other measures to support the State’s policy objectives. For example, supporting the federal Essential Air Service program would fall under this category.
• Technical support, administration, and coordination. This role does not involve direct investment but administrative and technical support.
The following policy goals and actions were adopted in the TranPlan 21:
POLICY GOAL A: Preserve the efficient functioning of the transportation system used by Montana’s export-oriented (“basic”) industries to access regional, national, and international markets.
Purpose: Preserve the existing transportation network used by the traditional backbones of the state’s economy: coal and metal mining, forestry, lumber products, and agriculture.
Rationale: Montana’s large and mature resource industries generate the major freight travel in Montana. This policy goal recognizes that Montana has an extensive highway and

Montana Department of Transportation – TranPlan 21 Economic Development Policy Paper
Page 38
rail system with adequate capacity to meet the transportation needs of Montana’s basic industries. MDT’s goal is to preserve this system while addressing the infrastructure needs required to accommodate growth and advance the economic diversification opportunities identified in the TranPlan 21 analysis.
ACTION A.1. Work with Montana industry and shippers on a continuing basis to identify infrastructural, regulatory, and administrative barriers to their efficient use of the transportation system.
MDT should conduct an annual survey or hold annual focus group discussions with representatives of Montana’s basic industries, the motor carrier industry, the railroad industry, and other shippers that serve these industries to identify regulatory, administrative, and infrastructure constraints. It would also enable identification of emerging needs or issues based upon trends in these industries. These constraints would be identified annually and an action plan specified for addressing them through MDT’s existing business processes. The action plan could only address those issues that fall under MDT’s jurisdictional authority.
ACTION A.2. Use input from A.1 and technical analysis to identify the freight mobility needs of Montana’s basic industry on the segments of the state highway system where growth is forecast and specify strategies for addressing these needs.
This action addresses the degradation of level of service that is forecast for a number of the major arterials that pass through Montana’s major cities. This degradation will increase travel time, reduce reliability, and increase user costs. It is in these areas that, over the TranPlan 21 horizon, growth will have the greatest impact on the productivity of the transportation system. This action should target investment in those areas where travel time and reliability will be reduced due to growth and land development patterns. Freight-specific strategies include building truck bypasses, designating truck routes, and preserving arterials in the growing areas abutting Montana’s larger cities. MDT’s access management initiative can also support this action. The Reconfiguration Study can identify types of improvements likely to provide the most economic benefits.
ACTION A.3. Continue to provide state-level leadership and pursue opportunities in regional initiatives to increase the productivity of the motor carrier industry.
MDT should continue to participate in and initiate state and regional initiatives such as the creation of a regional uniform truck size and weight scenario that will increase the productivity of the motor carrier industry and reduce the shipping costs to their customers. This action also includes MDT’s ongoing investments in weigh-in-motion facilities and other initiatives to improve the efficiency of MDT’s administrative and regulatory role with respect to motor carriers.
An element of this action would evaluate opportunities to provide price competition with freight rail for grain shipment. Issues to consider are:

Montana Department of Transportation – TranPlan 21 Economic Development Policy Paper
Page 39
• Evaluating special projects to provide access to additional transportation sources, such as the Columbia – Snake River.
• Evaluating Motor Carrier productivity policy issues.
The intent is to determine options available that could increase competition.
ACTION A.4. Conduct quarterly meetings with rail industry representatives, monitor developments in the industry, and work with the industry where possible to preserve the existing rail system.
This action recognizes that Montana’s basic industries are dependent on rail. The competitiveness and profitability of Montana exporters is greatly affected by their access to rail and the cost of rail transportation. Further, output levels and shipment volumes have increased. Rail services are provided by private industry. However, Montana’s shippers are concerned about the impact that current operational decisions and the continuing reorganization in the rail industry has on rail services. This action will involve dialogue between rail providers and the State. Through this dialogue, areas of common interest between the industry, shippers, and the State can be identified. The intent of the action is to identify opportunities for communities, the State, and the railroads to partner in order to preserve the existing system and improve the services available to Montanans.
The dialogue is intended to provide a forum for issues regarding:
• Future of branch lines
• Intermodal pricing practices
• Opportunities for backhaul into Montana
ACTION A.5. Update the State rail plan to identify potential highway and rail service impacts arising from structural change in the rail industry, and define governmental actions to address them that will support economic development.
This action recognizes that the State, through MDT, has a continuing interest in rail planning. Such planning recognizes that the rail infrastructure and rail services are provided by private enterprise. In Montana and nationally, there has been a trend for government to be less involved in rail transportation. The action recognizes that the investment and operating decisions of the rail industry impact the economies of Montana communities as well as MDT’s management of the highway system. The action will identify the intermodal needs arising from the consolidation of grain elevators and the hauling of grain longer distances to these elevators.

Montana Department of Transportation – TranPlan 21 Economic Development Policy Paper
Page 40
ACTION A.6. Provide technical support to Montana communities and airport operators to preserve the federal Essential Air Service Program in cooperation with the Governor’s Task Force.
This action involves MDT’s technical support and state-level leadership, in cooperation with the Governor’s Essential Air Service task force, to advocate for the continuation of the Essential Air Service passenger subsidies. The federal government provides these subsidies to Big Sky Airlines for air service to communities in Montana.
POLICY GOAL B: Monitor and address capacity needs arising from Montana’s economic growth trends.
Purpose: To respond to emerging transportation investment needs for the coming decade.
Rationale: TranPlan 21 analyses indicates that the greatest growth of jobs and income is in industries that produce higher value added products, typically in smaller plants, often located on the fringe or outside of Montana’s urban centers. While that trend is starting from a relatively small core of manufacturing activity in the state, it is already emerging as one of the most visible elements of new economic growth for Montana. In addition, over the next 20 years, service employment of all types will be the fastest growing part of the economy. This policy aims to provide a planned response to these trends.
Many of these new industries have specialized products and services with national (or in some cases, international) markets. This trend, together with increasing national markets for manufactured products, is shifting needs for freight movement.
ACTION B.1. Specify strategic economic development transportation linkages based on emerging travel demands and findings from the Highway Reconfiguration Study.
The action is to identify the infrastructure network required to meet the emerging travel demands on Montana’s economy. The action is not to define system-level development objectives, such as divided highways, but performance standards for the productivity or efficiency of the transportation system. MDT’s congestion management system would provide the starting point for this analysis because it identifies those parts of the network that have the most demand-driven capacity constraints. The findings from the Reconfiguration Study may also identify demand-driven transportation needs to support this analysis. The Highway Economic Analysis Tool (HEAT) and other analysis tools developed for the Highway Reconfiguration Study will also be used for this analysis.
This action involves MDT defining “strategic transportation linkages for economic development.” The action should incorporate multi-modal corridors and facilities that connect major locations for Montana’s core industries and its projected growth industries. It should be designed on the basis of performance standards for highway access (in terms of intercity travel times, reliability, and routing circuitry), airport access (in terms of access roads and capabilities for handling corporate jets, and travel in nighttime, winter, and

Montana Department of Transportation – TranPlan 21 Economic Development Policy Paper
Page 41
inclement weather), rail access (in terms of areas served and locations of intermodal facilities), and international transportation (including access to and capabilities of airport, highway, and rail trans-border movements). The focus on reliability includes the ability of time-sensitive trucks to pass tractors, slower-moving vehicles, and traffic accidents in a timely manner.
There are examples of such strategic economic development transportation networks. They include Illinois DOT’s Economic Corridors (Lifelines Program), Georgia DOT’s and Mississippi DOT’s Economic Development Highways, Wisconsin DOT’s Corridors 2020 and TransLinks, and Minnesota DOT’s Interregional Corridors Plan. Each of these networks defines a priority intercity (trunk highway) network, and then determines road width needs to handle heavy trucks, serve rail and air intermodal transport hubs, and ensure high reliability of vehicle flows along those inter-city links. The Wisconsin system goes further as the state airport system plan is currently being integrated with state highway planning. This action would be crafted in a way applicable to Montana. Until resources allow for specification of strategic transportation linkages for economic development, Montana’s designated National Highway System is the core of this program.
ACTION B.2. Identify and address deficiencies in the strategic transportation network.
This action encourages the continued communication and coordination with leaders of growth industries and local governments. MDT will continue to participate in and support interagency working groups similar to that with MEDA and the DOC and use them as a continuous and cooperative forum for early identification of transportation system needs throughout the state.
This action can be accomplished through dialogue with leaders of growth industries to determine their needs and obtain input on strategies to address them. The action item also includes working with local entities to identify deficiencies in the strategic transportation system. These efforts would be further supported through technical analysis to forecast travel demand on the network. The deficiencies could be addressed through construction, advocacy, or policy changes. The action would be coordinated with local economic development organizations, MPOs, and local jurisdictions.
ACTION B.3. Consider economic development in the evaluation for prioritizing and scoping highway reconstruction projects.
The intent of this action is that MDT, when prioritizing reconstruction projects, with “other things being equal,” would prioritize projects based upon their importance for economic development. Implementation will require establishing clear performance criteria for evaluating economic development impacts. To be consistent with TranPlan 21 recommendations, these criteria should focus on whether or not the project addresses a deficiency in the strategic network, a user cost savings, or a travel time reliability enhancement. MDT will use the Highway Economic Analysis Tool (HEAT) to analyze relative economic benefits.

Montana Department of Transportation – TranPlan 21 Economic Development Policy Paper
Page 42
Currently, when reconstruction projects are designed, they are designated as either “reconstruction” or “reconstruction with capacity.” This and other models will also consider the economic efficiency of a well maintained strategic network. Projects designated as “reconstruction with capacity” should be able to demonstrate either a user cost savings or travel time reliability savings.
POLICY GOAL C: Support state and local economic development initiatives to maximize new economic opportunities.
Purpose: To support Montana’s state-level economic development initiatives within established policies and practices.
Rationale: MDT is not an economic development agency and does not set economic development policy; transportation demand arises from the level of economic activity in Montana.
The TranPlan 21 analysis identified a number of industries that are expected to have high growth nationally. In Montana, these industries are small but showing signs of higher than average growth potential. They include food products, computer technologies, web and telephone based financial service centers, machinery/fabricated metal products, electronics/instruments manufacturing, and chemical/plastic products. The web site for the Governor's Office of Economic Opportunity also highlights many of these same industry sectors in its promotion of “Montana Success Stories.” This policy goal will be implemented through actions that MDT takes to support economic development initiatives aimed at business attraction and retention.
ACTION C.1. Continue to support business retention, recruiting, and other related activities of the Governor's Office of Economic Opportunity, Montana Economic Developers Association (MEDA), Certified Regional Development Corporations (CRDCs), and the Montana Department of Commerce (MDOC).
MDT will support the actions of the Governor’s Office of Economic Opportunity to implement its strategic plan. In addition, MDT will also support actions of MEDA, CRDCS, and the DOC. The action will ensure that MDT’s plans and investments will support Montana’s economic development strategy. The success of business retention and recruiting efforts to diversify Montana’s economy and attract new growth industries will depend on how well the state is seen as meeting the needs of those industries. A major consideration in locating businesses is how well a candidate location rates in terms of (1) access to an appropriately skilled and stable workforce, (2) reliable access to materials, other inputs, and business partners at a reasonable cost, and (3) reliable access for delivery of products and services to outside national/international customer markets in a timely manner. Transportation access features are typically key considerations. MDT is in a position to support and enhance business attraction efforts, though it can do so only if

Montana Department of Transportation – TranPlan 21 Economic Development Policy Paper
Page 43
transportation planning efforts (for multi-modal access linkages and terminals/nodes) are well coordinated with economic development efforts.
This latter issue pertains to the fact that state business recruiters routinely work on a confidential basis with businesses that are considering locating or expanding in a state to help them identify available buildings, sites, and communities. In a growing number of states, the economic development agency identifies key site locations for targeted industries and formally develops lists of places that meet those needs. A problem arises because a number of outside businesses are requesting sites along four-lane roads only, and the economic developers are obliging them by only selecting such sites. Although well meant, this undermines MDT’s plans for high-quality two-lane roads with shoulders, and it can reinforce regional economic disparities associated with the locations of two-lane versus four-lane roads. Only a coordinated dialogue can ensure that both economic development efforts and transportation investment decisions are made in a mutually reinforcing manner.
ACTION C.2. Investigate establishing an economic opportunities program to help fund roadway projects that support business attraction and retention efforts.
This action would investigate the feasibility of using a portion of MDT’s state highway funds to finance projects that support job creation and/or retention. The action would use state funds to support business retention and attraction efforts. If found feasible and funding permits, the funds would be available to assist state and local economic development officials attract and retain business. The funds would be used flexibly to meet emerging needs. For example, the construction of improved highway access into an industrial site may be a deal-maker for business attraction and the program would provide funds to do this. The funding program will establish standards to evaluate projects based upon employment created, income generated, and the leverage of private and other public investment by MDT dollars.
Due to restrictions in state law, only highway projects will be eligible for funding through the program. These projects would not be restricted to the state system. All projects would require financial participation by the facility owner or operator. This will help ensure a strong local commitment to the project. The program should be administered with the understanding that funds will be expended only where projects meet the specified criteria. Even if there are not enough projects, the criteria would not be relaxed. The program will fund projects of negligible or marginal economic benefit simply because funding has not been requested. Implementation of this program will need to address legislative constraints. In Montana, programs that use state special revenue account funds for non-highway projects require legislation to address the non-diversional clause requirements of the Montana constitution.
Similar programs exist in other states. These programs typically require guarantees regarding job creation, duration at a location, and assurances that businesses do not simply re-locate from other areas within the state. These include Oregon DOT’s Immediate Opportunity Fund, Florida DOT’s Transportation Outreach Program, New York State
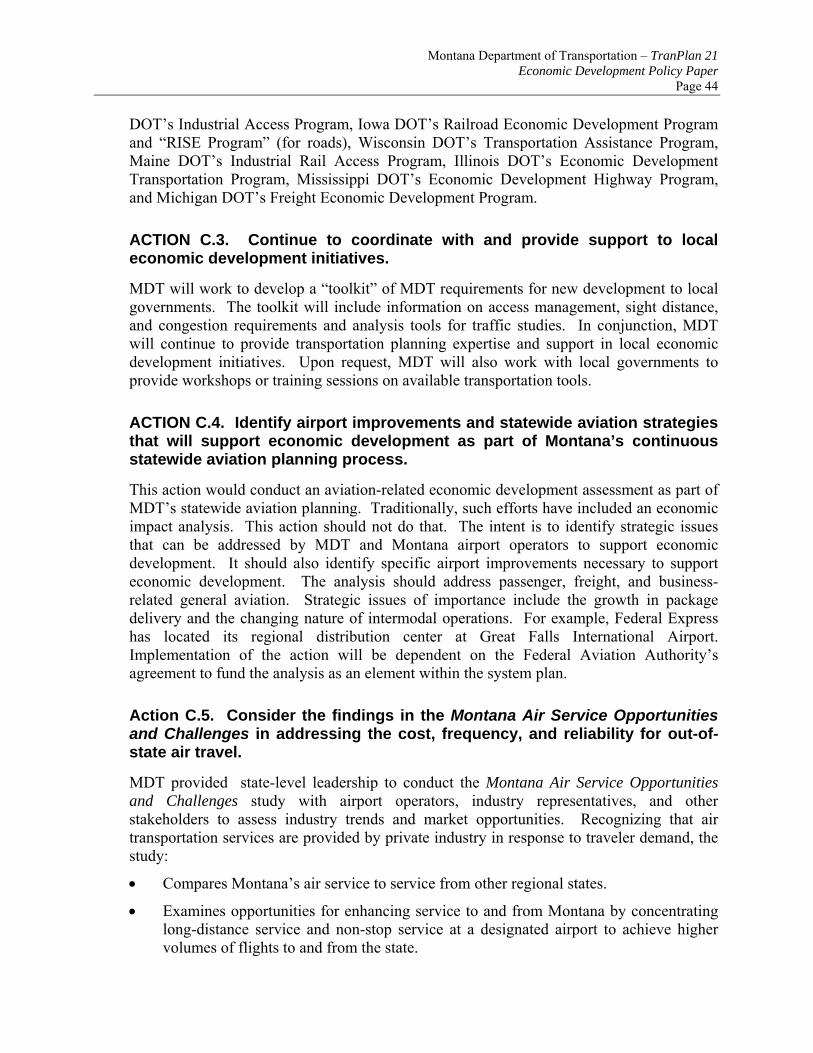
Montana Department of Transportation – TranPlan 21 Economic Development Policy Paper
Page 44
DOT’s Industrial Access Program, Iowa DOT’s Railroad Economic Development Program and “RISE Program” (for roads), Wisconsin DOT’s Transportation Assistance Program, Maine DOT’s Industrial Rail Access Program, Illinois DOT’s Economic Development Transportation Program, Mississippi DOT’s Economic Development Highway Program, and Michigan DOT’s Freight Economic Development Program.
ACTION C.3. Continue to coordinate with and provide support to local economic development initiatives.
MDT will work to develop a “toolkit” of MDT requirements for new development to local governments. The toolkit will include information on access management, sight distance, and congestion requirements and analysis tools for traffic studies. In conjunction, MDT will continue to provide transportation planning expertise and support in local economic development initiatives. Upon request, MDT will also work with local governments to provide workshops or training sessions on available transportation tools.
ACTION C.4. Identify airport improvements and statewide aviation strategies that will support economic development as part of Montana’s continuous statewide aviation planning process.
This action would conduct an aviation-related economic development assessment as part of MDT’s statewide aviation planning. Traditionally, such efforts have included an economic impact analysis. This action should not do that. The intent is to identify strategic issues that can be addressed by MDT and Montana airport operators to support economic development. It should also identify specific airport improvements necessary to support economic development. The analysis should address passenger, freight, and business-related general aviation. Strategic issues of importance include the growth in package delivery and the changing nature of intermodal operations. For example, Federal Express has located its regional distribution center at Great Falls International Airport. Implementation of the action will be dependent on the Federal Aviation Authority’s agreement to fund the analysis as an element within the system plan.
Action C.5. Consider the findings in the Montana Air Service Opportunities and Challenges in addressing the cost, frequency, and reliability for out-of-state air travel.
MDT provided state-level leadership to conduct the Montana Air Service Opportunities and Challenges study with airport operators, industry representatives, and other stakeholders to assess industry trends and market opportunities. Recognizing that air transportation services are provided by private industry in response to traveler demand, the study:
• Compares Montana’s air service to service from other regional states.
• Examines opportunities for enhancing service to and from Montana by concentrating long-distance service and non-stop service at a designated airport to achieve higher volumes of flights to and from the state.

Montana Department of Transportation – TranPlan 21 Economic Development Policy Paper
Page 45
• Studies options for establishing a “hub and spoke” system in Montana, where in-state flights feed into a core airport.
The outcome of the study, completed in February 2007, and future updates should be considered to ensure Montana has the air transportation services required for economic diversification.
ACTION C.6. Participate in multi-state and regional initiatives that facilitate international trade by identifying and addressing bottlenecks.
This action involves the continued participation by MDT in multistate trade corridor initiatives. The TranPlan 21 analysis findings indicate that Montana is not experiencing a large growth in international trade, even though it has no corridor-level capacity constraints to impact international trade. In addition, the principal bottlenecks Montana industry faces are in other states. The intent of this action is to focus on addressing bottlenecks that impact travel time and travel reliability. MDT will not emphasize one corridor over another in implementing this action because there are multiple official and unofficial trade corridors in Montana.
POLICY GOAL D: Support the tourism industry through promoting access to recreational, historical, cultural, and scenic destinations.
Purpose: To factor the important role that the highway system plays in Montana’s visitor industry into MDT’s planning, investments, and operations.
Rationale: The visitor industry is a large and growing component of the Montana economy. The visitor industry through business planning has identified a number of opportunities for MDT to enhance the visitor experience and partner to support the development of the tourist industry. The objective is to increase the length of out-of-state visits by increasing the number of destinations on offer.
ACTION D.1. Promote tourism through improved rest areas and co-location of travel information centers.
This action should be implemented in coordination with other actions that address rest areas. The action recognizes that 90 to 95 percent of out of state visitors to Montana arrive by car and most other visitors arrive by air and then rent a car. Rest areas are a part of the visitor experience. Further, the Montana tourist industry considers rest areas as prime locations for providing travel information. This can motivate tourists to stay longer and visit other attractions. As part of action implementation, tourist considerations should be addressed in establishing an overall rest area level of service policy. Rest area design and maintenance should consider access for buses, trucks, and recreational vehicles.

Montana Department of Transportation – TranPlan 21 Economic Development Policy Paper
Page 46
ACTION D.2. Support state and local agencies to market tourist travel and tourist routes.
Tourism is one area where Montana’s natural advantages are clear. Most visitors drive into the state or fly in and then rent a car to drive within the state. Montana’s highway system is a key element for tourism and is effectively a transportation service. Driving on Montana’s scenic routes is a large element of many visits. MDT should continue to partner with agencies such as Travel Montana, the Montana Tourism and Recreational Initiative, and other state and federal agencies, to enhance the availability of visitor support information and services. Elements may include efforts to enhance and/or initiate:
• MDT participating on the Travel Montana Tourism Advisory Council.
• Addressing tourism-related needs at visitor rest areas and participating in travel information centers.
• Addressing tourist needs on the state’s multi-modal transportation maps.
• Providing special signage to promote local businesses and attraction.
• Providing Web-based visitor travel information or links to other Montana tourism-related sites.
• Assisting groups organizing special events with route planning and traffic management.
ACTION D.3. Coordinate with federal agencies, tribal governments, neighboring states, and Canadian Provinces.
This action involves coordination with the appropriate federal, state, tribal, and other agencies that develop and manage resources in Montana. The activities of these agencies can affect travel throughout Montana and sometimes generate special transportation needs. Coordinated actions include efforts to promote tourism with the National Park Service, Montana Historic Preservation Office, and Montana Economic Developers Association through activities such as expanded Transit 511 service, historic roadway and bridges signage, and rest area improvements. Continuation and expansion of coordinated efforts, resources permitting, will allow MDT to coordinate its planning and investment decisions with such activities.
POLICY GOAL E: Develop MDT’s organizational capacity to support economic development.
Purpose: To effectively accomplish MDT’s economic development goals and implement the associated actions.
Rationale: For Montana to be successful, MDT must communicate consistently how transportation can and cannot support economic development. Further, MDT needs the organizational capacity to ensure that its staff resources and transportation improvements most effectively address economic development outcomes.

Montana Department of Transportation – TranPlan 21 Economic Development Policy Paper
Page 47
ACTION E.1. Strengthen MDT’s capability to support economic development.
This action elevates the importance of economic development in MDT and strengthens MDT’s ability to act upon the economic development findings in TranPlan 21. It would also support the ongoing economic development components of the statewide planning process. This would provide a resource to help communicate MDT’s role in economic development and coordinate and participate in state and local economic development initiatives as appropriate.
ACTION E.2. Communicate MDT’s role in economic development, opportunities for Montana firms to do business with MDT, economic development performance objectives, and associated accomplishments.
This action involves MDT establishing and communicating a clear, consistent message regarding its role in economic development and the relationship between transportation and economic development. This will include detailing and communicating the role of the freight mobility in economic development. MDT will identify and use the most effective channels for communicating with Montana businesses the opportunities for doing business with MDT. The action involves providing accountability to Montanans by reporting on accomplishments in meeting these goals. These will be most effective if related back to MDT’s economic development performance objectives.
ACTION E.3. Monitor and evaluate economic development-driven travel demands and assess the investments required to address them as part of the on-going planning process.
This action involves MDT maintaining a technical understanding of the travel demands generated by the state’s economic trends. The TranPlan 21 update identified changes occurring in Montana’s economy that will affect future transportation needs. These include changes in:
• The composition of the state’s business activity.
• The location of economic growth.
• Transportation technology and mode requirements.
• National and international cargo markets.
The action involves periodic assessment and monitoring of these changes. TranPlan 21 update analysis identified the following emerging and continuing economic changes that are shaping Montana’s future transportation needs:
• Time-sensitive shipments The greatest percentage growth of freight is via air and truck, particularly the increase in next-day delivery of higher value and time-sensitive manufactured parts and documents to and from other states. This is fueling growth of overnight courier and parcel delivery activities.

Montana Department of Transportation – TranPlan 21 Economic Development Policy Paper
Page 48
• Growth and location of freight movements by truck This is increasing needs for reliable and accessible rural-to-city highway routes. It is also increasing needs for efficient trucking and warehousing centers.
• Importance of airports and air transportation services The growth of services and advanced manufacturing industries in Montana will increase corporate jet and charter jet activity, increasing needs for investment in runway improvements at smaller airports around the state.
• Intermodal freight Nearly all air freight involves intermodal air-to-truck transfers, so the growth of freight movements by air to outside markets is also increasing needs for reliable inter-city highway routes as well as freight facilities at airports.
ACTION E.4. Conduct outreach to representatives of mining industries.
The technical analysis indicates an increase in mine production within Montana. The purpose of the action is to:
• Become familiar with plans and projections from the industries.
• Determine if existing transportation infrastructure will support anticipated mining activity.
• Develop and implement plans, if warranted, to upgrade infrastructure required for mining needs.
ACTION E.5. Provide technical support and information so that economic development needs are considered in MPO planning, MDT corridor planning, and project development.
This action ensures that economic development objectives and economic development-related travel demands are understood and addressed across Montana’s business areas. This includes MPO planning, corridor planning and studies, project design, and the operation of the transportation system.
ACTION E.6. Examine route signing and designation statewide to identify methods to support trade and economic development efforts.
This action would investigate corridors throughout the state examining current route designations and signing to identify methods that may support improvement to Montana’s economy. It would look at improvements in both a statewide and regional transportation perspective.

Montana Department of Transportation – TranPlan 21 Economic Development Policy Paper
Page 49
ACTION E.7. Designate an MDT point of contact for the Economic Development Community that will receive information from and disseminate information to other agencies.
This action would designate a position or point of contact within MDT to receive information from and disseminate information to other agencies involved with economic development initiatives. The point of contact would ensure that interagency resources reach the appropriate divisions within MDT.

Montana Department of Transportation – TranPlan 21
Attachment A: Methods Used to Estimate Future
Output of Commodity Industries
For goods producing industries, we use the following data:
• Output by value and income per industry in 1990 and 1998.
• NPA income projections to 2025 for farming, mining, and manufacturing.
A. Farming “Farming” as a single sector (not including forest products) is reported by NPA projections and by the Bureau of Economic Analysis. Therefore, we base our output projection on NPA forecast of income growth.
Between 1990 and 1998, Montana’s farm income declined by 57 percent and its output declined by 46 percent. NPA, however, predicts a 25 percent rise in farm earnings between 2000 and 2025 (32 percent from 1998), despite a 13 percent loss of employment in this sector.
The Farming sector contains multiple industries, some of which may be susceptible to increased automation. To estimate future output from Montana’s farms, we did the following:
• Calculated a ratio of output to income for 1990 ($8.48 of output per dollar of income) and 1998 ($10.51 to $1).
• Assumed that this trend toward automation increased on a straight line to 2025 (which would result in a ratio of $14.69 to $1 of income in 2025).
• Applied these ratios to the income totals for farming projected by NPA. These calculations come to $4.4 billion of output in 2025 (based on constant 1996 $s used by NPA). This projection is about 79 percent greater than output reported for 1998, but just about two-and-one-half percent above the 1990 total (underscoring the volatility of a natural resource-based economy) increases of 84 percent and 119 percent, respectively, for these two benchmark years.

Montana Department of Transportation – TranPlan 21
B. Other Goods-Producing Sectors Unfortunately, NPA does not breakdown these sectors. Therefore, we can not differentiate between coal mining, metal mining, and oil extraction, or among large and small manufacturing industries.
We first summed the 1990 and 1998 income data for mining and manufacturing sectors at the industry level, using 1996 dollar values to be consistent with NPA, and projected the net difference to 2025 on a straight line. Second, we compared the total income with NPA income projections:
• Summing of manufacturing industries in 1998 and the difference, 1990 and 1998, straight-lined to 2025 – results in a 2025 income projection of $1.1 billion, which is roughly 34 percent less than the NPA income projection of $1.47 billion. As a result, the lower bound of our output projections based on straight-lining the BEA 1998 industry data can viewed as “conservative” estimates for planning purposes.
• To establish consistency with NPA data, we increased the straight-output by approximately 34 percent. We use these numbers as the upper-bounds of the ranges.
It is evident that the 1990s were volatile in natural resource economies (with the exception of coal). Aggregate mining data from 1998 is totally unreliable for projections due to mine closings by the metal mining and non-metal mining sectors, both having incurred significant losses when compared to 1990 levels. Metal mining, for example, recorded losses in output (-41 percent) and income (-29 percent) when measuring just the two years of 1990 and 1998. Today, metal mining, benefiting from a strong demand for platinum, is a strong industry in Montana. An economist of the state’s Department of Commerce expects the industry to continue its growth. Several non-metal (and non-energy) mines closed during the mid-1990s, including a phosphorate rock mine and a talc mine. Moreover, as mentioned earlier, Montana Department of Commerce officials believe that NPA may be undercounting employment in the mining sector, which might significantly affect income projections (and therefore output projections) for this sector.