Embed Size (px)
Citation preview

ELSEVIER Journal of Development Economics 44 (1994) 229-261 ECON~MCS
External shocks, adjustment policies and investment in a developing economy: Illustrations from a forward-looking CGE model of the Philippines
Delfin S . Go*
l e World Bank, 1818 H Street, h7.M!, Washington, DC 20433, U S A
Received July 1991, final version received May 1993
Abstract
The rapid increase in investment and external debt or middle-income countries like the Philippines during the 1970s was perfectly 'rational' given existing policies. However, these countries could have done better with an appropriate mix of adjustment policies. Using a dynamic general equilibrium framework, the paper examines the sensitivity of investment and growth to external shocks and adjustment policies. It highlights the intertemporal trade-offs of tariff reform, a policy often recommended in the 1980s, emphasizing the need for complementary measures to ease macro imbalances and short-term dislocations of the protected sector.
Kejr words: Dynamic general equilibrium model; Structural adjustment; Philippines
JEL classification: C68; N15; 0 1 1
1. Introduction
During the last two decades, two developments affected significantly the economic performances of developing countries - the advent of adverse external shocks and the adjustment policies initiated to contain serious balance of payments problems.' It may be recalled that during the
*Special thanks are due to Shantayanan Devarajan for his valuable comments at various stages of the study. This work also benefited from comments, among others, from Hollis Chenery, Emmanuel Jimenez, Pradeep Mitra Dwight Perkins, Heng-Fu Zou, and an anonymous referee. Research was partially supported by an individual grant from Ford Foundation. Philippines. t
The views expressed in the paper are those of the author and should not be attributed to the World Bank. ' The recent Persian Gulf crisis is a recent example. However, the crisis was brief and its impact on oil prices did not have the same magnitude and duration as the 1974 and 1979 oil price hikes.
0304-3878/94/$07.00 CJ 1994 Elsevier Science B.V. All rights reserved SSDI 0304-3878(94)00013-3

230 D.S. Go / Journal of Development Economics 44 (1994) 229-261 D.S. Go / Journal of Development Economics 44 (1994) 229-261 23 1
seventies, a number of middle-income and semi-industrial countries actually did well after the 1974 oil crisis but had difliculties after the 1979 oil and interest rate shocks. Hindsight tells us that many of these developing economies over-invested and over-borrowed in the mid-seventies but had to contract when faced with constraints in further borrowing after 1979.' The implementation of structural adjustment policies in the eighties has led to the problem of slower growth, characterized by a drop of investment as a ratio to GDP.3 A key factor in these experiences is the behavior of investment and its sensitivity to price changes brought about by external shocks and policy changes. Why did investment in some middle-income countries rose so much in the seventies only to have severe debt problems later? Why did investment decline when adjustment policies, such as trade reform, are adopted? These policies, aimed primarily at making investment and growth more efficient and less dependent on foreign resources in the eighties, are constrained by their adverse impact on macro balances and investment activities in the short term. This paper explores this type of investment and growth responses to external shocks and adjustment policies in the context of a middle-income country like the Philippines and by using a dynamic general equilibrium analysis.
This study is distinguished from other research on developing issues by the integration of an intertemporal and forward-looking behavior in investment and consumption decisions in a computable equilibrium (CGE) framework applicable to developing c~un t r i e s .~ By employing an 'infinite horizon growth model with foresight, the framework allows us to explore growth and debt issues in a way not possible in models without expectations. While there is a growing number of CGE applications to developing issues, they are generally static in nature and are ill-suited for analyzing the dynamic processes of g r ~ w t h . ~ In particular, the effects of external shocks and adjustment policies on investment and growth are inherently dynamic - an import price shock or a tariff reform changes the expectation of profits permanently and hence the level and pattern of investment. In previous CGE studies, an economy's movement in time is described by a series of static equilibria strung together by updates in the levels of factor endowments. These updates are ad hoc and exogenous to the tttonnement. In relation to
the observed patterns of middle-income countries during the seventies, previous CGE studies stopped short of explaining why investments (hence debts) were high after the first oil shock in' 1974 and low after the second shock in 1979. Investment levels were either exogenously fixed at their high levels or driven low by arbitrarily setting them equal to a lower level of domestic and foreign savings as required by the macro-closure of the model. One effect that these models were designed to measure - the intersectoral reallocation of resources caused by the shifts in market prices - was often swamped by exogenous changes in sectoral investmenk6
The framework is characterized by three key features - the simultaneity of investment and saving decisions, the intertemporal and forward-looking behavior, and a general equilibrium applicable to developing countries. Savings and investment decisions are separate and simultaneous. At each point in time, consumption is an increasing function of wealth as in a choice- theoretic and life-cycle consumption model. Investment is an increasing function of Tobin's q, the ratio of the present value of profits to the cost of capital, and is subject to adjustment cost as in Hayashi (1982). To close the model, the equality of savings and investment is brought about by an adjustment in the level of foreign borrowing, supplied at a given world interest rate.' Unlike static CGE applications, neither investment or savings have to be fixed. Unlike studies concerned mainly with optimal borrowing,' investment is not dynamically passive and dependent solely on the saving path and on the constraints of external borrowing. The solution is decentra- lized and the amount of foreign borrowing is a product of endogenous and intertemporal decisions in investment and consumption.
Consumption and investment are forward-looking. Consumption smoo- thing is carried out by the consumer in anticipation of changes in consumer prices. Similarly, capital accumulation is started by the firms in response to future prices of net output relative to the cost of capital. The dynamic paths of consumption and investment depend on the changing competitive con- ditions between domestic and foreign goods, which are imperfect substitutes. These conditions are reflected in the appropriate real exchange rates and their impact on the intertemporal rates of transformation for consumption and investment.
The dynamic behavior of investment and consumption is embedded in a
These observations were made by several studies such as Balassa (1986). 'See. for example, the reviews of adjustment lending experiences of the World Bank in Adjustment Lending Policiesjor Sustainoble Growth (1990). 'Goulder and Summer (1989) incorporates this type of investment behavior in a multisectoral general equilibrium model for the United States and examines tax incentive issues for investmenr 'The strengths and weaknesses of economy-wide models in analyzing development issues are discussed in Bell and Srinivasan (1984).
While it is possible to set the various elasticities of substitution very low to have strong reallocation erects, convergence problems are often encountered first as the models become rigid and approach Leontiefs fixed-coeflicient world. The erects 01 relative price shocks in a static CGE generally run their course in a single period and have less impact on real income over time than changes in the factor supplies. 'We assumed that a middle-income country have suflicient access to the world capital markets in the seventies.
See, for example, Kharas and Shishido's (1986) study of Thailand.

232 D.S. Go / Journal of Developntenr Economics 44 (1994) 229-261 D.S. Go / Journal of Developmenr Economics 44 (1994) 229-261
multisectoral and general equilibrium representation of a developing econ- omy. The approach combines the intersectoral etliciency in the allocation of resources resulting from a general equilibrium model with the intertemporal efficiency generated from the dynamic optimization of each firm's value and the aggregate consumer's utility. For illustrations, a middle income country like the Philippines is chosen. A middle income country, with its higher per capita income, implies a more diversified and developed economy with sectors (e.g. manufacturing) capable of independent investment decisions.
The remaining sections of this paper are organized as follows. Section 2 briefly describes the model. Sections 3 and 4 examine the dynamic effects of external shocks and compare the results with those of a static CGE model. Sections 5 and 6 investigate policy options while Section 7 summarizes the tindings and conclusions.
2. Model
In this section, we briefly describe the framework with emphasis on the intertemporal consumption and investment. G o (1991, 1988) provides a more detailed discussion.
2.1. Consumption
The representative consumer maximizes his expected utility of the tem- poral sequence of (aggregated) consumption goods, C,:
1 max -CIL -Ve-Prdt. , 1-0
This is a familiar homogeneous utility function which is additively separable and a case of constant elasticity of marginal utility v. Consumption is discounted by the consumer's positive and constant rate of time preference p. At each point in time, the consumption bundle C is defined by a Cobb- Douglas aggregation of specific consumer goods C,. This is akin to an intra-period utility function with fixed expenditure shares ai.
Wealth accumulation in this household maximization depends o n current income Y; and the interest earned on existing wealth r,,w, which are allocated to either current consumption C, at the price PC, o r savings in the form of (Eq. 2). Current income consists of net-of-tax earnings from labor and capital plus net transfers from government and net remittances from abroad. The discounted flow of these incomes is defined as wealth.
%= Y;+r,,H(-PC,C,. (2)
The Hamiltonian for this dynamic problem is
H =e-PL[U(CJ+yr(Y;+rc,w-PC,C,)],
where p,=efrcvd" is the discount factor. The solution is the choice-theoretic consumption model, which has the following familiar discrete form:
where
The intertemporal condition for consumption determines the forward rate of growth of consumption in response to changes in the intertemporal rate r,, by which current consumption is transformed into future consumption:
A large r, makes future consumption cheaper and the rate of growth of consumption will increase, and vice-versa. The intertemporal rate r, is determined by the opportunity cost of savings, the cost of foreign borrowing. The latter is defined as the world interest rate i* plus the forward percent change in the real exchange rate e,, between import substitutes and domestic goods (which are purchased by the consumer as composite goods).
2.2. Investment
Following the work by Abel (1980), Hayashi (1982) and Summers (1981), the dynamic decision problem of the firm is to choose a time path of investment which maximizes the value of the firm V;, defined as the present value of net income:
- max V;, = p(t) R(t)dt + DPO, subject to Kt = I , - dRK,,
10
(6)
where p(t)=exp[-~~or,dv] is the discounted factor and R(t) is the net-of-tax profit less investment expenditures. K, is the familiar capital accumulation equation. Distinction is made regarding depreciation allowances allowed by tax laws on existing assets and on new investments. The value of the firm is
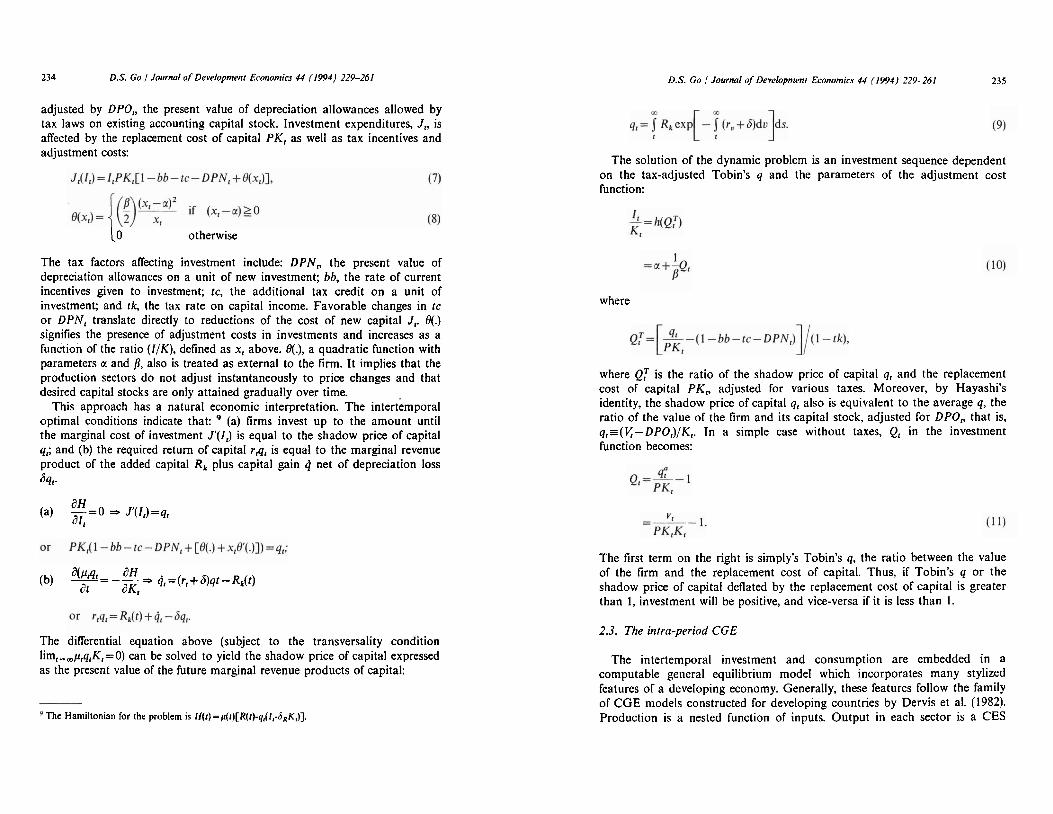
234 D.S. Go / Journal of Developmenr Economics 44 (1994) 22e261 D.S. Go / Journal of Developntet~r Economics 44 (1994) 229-261 235
adjusted by DPO,, the present value of depreciation allowances allowed by tax laws on existing accounting capital stock. Investment expenditures, J,, is affected by the replacement cost of capital PK, as well as tax incentives and adjustment costs:
10 otherwise
The tax factors affecting investment include: DPN, the present value of depreciation allowances on a unit of new investment; bb, the rate of current incentives given to investment; tc, the additional tax credit on a unit of investment; and tk, the tax rate on capital income. Favorable changes in tc or DPN, translate directly to reductions of the cost of new capital J,. O(.) signifies the presence of adjustment costs in investments and increases as a function of the ratio (IIK), defined as x, above. O(.), a quadratic function with parameters a and /I, also is treated as external to the firm. It implies that the production sectors do not adjust instantaneously to price changes and that desired capital stocks are only attained gradually over time.
This approach has a natural economic interpretation. The intertemporal optimal conditions indicate that: (a) firms invest up to the amount until the marginal cost of investment J'(1J is equal to the shadow price of capital q,; and (b) the required return of capital r,q, is equal to the marginal revenue product of the added capital R, plus capital gain q net of depreciation loss bq,.
dH (a) -=0
dl, - J'(I1) = 9,
a(~,q, aH (b) T=-- - 4, = (r, + S)qt - Rt(t)
dK,
The differential equation above (subject to the transversality condition lim,,,~q,K,=O) can be solved to yield the shadow price of capital expressed as the present value of the future marginal revenue products of capital:
The Hamiltonian for the problem is H ( I ) = I ( ( ~ ) [ R ( I ) - ~ ~ ( ~ , - S ~ K ~ ) ] .
The solution of the dynamic problem is an investment sequence dependent on the tax-adjusted Tobin's q and the parameters of the adjustment cost function:
where
where QT is the ratio of the shadow price of capital q, and the replacement cost of capital PK, adjusted for various taxes. Moreover, by Hayashi's identity, the shadow price ofcapital q, also is equivalent to the average q, the ratio of the value of the firm and its capital stock, adjusted for DPO,, that is, q,=(v-DPO,)/K,. In a simple case without taxes, Q, in the investment function becomes:
The first term on the right is simply's Tobin's q, the ratio between the value of the firm and the replacement cost of capital. Thus, if Tobin's q or the shadow price of capital deflated by the replacement cost of capital is greater than 1, investment will be positive, and vice-versa if it is less than 1.
2.3. The intra-period CGE
The intertemporal investment and consumption are embedded in a computable general equilibrium model which incorporates many stylized features of a developing economy. Generally, these features follow the family of CGE models constructed for developing countries by Dervis et al. (1982). Production is a nested function of inputs. Output in each sector is a CES

236 D.S. Go / Journal of Development Econon~ics 44 (1994) 229-261 D.S. Go / Journal o/ Development Economics 44 (1994) 229-261 237
combination of value added and material input. Material input is a fixed-coefficient aggregation of inputs. Value added, on the other hand, is another CES composite of labor and installed capital. Labor market is fragmented - labor in each sector is a Cobb-Douglas combination of urban and rural types; but the sectoral wages paid for each type are fixed proportions of the market wage of the corresponding labor type, reflecting differences in productivity.
Government revenue comes from tariffs, excise and sales taxes, income taxes, plus external borrowing. Government current expenditures include public consumption, transfers and subsidies, and external debt service. Hence, the public sector is responsible for foreign debt and interest payments. The difference between government revenue and expenditure equals government savings.1°
Imperfect substitution characterizes the trade markets. This is reflected in the Armington function between domestic goods and imports and the constant elasticity of transformation (CET) between sales to the domestic market and sales to the export markets. Moreover, reflecting the country's endowments, trade specialization, and past policies, the baskets of export goods and import goods are different. This dichotomy implies that the exchange rate affecting the demand side depends on the prices of .domestic goods and their import substitutes while the exchange rate affecting the supply side relies on the prices of domestic and export goods. Devarajan et al. (1993) provides an exposition of how various factors affect the real exchange rates in this type of CGE framework.
2.4. Solution strafegy
To arrive at a solution, the intertemporal condition for forward-looking and perfect foresight requires that expectations about future prices and variables are 'self-fulfilling' and conform to values eventually realized in the future. The lead variables, consisting of the exchange rates that define the intertemporal transformation rates, guarantee that the future prices of domestic and foreign goods are fully anticipated. The intertemporal con- ditions for consumption and investments also insure that the path towards a new steady state is unique. However, because the baskets of goods for exports and imports are different, the intertemporal transformation rates for consumption and investment may diverge in each period. Consumers face the costs of domestic goods and import substitutes in their decisions while producers look at the sale prices in the domestic and export markets. In the steady state however, a unique asset equilibrium is attained. All relative
lo For simplicity, we do not distinguish between private and public investment in this article.
prices become stable and the exchange rates cease to change. At this point, all asset prices converge to the world interest rate.
The general equilibrium conditions at every point in time also require that: (i) the demand for each labor type equals its supply; (ii) the demand for each category of goods equals its supply; (iii) the balance in the external current account must be offset by flows in the capital account; " (iv) government revenue is allocated between public expenditures and savings; and (v) total savings must cover total investment expenditures.
Following the usual procedure in solving an infinite-horizon growth model, steady-state conditions are imposed at some future terminal period (20 years). For as long as the transversality conditions are satisfied, the sums of various infinite series (pertaining to the utility function, the value of the firm, the present value of depreciation allowances, and the shadow price of capital) will be finite and defined. A sufficient condition is that the discount
.
rate and the rate of time-preference are positive and greater than the balanced-growth rate.'
By taking advantage of certain conditions, the model is solved as a master plan that maximizes the consumer's multi-period utility function subject to the investment and CGE equations. Ginsburgh and Waelbroeck (1981) showed that programming techniques can be used to solve a decentralized CGE model containing one single consumer. Abel and Blanchard (1983) demonstrated the equivalence of the two approaches in an infinite-horizon macro-model. Moreover, by Walras' law, one of the budget constraints is not independent and by omitting the more complicated household wealth constraint, the dimension of the problem is reduced.
The model is calibrated to generate a reference steady state run with values that match the benchmark data of the Philippine economy. Data are derived from a 1979 social account matrix (SAM) and the parameters are tested to replicate the historical path during 1974-85. There are three production sectors - the primary sector, manufacturing, and services; two labor types - urban, and labor; and one representative household but four distinct institutions - urban labor, rural labor, firms, and government. The trade-related elasticities, a, for the Armington functions and u, for the CET functions, are generally higher in the commodity sectors than in the less- tradable service sector (see Table 1). In the nested production function, the elasticity of substitution a, between intermediate input and value-added is set at less than unity to allow for increasing shares of material costs in the event
I ' The model treats capital flows as equal to the balance of trade, adjusted for net foreign remittances/transfers and debt service payments. It does not distinguish among different types of foreign flows which may complicate the analysis but not add to the story. l 2 The model is solved by using a high-level modeling language called General Modeling System (GAMS) with the Minos5 as the solution algorithm.

D.S. Go / Journal oJ Developmenr Economics 44 (1994) 229-261 D.S. Go / Journal of Developmenr Economics 44 (1994) 229-261 239
-Table I Trade and production elasticities
- - --
Sector a, a. a.
Primary 2.00 3.00 0.75 1.25 Manufacturing 1.25 1.50 0.75 0.85 Services 0.60 1.00 0.75 1.25
of an input price shock. The elasticity of substitution between labor and capital a, in value added is less in manufacturing than in other sectors, given the assumption that skill and training are required more in manufacturing. The manufacturing sector is the most capital-intensive while the primary sector is the most labor-intensive. The balanced-growth rate, g, is specified at the long-term growth of the Philippine economy at 5.5% a year. The adjustment cost parameters, a = 0 and 8 = 2 , were found reasonable in sensitive tests and generally would add about 10.5% to the desired invest- ment expenditures. In the consumer utility function, we set v=0.90 and calibrate p from the state-state condition. Taken together, the parameters indicate a stronger intertemporal substitution in the supply side relative to consumption.
The initial shadow price of capital, measured as the present value of the marginal revenue of capital, is dependent on the amount of installed capital and the discount rate in the base year. For a discount rate of 7.5% (pre- interest rate shock) in 1979, the shadow price for the primary sector is about 2.42; 1.73 for manufacturing; and 1.42 for services. These are generally reasonable values for the Philippines.13 Their differences indicate some amount of over-investments in the service and manufacturing sectors when compared to the primary sector. If there were no incentive bias, the higher shadow price in the primary sector would have attracted more investments until all shadow prices had been equalized. But taxes and incentives prevented total investment to be allocated this way. The incentive bias is reflected in the parameter bb, which is calibrated to generate the base year investment of each sector as the steady-state level while allowing for sectoral differences in the shadow prices of capital before tax and other incentives.14
3. Import price shock
The effects of an import price shock in a middle-income country like the Philippines are examined next. The import price shock involves a 50%
"See, for example, Bautista, Power. and Others (1979). I * From equation 10, note that investment depends on the ratio of the shadow and purchase price of capital, adjusted for various tax incentives.
increase in the import price of primary goods, the sector that includes crude oil. This is a reasonable replication of the 1974 oil crisis, which caused an immediate worldwide inflation and raised the cost of imported raw materials everywhere. The price increase is permanent in nature but initially unanticipated.
The dynamic effects of an import price shock in the primary sector are summarized in Figs. 1 to 4. Each plot represents a variable as a ratio to its balanced-growth steady-state level and the horizontal line at 1.00 is the reference run. One immediately discernible effect is the increase in real investment in Fig. 1 . This is in fact what happened to many middle-income countries like the Philippines during the oil crisis in 1974. Total investment in the simulation goes up to about 1.04 times the benchmark level and gradually settles at 1.03. For a shock comparable to the magnitude in 1974, the increase will be a lot more. There are several reasons for this increase.
The shock is a boost to the production of primary goods but causes a contraction in trade. 15% of primary goods comes from imports. The price increase discourages the purchase of imports directly and stimulates the demand for the domestic variety. It also imparts a severe input price shock in sectors like the manufacturing, which depends on the primary sector for 43% of its raw materials. The corresponding share of raw materials purchased by the service sector from the primary sector is 4%, and the primary sector itself 26%. Because of the demand substitution and cost increases, domestic prices will rise unambiguously. With world prices of exports constant, the real prices of exports will decline ('PWEJPD' in Fig. l), causing a shift away from export supply. Overall, both imports and exports will decline. The import price shock works out like an increase in tariff protection with Stolper-Samuelson-like effects (for specific factors) on the favored. sector. The equivalent experience in the Philippines in the mid- seventies is the rapid rise in the supply of domestic energy, particularly in the areas of geothermal, hydro power, and non-traditional energy sources.15
The dynamic impact depends on domestic prices and how they affect the rates of intertemporal substitution at various stages in time. With supplies responding slowly because of adjustment costs, investments are much more responsive to price changes at the early stages in order to bring about the desired levels of capital stocks and outputs in the future. Over time, the changes in supply will bring about a correction in prices and the intertem- poral rates of transformation. For the consumer, the initial increase in prices reduces real wealth and decreases.consumption below the benchmark levels immediately. Over time, the increased supply of domestic goods will dampen
The episode indicates that the substitution elasticity in energy sources, although costly, is greater than zero. The study does not consider the case in which energy and capital are complementary.


242 D.S. Go / Journal of Development Econon~ics 44 (1994) 225L261 D.S. Go / Journal of Development Economics 44 (1994) 229-261
prices and a process of consumption smoothing will favor postponing consumption. Hence, consumption will rise slightly from the initial drop but will remain below the benchmark level (Fig. 1).
For the producers, the increase in domestic prices raises immediately the expectations of profits and the tax-adjusted QT's (tempered somewhat by a higher replacement cost of capital). Sectoral investments are encouraged (Fig. 3). Among the three sectors, the primary sector receives a permanent benefit. Its investment jumps the highest and, while slowing down eventually, stays very much above the benchmark level. For the manufacturing sector, the input price shock reduces its output supply permanently. The long-term conditions are ameliorated with greater supply of domestic sources of raw materials. Its investment and capital stock eventually return to near bench- mark levels. However, the shock leaves a permanent decline in the producti- vity of its capital. What is interesting is the impact on the least tradable sector, the service sector. In addition to being less affected by the input price shock, the switch away from -foreign trade and the availability of foreign borrowing produces a Dutch-Disease-like phenomenon. Investment in the service sector goes up and stay above the benchmark levels. The historical analogy in the Philippines is the boom in hotel and other real estate construction in the mid-seventies.
Because of the rise in investments in the primary and service sectors, the current account deficit and foreign debt increase steeply. This is precisely the experience of some middle-income countries in the 1970s. Current account deficit (M-E) jumps to 1.6 times the benchmark level at the start (Fig. 2). It eventually stabilize at 1.18. Foreign debt is about 1.15 times greater than the benchmark at the end.
The above' results are difficult to duplicate in a static CGE model. A comparable static version is obtained by removing the intertemporal con- sumption and investment from the framework.16 One immediate difference is the closure of the savings-investment identity. In a static version, one component has to be fixed. Fixing sectoral investments (Fig. 5) makes capital accumulation a trivial matter. The import price shock still causes a contraction in trade as expected, more in imports than exports. Consumption also declines in response to higher prices. G N P declines slightly as a result. Because real investments are fixed, the current account deficit (M - E), foreign borrowing, and debt will increase only slightly. Fixing foreign borrowing (Figs. 6-7) makes the balance-of-payments story trivial. In addi- tion to the contraction in trade, consumption, GNP, and investment also will
l 6 Consumption of each good is a fixed share of household income. The investment-saving identity is closed by either fixing sectoral investments or total savings through a constant level of foreign borrowing. In the latter case, sectoral investments are allocated on the basis of relative profitability.
BORROWING --------
..........................................
---------------------- EXPORTS 7 M P U R T S
0.85 4 0 1 6 8 10 1 1 1 1 I6 18 20 -
Fig. 5. Impact of an import price shock; static case - fixed investment (balanced growth run = 1.00).
0 . 8 4 4
0 2 4 6 I 10 11 14 I6 18 10 - Fig. 6. Impact of an import price shock; static case - fixed borrowing (balanced growth run= 1.00).
R A T I O 1 . " ~
D.S. Go / Journal of Development Economics 44 (1994) 229-261
0 . 8 8 ,
0 1 4 6 1 10 I1 I4 16 18 2 0
a E - l u u m L
Fig. 7. Impact of an import price shock on investment, static case (lixed borrowing, balanced growth run = 1.00).
0 . 8 8 4 o 2 4 6 8 1 0 1 2 1 4 1 6 1 8 2 0 -
Fig. 8. Impact of a future import price shock (balanced growth run= 1.00).
D.S. Go / Journal of Developmen! Economics 44 (1994) 229-261 245
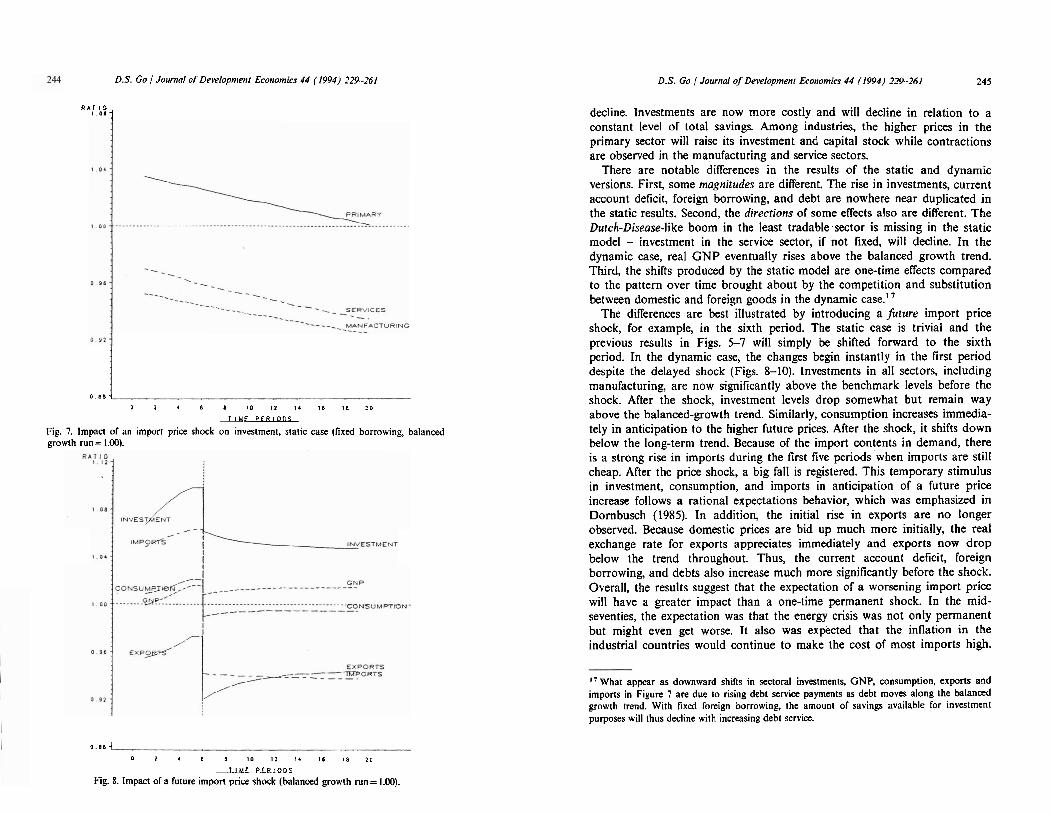
decline. Investments are now more costly and will decline in relation to a constant level of total savings. Among industries, the higher prices in the primary sector will raise its investment and capital stock while contractions are observed in the manufacturing and service sectors.
There are notable differences in the results of the static and dynamic versions. First, some magnitudes are different. The rise in investments, current account deficit, foreign borrowing, and debt are nowhere near duplicated in the static results. Second, the directions of some effects also are different. The Dutch-Disease-like boom in the least tradable sector is missing in the static model - investment in the service sector, if not fixed, will decline. In the dynamic case, real GNP eventually rises above the balanced growth trend. Third, the shifts produced by the static model are one-time effects compared to the pattern over time brought about by the competition and substitution between domestic and foreign goods in the dynamic case."
The differences are best illustrated by introducing a future import price shock, for example, in the sixth period. The static case is trivial and the previous results in Figs. 5-7 will simply be shifted forward to the sixth period. In the dynamic case, the changes begin instantly in the first period despite the delayed shock (Figs. 8-10). Investments in all sectors, including manufacturing, are now significantly above the benchmark levels before the shock. After the shock, investment levels drop somewhat but remain way above the balanced-growth trend. Similarly, consumption increases immedia- tely in anticipation to the higher future prices. After the shock, it shifts down below the long-term trend. Because of the import contents in demand, there is a strong rise in imports during the first five periods when imports are still cheap. After the price shock, a big fall is registered. This temporary stimulus in investment, consumption, and imports in anticipation of a future price increase follows a rational expectations behavior, which was emphasized in Dornbusch (1985). In addition, the initial rise in exports are no longer observed. Because domestic prices are bid up much more initially, the real exchange rate for exports appreciates immediately and exports now drop below the trend throughout. Thus, the current account deficit, foreign borrowing, and debts also increase much more significantly before the shock. Overall, the results suggest that the expectation of a worsening import price will have a greater impact than a one-time permanent shock. In the mid- seventies, the expectation was that the energy crisis was not only permanent but might even get worse. It also was expkted that the inflation in the industrial countries would continue to make the cost of most imports high.
"What appear as downward shifts in sectoral investments, GNP, consumption, exports and imports in Figure 7 are due to rising debt service payments as debt moves along the balanced growth trend. With fixed foreign borrowing, the amount of savings available for investment purposes will thus decline with increasing debt sewice.

248 D.S. Go / Journal of Developmenr Economics 44 (1994) 229-261 D.S. Go / Journal of Developmenr Economics 44 (1994) 229-261
By these observations, the anticipation of a worsening situation is an important source of variation in the investment and growth of middle- income economies.
In the Philippines, the economy from 1974 to 1979 showed an over-all growth of 6.5% per year, which was higher than its long term rate of 5.5% despite the severe oil price shock. The share of fixed investment in G D P rose from 18.5% in 1979 to 25.9% in ,1979. Much of the growth was financed by borrowing and external debt grew by 4.5 times from 3.8 US billion dollars in 1974 to 17.3 US billion dollar by 1980.
4. Interest rate shock
An interest rate shock of the order an increase of the world interest rate from 7.5% to 9.5% is introduced in the next simulation. Its dynamic effects are summarized in Fig. 11. The impact on the intertemporal rate of trading is direct. The immediate result is to reduce the expectations of profits and the value of the firm. Investment falls drastically throughout. Consumption and exports are initially helped by declining domestic prices but they eventually also decline. The result is a contraction of the economy as what happened to many middle-income countries after 1979. While the outcome seems straight- forward and obvious, it is often difficult to model an interest rate shock and show such a contraction in a static framework.ls
In the case of the Philippines, the economy stagnated following the interest rate shock in 1979 and the severe stabilization problems during the first half of the 1980s. From 1979 to 1986, it grew only by an average rate of 0.6% per year and in fact declined by a cumulative 10% from 1983 to 1985. Fixed investment as a ratio to G D P fell from 25.9% in 1979 to 12.9% in 1986. The crisis went beyond the economic sphere and helped ignited a popular rebellion that ended a 20-year strongman rule in 1986. While growth has been somewhat restored since then, the seriousness of the situation is still reflected by the fact that real per capita income in 1992 stands 7% below its 1980 level.
5. Tariff reform
In this section, we analyze one adjustment policy often suggested for many developing countries in the eighties - a liberalization of the economy
l 8 Strictly speaking, a permanent rise in the world interest rate will require (from equation 5) a recalibration of the rate of time preference p, so that the steady-state condition for consumption at the terminal period is consistent with the increase in interest rate. To avoid problems of dynamic inconsistency when p, is altered however (see Strotz (1955-56)). we retain the reference-run p, and assume that the terminal period is sulliciently far away to change the results. In any case, the contractionary eNects of an interest rate shock will not be aNected.
R A T I O , 30 1
/. ,/. ..--
IMPORTS - - -2- - - - - - - - - - - - /
/' /'
/'
0.95
0 2 . 6 8 10 12 I 4 I I8 20
T I U F Q . 5
Fig. 13. Impact of a tariR reform on foreign debt (balanced growth run= 1.00).
MANUFACTURING
__A-- -
-.-- -. -.- ,.
/. /.
/.
0.90 -I 0 I I 6 8 10 1 1 $ 4 I 6 18 20 -
Fig. 14. Impact of a tariN reform on sectoral investment (balanced growth run= 1.00).

250 D.S. Go / Journal of Development Economics 44 (1994) 229-261 D.S. Go / Journal of Devclopmenf Economics 44 (1994) 229-261
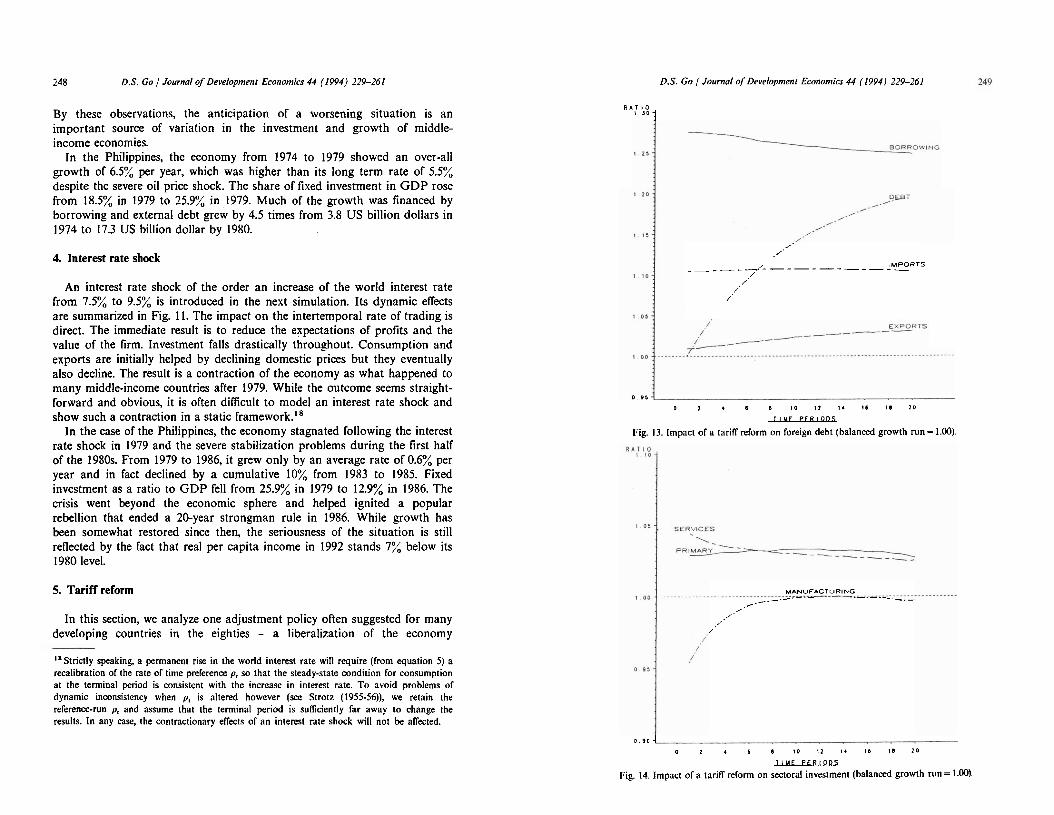
involving a tariff reform. Like many import-substituting countries, the policy incentives in the Philippines protects the manufacturing sector. The average tariff rate is 17%, 23% for manufacturing and 10% for primary sector. A tariff reform is simulated by imposing a uniform 10% tariff rate. The results are shown in Figs. 12 to 15 . Note that foreign borrowing and debt will increase. A tariff reform makes imports cheaper and their demand will increase. Exports also increase but not by as much as imports. Because import tariffs are important revenue sources in developing countries like the Philippines, tax collection will fall, if no compensating measures are taken (Fig. 12). Hence, foreign borrowing will rise because of the reduced public savings and the higher import bill (Fig. 13).
Who gains and who losses? Tariff reform hurts the protected sector - manufacturing - at least in the short run. Efficiency gains from greater competition, outside the scope of the present paper, eventually may reverse the initial losses. However, the increased competition from cheaper imports will initially lead to a decline in the value-added of manufacturing, hence its labor and capital income (Fig. 15). If the general equilibrium condition for full employment is not satisfied in the real world, e.g. if wages are sticky downward, unemployment may rise. With the returns to the fixed factor declining, investment in manufacturing also will fall while investments in the primary and service sectors will increase (Fig. 14). Overtime however, the domestic supply of manufactured goods will shrink and the domestic prices of manufacturing will rise again, making investment in manufacturing attractive again. If the reform can be financed and the initial resistance of the manufacturing sector overcome (which are two big ifs), the long-run results of this model show a higher consumption, investment, and GDP (Fig. 12).
Much of the effects of a tariff reform have been debated. Recent studies show that unifying tariff rates may not be efficient.Ig The results here from using a dynamic framework demonstrate both the promise and .danger of liberalization. A tariff reform shows the expected benefits on the primary sector and to some degree on exports. However, it also may lead to a contraction in the protected sector, a decline in tax revenue, a higher current account deficit, and an accumulation of debts. We find that the decline in tax revenue, although less severe, is also true even in case of a tariff reform involving a uniform 0.17, the base-year average tariff rate. Complementary measures are needed to overcome the less desirable effects shown above. In general, it is possible within the same framework to introduce a reform of domestic taxes and incentive schemes that will maintain output and exports in all sectors while offsetting revenue losses and preventing an increase in foreign debt."
l9 For example, Dahl et al. (1986). GO (1988) contains such an illustration.
R A T I O
' 0 4 1
0 96
0 2 4 6 I 0 1 2 1 4 1 6 I C 1 0 - Fig. 15. Impact of a tarifT reform on value added (balanced growth run= 1.00).
O.,J , , , , , , , , , , o I 4 I I 1 0 1 2 1 4 1 6 1 8 2 0
ilMEPERlOOl
Fig. 16. Policies for an import price shock (balanced growth run = 1.00).

252 D.S. Go / Journal of Development Econonrics 44 (1994) 2-79-16! D.S. Go / Journal of Development Economics 44 (1994) 229-261 253
6. Policies during an import price shock
Looking at the mid-seventies in retrospect, is it possible to implement a package of policies that would maintain growth and prevent the severe contraction in trade and rapid rise in debt? This is an attempt to answer if the middle-income countries like the Philippines could have done better by implementing the 'right' policies. The answer through a simple illustration in Fig. 16 is positive - which shows the effects on total investment, real GDP, foreign debt and exports are reported. The external shock in the scenario is defined by a 2.3 times increase in the real price of primary imports, which is equivalent to the 1974 oil price shock in the Philippines. A package of policies also is implemented: 2 1 (a) a tariff reform consisting of a uniform duty of 10% is introduced; (b) the manufacturing sector is assisted by a temporary 10% tax subsidy to exports for the first five years (zero thereafter) and a permanent 10% tax credit to investment;' (d) to raise domestic resources, a 10% consumption tax is implemented; and (e) to promote agriculture and its exports, the incentive bias against agriculture is removed and kept at par with manufacturing, i.e. a uniform bb parameter." The net result is an economy growing at its long-term trend with high exports and a rapidly declining foreign debt level. While it takes some extreme measures to attain this growth pattern, the purpose is simply to demonstrate that rapid debt accumulation is not necessarily the end result of a severe import price shock, given the right mix of policies.
In fact, the arrival of an import price shock is an attractive occasion for tariff reform since it eases the accompanying pressures on domestic prices; it prevents exports from declining too much; and it does not lead to an expansion of import demand that normally accompanies a tariff reduction. Combined with other policies, the investment boom and Dutch-Diseuse-like effects on the service sector could be rechanneled towards the more tradable sectors and exports could be emphasized and increased. If a mobilization of domestic resources is also undertaken through increased tax collections, the combined effects will slow down debt accumulation. Based on this hindsight, we conclude that middle-income countries like the Philippines missed a golden opportunity for policy reforms during the seventies and found the eighties under less favorable circumstances to implement adjustment policies.
Foreign debt remains endogenous to maintain comparability with the previous experimen~s. It is possible, however, to derive a time path of fiscal adjustment, i.e. domestic tax changes or reduction in government expenditure, in order to generate the necessary domestic savings while keeping foreign borrowing fixed. Z2 See the section on Solution Strategy lor discussion o l bb and its relationship to the shadow price o l capital.
7. Conclusions
In this paper, a multisectoral general equilibrium model with forward- looking behavior in consumption and investment was implemented to look at the effects of external shocks and adjustment polices on a middle-income country like the Philippines. The simulations illustrate the importance of dynamic and forward-looking behavior in consumption and investment. It shows how an import price shock could lead to an investment boom and rapid expansion in foreign debt as what happened in the mid-seventies to many developing countries. This rapid expansion is hard to explain without investigating the dynamic competitive conditions between domestic and foreign goods over time in response to these shocks. For instance, the increase in current account deficits and foreign debt after an import price shock is certainly greater than would be implied by a static model. Searching for policy options, the results demonstrate both the promise and danger of trade liberalization, a policy often recommended in the eighties. A tariff reform shows the expected benefits on the primary sector and exports. But it may lead to a short-run contraction in the protected sector, a decline in tax revenue, and a higher current account deficit and foreign debt. Other measures are needed. In general, we find that a package of policies, consisting of a reform of domestic taxes and incentive schemes, combined with a tariff reform, is ideal during an import price shock. It is effective in maintaining growth and exports without a rapid rise in debt.
Appendix A: List of equations
A. I. The intertemporal consumption and investment
Subscripts for sectors are suppressed in this part for easy reading.
A.1 .I. Objective jirnction
where

6' All

h \O 'f! 4 Y
- C . - r' 6 h 6
I 3 - + - 2ii CO- Y d I1 cj3

258 D.S. Go / Journal of Developmenr Economics 44 (1994) 229-261 D.S. Go / Journal of Development Econoniics 44 (1994) 229-261
A.2.10. Intratemporal equilibrium conditions L D ~ = ~ ; S ~
SAVINGS= INVEST.
Appendix B: Glossary
B.1. Parameters
B.I.I. aij bij bb blim dR 60T 6' Y
cgi er g 4 C"i
P "1
Coefficients input-output coefficient, coefficient of the capital composition matrix, rate of existing incentives to investment, foreign lending constraint, depreciation rate of real capital, old depreciation rate of accounting capital, new depreciation rate of accounting capital, a parameter in the adjustment cost function, distribution share of household consumption, distribution share of government consumption, nominal exchange rate in the base year, price numeraire, growth rate, a parameter in the adjustment cost function, wage proportionality factors, rate of consumer time preference, share of inventories in gross output.
B.I.2. Shift and share parameters ali shift parameter in the Cobb-Douglas aggregation of labor, aqi shift parameter in the CES function for Q, a11 shift parameter in the CET function for Q, avi shift parameter in the CES function for V, @k share parameter in the Cobb-Douglas function for L, 6qi share parameter in the CES function for Q,
6ri share parameter in the CET function for Q, Jvi share parameter in the CES function for
Pqi exponent parameter in the CES function for Q,
Pr i exponent parameter in the CET function for Q, Pvi exponent parameter in the CES function for L!
B.1.3. Saving and tax rates ksh corporate saving rate, sh, household saving rate, t CI rate of new tax credits to investment, te, export tax or subsidies rate, chi household income tax rate, tki tax rate on capital income, tli social security taxes, tm, import duty, tsi sales and excise tax rate, t oi value added tax rate.
B.2. Variables
B.2.1. Quantities ct aggregate consumption at time t , Ci private consumption of good i ,
Di sales of domestic goods, DST changes in stocks (final demand), Ei exports by sector, GCi government consumption of good i I i investment by sector of destination, IDi investment by sector of origin, IN?;: sales of intermediate goods in good i, K i capital stock in each sector, K?;: accounting capital in each sector, Li aggregate labor in each sector, LDk labor demand for each labor category, Lok base year labor supply for each labor category, Lsk labor supply for each labor category, Lik labor by category k in each sector, Mi imports by sector, Ni aggregate material input in each sector,
Q i gross output in each sector, v value added in each sector, Rkr marginal net revenue product of capital, Xi Armington aggregation of domestic and import goods.

260 D.S. Go / Journal of Developmenf Economics 44 (1994) 229-2661
Prices world export price, world import price, composite price of domestic and import goods, price of domestic goods, domestic price of exports, price of capital, domestic price of imports, price of material input, price of gross output, price of value added, real exchange rate, world interest rate, shadow price of capital, tax adjusted Tobin's q, rate of return of assets for asset equilibrium, gross rate of return, discount factor, average wage rate in each sector, average wage of labor category k in each sector.
B.2.3 Values Bt foreign borrowings or capital inflows, DEB?; outstanding foreign debt at time t, DPN, present value of depreciation allowances on a peso of new
investment, DPO, present value of depreciation allowances on existing accounting
asset, FSA V foreign savings, GCON total government consumption, GR government tax revenues less transfers, GSAV government savings, I N E S T total fixed investment, J t total investment expenditures, including adjustment cost, REMIT foreign remittances, S A U N G S total savings net of change of stocks, e(xt) adjustment cost function, T R N S government transfers to households, W H factor income, YLi wage bill in each sector, YKi gross capital income in each sector, YL, wage bill in each sector.
D.S. Go / Journal of Developmenr Economics 44 (1994) 229-261 26 1
References
Abel, A.B., 1980, Empirical investment equations: An integrative framework, in: K. Brunner and A.H. Meltzer, eds., On the state of macroeconomics, Carnegie-Rochester Series on Public Policy, Vol 12, 39-91.
Abel, A.B., and O.J. Blanchard, 1983, An intertemporal model of saving and investment, Econometrica 51, 675-192.
Balassa, B., 1986, Policy responses to exogenous shocks in developing countries, American Economic Review 76, May, 75-78.
Bautista, R., J. Power and others, 1979, Industrial promotion policies in the Philippines (Philippine Institute for Development Studies, Manila).
Bell, C. and T.N. Srinivasan, 1984, On the uses and abuses of economywide models in development policy analysis, in: M. Syrquin, L. Taylor and L. Westphal, eds., Economic structure and performance (Academic Press, Orlando, FL).
Dahl, H, S. Devarajan and S. van Wijnbergen, 1986, Revenue-neutral tarilF reform: Theory and an application to Cameroon, CPD paper no. 1986-25 (The World Bank, Washington, DC).
Dervis, K., J. de Melo and S. Robinson. 1982, General equilibrium models for development policy (Cambridge University Press. New York).
Devarajan, S., J. Lewis and S. Robinson, 1993, External shocks, purchasing power parity, and the equilibrium real exchange rate, The World .Bank Economic Review 7, no. 1, 45-63.
Dornbusch, R., 1985, External debt, budget deficits, and disequilibrium exchange rates, in: G. Smith and J. Cuddington, eds., International debt and the developing countries (The World Bank, Washington, DC).
Ginsburgh, V.A. and J.L. Waelbroeck, 1981, Activity analysis and general equilibrium modeling (North-Holland Publishing Company, Amsterdam).
Go, D., 1988, Growth and adjustment in the Philippines - a dynamic general equilibrium analysis, Ph.D. Dissertation (Harvard University, Cambridge, MA).
Go, D., 1991, External shocks, adjustment policies, and investment - illustrations from a forward-looking CGE model of the Philippines, PRE paper no. 737 (The World Bank, Washington, DC).
Goulder, L. and L. Summers, 1989, Tax policy, asset prices, and growth in a general equilibrium analysis, Journal of Public Economics 38, 265-296.
Hayashi, F., 1982, TobinS 9, rational expectations, and optimal investment rule, Econometrica 50, 213-224.
Kharas, H. and H. Shishido, 1986, A dynamic-optimization model of foreign borrowing: A case study of Thailand, Journal of Policy Modelling 8, 1-25.
Strotz, R., 1955-56, Myopia and inconsistency in dynamic utility maximization, Review of Economic Studies 23, 165-180.
Summers, L.H., 1981, Taxation and corporate investment: A q-theory approach, Brookings Papers on Economic Activity 1, 67-140.
World Bank, 1990, Adjustment lending for sustainable growth, Policy and Research Series 14 (The World Bank, Washington, DC).