Embed Size (px)
Citation preview

Early Twentieth Century Business Cycles in CanadaAuthor(s): Keith A. J. HaySource: The Canadian Journal of Economics and Political Science / Revue canadienned'Economique et de Science politique, Vol. 32, No. 3 (Aug., 1966), pp. 354-365Published by: Wiley on behalf of Canadian Economics AssociationStable URL: http://www.jstor.org/stable/139993 .
Accessed: 10/06/2014 18:23
Your use of the JSTOR archive indicates your acceptance of the Terms & Conditions of Use, available at .http://www.jstor.org/page/info/about/policies/terms.jsp
.JSTOR is a not-for-profit service that helps scholars, researchers, and students discover, use, and build upon a wide range ofcontent in a trusted digital archive. We use information technology and tools to increase productivity and facilitate new formsof scholarship. For more information about JSTOR, please contact [email protected].
.
Wiley and Canadian Economics Association are collaborating with JSTOR to digitize, preserve and extendaccess to The Canadian Journal of Economics and Political Science / Revue canadienne d'Economique et deScience politique.
http://www.jstor.org
This content downloaded from 185.44.78.51 on Tue, 10 Jun 2014 18:23:01 PMAll use subject to JSTOR Terms and Conditions

EARLY TWENTIETH CENTURY BUSINESS CYCLES IN CANADA*
KEITH A. J. HAY Carleton University
Canada's economic development during the first two decades of the twentieth century has been examined intensively by such writers as Viner, Meier, and Ingram. Viner claimed that Canadian experience from 1900-1913 clearly demonstrated the working of the classic specie flow mechanism and the inter- national operation of the quantity theory of money.' Meier re-examined the period, and in the light of additional evidence concluded that dynamic forces of economic development (expansion of the wheat economy, and later capital inflows) dominated the Canadian record during the period.2 Ingram also argued that rapid expansion of the economy after 1900 created invest- ment opportunities and attracted an inflow of foreign funds that was closely linked to the development boom.3 More recently, Borts has suggested an important role for export prices in inaugurating the era of expansion.4
This emphasis on long-run economic performance has detracted attention from short-run variations in the Canadian economy during the pre-war period. Some work in this area was attempted by Taylor and Michell,5 who built a composite annual index of prosperity to define cyclical swings in a rough way, and by Mitchell and Thorp6 who provided an annual sketch of conditions in several countries including Canada.
The precise dating of business cycle turning points in Canada owes much to the pioneering work of Chambers. He has produced tentative reference cycle turning points for the last quarter of the nineteenth century, and for the period from 1919 to 1955.7 The only portion of the post-Confederation century yet to be analysed in this manner is therefore the period from 1900 to 1919. Following Chambers, and using techniques made familiar by the
*This study is a by-product of a larger project concerned with money and business cycles in Canada, and the relationships between the American and Canadian monetary systems. Professor Philip Cagan gave valuable advice and encouragement during the early stages of the investigation. The author assumes entire responsibility for the tentative conclusions reached in this paper. lJ. Viner, Canada's Balance of International Indebtedness, 1900-1913 (Cambridge, 1924), and Studies in the Theory of International Trade (New York, 1937). 2G. M. Meier, "Economic Development and the Transfer Mechanism: Canada 1895-1913," this JOURNAL, Feb. 1953, 1-19. 3J. C. Ingram, "Growth in Capacity and Canada's Balance of Payments," American Eco- nomic Review, March 1957, 93-104. 4G. H. Borts, "A Theory of Long-run International Capital Movements," Journal of Political Economy, Aug. 1964, 341-59. 5K. W. Taylor and H. Michell, Statistical Contributions to Canadian Economic History, II (Toronto, 1931), 4. 6W. Thorp, Business Cycle Annals (New York, 1926), 299 ff. 7E. J. Chambers, "Late Nineteenth Century Business Cycles in Canada," this JOURNAL, Aug. 1964, 391-412, and "Canadian Business Cycles since 1919: A Progress Report," this JOURNAL, May 1958, 166-89.
XXXII, no. 3, August/aou't, 1966
This content downloaded from 185.44.78.51 on Tue, 10 Jun 2014 18:23:01 PMAll use subject to JSTOR Terms and Conditions

Early Twentieth Century Business Cycles 355
LES CYCLES ECONOMIQUES AU DEBUT DU SIECLE AU CANADA
KEITH A. J. HAY
Re'cemment le professeur E. J. Chambers a fait avancer la question de lridenti- fication des points de retournement du cycle e'conomique au Canada. Il a fixe les dates du cycle de refe4rence pour le dernier quart du dix-neuvieme si6cle et pour la pe'riode qui suit la premie're guerre mondiale. Dans cet article, on trouvera l'identification des cinq cycles qui se sont produits au cours des deux premieres periodes de'cennales du vingtieme siecle. On a recouru aux me'- thodes tres ge'n4ralement accepte'es du National Bureau of Economic Research pour les reperer.
Par suite de ces travaux, on dispose maintenant d'une chronologie comple'te des points de reference du cycle canadien de 1870 jusqu't 1960. Cette chro- nologie peut servir a comparer la situation canadienne en matie're de con- ,oncture e'conomique a celle d'autres pays. Un premier examen en ce sens revMle que depuis la Confede6ration, les cycles canadiens sont une r6plique de tous les cycles americains sauf un (1926-27), et qu'ils sont en avance, en moyenne, par moins d'un mois, sommets a sommets et creux t creux. Entre le Canada et le Royaume-Uni on trouve un paralle'lisme moins strict des cycles de meme qu'une association chronologique plus faible.
Grdce a ce profil historique des cycles canadiens il est maintenant possible de verifier lrhypothese de Friedman-Schwartz sur la monnaie en tant que cause independante des fluctuations economiques a lraide de donnees sur un deuxieme pays et de comparer les re'sultats avec leur analyse bien connue sur les fluctuations ame'ricaines. Ce sera l'objet d'un autre article.
work of the National Bureau of Economic Research8 this paper will attempt to throw some light on the chronology of Canadian business cycles in the first twenty years of the present century.
With a complete set of reference dates for Canada from 1873 to 1961,9 a preliminary comparison of the timing of Canadian cyclical experience with that in the United States and the United Kingdom is undertaken. Some groundwork is thereby laid for an enquiry into money and business cycles in post-Confederation Canada.
I
A scarcity of monthly economic series for 1900-18 makes it difficult to define reference cycle dates for Canada, and for this reason all conclusions are tenta- 8The standard reference work is A. F. Burns and W. C. Mitchell, Meas-uring Business Cycles (New York, 1946). See also G. H. Moore, ed., Business Cycle Indicators (New York, 1961), I. 9Dates from 1955 to 1961 have been produced by the Department of Trade and Com- merce, Ottawa.
This content downloaded from 185.44.78.51 on Tue, 10 Jun 2014 18:23:01 PMAll use subject to JSTOR Terms and Conditions

356 KEITH A. J. HAY
tive. A further problem arises when fluctuations in the series occur near the extremities of the period under examination. In these cases, it is not always obvious that series have reached specific cycle turning points rather than local maxima or minima of intra-cycle oscillations. As a result, cycle dates close to 1900 and 1919 must be used with caution. Considerable care is taken, how- ever, in the selection of final reference dates; the dates chosen reflect not only evidence from quantitative but also from contemporary qualitative sources.
The essential data are in four forms:
A. Sixteen monthly seasonally adjusted series mainly indicative of external trade, price, credit, and output conditions:
1. Mining exports (value), 1900-18 2. Forest exports (value), 1900-18 3. Animal produce exports (value), 1900-18 4. Agricultural exports (value), 1900-18 5. Manufacturing exports (value), 1900-18 6. Merchandise exports (value), 1900-18 7. Merchandise imports (value), 1900-18 8. Price index of 35 commodities, 1900-18 9. Overdue loans, 1900-18
10. Total loans, 1900-18 11. Call loan rate (inverted), 1900-14 12. Call loans, 1900-18 13. Mortgages (value), 1900-18 14. Bank stock price index, 1900-13 15. Ton-miles of freight carried on railways, 1903-18 16. Gross revenues of railways, 1907-18. Major reliance was placed upon specific cycles identified in these series.10
B. Two monthly series covering part of the period were taken, without adjustment, from current business periodicals: 1. Babson busines index, 1903-14 2. Babson stock index, 1903-14. ITese series were used only for corroborative purposes.
C. A quarterly series covering the whole period, seasonally adjusted, from data given in current business periodicals:
1. Dun's liabilities of business failures, 1900-18.
D. Thirteen annual series of different lengths, and varying degrees of reli- ability, were also examined:
1. Taylor prosperity index, 1900-18 2. Value of iron imports, 1900-15 3. Volume of iron imports, 1900-15 4. Index of urban building, 1900-18 5. New and repair construction expenditure, 1900-18 6. Gross investment, 1900-13
10Details of seasonal adjustment procedure and sources of all data are given in an Appendix.
This content downloaded from 185.44.78.51 on Tue, 10 Jun 2014 18:23:01 PMAll use subject to JSTOR Terms and Conditions

Early Twentieth Century Business Cycles 357
7. Value of wheat crop, 1900-18 8. Immigration rate, 1900-18 9. Bradstreet's liabilities of business failures, 1900-18
10. Dun's failures per 1000 firms, 1900-13 11. Bradstreet's failures per 1000 firms, 1900-13 12. Index of 57 common stocks, 1900-13 13. Real gross national expenditures, 1900-19. Weight was given to these annual indices in determining the year in which the reference cycle reached a turning point."1
The path of an index showing the percentage of seasonally adjusted monthly series expanding, i.e., a current diffusion index, is depicted in Chart I.12 Paucity of series and persistent month-to-month fluctuations produce a very choppy index even after it is smoothed by a three-month moving average. Neverthe- less, this indicator does suggest the occurrence of short-run variations in Canada's economic experience, and gives some guidance on their timing.
Specific cycle turning points are presented in Table I. This evidence shows the problems associated with dating the cyclical pattern, particularly at the beginning and the end of our period. From 1902 to 1914, there is sufficient information to indicate a pattern of recurrent expansions and recessions in economic activity, but obviously we have far fewer than a desirable number of indicators with which to provide a precise timing of peaks and troughs even during these years.
The specific cycle turning points of the monthly series are combined into a historical diffusion index, shown in Chart 2. This index reveals the topo- graphy of cycles in the middle period with some clarity. It brings out the pervasiveness of the two cycles between 1903 and 1910, and that of 1913-17. The intermediate cycle from 1910 to 1912 does not appear to have had such a wide impact on the economy, at least as represented by our small sample of monthly indicators, and can be viewed as no more than a mild recession.
The strands of the foregoing evidence are drawn together in the next section and are used as a basis for reaching some tentative conclusions about the chronology of cyclical turning points in the first two decades of the twentieth century.
II
No attempt is made here to analyse either the causes or the effects of cycles in economic activity falling within our time span. An enquiry of that nature is left to future research, our concern at present being only with a chronology of events. llt should be mentioned that all series based on the money stock or its components were explicitly excluded from use as indicators due to the over-all intentions of the project of which this study forms a part. See note *, above. The rate of change of the money stock is sensitive to business cycle fluctuations determined within our period. This series leads on average by 13.36 months with a standard deviation of approximately 5.77 months at the eleven reference cycle points between 1900 and 1918. 12The diffusion index employs only fourteen monthly indices. The two series excluded are ton-miles of Railway Freight, and Gross Railway Revenue, for which only the profiles of specific cycle turning points were available. (See source of data in Appendix.)
This content downloaded from 185.44.78.51 on Tue, 10 Jun 2014 18:23:01 PMAll use subject to JSTOR Terms and Conditions

CHART I CURRENT DIFFUSION INDEX, CANADA 1900-1917
100.
Percent or
Series zpanding
0
1900 1902 1904 1906 1908 1910 1912 1914 1916
YEAR
Three-month moving average based on movements in fourteen seasonally adjusted monthly series.
This content downloaded from 185.44.78.51 on Tue, 10 Jun 2014 18:23:01 PMAll use subject to JSTOR Terms and Conditions
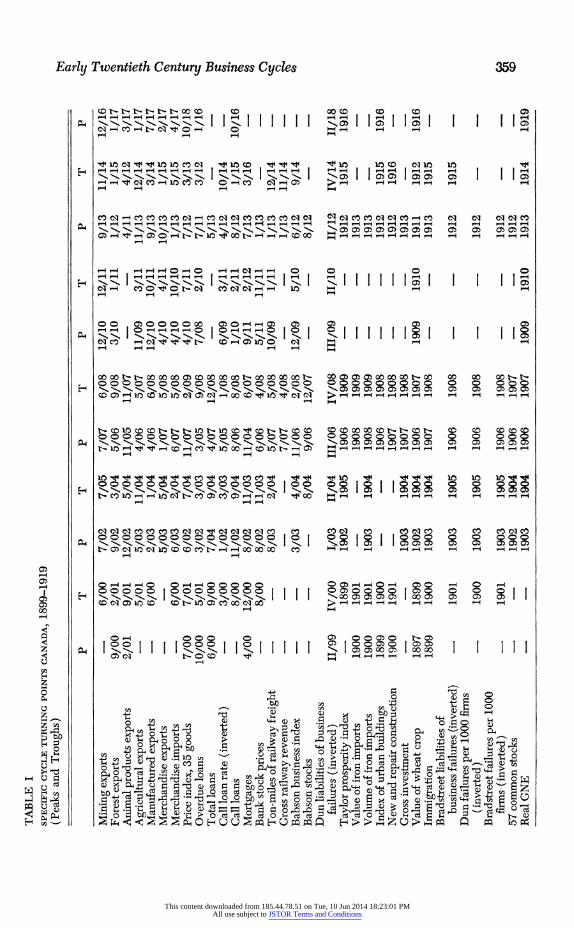
TABLE I SPECIFIC CYCLE TURNING POINTS CANADA, 1899-1919 (Peaks and Troughs)
P T P T P T P T P T P
Mining exports 6/00 7/02 7/05 7/07 6/08 12/10 12/11 9/13 11/14 12/16 Forest exports 9/00 2/01 9/02 3/04 5/06 9/08 3/10 1/11 1/12 1/15 1/17 Animal products exports 2/01 9/01 12/02 5/04 11/05 11/07 - - 4/11 4/12 3/17 Agricultural exports - 5/01 5/03 11/04 4/06 5/07 11/09 3/11 11/13 12/14 1/17 Manufactured exports - 6/00 2/03 1/04 4/06 6/08 12/10 10/11 9/13 3/14 7/17 Merchandise exports - - 5/03 5/04 1/07 5/08 4/10 4/11 10/13 1/15 2/17 Merchandise imports - 6/00 6/03 2/04 6/07 5/08 4/10 10/10 1/13 5/15 4/17 Price index, 35 goods 7/00 7/01 6/02 7/04 11/07 2/09 4/10 7/11 7/12 3/13 10/18 Overdue loans 10/00 5/01 3/02 3/03 3/05 9/06 7/08 2/10 7/11 3/12 1/16 ' Total loans 6/00 9/00 7/04 9/04 4/07 12/08 - 5/13 - -
Call loan rate (inverted) - 3/00 1/02 3/03 5/05 1/08 6/09 3/11 4/12 10/14 -
Call loans - 8/00 11/02 9/04 8/06 8/08 1/10 2/11 8/12 1/15 10/16 Mortgages 4/00 12/00 8/02 11/03 11/04 6/07 9/11 2/12 7/13 3/16 Bank stock prices - 8/00 8/02 11/03 6/06 4/08 5/11 11/11 1/13 - C Ton-miles of railway freight - 8/03 2/04 5/07 5/08 10/09 1/11 1/13 12/14 -
Gross railway revenue - - - 7/07 4/08 1/13 11/14 -
Babson business index 3/03 4/04 11/06 2/08 12/09 5/10 6/12 9/14 -co Babson stocks - - 8/04 9/06 12/07 - 8/12 - -
Dun liabilities of business failures (inverted) II/99 IV/00 1/03 II/04 III/06 IV/08 III/09 II/10 11/12 IV/14 II/18
Taylor prosperity index - 1899 1902 1905 1906 1909 - - 1912 1915 1916 Value of iron imports 1900 1901 - 1908 1909 - 1913 Volume of iron imports 1900 1901 1903 1904 1908 1909 1913 Index of urban buildings 1899 1900 - - 1906 1908 1912 1915 1916 New and repair construction 1900 1901 - 1907 1908 - 1912 1916 Gross investment - - 1903 1904 1907 1908 - 1913 Value of wheat crop 1897 1899 1902 1904 1906 1907 1909 1910 1911 1912 1916 Immigration 1899 1900 1903 1904 1907 1908 - - 1913 1915 Bradstreet liabilities of
business failures (inverted) - 1901 1903 1905 1906 1908 - 1912 1915 Dun failures per 1000 firms
(inverted) 1900 1903 1905 1906 1908 - 1912 Bradstreet failures per 1000
firms (inverted) - 1901 1903 1905 1906 1908 - - 1912 - -
57 common stocks - - 1902 1904 1906 1907 - - 1912 C-
Real GNE - - 1903 1904 1906 1907 1909 1910 1913 1914 1919
This content downloaded from 185.44.78.51 on Tue, 10 Jun 2014 18:23:01 PMAll use subject to JSTOR Terms and Conditions

c)
CHART II HISTORICAL DIFFUSION INDEX, CANADA 1900-1917
100.
50
Percent of
Series Expanding
0- 1900 1902 1904 1906 1908 1910 1912 1914 1916
YEAR
Based on specific cycle turning points in fourteen seasonally adjusted monthly series.
This content downloaded from 185.44.78.51 on Tue, 10 Jun 2014 18:23:01 PMAll use subject to JSTOR Terms and Conditions

Early Twentieth Century Business Cycles 361
TABLE II TENTATIVE CANADIAN REFERENCE CYCLE DATES, 1900-19
Months of Months of Peak Trough expansion contraction
4-1900 2-1901 44f 10 12-1902 6-1904 22 18 12-1906 7-1908 30 19 3-1910 7-1911 20 16
11-1912 1-1915 16 26 1-1918 4-1919* 36 15
*This date is that chosen by Chambers in his "Canadian Busi- ness Cycles since 1919."
fMonths of expansion are from 8-1896 to 4-1900, the former date being taken from Chambers, "Late Nineteenth Century Busi- ness Cycles in Canada."
The tentative reference cycle dates are developed through an examination of the timing distributions of the various specific indicators. Final choice of month and year is also influenced by the diffusion indexes, which portray the aggregate profile of several monthly series.'3 Although not mentioned explic- itly in this note, current economic commentaries also served as guides in the location of cyclical benchmarks.'4 Reference cycle dates chosen by this pro- cess are given in Table II.
Earlier work on the cyclical experience of this period appears to be in fair agreement with our chosen dates. Cairncross does not recognize any deviations from full prosperity between 1900 and 1903,1' although Thorp notes a slight recession in 1900.16 Both of these annalists admit 1904 as a year of recession or "uneven prosperity," but Cairncross alone places the advent of the down- turn in 1903. There is substantial agreement that 1907 and 1908 were marked by depression and perhaps panic. With recovery in 1908, or according to Cairncross in early 1909, a sustained expansion set in which these com- mentators identify as persisting up to a peak in 1913. The fact that they do not find another downswing in 1910 perhaps reflects reliance solely on annual indicators. This reliance would also account for the occasional disparities in the choice of year, when the chosen reference cycle date is very close to the new year. For the later period, the tentative dating of a peak in early 1918 coincides with a suggestion by Barber,17 who explicitly dates the next trough at March 1919, just one month before the reference date chosen by Chambers (see Table III).
'3Under ideal conditions in which all series had equal weight and together fully repre- sented aggregate economic activity, then crossing of the 50 per cent expanding line of a historical diffusion index from below would coincide with a trough, or a peak when crossed from above. See E. J. Chambers, "Canadian Business Cycles since 1919: A Progress Re- port, this JOURNAL, May 1958, 177. 14These commentaries included the Monetary Times, Financial Chronicle, Labour Gazette, Dun's Review, and some issues of the Canadian Banker. 15A. K. Cairncross, Home and Foreign Investment 1870-1913 (Cambridge, 1953), 42. 16W. L. Thorp, Business Annals (New York, 1926), 300-7. 17C. L. Barber, Inventories and the Business Cycle with Special Reference to Canada (Toronto, 1958), 75.
This content downloaded from 185.44.78.51 on Tue, 10 Jun 2014 18:23:01 PMAll use subject to JSTOR Terms and Conditions

362 KEITH A. J. HAY
TABLE III
CANADIAN, U.S. AND U.K. REFERENCE CYCLE DATES AND THEIR TIME RELATION
1870-1961
Lead (-) or lag (+) in months Cycle of Canadian reference date to phase Canada US UK comparable data
P 11/73* 10/73f 9/72f + 1 US +14 UK T 5/79 3/79 6/79 + 2 - 1 P 7/82 3/82 12/82 + 4 -5 T 3/85 5/85 6/86 - 2 -15 P 2/87 3/87 - -1 - T 2/88 4/88 - -2 - P 7/90 7/90 9/90 0 - 2 T 3/91 5/91 -2 - P 2/93 1/93 + 1 - T 3/94 6/94 2/95 - 3 -11 P 8/95 12/95 - -4 - T 8/96 6/97 - -10 - P 4/00t 6/99 6/00 +10 - 2 T 2/01 12/00 9/01 + 2 -7 P 12/02 9/02 6/03 + 3 -6 T 6/04 8/04 11/04 -2 - 5 P 12/06 5/07 6/07 -5 -6 T 7/08 6/08 11/08 - 1 -4 P 3/10 1/10 - + 2 -
T 7/11 1/12 - -6 -
P 11/12 1/13 12/12 - 2 - 1 T 1/15 12/14 9/14 + 1 + 4 P 1/18 8/18 10/18 -7 - 9 T 4/19 3/19 4/19 + 1 0 P 6/20 1/20 6/20? + 5 0 T 9/21 7/21 6/21 + 2 + 3 P 6/23 5/23 11/24 + 1 -17 T 8/24 7/24 7/26 + 1 -23 P 10/26 5/27? - - T - 11/27 9/28 - - P 4/29 8/29 7/29 -4 -3 T 3/33 3/33 8/32 0 + 7 P 7/37 5/37 9/37 + 2 -2 T 10/38 6/38 9/38 + 4 + 1 P n.a. 2/45 n.a. n.a. n.a. T 2/46 10/45 n.a. + 4 n.a. P 10/48 11/48 - -1 -
T 9/49 10/49 - 1 - P 5/53 7/53 4/51[[ - 2 +25 T 6/54 8/54 7/52 - 2 +23 P - 12/55# - - T - - 11/56 - - P 4/57 7/57 9/57 -3 -5 T 4/58 4/58 9/58 0 - 5 P 1/60 5/60 n.a. - 4 n.a. T 3/61 2/61 n.a. + 1 n.a.
*Chambers, "Late Nineteenth Century Business Cycles in Canada," 406, and "Canadian Business Cycles since 1919," 180. Dates from 1954 have been determined by the Depart- ment of Trade and Commerce, Ottawa, Canada.
IBurns and Mitchell, Measuring Business Cycles, 78-9. 4Table II. ?Burns and Mitchell dates revised by Drakatos, "Leading Indicators," 48.
This content downloaded from 185.44.78.51 on Tue, 10 Jun 2014 18:23:01 PMAll use subject to JSTOR Terms and Conditions

Early Twentieth Century Business Cycles 363
With one exception, the length of the expansion phase exceeds that of the following contraction. In this respect, the cycles from 1900 to 1919 conform to an over-all pattern for Canadian cycles from 1870 to 1961 in which the average len,gth of the expansion has been 30.11 months, while that of the contraction has been only 19.40 months.
A complete timetable of reference cycle dates over the period 1870-1960 is set out in Table III. Casual inspection reveals the remarkable conformity, at least in time, of Canadian and American cyclical experience with only one American cycle, that of 1926-1927, not visible in the Canadian record.
The coincidence of North American cycles is further underlined by the similarity of cycle length in the United States and Canada. The average duration of swings between peaks has been 49 months in the United States and just half a month longer in Canada. Canadian expansions have lasted 30.11 months, as against 29.91 months in the US, while contractions on average spanned 19.40 and 19.09 months in the respective economies. These estimates suggest a very close timing relationship between cycles in the US and Canada.
TABLE IV LEAD OR LAG DISTRIBUTIONS OF CANADIAN REFERENCE DATES TO COMPARABLE US AND UK DATA
1870-1961 Lead (-), lag (+) in months
Standard Cycle phase Observations Mean deviation
Canada relative to US Peaks 20 -0.20 3.88 Troughs 21 -0.62 3.14 Peaks and troughs 41 -0.42 3.53
Canada relative to UK Peaks 14 -1.36 9.67 Troughs 14 -2.36 10.41 Peaks and troughs 28 -1.86 10.06
Sourcr: Table III
The lead or lag distributions of Canadian reference dates to comparable US data are shown in Table IV. These data reveal an exceedingly close conformity of cyclical timing. While it has been argued often that linkages
UK dates from 1951 to 1958 are from C. Drakatos, "Leading Indicators in the British Economy," National Institute Economic Review, May 1963, 43.
#UK cycle peak at 12/55 and trough at 11/56 do not appear to coincide with North American experience. A. Maddison dates UK cycles, using Roman numerals to denote quarters, as; 1948-1950 no recession
III 1951 peak III 1952 trough IV 1955 peak III 1958 trough
By choosing as his second peak one date that is a turning point of a cycle not paralleled by North American chronology, Maddison excludes this intra-cycle discovered by Drakatos. Presumably the quarterly index of industrial production used by Maddison failed to detect this rather short fluctuation. See A. Maddison, "The Postwar Business Cycle in Westen Europe and the Role of Government Policy," Banca Nazionale del Lavoro Quarterly Review, June 1960, 104-S.
This content downloaded from 185.44.78.51 on Tue, 10 Jun 2014 18:23:01 PMAll use subject to JSTOR Terms and Conditions
364 KEITH A. J. HAY
exist which serve to transmit economic effects back and forth across the political boundary,'8 it is still surprising to uncover a mean lead of Canadian over American turning points of less than a month in any view of forty-one matched reference dates. Furthermore, there is little tendency for the lead or lag to be more than a quarter of one year. The conclusion is that the Canadian and American calendars of reference dates have coincided except for a very short lead that has exhibited little variability.
When we turn our attention to another vertex of Canada's traditional trade pattern, namely the United Kingdom, we find rather less concurrence in cyclical timetables. First, there are a number of Canadian cycles with no British counterpart, and at least one recent case of a British cycle which had no parallel in North America. Second, over time, UK cycles have tended to be longer than Canadian, both in expansions (35.29 months) and contractions (24.19 months). Third, the average lead of Canadian reference dates over the comparable UK chronology is nearly two months; it also exhibits consider- able variability, demonstrated by a standard deviation of 10.06 months for twenty-eight matched peaks and troughs. Thus Canadian cycle timing has been only loosely related to British timing, with a short but highly variable lead.
The foregoing analysis of the historical records of cycle reference points in Canada and two of her principal trading partners does not purport to say anything about the form of interdependencies or lines of causality among these economies. It does, however, provide sets of comparable benchmarks that may be a useful framework within which to construct a well specified model of inter-economy linkages.
Appendix
MONTHLY SERIES
Import and export data were found in the annual reports of the Department of Trade and Commerce.
The index of bank stock prices is composed of the stock of ten banks: Canadian Bank of Commerce, Dominion Bank, Hamilton Bank, Banque du Hochelaga, Imperial Bank, Merchants' Bank of Canada, Molson's Bank, Bank of Montreal, Bank of Quebec, and the Bank of Toronto. Price quotations are monthly averages found in Canada, Board of Inquiry into the Cost of Living in Canada, Report of the Board (Ottawa, 1915) II, 627-634. The index was weighted by the annual quantity of sales in each stock, given in ibid.
The commodity price index of 35 items (1900 = 100) is taken from K. W. Taylor and H. Mitchell, Statistical Contributions to Canadian Economic History, II, 57. Overdue loans, call loans, total loans and mortgages are found in C. A. Curtis, ibid., I, 57, 53, 50, and 59, respectively.
18Some progress in exploring the avenues by which cyclical forces might be transmitted from the US economy to the Canadian have been explored by the following writers: R. B. Bryce, "The effects on Canada of Industrial Fluctuations in the United States," this JOURNAL, Aug. 1939, 373-86; E. J. Chambers, "Canadian Business Cycles and Merchandise Exports," this JOURNAL, Aug. 1958, 406-10; C. Rosenbluth, "Changing Structural Factors in Canada's Cyclical Sensitivity, 1903-1954," this JOURNAL, Feb. 1958, 21-43; and, amongst others V. W. Malach, International Cycles and Canada's Balance of Payments, 1921-33 (Toronto, 1954).
This content downloaded from 185.44.78.51 on Tue, 10 Jun 2014 18:23:01 PMAll use subject to JSTOR Terms and Conditions

Early Twentieth Century Business Cycles 365
Money rates are based solely on the monthly call loan rate at Montreal for 1900- 1902, and 1914. For the period 1903-1913 the rate is an average of the Montreal call rate (Montreal Chronicle) and the Toronto call rate (Monetary Times, Annual, Jan. 1915, 25).
All the preceding monthly series were seasonally adjusted using the X-9 version of Census Method II, developed by the Federal Reserve Bank in Philadelphia. Data were adjusted in runs up to fifteen years, commencing at five-year intervals.
Babson indices are from various editions of the Monetary Times, Annual. Turning points in the two railway series can be found in G. Rosenbluth, "Changes
in Canadian Sensitivity to United States Business Fluctuations," this JOURNAL, Nov. 1957, 486. These were based on seasonally adjusted monthly data.
QUARTERLY SERIES
Dun's Liabilities of Canadian business failures were compiled from various issues of Dun's Review published between 1900-1919. This series was seasonally adjusted following a procedure given in F. C. Mills, Statistical Methods, 3rd ed. (New York, 1955), chap. 11.
ANNUAL SERIES
The Taylor Prosperity Index, and iron import data found in Taylor and Michell, "Contributions," II, 4 and 28-33, respectively.
Index of urban building activity, new and repair construction are given in K. A. H. Buckley, Capital Formation in Canada, 1896-1930 (Toronto, 1955) 140-1, and 128.
Gross investment is from A. K. Cairncross, Home and Foreign Investment, 1870- 1913 (Cambridge, 1953), 45.
Value of wheat crop, and immigration rate are from 0. J. Firestone, Canada's Economic Development, 1867-1953 (London, 1958), 308 and 240-1.
Annual data on business failures, in both forms, were obtained from the files of the economic research unit of Dun and Bradstreet.
Index of 57 Common Stocks is derived from data given in Cost of Living Report, II, 605.
Real Gross National Expenditure estimates were provided by T. R. Vout of the Department of Trade and Commerce, Canada.
This content downloaded from 185.44.78.51 on Tue, 10 Jun 2014 18:23:01 PMAll use subject to JSTOR Terms and Conditions