Embed Size (px)
Citation preview

A Fairfax County, VA, publication
Department of Public Works and Environmental ServicesWorking for You!
Draft TMDL Action Plans
Board of Supervisors Environmental Committee
February 7, 2017
Draft TMDL Action Plans
Stormwater Management
Glossary of Acronyms
• DEQ – Department of Environmental Quality
• EPA – Environmental Protection Agency
• FCPS – Fairfax County Public Schools
• LA – Load Allocation
• MOS – Margin of Safety
• MOU – Memorandum of Understanding
• MS4 – Municipal Separate Storm Sewer System
• POC – Pollutant of Concern
• PCBs – Polychlorinated Biphenyls
• TMDL – Total Maximum Daily Load
• TN – Total Nitrogen
• TP – Total Phosphorus
• TSS – Total Suspended Solids (a.k.a. Sediment)
• VDOT – Virginia Department of Transportation
• WLA – Wasteload Allocation
• WIP – Watershed Implementation Plan
• WMP – Watershed Management Plan
• WQS – Water Quality Standards
2

Draft TMDL Action Plans
Stormwater Management
Agenda
• Water Quality Protection and Restoration– Approved TMDLs in Fairfax County
– MS4 Permit Overview
– TMDL Action Plans
• Draft TMDL Action Plans– Chesapeake Bay TMDL Action Plan
– Sediment TMDL Action Plan
– Bacteria TMDL Action Plan
– PCB TMDL Action Plan
• Public Comments and Next Steps
3

Draft TMDL Action Plans
Stormwater Management 4
Virginia’s Water Quality Monitoring, Information and Restoration Act (§ 62.1-44.19:4 et seq.) Requires DEQ to:
• Monitor and assess surface water quality
• Identify surface waters that do not meet WQS– Impaired waters
• Develop plans to address impaired waters– TMDL = LA + WLA + MOS
– WLAs implemented through permits
Water Quality Protection and Restoration

Draft TMDL Action Plans
Stormwater Management
Approved TMDLs in Fairfax County
• Nitrogen, Phosphorus and Sediment (TN, TP and TSS)– Chesapeake Bay (countywide)
• Sediment (Benthic Stressor)– Difficult Run
– Bull Run (includes Cub Run, Little Rocky Run, and Johnny Moore Creek)
– Popes Head Creek
• Bacteria (fecal coliform and/or Escherichia coli)– Difficult Run
– Four Mile Run
– Hunting Creek, Cameron Run, and Holmes Run
– Accotink Creek
– Popes Head Creek, Bull Run, and the Occoquan River
• PCBs– Tidal Potomac River (direct drainage areas)
5

TMDL Action Plans
Stormwater Management
MS4 Permit Overview
• Permit re-issued to Fairfax County on April 1, 2015– Compliance coordinated by Stormwater Management
– Requirements implemented by many County agencies and partners
• Authorizes specific discharges from the MS4 to waters of the State/U.S.
6
• Requires development and implementation of an MS4 Program to:– Reduce the contamination
of stormwater runoff
– Prohibit illicit discharges

Draft TMDL Action Plans
Stormwater Management
TMDL Action Plans
• Permit also requires development of TMDL Actions Plans to address WLAs assigned to the County’s MS4– DEQ Guidance Memos for Chesapeake Bay Local TMDL Action Plans
• TMDL Action Plans must be submitted to DEQ no later than March 31, 2017 for TMDLs approved prior to April 1, 2015
• TMDL Action Plans involve the integration of several efforts:– Delineation of the MS4 service area
– Specific TMDL Action Plan content required by DEQ
– Coordination of strategies to meet multiple TMDLs, including the Chesapeake Bay TMDL
– Leveraging stream restoration and retrofit projects from the County’s WMPs and other planning efforts
7

Draft TMDL Action Plans
Stormwater Management
Before there were specific Bay TMDL requirements…
• Fairfax County developed WMPs for each of the County’s 30 watersheds
• Plans identify and address issues affecting water quality
• Include policies and projects
• Many projects in the plans can be used to meet the Chesapeake Bay and local TMDLs
• Plans can be found at www.fairfaxcounty.gov/dpwes/watersheds/
8

Stormwater Management
Draft TMDL Action Plans
Chesapeake Bay TMDL
9

Draft TMDL Action Plans
Stormwater Management
Chesapeake Bay TMDL – A Long, Winding Road
• Voluntary interstate effort formalized by 1983 Chesapeake Bay Agreement
• Shift from voluntary to regulatory –lawsuit and 2010 Chesapeake Bay TMDL– Largest TMDL ever developed by the U.S.
Environmental Protection Agency (EPA)
– Identifies pollutant reductions needed to meet applicable WQS in the Bay and its tidal rivers and embayments
– Pollutants of concern (POCs) in the TMDL are TN, TP, and TSS
– Means and methods in place by 2025
10

Draft TMDL Action Plans
Stormwater Management
Virginia’s Plan for the Chesapeake Bay
• Virginia Watershed Implementation Plan (WIP) Phase I and II
• Virginia’s challenge – it can only require reductions for entities subject to permits or regulations– Retrofits of existing urban lands to reduce pollutant loads
• Impervious urban lands: 9% TN, 16% TP, 20% TSS
• Pervious urban lands : 6% TN, 7.25% TP, 8.75% TSS
– MS4s must achieve required reductions over next three permit cycles
11
ScheduleTN
(lbs/year)TP
(lbs/year)TSS
(lbs/year)
5% by 2020 2,959.42 323.42 263,865.57
40% by 2025 23,675.36 2,587.36 2,110,924.56
100% by 2030 59,188.4 6,468.4 5,277,311.4

Draft TMDL Action Plans
Stormwater Management
Key Components of the Bay Action Plan
• Detailed guidance provided by DEQ– Guidance Memo 15-2005: Chesapeake
Bay TMDL Special Condition Guidance
• New development:– No net increase in TP load: Fairfax
County Stormwater Management Ordinance (July 1, 2014)
– Address increases from 2009 to 2014
– Make up for increases from grandfathered projects
• Means and methods to reduce POCs from existing development
12

Draft TMDL Action Plans
Stormwater Management
Bay Action Plan Means and Methods
• The County has been preparing for a while!– Stormwater retrofits since 2009– Stream restorations since 2010
• Credit for past actions not captured in the Bay Model– Stormwater facilities installed from 2006 to 2009
• Credit for going above regulatory minimums– Nutrient management plans– Single family residential development under one acre
• Project selection process:– Watershed management plans and other inputs– Technical feasibility– Community support– Ability to address local impairments– Cost-benefit ratio
• MOUs with Herndon and Vienna
13

Draft TMDL Action Plans
Stormwater Management
Current Bay Action Plan Compliance Snapshot
14
0.0% 10.0% 20.0% 30.0% 40.0% 50.0% 60.0% 70.0% 80.0% 90.0% 100.0% 110.0% 120.0%
TN
TP
TSS
Structural Retrofits Stream Restoration 2006-2009 Redevelopment SFR 2009-2014
SFR Post 2014 PL 566 Dams Septic Conversion Off-Site Credits NMPs
Land Use Change Other New Source Credits
63.0%
112.8%
64.6%
203020252020
Cost To-Date = ~$79 Million

Draft TMDL Action Plans
Stormwater Management
Current Bay Action Plan Compliance Snapshot
15
TNlbs/year
TPlbs/year
TSSlbs/year
Required Reductions from Existing Sources (5% by 2020)
2,959 323 263,866
+ Offset Increases from 2009 to 2014 -408 -230 -114,820+ Offset Grandfathered Projects 56 8.1 3,727= Total Required Reductions and Offsets for
Current Permit Cycle (by 2020)2,608 102 152,772
- Credit for Historic BMPs (2006-2009) 5,705 670 577,628
- Stormwater Retrofit Projects 6,230 602 722,130
- Stream Restoration Projects 17,447 5,438 1,832,406
- Land Use Change 37 0.5 207
- In-Lake Forebay Projects (PL 566 Dams) 5,424 341 149,689
- Redevelopment Data Coming Soon Data Coming Soon Data Coming Soon
- Single Family Residential < One Acre 135 22 11,978
- Septic Conversion to Sanitary Sewer 1,807 -- --
- Nutrient Management Plans 90 1.8 --
= Total Reductions Achieved Using Means and Methods from Section 5
36,875 7,077 3,294,038
Reductions Remaining for Current Permit Cycle -34,267 -6,975 -3,141,266Credit Applied to Next Permit Cycle 34,267 6,975 3,141,266

Stormwater Management
Draft Chesapeake Bay TMDL Action Plan
Stream Restoration
16
PollutantTN
(lbs/year)TP
(lbs/year)TSS
(lbs/year)Net Reduction (Credit) 17,447 5,438 1,832,406
Percent of Total (2030) Target 29.4% 84.0% 34.7%

Draft TMDL Action Plans
Stormwater Management
Uncertainties, Challenges, and Next Steps
• Remaining POC Reductions– Still must achieve additional ~40% of required reductions in TN and TSS
– Several projects not yet constructed (in-design or being scoped)
– Fewer easily accessible stream restoration projects
• 2017 Mid-Term Assessment and WIP Phase III– Changes in POC reduction targets?
– Changes in target dates?
• Local TMDL Action Plans for Sediment– Higher local reduction targets
– Bull Run, Difficult Run, and Popes Head Creek
• Maintenance is Critical– Credits will expire if projects are not maintained
17

Stormwater Management
Draft TMDL Action Plans
Benthic (Sediment) TMDL
18

• DEQ encourages coordination of strategies to meet multiple TMDLs– The Sediment TMDL Action Plan leverages reductions achieved for TSS under the
Chesapeake Bay TMDL Action Plan
• However, there are several key differences:
Draft TMDL Action Plans
Stormwater Management
Relationship of Sediment TMDL to Bay TMDL
19
Key Differences Chesapeake Bay TMDL Local TMDLs
Assignment of Pollutant Reductions
Specific to Fairfax County Aggregated with other MS4s (Fairfax County Public Schools, Virginia Department of Transportation, etc.)
Deadline for Compliance
Implementation must be completed over three permit cycles (by 2030)
Iterative implementation over multiple permit cycles
Sediment Loading Factors
Assumes transport loss in sediment reduction from stream restoration to the Bay
Full credit for sediment reduced by stream restoration
Reduction Efficiencies Techniques well-defined for TN, TP and TSS
For bacteria and PCBs, techniques are mostly non-structural, reduction efficiencies not well defined

Draft TMDL Action Plans
Stormwater Management
Key Existing and Planned Program Elements
• Control sediment from new development– Erosion and Sedimentation Control Ordinance during construction (Chapter
104 of County Code)
– Stormwater Management Ordinance for post-construction design (Chapter 124 of County Code)
• Achieve load reductions through redevelopment
• Identify and eliminate illicit discharges– Dry weather outfall screening
– Staff training
– Public education and reporting mechanisms
• Assess opportunities to reduce sediment loads– County WMPs
– 2013 County Facility Site Assessment Project
• Leverage Chesapeake Bay TMDL Action Plan
20

Draft TMDL Action Plans
Stormwater Management
Structural Retrofit and Stream Restoration Projects
21

Draft TMDL Action Plans
Stormwater Management
Reductions Achieved To Date and Next Steps
• Continue to coordinate with Chesapeake Bay TMDL Action Plan– Prioritize projects in watersheds with local sediment TMDLs– Implement at least one additional project in each watershed by March 31,
2020
• Reassess approach after Chesapeake Bay TMDL reductions are achieved
22
WaterbodyExisting Aggregated
Sediment Load (lbs/yr)
Load Reduction Required(lbs/yr)
Load Reductions Achieved by Fairfax
County To-Date (lbs/yr)
Bull Run1 38,941,000 30,039,800 1,407,131
Difficult Run2 10,633,200 3,443,200 1,439,143
Popes Head Creek1 4,350,000 1,207,000 41,0131 WLA aggregated with VDOT, FCPS 2 WLA aggregated with City of Fairfax, Town of Vienna, VDOT, FCPS and George Washington Parkway

Stormwater Management
Draft TMDL Action Plans
Bacteria
23

Draft TMDL Action Plans
Stormwater Management
Reduction Targets and Sources
• TMDL reduction targets range from 83% to 99%
• Potential sources:– Sanitary sewer cross-connections
– Sanitary sewer overflows
– Failing septic systems
– Pet waste
– Wildlife
24

Draft TMDL Action Plans
Stormwater Management
Key Existing and Planned Program Elements
• Prohibit illicit discharges to the storm sewer system– Stormwater Management Ordinance (Section 124-9-3 of County Code)
– “Pooper Scooper” law (Section 41.1-2-6 of County Code)
• Identify and eliminate illicit discharges– Sanitary sewer inspection program
– Dry weather outfall screening
– Staff training
– Public education and reporting mechanisms
• Septic system pump out program
• Public education and outreach– Storm drain marking
– Northern Virginia Regional Commission Clean Water Partners
• Geese and deer management programs
25

Stormwater Management
Draft TMDL Action Plans
Polychlorinated Biphenyls (PCBs)
26
Draft TMDL Action Plans
Stormwater Management
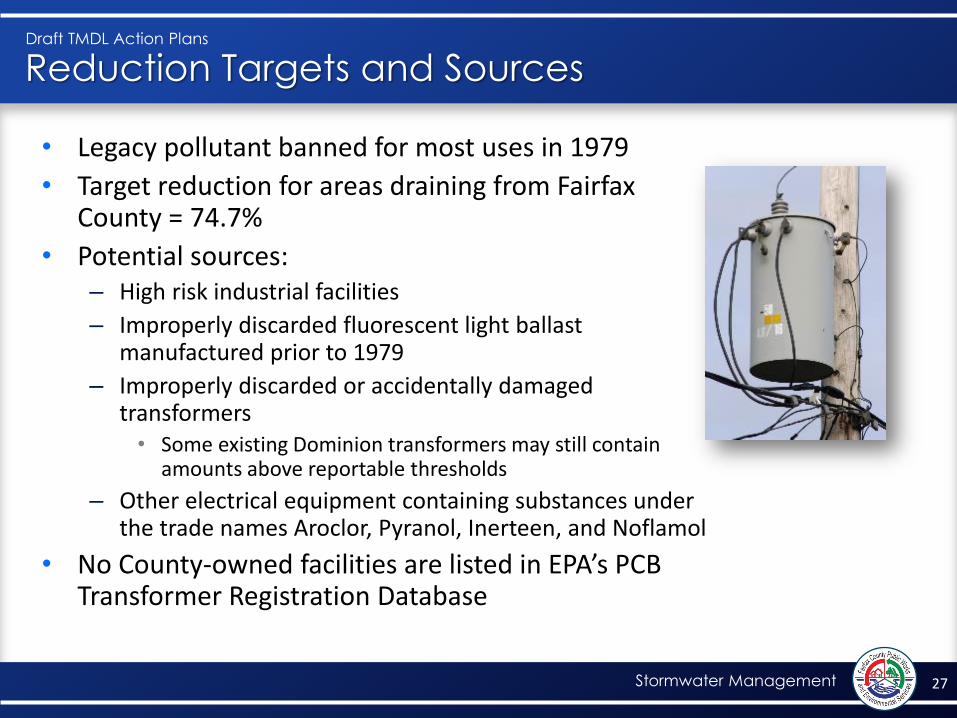
Reduction Targets and Sources
• Legacy pollutant banned for most uses in 1979
• Target reduction for areas draining from Fairfax County = 74.7%
• Potential sources:– High risk industrial facilities
– Improperly discarded fluorescent light ballast manufactured prior to 1979
– Improperly discarded or accidentally damaged transformers• Some existing Dominion transformers may still contain
amounts above reportable thresholds
– Other electrical equipment containing substances under the trade names Aroclor, Pyranol, Inerteen, and Noflamol
• No County-owned facilities are listed in EPA’s PCB Transformer Registration Database
27

Draft TMDL Action Plans
Stormwater Management
Key Existing and Planned Program Elements
• Same prohibition on illicit discharges and improper disposal as with Sediment and Bacteria TMDL Action Plans
• Industrial and high risk runoff program– Inspect point of connection to MS4 for evidence of significant pollutant
loads
– Require control measures as necessary and/or appropriate
• Enhanced training for County employees– Potential sources that may be encountered at County facilities and/or in
the field
– What to do if equipment, machinery, or contaminated soil is discovered that may contain PCBs
28

Draft TMDL Action Plans
Stormwater Management
Public Comment Process and Next Steps
29
• Public Meetings:
– December 14 and 15, 2016 at the Fairfax County Government Center
– January 3, 2017 at the Mount Vernon Governmental Center
• Public Comment Period: December 14, 2016 to January 23, 2017
• Comments Received from Environmental Quality Advisory Council, Friends of Accotink Creek, Friends of Dyke Marsh and Chesapeake Bay Foundation
– Requests for clarification
– Policy recommendations
– Increased public outreach and involvement
– Proposed additional/alternative environmental measures/goals
• Comments are being evaluated and will be addressed as appropriate
• TMDL Action Plans must be submitted to the DEQ by March 31, 2017

Additional Information
For additional information, please contact
www.fairfaxcounty.gov/dpwes
Draft TMDL Action Plans
Stormwater Management 30
Kate Bennett, MS4 Program Coordinator
703-324-5816

A Fairfax County, VA, publication
Department of Public Works and Environmental ServicesWorking for You!
Stormwater Management – Business Plan 2017
Program Status, Challenges, Drivers and Costs – Planning for The Future
February 7, 2017

Stormwater Management
Business Plan 2017 Overview
• Study Purpose – A chance to step back and assess status– Identify challenges and drivers for the future
• Science and policy in stormwater management is continuing to evolve, creating its own set of challenges.
• Manage change effectively and efficiently is goal.
– Complete review of opportunities for improvement.– Reevaluate financial plan to ensure sufficiency in
resources.– Engage staff across multiple agencies to strengthen
partnerships.– Identify actions that support efficiencies in program
execution.
• Study Process – Due Diligence and Transparency– 3 Staff Teams with representation across DPWES.– Focus on Operations, Contracting, and Crosscutting
Issues.– 10-Year planning horizon with updated financial model.– Evaluation of funding strategy.
2
Reviewing Past Projects and Scoping Future Projects

Status of Stormwater Programs and Services
• Rapid growth over past decade is driven by regulatory and infrastructure needs.
• Program elements are maturing
• Solid foundation in place to build on policy and best practices.
• Have a greater understanding of drivers in regulatory mandates and infrastructure conditions.
• Create opportunity to adjust, improve, prepare - looking forward.
3
Little Pimmit Run Stream Restoration

Study Targets
• Operational Focus– Asset management
– Project implementation
– Chesapeake Bay strategy
– Local stream and drainage system improvements
– Long term
• Process Focus– Contracting procedures
– Data management
– Project implementation
• Crosscutting Issues– Public Education and Outreach
– Safety
4

Program Opportunities – A Balanced Program
• Compliance– Based on current targets – achieve Bay goals by 2025
– Strong foundation to address other MS4 permit requirements
• Asset management – Increase investment to address drainage system needs
– Evaluate and plan for neighborhood focused program
• Natural system protection– Increase focus on stream protection and impairments
• Regional partnerships– Continue support for efficiency and effectiveness
• Emergency response and flood risk – Focus on planning and mitigation
5

Chesapeake Bay TMDL – Status 2017
6
Metric Amount Method FY16 Estimate Target Priority Notes
Chesapeake Bay
TMDL – nitrogen
Reductions
59,188.4 Pounds
(Based on 2017
Ches. Bay TMDL
Action Plan –
subject to change)
Percent
Complete
63%(Based on 2017
Ches. Bay TMDL
Action Plan –
subject to
change)
100% Must Regulatory target 5% by
2020, 40% by 2025 and
100% by 2030. MS4 permit
requirement – amount and
timing subject to change in
next MS4 permit (2020).
Chesapeake Bay
TMDL – phosphorus
reductions
6,468.4 Pounds
(Based on 2017
Ches. Bay TMDL
Action Plan –
subject to change)
Percent
Complete
113%(Based on 2017
Ches. Bay TMDL
Action Plan –
subject to
change)
100% Must Target 5% by 2020, 40% by
2025 and 100% by 2030.
MS4 permit requirement –
amount and timing subject
to change in next MS4
permit (2020).
Chesapeake Bay
TMDL – sediment
reductions
5,277,311.4 Pounds
(Based on 2017
Ches. Bay TMDL
Action Plan –
subject to change)
Percent
Complete
65%(Based on 2017
Ches. Bay TMDL
Action Plan –
subject to
change)
100% Must Target 5% by 2020, 40% by
2025 and 100% by 2030.
MS4 permit requirement –
amount and timing subject
to change in next MS4
permit (2020).
What does this mean? County can meet current targets in 2025
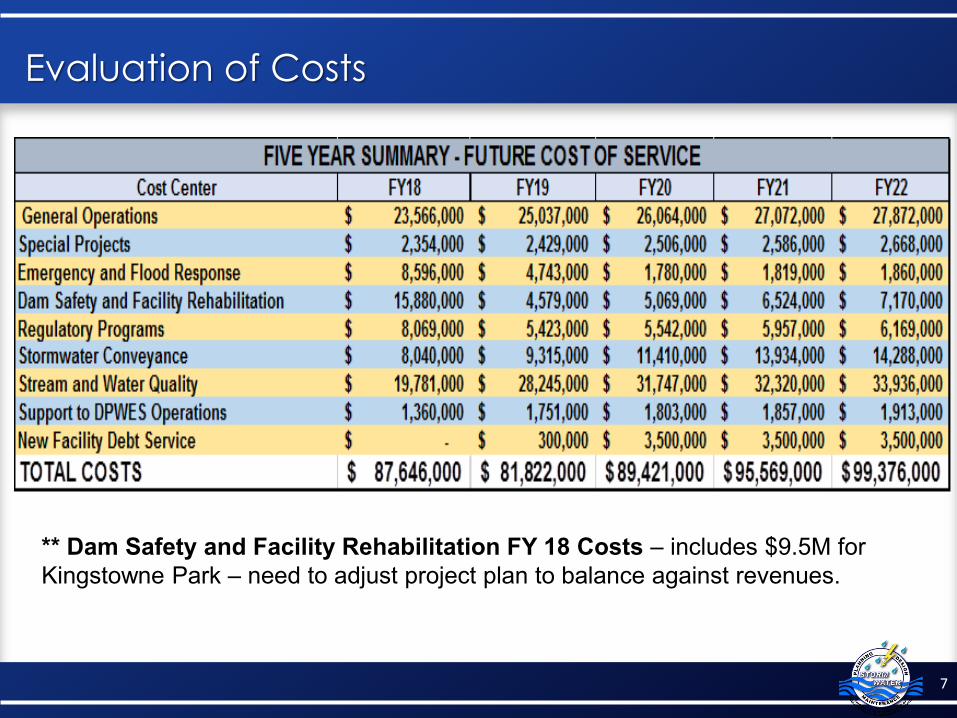
Evaluation of Costs
7
** Dam Safety and Facility Rehabilitation FY 18 Costs – includes $9.5M for
Kingstowne Park – need to adjust project plan to balance against revenues.

Financial Sufficiency
• Special Service District Tax = $0.0275 rate
• Based on current conditions rate should grow to $0.04 over next four years and adjusted to address full program based on changes in mandates.
• Future Challenges that may impact program:– Chesapeake Bay TMDL reduction targets may change with model update
– Cost of operation of green infrastructure – long-term maintenance costs
– MS4 Permit renewal in 2020
– State approach to credit structure for TMDLs
– Asset management of conveyance dependent on completion of inspection program
8

FY 15 Project Completion
9
Project NameStream Restoration: Length Restored(LF)
Pond Retrofits: Area Treated (Ac)
Construction
Completion
DesignLand
Acquisition
PermitConstructio
nWPFO UTILITIES Total Cost
Oak Marr Rec Center Stormwater Enhancements (DF87-0006) 0.95 8/1/2014 $23,274 $155,785 $179,059
Miller Heights Outfall 233 26.72 8/7/2014 $38,000 $400 $162,300 $9,700 $210,400
Bailey's Crossroads Fire Station 8/10/2014 $51,827 $55,000 $4,661 $111,488
Crosspointe Sec 15 Pd 15A (0775DP) 11.99 8/23/2014 $101,237 $100 $73,883 $21,424 $196,644
Mount Vernon High School Practice Field 1.64 9/3/2014 $10,250 $60,315 $3,553 $74,118
Oakton Library 1.78 9/15/2014 $39,776 $6,516 $262,829 $23,000 $2,500 $334,621
Indian Run Stream Restoration 590 9/26/2014 $393,800 $559,800 $953,600
Fire and Rescue Training Academy II 0.82 9/27/2014 $43,402 $75,808 $119,210
South Lakes Stream Restoration 660 20.96 10/1/2014 $206,918 $120 $480,681 $20,362 $708,081
Woodgate Basins (0950DP, 1024DP) 0.87 10/3/2014 $200 $35,724 $35,924
Banks Property Stream Restoration 1142 11/7/2014 $394,300 $1,200 $110 $770,000 $73,397 $11,000 $1,250,007
Brookfield Park Dam 48.86 11/14/2014 $328,843 $15,347 $2,495,000 $1,911 $2,841,101
Armfield Sec 5 78.79 11/15/2014 $32,345 $4,880 $600 $267,104 $12,484 $317,413
Village Park, The Sec 2B, 3 (PC81-0001/0090DP) 11.21 11/17/2014 $31,250 $4,900 $460 $335,000 $7,361 $378,971
Merrifield Human Services Center (Mid County) 1.02 11/21/2014 $4,350 $237,753 $36,070 $278,173
Woodrow Wilson Library Stormwater Enhancements 0.7 1/13/2015 $40,735 $193,144 $16,108 $249,987
Stratton Woods Park Stormwater Enhancements (HC87-0001) 0.42 2/6/2015 $17,014 $21,000 $38,014
Bradley Acres Section 2A Retrofit 37.43 3/16/2015 $90,500 $600 $444,510 $0 $0 $535,610
Rolling Valley West Synthetic Field (PC87-0002) 1.45 4/1/2015 $41,658 $23,444 $65,102
Oakton Swim and Racquet Club (DF9045A6) 43.74 4/20/2015 $46,500 $660 $218,600 $4,600 $270,360
Americana Park 4/30/2015 $5,317 $11,664 $16,982
Mason Neck West 12.01 5/1/2015 $82,654 $660 $180,601 $7,784 $271,700
Difficult Run Tributary at Oakton Estates (DF9045) 300 6/26/2015 $85,000 $200 $211,000 $14,000 $310,200

10
ID Project Name Fiscal year
Design and Construction Cost
($)Restored
Length (LF)
TN Removed
(lb)TP Removed
(lb)
TSS Removed
(lb) CostPerTN CostPerTP CostPerTSS Watershed
27Poplar Springs FY2009 $298,200.00 693 313.99 58.28 20,094.37 $949.70 $5,116.26 $14.84Pohick Creek $430.30
28Seven Woods FY2009 $4,300.00 185 54.37 5.19 1,788.10
Little Hunting Creek
30Big Rocky Tributary FY2010 $191,600.00 336 137.74 21.19 7,307.04 $1,391.05 $9,040.10 $26.22Cub Run $570.24 31Dolley Madison Library - Dead Run Stream Restoration FY2010 $594,400.00 1400 519.67 98.12 33,828.90 $1,143.81 $6,057.73 $17.57Dead Run $424.57 32Bridle Path Stream Restoration FY2011 $898,130.00 1650 790.72 138.77 47,843.73 $1,135.84 $6,471.93 $18.77Scotts Run $544.32 34Schneider Branch Stream Restoration FY2011 $631,100.00 1000 275.92 26.21 9,037.15 $2,287.27 $24,076.09 $69.83Cub Run $631.10
35Government Center Stormwater Retrofit FY2012 $275,000.00 1000 326.14 65.88 22,713.69 $843.19 $4,174.11 $12.11Difficult Run $275.00
36Patriot Village Sec 2 FY2012 $44,140.00 220 78.97 3.08 1,063.19Accotink Creek
38Villa D'Este Village Sec 3 FY2012 $92,550.00 260 19.50 17.68 11,668.80Accotink Creek
39Tripps Run FY2013 $676,656.00 1430 784.78 120.27 41,464.56 $862.23 $5,626.13 $16.32Cameron Run $473.19
40Beach Mill Road Stream Restoration FY2014 $318,091.00 250 74.84 10.51 3,624.52 $4,250.22 $30,256.56 $87.76Pond Branch $1,272.36
41Sandy Run Stream Restoration FY2014 $211,658.00 300 133.24 8.41 2,899.62 $1,588.57 $25,165.92 $73.00Sandy Run $705.53
43Wolftrap Creek FY2014 $1,749,434.00 2089 1,016.02 90.78 31,296.08 $1,721.85 $19,272.00 $55.90Difficult Run $837.45
44Wakefield Run Stream Restoration FY2014 $549,000.00 816 354.99 40.03 13,802.19 $1,546.54 $13,713.35 $39.78Accotink Creek $672.79
45Difficult Run Tributary at Oakton Estates (DF9045) FY2015 $337,000.00 300 120.98 18.92 6,524.14 $2,785.53 $17,808.43 $51.65Difficult Run $1,123.33
46Indian Run Stream Restoration FY2015 $795,020.94 590 217.58 49.62 17,107.76 $3,653.94 $16,021.56 $46.47Cameron Run $1,347.49
47Paul Spring Branch Tributary at GMP FY2016 $330,642.89 562 185.19 41.36 5,120.59 $1,785.40 $7,994.53 $64.57
Little Hunting Creek $588.33
48Banks Property Stream Restoration FY2015 $1,170,000.00 1142 394.65 32.02 11,037.89 $2,964.67 $36,544.26 $106.00Dogue Creek $1,024.52
49Flatlick Confluence Stream Restoration FY2011 $633,530.00 1400 105.00 95.20 62,832.00 $6,033.62 $6,654.73 $10.08Cub Run $452.52
50South Lakes Stream Restoration FY2015 $646,508.73 660 141.19 12.77 4,401.62 $4,579.10 $50,638.50 $146.88Difficult Run $979.56
56Rabbit Branch Tributary(PC9263) FY2014 $643,721.45 1067 352.49 22.44 7,734.74 $1,826.21 $28,692.72 $83.22Pohick Creek $603.30
57Big Rocky Run Phase II FY2014 $2,457,798.40 2550 1,075.28 212.30 73,191.24 $2,285.73 $11,577.28 $33.58Cub Run $963.84
62Pohick Creek Tributary Stream Restoration (PC9257) FY2014 $784,246.58 900 249.68 15.14 5,219.32 $3,140.97 $51,803.41 $150.26Pohick Creek $871.39
63Pohick Creek Tributary Stream Restoration (PC9257) FY2014 $55,768.65 64 17.56 0.99 340.22 $3,175.81 $56,512.81 $163.92PohickCreek $871.39
64Pohick Creek Tributary Stream Restoration (PC9257) FY2014 $304,984.78 350 123.29 7.36 2,537.17 $2,473.72 $41,442.73 $120.21Pohick Creek $871.39
65Rabbit Branch Tributary(PC9263) FY2014 72396.0396 120 27.23 2.86 985.87 $2,658.36 $25,317.11 $73.43PohickCreek $603.30
66Rabbit Branch Tributary(PC9263) FY2014 197882.5083 328 73.63 4.14 1,426.61 $2,687.38 $47,821.20 $138.71PohickCreek $603.30
67Scotts Run at Arbor Row Hanover Parcel FY2014 $238,000.00 790 246.98 64.34 22,182.09 $963.65 $3,699.08 $10.73Scotts Run $301.27

Cost Benefit – Stream Projects 2009-2016
• w
11
Stream Restoration
Average of $/lb TN
Average of $/lb TP
Average of $/lb TSS
Average of $/LF
Number of Projects
FY2009 $ 950 $ 5,116 $ 15 $ 227 2
FY2010 $ 1,267 $ 7,549 $ 22 $ 497 2
FY2011 $ 3,152 $ 12,401 $ 33 $ 543 3
FY2012 $ 843 $ 4,174 $ 12 $ 277 3
FY2013 $ 862 $ 5,626 $ 16 $ 473 1
FY2014 $ 2,360 $ 29,606 $ 86 $ 822 8
FY2015 $ 3,496 $ 30,253 $ 88 $ 1,119 4
FY2016 $ 1,785 $ 7,995 $ 65 $ 588 1
Grand Total $ 2,349 $ 22,060 $ 65 $ 680 29
Stream Restoration
Total Cost ($)TN Removed
(lb/yr)TP Removed
(lb/yr)TSS Removed
(lb/yr)Restored
Length (LF)
FY2009 $ 302,500 368.36 63.47 21,882.46 878
FY2010 $ 786,000 657.40 119.32 41,135.94 1,736
FY2011 $ 2,162,760 1,171.64 260.19 119,712.88 4,050
FY2012 $ 411,690 424.61 86.65 35,445.68 1,480
FY2013 $ 676,656 784.78 120.27 41,464.56 1,430
FY2014 $ 7,582,981 3,745.23 479.29 165,239.67 9,624
FY2015 $ 2,948,530 874.40 113.33 39,071.41 2,692
FY2016 $ 330,643 185.19 41.36 5,120.59 562
Grand Total $ 15,201,760 8,211.62 1,283.86 469,073.21 22,452
Wakefield Park Stream Restoration

Completed Facilities FY09-16
12
PracticesNumberInstalled TN TP TSS
Stream Restoration 22 $ 2,200 $ 21,500 $ 64
Pond Retrofits 56 $ 6,300 $ 94,369 $ 49
Infiltration Swales & Trenches 7 $ 10,000 $ 93,000 $ 124
Dry Swales 13 $ 9,593 105,748 $ 154
Bioretention (Rain Gardens) 39 $ 22,800 $ 188,000 $ 248
Pervious Pavement 21 $ 34,264 $ 296,270 $ 386
Capital Cost ($/(lb/yr))
**Focused on the Bay TMDL, Local TMDL’s will require some different metrics

Project Cost Trends
• Rapid expansion in amount of projects– Availability of materials
– Availability of skilled workers
– Number of projects locally and regionally increasing
• Contractors, Engineers, and Owners are still learning– Work is much more specialized than originally
envisioned
– Providing warranties on natural systems is risky
– Community expectations – saving trees, keeping paths open
13
Rainbow Bridge Outfall Restoration

Conclusions
• Program is on a sound basis to manage change.
• Balanced program builds for the future.
• Metrics developed in Plan project performance goals and set expectations.
• Program maturity brings greater stability and predictability.
• Flexibility is critical due to uncertainties; ability to update analysis is a key outcome of Plan.
14
Brookfield Pond

Additional Information
For additional information, please contact
www.fairfaxcounty.gov/dpwes
Randy Bartlett
15

A Fairfax County, VA, publication
Department of Public Works and Environmental ServicesWorking for You!
Stormwater Management – Utility Funding Option
February 7, 2017

Stormwater Management
Stormwater Utility Financing in Virginia
Utility features:
• Creates relationship between the need for public stormwater and the amount paid per property
• Impervious area is basis of charge in VA
• Credits provided
• Operates similar to wastewater financing
2

Stormwater Management
Stormwater Utility Financing in Virginia
3
• Who can be charged? All properties EXCEPT those excluded by law.
• How is cost allocated? Based on impervious area on each parcel.
• How is the fee collected? Have choices - can use tax bill, separate bill, utility bill.
• What if the bill isn’t paid? Can collect using same tools as tax bill.
• Are credits available to offset fees? Credits are mandated by law for some and allowable for others.

Stormwater Management
Analysis based on Business Plan
4
Two Rate Scenarios Analyzed Based on Impervious Area
• Equivalent Residential Unit (ERU) Approach– Median impervious area for single family detached residential – set ERU
– Measure impervious area on all other properties and determine number of ERUs
– ERU Rate: $149.97/year for each billing unit of 3065sf (SFDR pay one billing unit)
• Fixed Billable Unit Rate Per Square Foot of Imperviousness– Treats all properties with IA the same regardless of land use
– $22.30/year for each billing unit of 500sf
– Provides credits
Stormwater Management
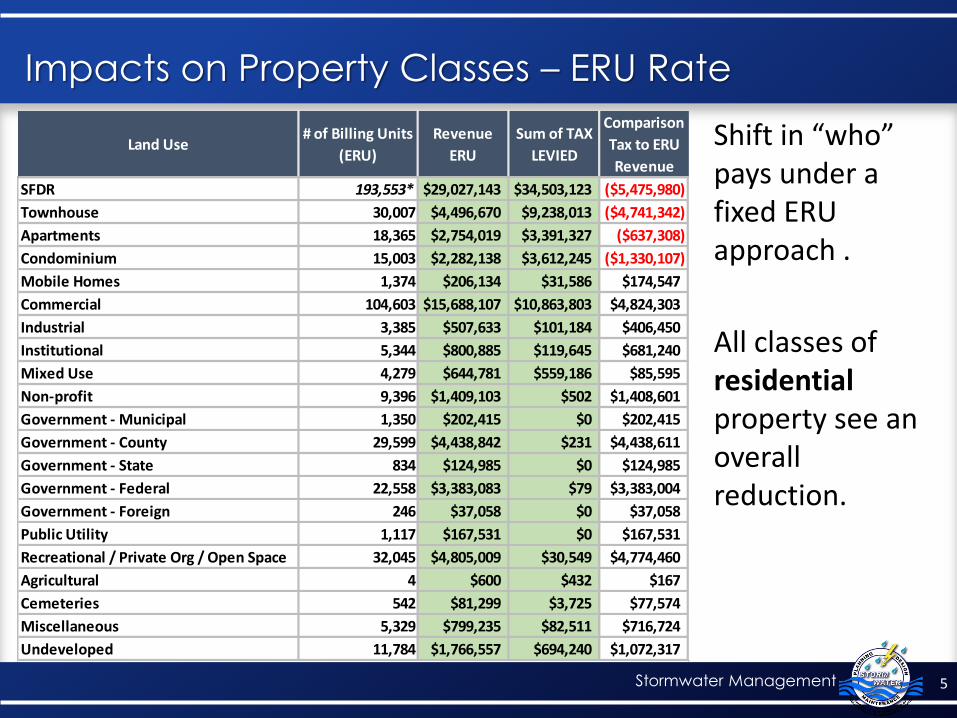
Impacts on Property Classes – ERU Rate
Shift in “who” pays under a fixed ERU approach .
All classes of residentialproperty see an overall reduction.
5
Land Use# of Billing Units
(ERU)
Revenue
ERU
Sum of TAX
LEVIED
Comparison
Tax to ERU
Revenue
SFDR 193,553* $29,027,143 $34,503,123 ($5,475,980)
Townhouse 30,007 $4,496,670 $9,238,013 ($4,741,342)
Apartments 18,365 $2,754,019 $3,391,327 ($637,308)
Condominium 15,003 $2,282,138 $3,612,245 ($1,330,107)
Mobile Homes 1,374 $206,134 $31,586 $174,547
Commercial 104,603 $15,688,107 $10,863,803 $4,824,303
Industrial 3,385 $507,633 $101,184 $406,450
Institutional 5,344 $800,885 $119,645 $681,240
Mixed Use 4,279 $644,781 $559,186 $85,595
Non-profit 9,396 $1,409,103 $502 $1,408,601
Government - Municipal 1,350 $202,415 $0 $202,415
Government - County 29,599 $4,438,842 $231 $4,438,611
Government - State 834 $124,985 $0 $124,985
Government - Federal 22,558 $3,383,083 $79 $3,383,004
Government - Foreign 246 $37,058 $0 $37,058
Public Utility 1,117 $167,531 $0 $167,531
Recreational / Private Org / Open Space 32,045 $4,805,009 $30,549 $4,774,460
Agricultural 4 $600 $432 $167
Cemeteries 542 $81,299 $3,725 $77,574
Miscellaneous 5,329 $799,235 $82,511 $716,724
Undeveloped 11,784 $1,766,557 $694,240 $1,072,317

Stormwater Management
Shift in “who” pays under a fixed billing unit of 500 sf.
6
Land Use# of Billing
Units (500sf)Revenue 500sf
Sum of TAX LEVIED
Comparison Tax to 500sf Revenue
SFDR 1,478,099 $32,961,737 $34,503,123 ($1,541,386)
Townhouse 184,000 $4,102,883 $9,238,013 ($5,135,129)
Apartments 112,610 $2,510,871 $3,391,327 ($880,456)
Condominium 92,000 $2,051,787 $3,612,245 ($1,560,458)
Mobile Homes 8,428 $187,944 $31,586 $156,358
Commercial 641,418 $14,303,778 $10,863,803 $3,439,974
Industrial 20,755 $462,845 $101,184 $361,662
Institutional 32,770 $730,809 $119,645 $611,164
Mixed Use 26,238 $585,152 $559,186 $25,966
Non-profit 57,617 $1,284,846 $502 $1,284,344
Government - Municipal 8,276 $184,559 $0 $184,559
Government - County 181,501 $4,047,459 $231 $4,047,228
Government - State 5,112 $114,009 $0 $114,009
Government - Federal 138,326 $3,084,674 $79 $3,084,595
Government - Foreign 1,509 $33,648 $0 $33,648
Public Utility 6,850 $152,755 $0 $152,755
Recreational / Private Org / Open Space 196,498 $4,381,834 $30,549 $4,351,285
Agricultural 25 $558 $432 $125
Cemeteries 3,324 $74,121 $3,725 $70,396
Miscellaneous 32,676 $728,688 $82,511 $646,177
Undeveloped 72,255 $1,611,224 $694,240 $916,984
All classes of residential property see an overall reduction.
Impacts on Property Classes – Fixed Billing Unit Rate

Stormwater Management
Analysis of Impacts within SFDR Property Class
Impacts within the Single Family Detached Residential Class
7

Stormwater Management
Why consider a utility approach?
• Establish a relationship between fees and usage– The utility approach better ties fees to usage and will more directly
impact behaviors. The more you use (impervious area) the more you will pay. Greatly improves the ability to modify consumption / consumer behaviors to support program goals such as conservation or reducing effective imperviousness.
– The utility approach will allow us to create incentives or credits (that are required by law) for the installation of stormwater controls that align with program objectives.
8

Why consider a utility approach?
• Psychology of paying a tax versus paying a utility / Consumer behaviors– Takes the program out of the general fund and out of direct competition
for general fund supported programs – schools, public safety, etc…
– The program will be better served with a rate payer/consumer relationship rather than another general funded supported program.
– We would go through rate setting and communication processes similar to what is currently done for wastewater. Fee payers will see themselves as consumers of a service.
9

Why consider a utility approach?
• Other advantages– Bonding / financing – will better facilitate future financing opportunities
– As the program matures and capital and operation cost increase …
– Wastewater comparison
– Provides a more stable source of funding – not subject to the ups and downs of commercial and residential real estate values and less susceptible to changes to the real estate rate. This helps with program management and planning for a very intensive operational and capital program.
10

Implementation Considerations
• Billing options• Water Bills – Not all properties receive water bills• Tax Bills – Current fee is collected on tax bill• Separate quarterly or monthly Stormwater bill
• Residential rates – tiered versus flat• Tiers based on impervious area on a lot• Determine number of Tiers and Ranges
• Administrative Costs • Regularly update GIS impervious data• Utility administration (estimated at <1% and decrease over time)
• Establishment and administration of credit program• Required by state law• May reduce revenues from newer properties• Ongoing verification program required
11

Implementation Considerations
• Billing options• Water Bills – Not all properties receive water bills• Tax Bills – Current fee is collected on tax bill• Separate quarterly or monthly Stormwater bill
• Residential rates – tiered versus flat• Tiers based on impervious area on a lot• Determine number of Tiers and Ranges
• Administrative Costs • Regularly update GIS impervious data• Utility administration (estimated at <1% and decrease over time)
• Establishment and administration of credit program• Required by state law• May reduce revenues from newer properties• Ongoing verification program required
12

Implementation Considerations Cont’
• Government owned and tax exempt properties• Allows us to bill non profits• Allows us to bill state and Federal properties that drain thru our
system – Not all properties• Should we bill County Properties
• Towns• Utility fee applied to the towns (similar to the tax)• Update agreements
• County maintenance of private facilities • Enterprise fund
• Revenue based Borrowing - Do we want a bond rating• Need to build Reserves• Independent Audits
• Implementation – Phased Approach?
13

Stormwater Management
Issues to be Address in an Implementation Assessment
14
1. Timing – can be implemented over time
2. Blended Funding Strategy – use both Tax District and Utility and transition over time.
3. Credit Program – Evaluate incentive and recommend strategy
4. Appeals – determine policy and process of file maintenance and process for review
5. Public Engagement and Input – engage stakeholders for input and review
6. Operational Plan – finalize optimal operations approach to managing utility

Additional Information
For additional information, please contact
www.fairfaxcounty.gov/dpwes
James Patteson
15
A Fairfax County, VA, publication
Department of Public Works and Environmental ServicesWorking for You!
Private Residential Stormwater Management Facilities
2/7/2017

Recommended Program Highlights
• Residential Ponds serving multiple properties– Currently 178 private residential ponds– County currently maintains 1,369 wet and dry public ponds
• Voluntary Program– Owners must provide easements– Owners must agree to fund initial improvements– Owners responsible for aesthetic maintenance
• Owner improves pond to “Functional” condition– County will contribute based on off site drainage area– County will establish special tax district to collect owners share
• County manages improvements – Can be a permanent dedication– Can be a one time permission
• County Benefits– Avoids enforcement actions– County can gain get TMDL credit for upgrades
2

Additional Information
For additional information, please contact
www.fairfaxcounty.gov/dpwes
3
Randy Bartlett
(703)324-5732

A Fairfax County, VA, publication
Department of Public Works and Environmental ServicesWorking for You!
2017 Forest Pest Management UpdateA Forest Health Approach
Environmental Committee Meeting
February 7, 2017

Urban Forest Management
Introduction
• The Forest Pest Program is required to obtain Board of Supervisors approval each year for its work plan.
• This year’s plan will be presented at the February 28th meeting.
• This presentation is intended to brief you on several aspects of our plan including an Urban Forest Health and Value Assessment.
2

Urban Forest Management
Annual Program Topics
• Gypsy Moth
• Fall Cankerworm
• Sudden Oak Death
• 1000 Cankers Disease
• Hemlock Woolly Adelgid
• Emerald Ash Borer
• Outreach
3
All insect populations, are cyclical in nature. Periods of high pest levels are followed by periods of low pest levels.

Urban Forest Management
New Initiative
• The Urban Forest Management Forest Pest Program is proposing a project that will expand our monitoring of the forest lands in Fairfax County.
• This project will allow for a better understanding of how our forest are changing over time and allows us to accomplish our mission.
• Other agencies such as the Park Authority and StormwaterPlanning will benefit from this project. Planning meetings between the three agencies show promise for this to be a valuable project.
• The one time cost of this project is $78,000.
4
Urban Forest Management
Method
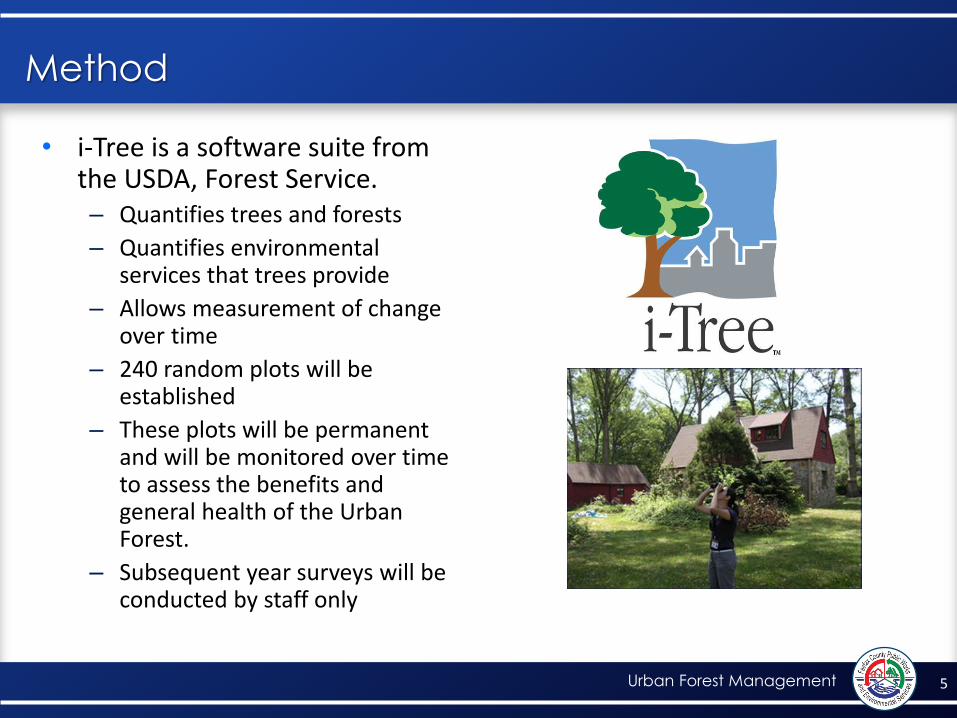
• i-Tree is a software suite from the USDA, Forest Service. – Quantifies trees and forests
– Quantifies environmental services that trees provide
– Allows measurement of change over time
– 240 random plots will be established
– These plots will be permanent and will be monitored over time to assess the benefits and general health of the Urban Forest.
– Subsequent year surveys will be conducted by staff only
5

Urban Forest Managment
Benefits Measured by i-Tree
Functional Analyses:
• Pollution removal and human health impacts
• Carbon sequestration and storage
• Avoided runoff
• Building energy effects
Structural and compositional analyses:
• Species condition and distribution
• Leaf area and biomass
• Species importance values
• Diversity indices and relative performance
6
Forecasting modeling options including:
• Tree planting potential
• Extreme event impacts for weather and pests
• Management scenarios
Management information including:
• Pest risk analysis
• Adaptable for County issues
• Cost benefit analysis

Urban Forest Managment
Additional Benefits
• Data can be used by other agencies– Park Authority can monitor effects of stressors such as deer browse or
human impacts
– Stormwater Planning can use this data to assist in stream restoration projects.
– Data can be used by civic groups such as HOA’s when making management decisions on private property
– Data will be used by the Urban Forestry Management Division in their strategic planning
• More information about i-Tree can be found at: http://www.itreetools.org/
7
Additional Information
For additional information, please contact
www.fairfaxcounty.gov/dpwes
Urban Forest Management 8
Troy Shaw
703-324-5304

A Fairfax County, VA, publication
Department of Public Works and Environmental ServicesWorking for You!
Biosolids Program & Energy Project
Status Report
February 7, 2017

The Biosolids Program Set of Projects
Biosolids Program Set of Projects
Rehabilitate the biosolids thickening, dewatering, and incineration operations in order to continue to reliably eliminate residuals from the wastewater treatment process in an environmentally compliant and sustainable manner
millions 2016 2017 2018 2019 2020 2021 2022 2023
Pre-Purchase New Scrubbers $1
Contractor Installation $3
Immediate work $2
Phase 2 $20
Phase 3 incl. energy recovery $90
Phase 4 $8
Noman Cole Plant met the new Clean Air Act Maximum Achievable Control Technology Standards in 2016

Status
3

Status
4

Energy Recovery Portion
5
~Heat Exchanger ORC Generator • 1 MW Renewable Energy
• 5,000 metric tons GHG
reduction
• Equivalent to 1,000 homes
Upcoming Public Notice Possibilities
• State DEQ –
• County Planning Commission and Site Permitting
6

Status
• Early projects nearly complete
• Clean Air Act MACT requirements met
• Major projects proceeding
• Energy recover portion in limbo– No DEQ response on new source trigger
– Therefore proceeding with whole project but holding energy recovery as an bid alternate
– If or when becomes viable, will review w/ BOS for endorsement before proceeding
• State & Local Public Notices Forthcoming
7

Additional Information
For additional information, please contact
www.fairfaxcounty.gov/dpwes
8
Sarah Motsch or Mike McGrath
(703) 550-9740