Embed Size (px)
Citation preview

Application of Soil and Water Assessment Tool for
Northeast Cape Fear River Watershed
Draft 2
Prepared by
Narayan B. Rajbhandari
N.C. Department of Environment and Natural Resources
Division of Water Quality
Planning Section
Modeling/TMDL Unit
February 2008

Northeast Cape Fear River Watershed Report - Draft
i
Table of Contents Table of Contents................................................................................................................. i
List of Figures ..................................................................................................................... ii
List of Tables ...................................................................................................................... ii
Executive Summary........................................................................................................... iii
INTRODUCTION .............................................................................................................. 1
WATERSHED DESCRIPTION......................................................................................... 3
Watershed Boundaries and Land Use ............................................................................. 3
Watershed Model Development ..................................................................................... 4
Watershed Model Selection ........................................................................................ 4
Model Description ...................................................................................................... 4
Model Setup ................................................................................................................ 5
Model Inputs ............................................................................................................... 6
MODEL CALIBRATION .................................................................................................. 9
Calibration Procedure ................................................................................................... 10
Site Selection for Flow Calibration........................................................................... 10
Site Selection for Nutrient Calibration ..................................................................... 10
Adjustment of Hydrologic Parameters...................................................................... 11
Adjustment of Chemical Parameters ........................................................................ 11
Adjustment of Physical Parameters .......................................................................... 12
Initial condition......................................................................................................... 12
Evaluation of Model Prediction ................................................................................ 13
Calibration error........................................................................................................ 14
MODEL VALIDATION .................................................................................................. 14
RESULTS AND DISCUSSIONS..................................................................................... 15
Calibration..................................................................................................................... 15
Flow .......................................................................................................................... 15
Nutrient Concentration.............................................................................................. 16
Model Validation .......................................................................................................... 18
Comparison of SWAT and FLUX models, 1999 through 2005: .............................. 18
WATERSHED MODEL RESULTS ................................................................................ 20
Contribution from Conventional Point Sources............................................................ 20
Contribution from Non-point Sources .......................................................................... 22
Critical Period ............................................................................................................... 28
CONCLUSION................................................................................................................. 30
REFERENCES ................................................................................................................. 31
Appendix 1. Annual average load from NPDES program............................................... 33
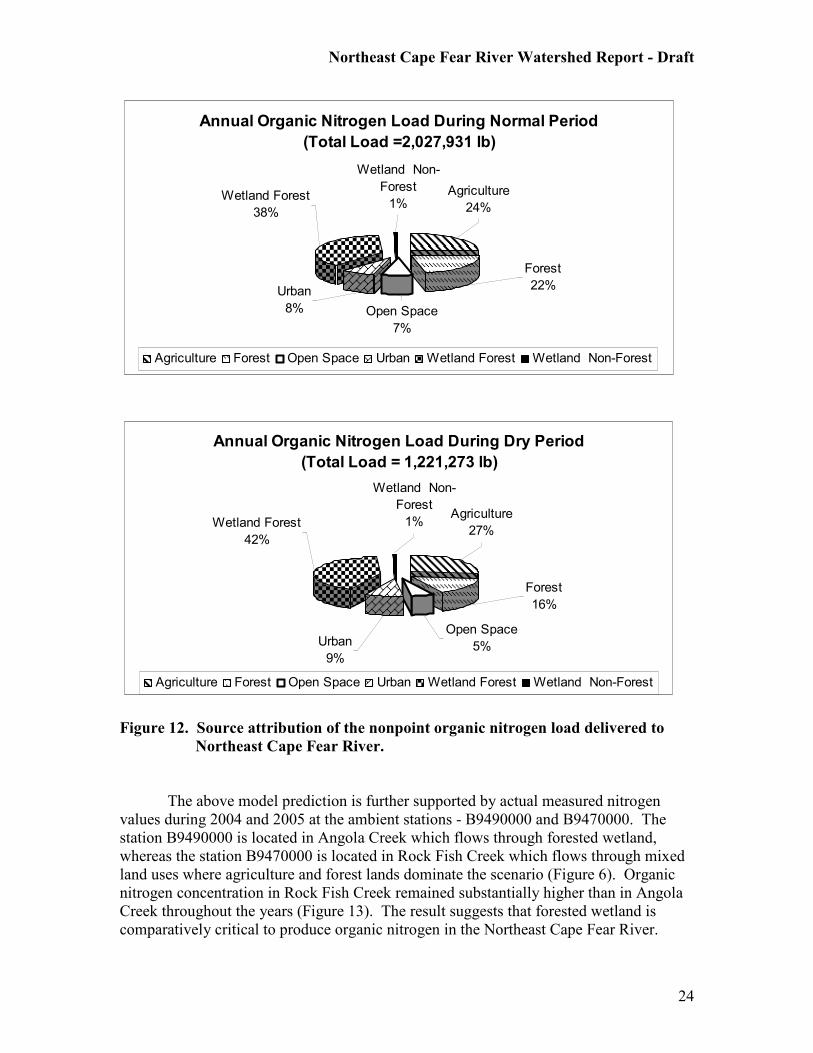
Appendix 2. Observed vs estimated monthly total flow.................................................. 38
Appendix 3. Observed vs estimated nutrient concentration at B9480000....................... 39
Appendix 4. Monthly average nutrient loads from different land types.......................... 41

Northeast Cape Fear River Watershed Report - Draft
ii
List of Figures Figure 1. Low Do violation section in Lower Cape Fear River......................................... 1
Figure 2. Location of major rivers feeding Lower Cape Fear River. ................................ 2
Figure 3. Land cover distribution in Northeast Cape Fear River Basin based on 2000 .... 3
Figure 4. Total annual rainfall from 1999 through 2005 as compared to the average....... 7
Figure 5. Distribution of hog farms in Northeast Cape Fear River Basin. ........................ 8
Figure 6. Model calibration location in the Northeast Cape Fear River Watershed........ 10
Figure 7. Observed and Simulated Monthly Total Flow at USGS 210800000. .............. 15
Figure 8. Observed and simulated monthly averaged concentration of (A) total............ 17
Figure 9. SWAT model comparison to FLUX estimated loads of (A) total nitrogen, .... 19
Figure 10. Relative discharge of conventional point and nonpoint source loads to ........ 21
Figure 11. Source attribution of the nonpoint total nitrogen load delivered to................ 22
Figure 12. Source attribution of the nonpoint organic nitrogen load delivered to........... 24
Figure 13. Source attribution of the nonpoint total phosphorus load delivered to .......... 27
Figure 14. Source attribution of the nonpoint organic phosphorus load delivered to
............................................................................................Error! Bookmark not defined. Figure 15. Monthly distribution of delivered total nitrogen load to Northeast Cape ...... 28
Figure 16. Monthly distribution of delivered total phosphorus load to Northeast........... 29
List of Tables Table 1. Surface physical characteristics of soil types in Northeast Cape Fear River....... 6
Table 2. List of NPDES Point Sources in Northeast Cape Fear River Basin. ................... 9
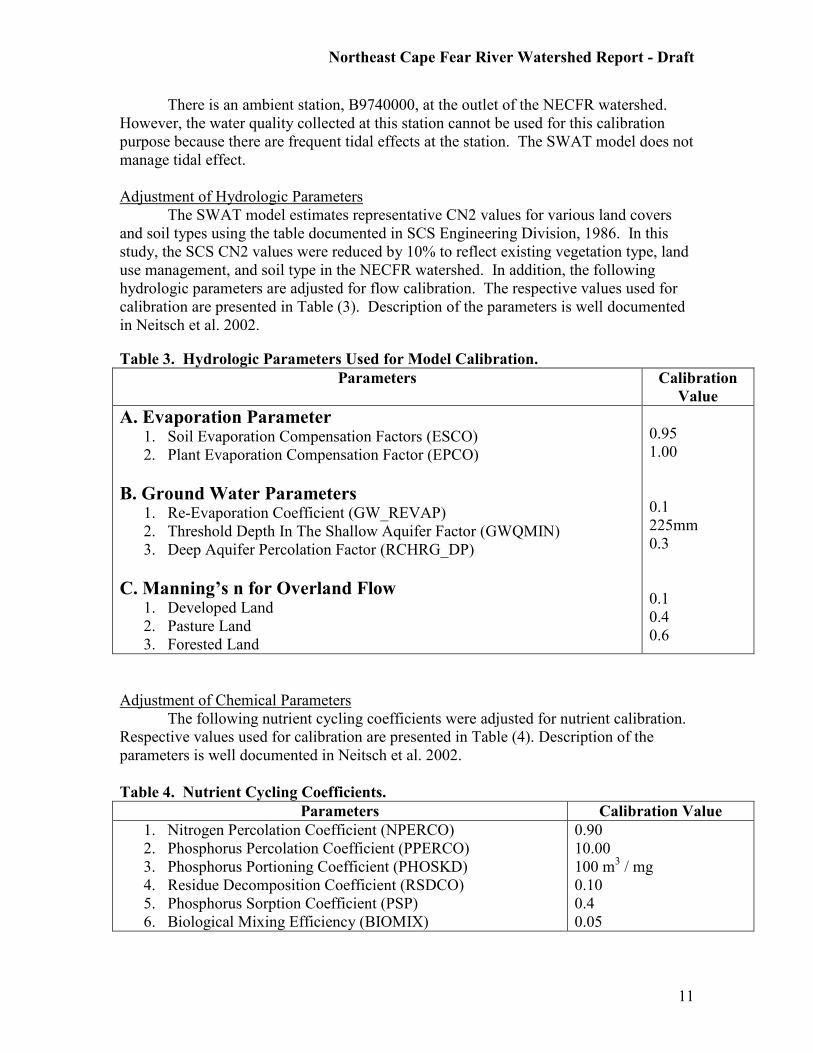
Table 3. Hydrologic Parameters Used for Model Calibration. ........................................ 11
Table 4. Nutrient Cycling Coefficients. ........................................................................... 11
Table 5. Stream Water Quality Coefficients.................................................................... 12
Table 6. Initial Nutrient Concentration in NECFR watershed......................................... 13
Table 7. Statistical measures to compare model simulation and observed flow and....... 16
Table 8. Coefficient of variations as estimated by FLUX model. ................................... 18
Table 9. Related hydrologic and nutrient process under different land use conditions... 23

Northeast Cape Fear River Watershed Report - Draft
iii
Application of Soil and Water Assessment Tool for
Northeast Cape Fear River Watershed
N.C. Division of Water Quality
Planning Section
Modeling/TMDL Unit
Executive Summary The State of North Carolina has initiated development of a Total Maximum Daily
Load in the Lower Cape Fear River (LCFR) where low dissolved oxygen is a prime
concern. Studies have shown that the presence of hog farms and wetland together with
industrial and municipal point source discharges in the watersheds could add significant
amount of nitrogen and phosphorus to the LCFR. In order to quantify the amount of
nitrogen and phosphorus discharged to the LCFR, the Division of Water Quality and
Lower Cape Fear River Basin Advisory Group jointly selected Northeast Cape Fear River
(NECFR) watershed for a study on May 5, 2005. The main objectives of the study are:
• To estimate Total Nitrogen (TN) and Total Phosphorus (TP) loads discharged from
NECFR to LCFR under varying land use and management conditions.
• To support the hydrodynamic and nutrient response model which will be used as a
tool to develop a DO Total Maximum Daily Load (TMDL) for LCF estuary.
The NECF watershed occupies approximately 1693 square miles (438,523 ha).
The watershed covers 33% of agricultural land, 31 % of forest land, 30% of Forested
Wetland, 1% of Non-forest Wetland, 1.6% of Developed Land, 3% of Open Space, and
0.4% of Water Body.
The watershed represents blackwater systems in the North Carolina Coastal Plain.
The majority of the watershed falls within the two coastal plain counties of Duplin at the
northern part and Pender at the southern part of the watershed. According to the 1998
estimates, Duplin County has large number of swine operations in the watershed. Most
of the agricultural lands in the watershed are spread with hog waste, which contains large
quantities of both organic and inorganic nitrogen and phosphorus.
The ArcView Interfaced Soil and Water Assessment Tool (AVSWAT) model is
used to estimate TN, TP, and DO loads discharged from different point and nonpoint
sources in the NECFR watershed. It is a continuous model and enables the user to
simulate runoff and pollutant transport processes up to 100 years. Large watersheds up to
two thousand square miles can be studied, and selected heterogeneous watersheds can be
divided into hundreds of sub-basins. Each sub-basin can be characterized under eight
major components; hydrology, weather, erosion/sedimentation, soil temperature, plant
growth, nutrients, pesticides, and land management.

Northeast Cape Fear River Watershed Report - Draft
iv
The model is calibrated for flow, TN, TP, and DO for the period from 1999
through 2005. The USGS Station near Chinquapin (USGS 02108000) was selected for
flow calibration and the ambient station near Burgaw (B9480000) was selected for
nutrient calibration. Overall, the difference between simulated and observed flow
volume and nutrient concentrations are not significant at 95% confidence level. The
relative error associated with model prediction is well below the US EPA guidance value
of 45% for TN and TP. The error value for DO is slightly above the guidance value of
15%. However, the model prediction of DO seems to be satisfactory, because the R-
Square value is moderately high.
Comparing its results with FLUX estimation of daily nutrient loads validates the
model. A reasonable agreement between the two models is observed.
The model results suggested that nonpoint sources contributed more than 90% of
the nutrient loads to the Lower Cape Fear River. Among the nonpoint sources,
agricultural land and forested wetland contributed a major portion of the load (Table A).
They respectively contributed approximately 30% and 40% of the total nitrogen load and
60% and 20% of the total phosphorus load during normal and dry years. It is observed
that the nutrient load was high during March for dry period and during September for
normal period.
Table A: Annual average total nitrogen and total phosphorus loads under different land
use conditions.
Constituents/ Land Uses Period
Total Nitrogen (lb) Normal Dry
Agriculture 2,367,953 1,448,846
Forest 1,857,372 878,482
Open Space 409,451 215,278
Urban 384,702 252,908
Wetland Forest 3,310,620 1,997,946
Wetland Non-Forest 64,825 37,194
TOTAL 8,330,098 4,793,460
Total Phosphorus (lb)
Agriculture 434,553 270,391
Forest 62,415 22,702
Open Space 29,259 13,309
Urban 25,886 16,918
Wetland Forest 148,055 90,067
Wetland Non Forest 4,026 2,159
TOTAL 700,168 413,387
The model results conclude that the forested wetlands in the NECRF watershed
were not designed to trap nutrient loading coming from adjoining lands. The wetlands
functioned as a passive source by transporting nutrients into streams in the natural
environment. Several streams/creeks drain nutrients from wetlands as well as from
adjoining lands. In agricultural land, a significant portion of the phosphorus load was due

Northeast Cape Fear River Watershed Report - Draft
v
to erosion. It accounts for 70% of the total load. Adoption of proper BMPs in the
watershed would reduce the heavy nutrient loads.

Northeast Cape Fear River Watershed Report - Draft
1
INTRODUCTION A portion of Lower Cape Fear River (LCFR), from Toomers Creek to Snows Cut
(5,616.7 Acres), is currently on North Carolina’s 303(d) list of impaired waters for low
dissolved oxygen (DO) violations (Figure 1). This portion of the river has been
considered impaired since the 1996 Cape Fear River Basinwide Water Quality Plan.
Sources of low DO level include many discharges of oxygen consuming waste into this
segment and to the tributary streams. There is a considerable volume of blackwater that
may also contribute natural sources of oxygen consuming materials. In addition, the river
is influenced by tides and high flows from the entire basin. Therefore, the river goes
through many extreme changes in water column chemistry over the course of a year.
Figure 1. Low Do violation section in Lower Cape Fear River.
Impaired Water Body

Northeast Cape Fear River Watershed Report - Draft
2
Figure 2. Location of major rivers feeding Lower Cape Fear River.
Three major tributaries, South River, Black River, and Northeast Cape Fear River,
feed major portion of the LCFR (Figure 2). Streams within the watersheds of these
tributaries drain predominantly agricultural land, forested land, and wetland.
On May 5, 2005, the Division of Water Quality and Lower Cape Fear River Basin
Advisory Group jointly selected Northeast Cape Fear River (NECFR) watershed for a
study to estimate total nitrogen (TN) and total phosphorus (TP) that are transported to
LCFR from the watershed under different land use and management conditions. The
watershed occupies approximately 1693 square miles (438,523 ha) across Samson,
Wayne, Duplin, Onslow, Pender, and Hanover counties. The majority of the watershed
falls within the two coastal plain counties of Duplin at the northern part and Pender at the
southern part of the watershed. According to the 1998 estimates, Duplin County carries a
greater part of swine operation in the Cape Fear River Basin. Most of the agricultural
lands in the watershed are spread with hog waste, which contains large quantities of both
organic and inorganic nitrogen and phosphorus (Mallin et al. 1997). In addition, heavy
deposits of organic nutrients and low DO levels characterize wetlands in the watershed.
Considering these complex characteristics, this watershed was selected for a study to
determine sources of nutrient loads to LCFR.
Lower Cape Fear River
South River
Black River
Northeast Cape Fear River
Major Rivers in Lower Cape Fear River
Basin

Northeast Cape Fear River Watershed Report - Draft
3
This study addresses Total Nitrogen (TN), Total Phosphorus (TP), and Dissolved
Oxygen (DO) discharged from NECFR to LCFR under varying land use and management
conditions. Results from this study will be used to support the hydrodynamic and
nutrient response model which will be used as a tool to develop a DO Total Maximum
Daily Load (TMDL) for LCF estuary.
WATERSHED DESCRIPTION
Watershed Boundaries and Land Use
The NECFR flows 113 miles south from its origins (south of the Town of Mount
Olive to the estuary in Wilmington). The drainage area of the river is 1693 square miles
(438,523 ha). The majority of the study area lies within Duplin County at the northern
part and Pender County at the southern part of the watershed (Figure 2). The remaining
area along the periphery is distributed in Samson, Wayne, Onslow, and Hanover County.
Land cover is estimated from 2000 satellite data. Based on the data, the watershed is
comprised of agricultural land (33%), forest land (31%), forested wetland (30%), non-
forest wetland (1%), developed land (1.6%), open space (3%), and water body (0.4%)
(Figure 3). Developed land includes residential, road, and parking lands. Residential
development is mostly concentrated at the lower most part of the watershed. Open space
mostly consists of vegetation in the form of lawn grasses. It also includes some mixture
of construction materials.
Figure 3. Land cover distribution in Northeast Cape Fear River Basin based on 2000
satellite data.
The NECFR represents blackwater system in the North Carolina Coastal Plain.
The system is characterized by low topography, sandy sediments, extensive floodplains,
and high concentration of dissolved organic matter (Meyer 1990, Smock and Gilinsky
Wetland Forest
30.11%Agriculture
32.74%
Forest
31.41%
Open Space
3.04%
Urban
1.63%
Water
0.41%
Wetland
NonForest
0.67%

Northeast Cape Fear River Watershed Report - Draft
4
1992, Philips et al. 2000. As cited by Mallin et al. 2001). Some water quality studies
have indicated that both organic and inorganic N and P loading were high in the river.
Sources include municipal and private point-source discharges and non-point source
inputs from concentrated animal feeding operations and traditional agriculture (Mallin et
al. July 1998 Report No. 315 & August 2002 Report No. 341).
Annual average flow of the NECFR near Chinquapin (Ambient Station
B2920000, USGS Station 210800000) is 719 cubic feet per second (cfs), with a 7Q10 of
12.1 cfs. However, the low-flow characteristics decrease in the downstream because of
poorly drained soil (Weaver and Benjamin, 2001).
Watershed Model Development
Watershed Model Selection
There are several watershed models that range from simple to complex nutrient
loading models. For this study, Soil and Water Assessment Tool (SWAT), physically-
based watershed model, was selected because of its capability to assess the impact of
point and non-point sources on TN, TP, and DO in a large watershed with varying land
use and management conditions. The USDA Agriculture Research Service first
developed the model in the early 90s. Recently, the model has been interfaced with
ArcView GIS in a software package known as AVSWAT (Luzio, et al. 2002). It is a
continuous model that enables the user to simulate runoff and pollutant transport
processes up to 100 years. Large watersheds up to two thousand square miles can be
studied, and selected heterogeneous watersheds can be divided into hundreds of sub-
basins. Each sub-basin can be characterized under eight major components; hydrology,
weather, erosion/sedimentation, soil temperature, plant growth, nutrients, pesticides, and
land management.
Model Description
Hydrology:
The watershed model computes surface runoff volume using a modification of the
SCS curve number method and peak runoff rate predictions using a modification of the
rational method. The model routes flow through the channel using a variable storage
coefficient method or Muskingum routing method. For this study, the Muskingum
method was used due to its ability to route flow in wide applications.
Water Quality:
The watershed model monitors five different pools of nitrogen in the soil. Two
pools are inorganic forms of nitrogen, while the other three pools are organic forms of
nitrogen. Fresh organic nitrogen is associated with crop residue and microbial biomass,
while the active and stable organic N pools are associated with the soil humus. The
organic nitrogen associated with humus is partitioned into two pools to account for the
variation in availability of humic substances to mineralization. TN is the sum of organic
and inorganic nitrogen.

Northeast Cape Fear River Watershed Report - Draft
5
The model considers six different pools of P in soils. Three pools are inorganic
forms of P while the other three pools are organic forms of P. Fresh organic P is
associated with crop residue and microbial biomass while the active and stable organic P
pools are associated with soil humus. Soil inorganic P is divided into solution, active,
and stable pools. TP is the sum of organic and inorganic P.
The model allows nutrient levels to be input as concentrations. However, it
performs all calculations on a mass basis. To convert a concentration to a mass, the
concentration is multiplied by a bulk density and depth of layer, and is then divided by
100.
Nutrient transformations in the stream are controlled by in-stream water quality
component of the model. The in-stream kinetics used in the model for nutrient routing is
adapted from the QUAL2E model (Brown and Barnwell, 1987). The model tracks
nutrients dissolved in the stream and nutrients adsorbed to the sediment. Dissolved
nutrients are transported with water, while the absorbed nutrients are deposited with the
sediments on to the channel bed.
The watershed model computes the amount of DO entering the main channel with
surface runoff using the QUAL2E model (Brown and Barnwell, 1987). Rainfall is
assumed to be saturated with oxygen. To determine the dissolved oxygen concentration
of surface runoff, the oxygen uptake by the oxygen demanding substance in runoff is
subtracted from the saturation oxygen concentration. Details of the in-stream process of
DO is given in Neitsch et al. 2002.
Model Setup
The NECFR watershed is delineated into sub-basins using the stream coverage
Reach File and Digital Elevation Model (DEM) maps. The Reach File is initially
digitized from the USGS 1:24000 topographic maps in ARC/INFO format. The DEMs in
GRID format for the watershed are obtained from USGS. Resolution of the DEMs used
for this study is 30 X 30 meters and is patched together in ARC/INFO for the NECFR
watershed area. The patched DEMs are then exported into the AVSWAT model to
delineate the watershed using automatic delineation tools. A total of 23 sub-watersheds
are delineated to estimate watershed parameters such as stream length, stream slope,
stream dimensions, overland slope, slope length, Manning’s n, soil erodibity factor K,
practice factor P, and crop factor C. The AVSWAT model uses project mask to estimate
watershed parameters and is subsequently checked and changed as needed.
The delineated sub-basin map is then overlaid with land use and soils. The land
use/land cover data that is developed from 2000 LANDSAT satellite imagery is utilized
to characterize the watershed land use distribution (Figure 3). The data is obtained from
the United State Geological Survey database (USGS, April 2005). Soil parameters
including bulk density, soil layer, available water, hydraulic conductivity, and texture
type are acquired from the U.S. General Soil Map database (USGS, July 2007). There
are fourteen types of soils in the watershed (Table 1).

Northeast Cape Fear River Watershed Report - Draft
6
The model assigns a hydrologic unit code to each land use and soil types in each
sub-watershed to estimate hydrologic responses and nutrient pools. The estimated
hydrologic responses and nutrients pools are then routed towards watershed outlets.
Table 1. Surface physical characteristics of soil types in Northeast Cape Fear River.
AREA Bulk Density
Avialable Water
Hyd. Cond Clay Silt Sand STMUID
Name (%) (lb/cft) (in/in) (in/hr) (%SoilWt) (%SoilWt) (%SoilWt)
NC001
NC003
NC011
NC019
NC024
NC028
NC030
NC033
NC034
NC035
NC038
NC039
NC040
NC044
Johnston
Tarboro
Alpin
Baymeade
Croatan
Leaf
Woodington
Croatan
Rains
Norfolk
Autryville
Leon
Kureb
Woodington
6.85
0.11
0.39
9.81
1.13
0.90
0.58
23.92
7.53
23.35
16.50
7.17
0.59
1.17
89.46
105.21
91.35
105.21
18.90
88.20
97.65
18.90
91.35
102.69
103.95
86.94
107.10
97.65
0.18
0.09
0.07
0.05
0.35
0.16
0.15
0.35
0.14
0.12
0.06
0.08
0.05
0.15
1.91
5.98
14.95
20.55
9.34
0.93
3.62
9.34
4.11
16.82
11.21
39.24
28.03
3.62
11.50
7.50
6.50
4.00
10.00
16.00
11.50
10.00
12.50
5.00
6.00
3.00
1.50
11.50
43.23
9.02
1.25
0.61
45.00
40.19
26.01
45.00
19.65
15.77
1.88
1.51
1.53
26.01
45.27
83.48
92.25
95.39
45.00
43.81
62.49
45.00
67.85
79.23
92.11
95.49
96.97
62.49
Model Inputs
The SWAT model is set up with the following major input parameters: weather,
agriculture management, air deposition, and point source discharge.
Weather:
Air temperature and precipitation data during the study periods (1999-2005) are
acquired through the State Climate Office of North Carolina for the nearby weather
stations of Warsaw, Wallace, Willard, and Wilmington. The amount of rainfall during
2001 and 2002 was less than the long-term mean annual rainfall of 54 inches (Figure 4).
Therefore, these years were considered dry years. Wind speed and solar radiation are
simulated for the weather stations using the weather generator in SWAT. Evapo-
transpiration is calculated within the model using the Hargreaves methods.
Agriculture Management:
In the NECFR watershed, most of the farmers practice hog farming and hay
cultivation. A few farmers plant corn, soybean and wheat but most of the cropping lands
had been converted to Bermuda grass lands for hog farming. There are approximately
571 hog farms in the watershed and most of which are located in Duplin County (Figure
5). Large quantity of hog waste is often sprayed on the Bermuda grass land. In general,

Northeast Cape Fear River Watershed Report - Draft
7
the hog waste is sprayed on Bermuda grassland from March through September and
small grain field from September through March. The DWQ permitted amount of swine
waste application rate varies with crop type, soil type, land slope, and county (NCSU,
1999). On an average, hog waste is applied at the rate of 135lb of nitrogen per acre in the
watershed during a six month application period.
Figure 4. Total annual rainfall from 1999 through 2005 as compared to the average
normal rainfall events from 1961 through 1990 in Northeast Cape Fear
River.
(Source: http://www.met.utah.edu/jhorel/html/wx/climate/normrain.html.)
0
10
20
30
40
50
60
70
80
1999 2000 2001 2002 2003 2004 2005
Year
Total Rainfall (In)
Total Rainfall (In) Normal Rainfall (in)

Northeast Cape Fear River Watershed Report - Draft
8
Figure 5. Distribution of hog farms in Northeast Cape Fear River Basin.
Air Deposition:
The North Carolina Department of Environment and Natural Resources
(NCDENR) estimates that the swine population contributes approximately 46% of the
NH3-N emission in North Carolina (NCDENR 1999). Based on the National Air
Deposition Program (UIUC, 2007), precipitation carries approximately 1.3 mg/L of
nitrogen (0.43 mg/L of NH4 and 0.83 mg/L of NO3) in the watershed.
Conventional Point Sources:
Conventional point sources are typically those that are regulated under National
Pollutant Discharge Elimination System (NPDES) programs in the NECFR watershed.
These facilities measure nutrient levels in their effluent at a frequency based on facility
class and waste type. Currently there are thirty-one different conventional point sources
that discharge wastewater to the NECFR (Table 2). Their annual reports of nutrient loads
are presented in Appendix 1. The majority of these sources are distributed across the
eastern portion of the watershed.

Northeast Cape Fear River Watershed Report - Draft
9
Table 2. List of NPDES Point Sources in Northeast Cape Fear River Basin.
Permit No. Facility No of
outfalls NC0003794 Wilmington Plant 2
NC0000817 Smith Creek WWTP 1
NC0023477 Southern States Chemical Inc 2
NC0058971 Wastec site 2
NC0039527 Walnut Hills WWTP 1
NC0049743 Landfill WWTP 1
NC0051969 Hermitage House Rest Home 1
NC0042251 Pender High School WWTP 1
NC0021113 Burgaw WWTP 1
NC0085481 Penderlea Elementary School 1
NC0056863 Rose Hill WWTP 1
NC0066320 Rose Hill Plant 1
NC0026018 Beulaville WWTP 1
NC0036668 Kenansville WWTP 1
NC0002763 Warsaw Mill 2
NC0058271 Kenansville Cogen plant 3
NC0063711 Albertson W&S District WTP 1
NC0001970 Dean Pickle & Specialty Prod 1
NC0002933 Calypso WTP 1
NC0003051 Mount Olive WTP #3 1
NC0086941 Southeastern Wayne S D WTP 1
NC0001112 Arteva Wilmington 2
NC0001228 Global Nuclear Fuel-Americas 2
NC0003875 Elementis Chromium LP 3
NC0020702 Wallace WWTP 1
NC0003450 Wallace WWTP #2 2
NC0003344 Wallace Processing Plant 1
NC0002305 Gulford East Mill WWTP 1
NC0020575 Mount Olive WWTP 1
NC0001074 Mount Olive Pickle Company 2
NC0086801 Golden Street Olive 1
NC0065307 Dixie Boy NO. 6 1
NC0002879 City of Wilmington 1
Total Number of Inputs 45
MODEL CALIBRATION
Calibration is the procedure of adjustment of parameter values of a model to
reproduce the response of reality within the range of accuracy consistent with the
intended application of the model (Refsgaard and Henriksen, 2003). The SWAT model is
calibrated for flow, TN, TP, and DO from 1999 to 2005 in order to verify that the
adjustment of parameters in the model possesses a satisfactory range of accuracy.

Northeast Cape Fear River Watershed Report - Draft
10
Calibration Procedure
Site Selection for Flow Calibration
There are three USGS gauge stations on the main stream of NECFR (Figure 2).
The stations are located in the NECFR near Seven Springs, Chinquapin, and Burgaw.
The first station (USGS 210760000) and the third station (USGS 02108566) do not have
long term flow data. The only station that has long term flow data is USGS 02108000. It
has flow data from 1940 to date (USGS, October 2007). Therefore, the USGS Station
02108000 was selected for flow calibration. This station drains approximately 35% of
the NECFR watershed. The observed flow data are tabulated in Appendix 2.
Site Selection for Nutrient Calibration
Water quality data collected by the NC DWQ at the station B9480000 during
1999 through 2005 are used to calibrate the SWAT model for the Northeast Cape Fear
watershed (Figure 6). At the station, the DWQ also collected additional water quality
data under a special study program to gain more information about water quality during a
six weeks period from July 7 to August 11, 2004. The data used for nutrient calibration
are tabulated in Appendix 3.
Figure 6. Model calibration location in the Northeast Cape Fear River Watershed.
Flow Calibration Site
(USGS 0210800000)
Nutrient Calibration
Site (B9480000)
USGS 0210760000
USGS 02108566
B9740000
B9490000
02108566
B9470000
02108566
Northeast Cape Fear River Watershed Report - Draft
11
There is an ambient station, B9740000, at the outlet of the NECFR watershed.
However, the water quality collected at this station cannot be used for this calibration
purpose because there are frequent tidal effects at the station. The SWAT model does not
manage tidal effect.
Adjustment of Hydrologic Parameters
The SWAT model estimates representative CN2 values for various land covers
and soil types using the table documented in SCS Engineering Division, 1986. In this
study, the SCS CN2 values were reduced by 10% to reflect existing vegetation type, land
use management, and soil type in the NECFR watershed. In addition, the following
hydrologic parameters are adjusted for flow calibration. The respective values used for
calibration are presented in Table (3). Description of the parameters is well documented
in Neitsch et al. 2002.
Table 3. Hydrologic Parameters Used for Model Calibration.
Parameters Calibration
Value
A. Evaporation Parameter 1. Soil Evaporation Compensation Factors (ESCO)
2. Plant Evaporation Compensation Factor (EPCO)
B. Ground Water Parameters 1. Re-Evaporation Coefficient (GW_REVAP)
2. Threshold Depth In The Shallow Aquifer Factor (GWQMIN)
3. Deep Aquifer Percolation Factor (RCHRG_DP)
C. Manning’s n for Overland Flow 1. Developed Land
2. Pasture Land
3. Forested Land
0.95
1.00
0.1
225mm
0.3
0.1
0.4
0.6
Adjustment of Chemical Parameters
The following nutrient cycling coefficients were adjusted for nutrient calibration.
Respective values used for calibration are presented in Table (4). Description of the
parameters is well documented in Neitsch et al. 2002.
Table 4. Nutrient Cycling Coefficients.
Parameters Calibration Value
1. Nitrogen Percolation Coefficient (NPERCO)
2. Phosphorus Percolation Coefficient (PPERCO)
3. Phosphorus Portioning Coefficient (PHOSKD)
4. Residue Decomposition Coefficient (RSDCO)
5. Phosphorus Sorption Coefficient (PSP)
6. Biological Mixing Efficiency (BIOMIX)
0.90
10.00
100 m3 / mg
0.10
0.4
0.05

Northeast Cape Fear River Watershed Report - Draft
12
Adjustment of Physical Parameters
The following stream water quality coefficients were adjusted for DO calibration.
Respective values used for calibration are presented in Table 5.
Table 5. Stream Water Quality Coefficients.
Parameters Calibration Value at 200C
1. CBOD Deoxygenation Rate (RK1)
2. Oxygen Reaeration Rate (RK2)
3. CBOD Loss Rate Due To Settling (RK3)
4. Benthic Oxygen Demand Rate (RK4)
5. Fraction Of Algal Biomass That Is Nitrogen (AI1)
6. Fraction Of Algal Biomass That Is Phosphorus (AI2)
3.40 per day
0.60 per day
0.36 per day
246 mg/m2 day
0.090 mg N/ mg alg
0.020 mg N/ mg alg
Description of the parameters stated in Table 5 is well documented in Neitsch et
al. 2002. However, for this study, Oxygen reaeration rate and sediment oxygen demand
are estimated using following procedures.
Oxygen reaeration rate (RK2): DO is gained in a stream through reaeration. The
reaeration rate is measured using the following formula recommended by O’Conner-
Dobbins (Chapra and Pelletier, 2003):
RK2 = 3.93 * [U0.5
/ H1.85
] ------------------------- (3)
U = velocity (m/s) and H = depth (m). The average RK2 value was estimated to be 0.60.
CBOD loss rate due to settling (RK3): Its value ranges between –0.36 and 0.36 in the
stream at 200 C (Day
-1). For this study, the maximum value was selected.
Sediment oxygen demand (SOD) rate (RK4): The flux of oxygen from water
required for oxidation is the sediment oxygen demand. The SOD rate was measured on
November 20, 2003 in the NECFR upstream from Wilmington near the outlet of the
NECR watershed for this study. The SOD test involves placing aluminum SOD chambers
on the bottom sediment, securing them to prevent water infiltration, and monitoring
oxygen change within each chamber. A dissolved oxygen sensor inside the chamber
measures the rate of decrease in oxygen that is used by organic materials in the bottom
sediments over a given period of time. The averaged measured SOD rate at that site is
0.2460 mg/m2/day. The value is corrected to 20
0 C. For this study, the measured value is
assumed to be uniform along the river.
Initial condition
The initial nutrient concentrations are presented in Table 6. For nutrient
calibration, SWAT requires initial concentration of Nitrate (NO3), organic N2, soluble P,
and organic P in soils and ground water. The initial values for soils were acquired from
Department of Biological and Agricultural Engineering, North Carolina State University.
(Source: personal contact with Dr. Sanjaya Shah.) The initial concentrations for soils
were formerly measured for the Orangeburge Loamy Sand Soil in Duplin County. It was,

Northeast Cape Fear River Watershed Report - Draft
13
however, assumed that the values were applicable to all soil types in the watershed for
this study.
Table 6. Initial Nutrient Concentration in NECFR watershed.
Parameters Average Value
A. Upper Soil Layer 1. Nitrate
2. Organic Nitrogen
3. Soluble Phosphorus
4. Organic Phosphorus
B. Ground Water 4. Nitrate
5. Soluble Phosphorus
5 mg/kg
1474 mg/kg
4 mg/kg
313 mg/kg
8.65 mg/L
0.20 mg/L
The initial value for ground water is acquired from Ground Water Unit, Planning
Section, NCDWQ. (Source: Personal contact with Mr. Ray Milosh.) The value was
estimated based on quarterly measurement from March 1998 through November 1999 at
the Abertson site in Duplin County. The site is a swine operation located in an upland
setting in the lower coastal plain. This site is selected because ground water and surface
water from this site discharge into Cape Fear River (Dahlen and Milosh, 2002).
Evaluation of Model Prediction
Paired-Different t-test was performed to evaluate the SWAT model performance.
This statistical procedure tests whether the average difference between observed and
model prediction is significantly different from zero. If the difference is not significantly
different from zero, then the model prediction is considered to be acceptable. The model
prediction is tested at 95% significance level in this study.
Additionally, other procedures such as Coefficient of Determination (R-Square),
Model Efficiency or Nash-Suttcliffe simulation efficiency (ME) (Nash and Suttcliffe,
1970), Root Mean Square Error (RMSE), and Relative Error (RE) were also used to
evaluate model prediction. The R-Square value is an indicator of strength of relationship
between observed and predicted values. Nash-Suttcliffe simulation efficiency implies
how well the plot of observed versus predicted value fits the 1:1 line. The error
measurements indicate the difference between observed and simulated values relative to
the observed data.
If the R-Square and ME values are close to one, then the model prediction is
considered acceptable. If the RMSE and RE values are close to zero, then the model
prediction is considered appropriate. There is no specific value that distinguishes
between the acceptable and unacceptable values for a watershed modeling purposes.
However, the US EPA’s Technical Guidance Manual for performing Estuary Waste Load
Allocations (USEPA 1990) purposes acceptable relative error statistic criteria of 15%
percent for DO and 40% for nutrient parameters.

Northeast Cape Fear River Watershed Report - Draft
14
Calibration error
The inability to accurately predict specific observation within SWAT can be
attributed to model error, lack of sufficient information in source assessment, gaps in our
scientific knowledge, natural variability in nutrient concentrations, field and laboratory
measurement error, and lack of current site specific model input parameters. There are
numerous potential errors that can occur in the measured input data and data used for
calibration. For example, spatial variability error in rainfall, soils, and land use; errors in
measuring flow; and errors caused by sampling strategies (Santhi et al., 2001). Robertson
and Roerish (1999) found median absolute error in annual phosphorus loads up to 30
percent depending on sampling strategies. Because of the lack of certain site specific
information, professional judgment and literature values were used to calibrate the model.
The calibration should be interpreted in light of the model limitations and prediction
uncertainty.
MODEL VALIDATION
Validation is the procedure to evaluate that a model within its domain of
applicability possesses a satisfactory range of accuracy consistent with the intended
application of the model. The USEPA (2002) indicates that a model can be evaluated by
comparing model predictions of current conditions with laboratory tests, field data,
analytical solutions, or synthetic test data sets not used in the model calibration process,
or with comparable predictions from other well-accepted models or by other methods
(e.g., sensitivity and uncertainty analysis). For this study, the SWAT model is validated
by comparing its estimation of TN, TP, and DO loads with a statistical model called
FLUX (Walker 1999).
The FLUX model has been approved by the USEPA and is widely used for
estimating loadings of nutrients and other water quality components from actual
monitoring data. Since nutrient measurement at the ambient station B9480000 was not
continuous and the measurement was taken only once a month, the FLUX model is,
therefore, selected to estimate nutrient loads for the intervening days. The FLUX
estimation of daily loads is then compared with the SWAT estimation. The relationship
between the two estimations is evaluated by calculating R-Square value. If the R-Square
value is close to one, then the model validation is considered acceptable.

Northeast Cape Fear River Watershed Report - Draft
15
RESULTS AND DISCUSSIONS
Calibration
Flow
The SWAT model is calibrated at the USGS gauge station 02108000 near
Chinguapin for flow (Figure 2). The model is run for the period from 1999 through 2005
and its simulated flow is compared with observed flow at the station. The simulated and
observed total monthly flow volumes are significantly close during the simulation periods
(Figure 7). Means and standard deviations of the observed and simulated flows are not
significantly different since the p-value is greater than 0.05 (Table 7). Further agreement
between observed and simulated flows is shown by high R-Square value of 0.89 and ME
value of 0.90. Additionally, the low error values associated with the model prediction
(RMSE =0.40 and RE = 0.27) further verify the agreement.
Figure 7. Observed and Simulated Monthly Total Flow at USGS 210800000.
0.00
0.20
0.40
0.60
0.80
1.00
1.20
1999
2000
2001
2002
2003
2004
2005
Time
Flow Volume (Ft)
Simulated Observed

Northeast Cape Fear River Watershed Report - Draft
16
Table 7. Statistical measures to compare model simulation and observed flow and
nutrient concentration, 1999-2005. Mean Standard Deviation Variables
(units) Simulated Observed Simulated Observed
ME R2 RMSE
(%)
RE p
Monthly
Total Flow
Volume (ft) 1
Total
Nitrogen
(mg/L) 2
Total
Phosphorus
(mg/L) 2
Dissolved
Oxygen
(mg/L) 2
0.13
1.15
0.16
7.7
0.12
1.22
0.15
6.96
0.14
0.27
0.04
1.51
0.15
0.22
0.04
1.20
0.90
-5.9
-0.53
0.44
0.89
0.07
0.11
0.60
40.00
22.00
3.00
22.00
0.27
0.19
0.30
0.20
0.3
0.4
0.6
0.1
1. Monthly total flow volume estimated from daily flow recorded data at the USGS Station
21080000.
2. Daily nutrients concentration estimated from monthly water sample collected at the Ambient
Station B9480000.
Nutrient Concentration
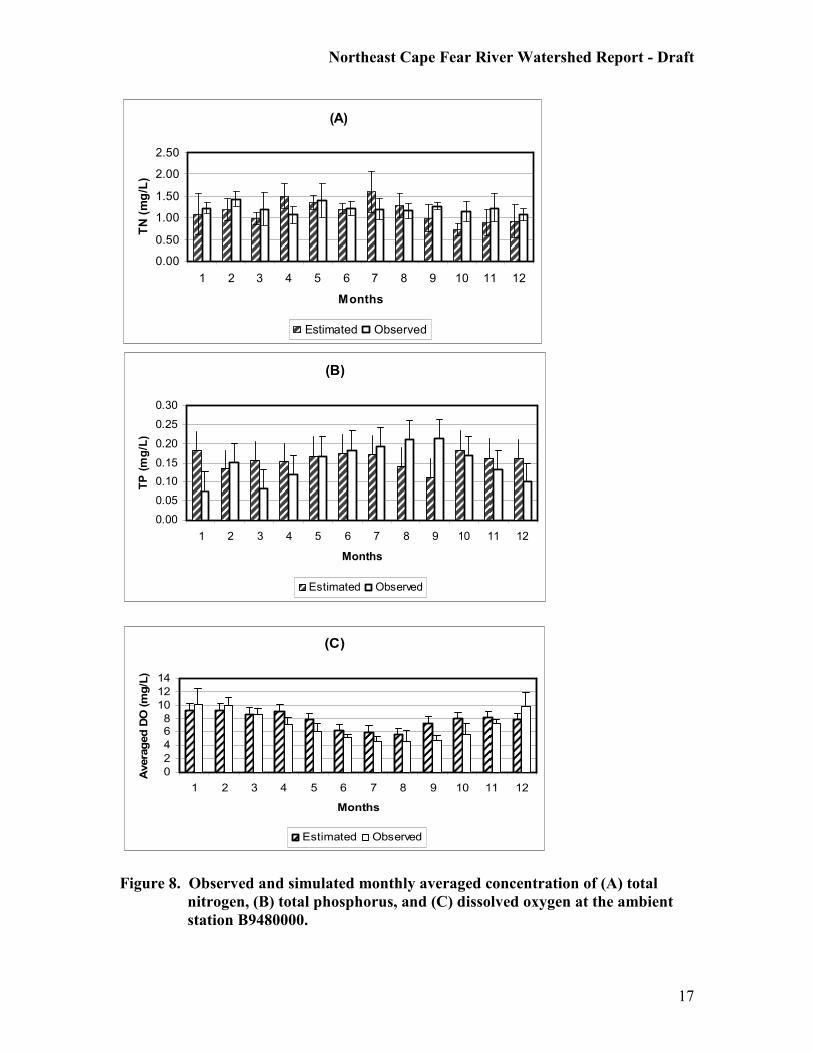
The average concentrations of TN, TP, and DO during the sampled periods, 1999
through 2005, are presented in Figures 7. Overall, difference between the simulated and
observed TN, TP, DO concentrations are not significant at 95% confidence level since p-
value is greater than 0.05 (Table 7). The error values associated with model prediction
for TN and TP are also well below the US EPA guidance value of 45%. The error value
for DO is slightly above the guidance value of 15%. However, the model prediction of
DO seems to be satisfactory, because the R-Square value is moderately high.
Unlike DO, the R-Square value is substantially low for TN and TP concentrations.
The low value suggests a weak relationship between simulation and observed
concentrations. The weakness could be due to uncertainty associated with sampling
frequency. Water samples were collected only once a month; therefore the uncertainty on
the estimation would have increased due to missing data for intervening days (Preston et
al. 1989; Hodgkins 2001).
The ME values is also estimated to be negative for TN and TP concentrations.
The negative value indicates that the sum of squared model residuals exceeded variance
of the observed concentration over the simulation period. The value, however, does not
indicate any meaningful evaluation for this study (Lane and Richards, 2003).
Northeast Cape Fear River Watershed Report - Draft
17
(B)
0.00
0.05
0.10
0.15
0.20
0.25
0.30
1 2 3 4 5 6 7 8 9 10 11 12
Months
TP (mg/L)
Estimated Observed
Figure 8. Observed and simulated monthly averaged concentration of (A) total
nitrogen, (B) total phosphorus, and (C) dissolved oxygen at the ambient
station B9480000.
(A)
0.00
0.50
1.00
1.50
2.00
2.50
1 2 3 4 5 6 7 8 9 10 11 12
Months
TN (mg/L)
Estimated Observed
(C)
0
2
4
68
10
12
14
1 2 3 4 5 6 7 8 9 10 11 12
Months
Averaged DO (mg/L)
Estimated Observed

Northeast Cape Fear River Watershed Report - Draft
18
Model Validation
Validation of the SWAT model is performed by comparing its daily estimated
TN, TP, and DO loads with FLUX estimation at the ambient station B9480000. Since
FLUX estimates loads from actual monitoring data, both delivered point source and
nonpoint source loads are included in the validation.
In order to estimate load, FLUX requires daily flow measurement at the ambient
station B9480000. Flow measured at the USGS station 02108566, which is located near
the ambient station, is utilized to estimate loads. However, daily flow at the USGS
station is available only from September 2003. Therefore, a regression equation is
developed to estimate flow for the missing periods, Jan 1999 through August 2003, by
regressing daily flow measured at the USGS stations 02108566 and 02108000 (Figure 6).
The relationship is expressed by the following equation (4).
Flow at USGS02108566 = e(0.2092 + 1.0275 * Log(flow at USGS 02108000))
------------------- (4)
R-Square = 0.90.
The high R-Square value indicates strong relationship between the two USGS stations.
The relationship is log normal.
Utilizing equation 4, daily flow at the ambient station B9480000 is estimated for
the missing periods. The FLUX model is then run to estimate TN, TP, and DO loads at
the station. The FLUX estimation provides a coefficient of variation (CV – Standard error
divided by mean) that summarizes the quality of fit between predicted and observed
loads, where the observed loads are computed from instantaneous concentration times
flow. The FULX model and its CVs are summarized in Table 8.
Table 8. Coefficient of variations as estimated by FLUX model.
Constituents CV
Total Nitrogen Load
Total Phosphorus Load
Dissolved Oxygen Load
0.043
0.073
0.075
The magnitude of the CVs reported in Table 8 is less than 0.1 which suggests that
the uncertainty in the loading estimate is significantly low; and hence the FLUX estimate
of daily loads are adequate to use for validation purposes.
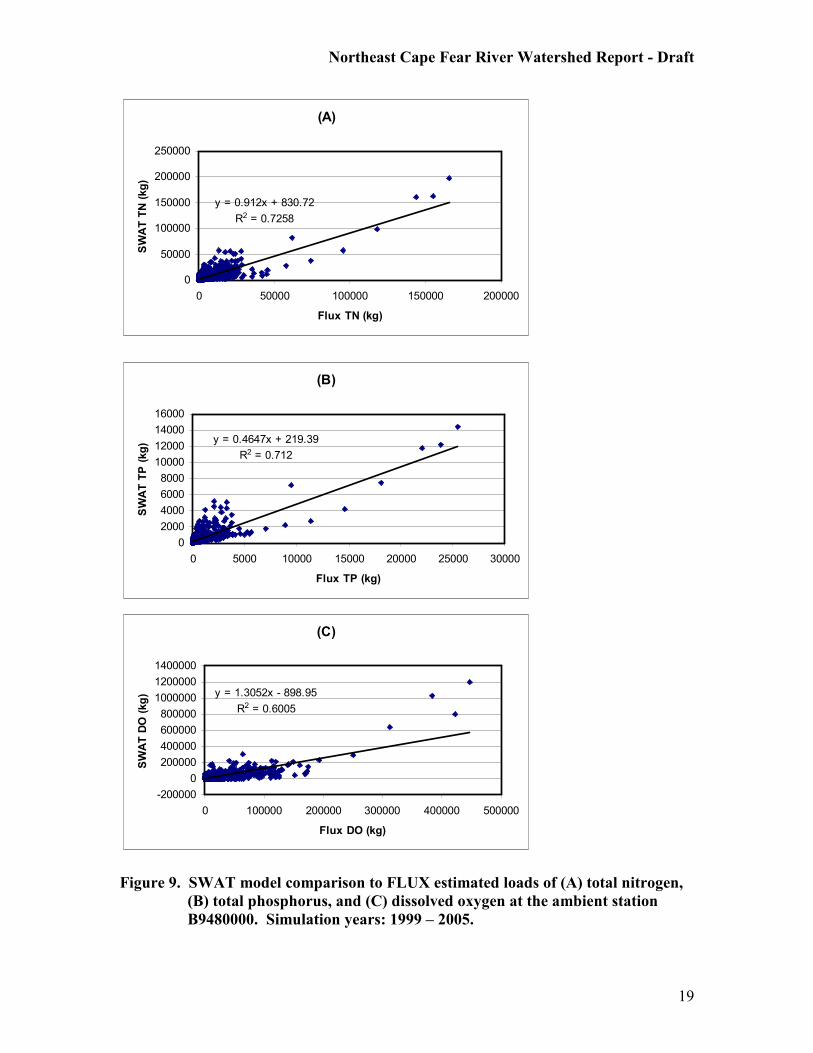
Comparison of SWAT and FLUX models, 1999 through 2005:
Nearly 70 percent of variation of the FLUX estimation of loads is explained by
the SWAT model for TN and TP and 60 percent for DO (Figure 9). The results suggest
that the SWAT model provided a good approximation of the FLUX estimates of loads for
TN, TP, and DO.
Northeast Cape Fear River Watershed Report - Draft
19
Figure 9. SWAT model comparison to FLUX estimated loads of (A) total nitrogen,
(B) total phosphorus, and (C) dissolved oxygen at the ambient station
B9480000. Simulation years: 1999 – 2005.
(A)
y = 0.912x + 830.72
R2 = 0.7258
0
50000
100000
150000
200000
250000
0 50000 100000 150000 200000
Flux TN (kg)
SWAT TN (kg)
(B)
y = 0.4647x + 219.39
R2 = 0.712
0
2000
4000
6000
8000
10000
12000
14000
16000
0 5000 10000 15000 20000 25000 30000
Flux TP (kg)
SWAT TP (kg)
(C)
y = 1.3052x - 898.95
R2 = 0.6005
-200000
0
200000
400000
600000
800000
1000000
1200000
1400000
0 100000 200000 300000 400000 500000
Flux DO (kg)
SWAT DO (kg)
Northeast Cape Fear River Watershed Report - Draft
20
WATERSHED MODEL RESULTS
Contribution from Conventional Point Sources
Conventional point sources are typically those regulated under NPDES program
and directly discharge domestic and industrial waste in the watershed. A list of the point
sources that measure nutrient levels in their effluent at a frequency based on class and
waste type in the watershed is given in Table 2. The list does not include MS4 sources.
The SWAT model is run with and without conventional point sources for long
term period from 1999 to 2005 to estimate averaged load delivered from point sources.
Figure 10 shows the percentage breakdown between point source and nonpoint sources.
The percentage contribution from the point sources is estimated considerably low for TN,
TP, and DO. Their contributions are 3%, 7%, and 0.4%, respectively.
The nonpoint sources were the major contributors of nitrogen, phosphorus and
DO in the Northeast Cape Fear River watershed. The following paragraphs discuss the
contribution from non-point sources in detail.

Northeast Cape Fear River Watershed Report - Draft
21
Dissolved Oxygen Load
Nonpoint
Source
99.60%
Point Source
0.40%
Figure 10. Relative discharge of conventional point and nonpoint source loads to
Northeast Cape Fear River.
Total Nitrogen Load
Nonpoint
Source
97%
Point Source
3%
Total Phosphorus Load
Point Source
7%
Nonpoint
Source
93%

Northeast Cape Fear River Watershed Report - Draft
22
Contribution from Non-point Sources
The SWAT model is run for long term period, from1999 to 2005, to estimate
average loading rates for both normal years and dry years for each land use type. The
years, 2001 and 2002, were dry years (Figure 4). Averaged monthly total loading rates
by land use (lb per acre) are summarized in Appendix 4. The respective contributing
loading rates from each nonpoint source are summarized in Figures 11 through 14.
Figure 11. Source attribution of the nonpoint total nitrogen load delivered to
Northeast Cape Fear River.
For nitrogen, agriculture and forested wetland contributed a major portion of the
load. They respectively contributed approximately 30% and 40% of the total nitrogen
load during normal and dry years. Forested wetland covered comparable amount of land
Total Annual Nitrogen Load During Normal Period
(Total Load =8,330,098 lb)
Wetland Non-
Forest
1%Wetland Forest
39%
Urban
5% Open Space
5%
Forest
22%
Agriculture
28%
Agriculture Forest Open Space Urban Wetland Forest Wetland Non-Forest
Total Annual Nitrogen Load During Dry Period
(Total Load = 4,793,460 lb)
Wetland Non-
Forest
1%Wetland Forest
42%
Urban
5% Open Space
4%
Forest
18%
Agriculture
30%
Agriculture Forest Open Space Urban Wetland Forest Wetland Non-Forest

Northeast Cape Fear River Watershed Report - Draft
23
area to agricultural and forested lands, but it contributed slightly high TN in the Northeast
Cape Fear watershed. The high contribution could be due to the following four reasons:
First, the forested wetland in the watershed appears that it was not designed to
trap nutrient loads coming from adjoining lands. The wetland functioned in natural
environment as a source, where several streams/creeks drain nutrients through it from
adjoining lands. Savage and Baker (2007) found that headwater wetlands located in
upper reaches of natural watersheds do not have a better filtering capacity than headwater
wetlands located in upper reaches of urban and developed watersheds in North Carolina.
The low filtering capacity could be due to a direct correlation between wetland water
quality and surrounding buffer, watershed, and land use.
Second, the forested wetland demonstrated different hydrologic characteristics.
Infiltration capacity of the wetland is comparatively low, thereby producing more surface
runoff than forested and agricultural lands (Table 9). Since surface runoff is the main
carrier of nutrients, the SWAT model predicted more nitrogen transported from wetlands
than agricultural land.
Table 9. Related hydrologic and nutrient process under different land use
conditions.
Land Use Runoff Phosphorus Nitrogen Phosphorus Biomass
In Soil Plant Uptake Plant Uptake Dry
(in) lb lb lb Tons
Urban 21.06 4,328.07 208,006.61 32,102.78 17,892.08
Agriculture 7.09 39,959.36 11,457,938.36 3,098,551.67 2,331,738.71
Open Space 6.61 3,234.44 409,302.64 122,395.66 18,598.86
Deciduous Forest 9.31 141.37 386,130.19 65,403.40 682,136.96
Evergreen Forest 5.97 609.04 3,455,746.42 577,016.28 3,690,116.05
Mixed Forest 6.23 348.74 1,677,532.34 283,784.12 2,983,663.73
Wetland Forest 12.03 8,107.78 3,791,570.96 611,243.60 6,750,007.73
Wetland Non Forest 13.13 192.00 138,899.00 47,607.73 568,580.64
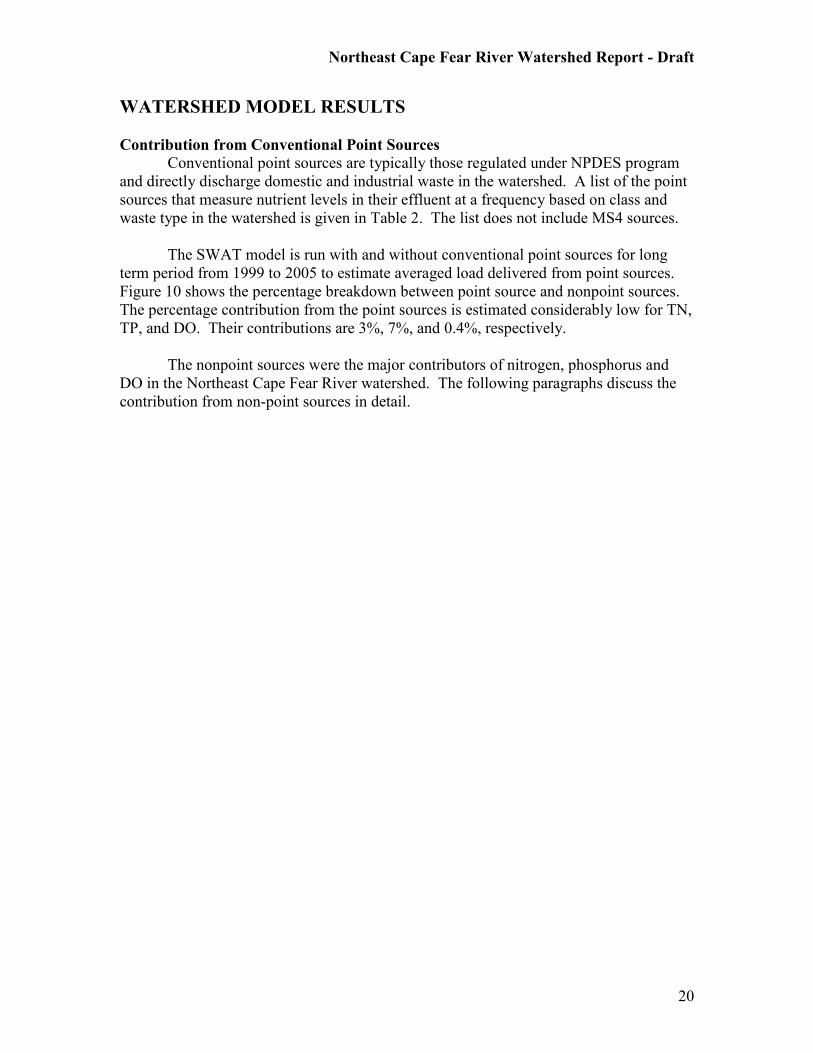
Third, dry biomass accumulation in the forested wetland is substantially higher
than in agricultural land (Table 9), suggesting more organic nitrogen pool in the wetland
soils. As a result, the forested wetland delivered more organic nitrogen than the
agricultural land in the watershed (Figure 12).
Northeast Cape Fear River Watershed Report - Draft
24
Figure 12. Source attribution of the nonpoint organic nitrogen load delivered to
Northeast Cape Fear River.
The above model prediction is further supported by actual measured nitrogen
values during 2004 and 2005 at the ambient stations - B9490000 and B9470000. The
station B9490000 is located in Angola Creek which flows through forested wetland,
whereas the station B9470000 is located in Rock Fish Creek which flows through mixed
land uses where agriculture and forest lands dominate the scenario (Figure 6). Organic
nitrogen concentration in Rock Fish Creek remained substantially higher than in Angola
Creek throughout the years (Figure 13). The result suggests that forested wetland is
comparatively critical to produce organic nitrogen in the Northeast Cape Fear River.
Annual Organic Nitrogen Load During Normal Period
(Total Load =2,027,931 lb)
Wetland Non-
Forest
1%Wetland Forest
38%
Urban
8% Open Space
7%
Forest
22%
Agriculture
24%
Agriculture Forest Open Space Urban Wetland Forest Wetland Non-Forest
Annual Organic Nitrogen Load During Dry Period
(Total Load = 1,221,273 lb)
Wetland Non-
Forest
1%Wetland Forest
42%
Urban
9%
Open Space
5%
Forest
16%
Agriculture
27%
Agriculture Forest Open Space Urban Wetland Forest Wetland Non-Forest

Northeast Cape Fear River Watershed Report - Draft
25
Figure13. Attenuation of nitrogen and dissolved oxygen in streams flowing through
forested wetland (B9490000) and mixed land (B9470000).
Organic Nitrogen Concentration
0
0.2
0.4
0.6
0.8
1
1.2
1.4
1.6
1.8
1/8/2004
3/8/2004
5/8/2004
7/8/2004
9/8/2004
11/8/2004
1/8/2005
3/8/2005
5/8/2005
7/8/2005
9/8/2005
11/8/2005
Date
Org N (mg/L)
B9470000 B9490000
DO Concentration
0
2
4
6
8
10
12
14
1/8/2004
3/8/2004
5/8/2004
7/8/2004
9/8/2004
11/8/2004
1/8/2005
3/8/2005
5/8/2005
7/8/2005
9/8/2005
11/8/2005
Date
DO (mg/L)
B9470000 B9490000

Northeast Cape Fear River Watershed Report - Draft
26
Forth, plant uptake of nitrogen in the forest wetland was comparatively lower than
in agricultural and forested lands (Table 9). As a result, more TN entering the wetland
was available for transportation through surface and lateral flow.
Although forested land occupies one third of the watershed area, it contributed
only 20% of TN during both dry and normal periods (Figure 11). Cheschier et al. (2003)
also found similar result for forested land in the coastal plain of eastern North Carolina
(10 km north of Beaufort). They found less than 6.5 kg/ha of annual TN exported from
75% of their forested watershed. In this study, the SWAT model estimated
approximately 5 kg/ha, which is close to their measured data. Thus continued conversion
of forested land for hog farming land will tend to increase nitrogen loads in the
watershed.
Contributions of nitrogen from urban land, open space, and non-forested wetland
are small as compared to forested wetland and agricultural land. The small contribution
could be due to relatively small portion of land occupied by these land use in the
watershed. They occupied only 1.63%, 3.04%, and 0.67% of the watershed, respectively.
For phosphorus, the dominant source of nonpoint load was agricultural land
during both dry and normal periods (Figure 14). Unlike nitrogen, accumulative capacity
of phosphorus in soil is high (Novotny, 2003). Therefore, a major portion of this load
was due to erosion, which accounts for 70% of the total loads (Table 9). This heavy
amount of phosphorus load can be reduced through additional adoption of agricultural
BMPs.
For dissolved oxygen, the dominant sources of nonpoint load were forested
wetland and agricultural land during both dry and normal period. Above analyses
suggested that these lands contributed significant amount of nitrogen and phosphorus to
the LCFR. If excessive amounts of phosphorus and/or nitrogen are added to the river,
there are two possible ways to reduce DO concentration.
First, algae and aquatic plants can grow in large quantities. When these plants die,
they are decomposed by bacteria, which use dissolved oxygen. However, significant
quantities of algae and aquatic plant growth in LCFR are not yet well documented. In the
DWQ’s special study report (Lower Cape Fear River/ Estuary TMDL Study, March 14,
2005), it is reported that Chlorophyll a, which is a green pigment presented in algae and
higher plants, ranged from 1.0µg/L to 35µg/L in the NECFR and LCFR during the
summer period of 2004. The Chlorophyll a standard is 40 µg/L.
Second, oxidation of ammonia or organic nitrogen can be accelerated in the water
body. The oxidation process is known as nitrification. During nitrification, considerable
amount of oxygen is utilized to produce nitrate (Novotny, 2003).

Northeast Cape Fear River Watershed Report - Draft
27
Figure14. Source attribution of the nonpoint total phosphorus load delivered to
Northeast Cape Fear River.
Total Annual Phosphorus Load During Normal Period
(Total Load = 700,168 lb)
Wetland Non
Forest
1%Agriculture
61%
Forest
9%
Open Space
4%
Urban
4%
Wetland Forest
21%
Agriculture Forest Open Space Urban Wetland Forest Wetland Non Forest
Total Annual Phosphorus Load During Dry Period
(Total Load = 413,387 lb)
Wetland Non
Forest
1%
Wetland Forest
22%
Urban
4%
Open Space
3% Forest
5%
Agriculture
65%
Agriculture Forest Open Space Urban Wetland Forest Wetland Non Forest

Northeast Cape Fear River Watershed Report - Draft
28
Critical Period
A critical period is the period when a maximum amount of nutrient is discharged
in a year. Figures 15 and 16 show monthly distribution of TN and TP loads delivered
from the NECFR watershed, respectively. The nutrient loads represent the average of the
7-year simulation (1999-2005). It is estimated that significant amounts of TN and TP
were delivered to the LCFR in March during dry period and in September during normal
period.
Figure 13. Monthly distribution of delivered total nitrogen load to Northeast Cape
Fear River.
Average Monthly Load of Total Nitrogen
During Normal Period
0
200000
400000
600000
800000
1000000
1200000
1400000
1600000
1 2 3 4 5 6 7 8 9 10 11 12
Months
TN (lb)
Average Monthly Load of Total Nitrogen
During Dry Period
0
200000
400000
600000800000
1000000
1200000
1400000
1600000
1 2 3 4 5 6 7 8 9 10 11 12
Months
TN (lb)

Northeast Cape Fear River Watershed Report - Draft
29
Figure 14. Monthly distribution of delivered total phosphorus load to Northeast
Cape Fear River.
Average Monthly Load of Total Phosphorus
During Normal Period
0
50000
100000
150000
1 2 3 4 5 6 7 8 9 10 11 12
Months
TP (lb)
Average Monthly Load of Total Phosphorus
During Dry Period
0
50000
100000
150000
1 2 3 4 5 6 7 8 9 10 11 12
Months
TP (lb)

Northeast Cape Fear River Watershed Report - Draft
30
CONCLUSION
The State of North Carolina has initiated development of a Total Maximum Daily
Load in the Lower Cape Fear River (LCFR) where low dissolved oxygen is a prime
concern. Studies have shown that the presence of hog farms and wetland together with
industrial and municipal point source discharges in the watersheds could add significant
amount of nitrogen and phosphorus to the LCFR.
The ArcView Interfaced Soil and Water Assessment Tool (AVSWAT) model is
used to evaluate the Northeast Cape Fear River watershed in order to understand total
nitrogen (TN) and total phosphorus (TP) loads from different point and nonpoint sources.
The watershed represents blackwater systems in the North Carolina Coastal Plain. It is
one of the largest watersheds that drain water to the LCFR. The drainage area of the
watershed is approximately 1693 square miles and covers 33% of agricultural land, 31 %
of forest land, 30% of Forested Wetland, 1% of Non-forest Wetland, 1.6% of Developed
Land, 3% of Open Space, and 0.4% of Water Body.
The model is calibrated for flow, TN, TP, and Dissolved Oxygen (DO). Overall,
the difference between simulated and observed flow volume and nutrient concentrations
were not significant at 95% confidence level. Error values associated with model
prediction were considerably low. Comparing its results with FLUX estimation of daily
nutrient loads further validates the model. A reasonable agreement between the two
models was observed.
The model results suggested that nonpoint sources contributed more than 90% of
the nutrient loads to the Lower Cape Fear River. Among the nonpoint sources,
agricultural land and forested wetland contributed a major portion of the load. They
respectively contributed approximately 30% and 40% of the total nitrogen load and 60%
and 20% of the total phosphorus load during normal and dry years. It is observed that the
nutrient load was high during March for dry period and during September for normal
period.
It appears the forested wetlands in the NECRF watershed were not designed to
trap nutrient loading coming from adjoining lands. The wetlands functioned as a passive
source by transporting nutrients into streams in the natural environment. Several
streams/creeks drain nutrients from wetlands as well as from adjoining lands. In
addition, the wetlands receive pollution input from surrounding uplands, including
agricultural land used for hog farming. Adoption of proper BMPs in the watershed would
reduce the nutrient loads.
In agricultural land, a significant portion of the phosphorus load was due to
erosion. It accounts for 70% of the total load. This heavy amount of load can be reduced
through additional adoption of agricultural BMPs.

Northeast Cape Fear River Watershed Report - Draft
31
REFERENCES Browen, L.C. and T.O. Barnwell, Jr. 1987. The Enhanced Water Quality Models QUAL2E and
QUAL2E-UNCAS Documentation and User Manual. EPA Document EPA/600/3-87/007.
USEPA. Athens, GA.
Chescheir, M.E. Lebo, D.M. Amatya, J. Hughes, J.W. Gilliam, R.W. Skaggs, and R.B.
Herrmann. 2003. Hydrology and Water Quality of Forested Lands in Estern North Carolina.
Technical Bulletin 320. North Carolina State University, Raleigh. NC.
Chapra, S.C.and G.C. Pelletier. 2003. QUAL2K. A Modeling Frame Work for Simulating River
and Stream Water Quality. Documentation and Users Manual. Civil and Environmental
Engineering Dept., Tufts University, Medford, MA.
Dahlen, Paul R. and Raymond M. Milosh. 2002. Impact of Animal Waste Lagoons on Ground
Water Quality: An Update on Data Collected from March 1998 through November 1999. Report
of Groundwater Investigation Number 18. NC Department of Environment and Natural
Resources. Raleigh, NC.
Engel, Bernard, Dan Storm, Mike White, Jeff Arnold, and Mazdak Arabi. 2007. A
Hydrologic/Water Quality Model Application Protocal. Journal of the American Water
Resources Association. Volume 43, No. 5.
Fisher, Jim. March 14, 2005. Memorandum: Lower Cape Fear River / Eastuary TMDL Study.
North Carolina Division of Water Quality, 1621 Mail Service Center, 4401 Reedy Creek Rd,
Raleigh, NC-27607.
Lane, Staurt N. and Keith S. Richards. 2001. The ‘Validation’ of Hydrodynamic Models: Some
Critical Perspectives. In Model Validation. Perspectives in Hydrological Science. Edited by
Malcolm G. Anderson and Paul D. Bates. John Wiley & Sons, LTD. New York.
Luzio, M. Di, R. Srinivasan, J.G. Arnold, and S.L. Neitsch. 2002. Soil and Water Assessment
Tool. ArcView GIS Interface Manual. Version 2000. Texas Water Resources Institute. College
Station, Texas. TWRI Report TR-193.
Mallin, Michael A, Matthew R. McIver, Heather A. Wells, Michael S. Wiiliams, Thomas E.
Lankford, and James F. Merritt. 2003. Environmental Assessment of the Lower Cape Fear River
System 2002-2003. CMS Report No. 03-03. Center for Marin Science, University of North
Carolina at Wilmington. Wilmington, NC 28409.
Mallin, Michael A, Lawrence B. Cahoon, Douglas C. Persons, and Scott H. Ensign.
2002. Seeking Science-Based Nutrient Standards for Coastal Blackwater Stream Systems. Water
Resources Research Institute of the University of North Carolina. UNC-WRRI – 2002-341.
Mallin, Michael A, Lawrence B. Cahoon, Douglas C. Persons, and Scott H. Ensign. 2001. Effect
of Nitrogen and Phosphorus Loading on Plankton in Coastal Plain Blackwater Rivers. Journal of
Freshwater Ecology. Volume 16, Number 3.
Mallin, Michael A, Lawrence B. Cahoon, Douglas C. Persons, and Scott H. Ensign.

Northeast Cape Fear River Watershed Report - Draft
32
1998. Effect of Organic and Inorganic Nutrient Loading on Photosynthetic and Heterotrophic
Plankton Communities in Blackwater Rivers. Water Resources Research Institute of The
University of North Carolina. Report NO. 315.
NCSU. 1999. http://nutrients.soil.ncsu.edu/yields/
Neitsch, S.L., J.G. Arnold, J.R. Kiniry, R. Srinivasan, J.R. Williams. 2002. Soil and Water
Assessment Tool. Theoretical Documentation. Version 2000. Published 2002 by Texas Water
Resources Institute, College Station, Texas. TWRI Report TR-191.
Neitsch, S.L., J.G. Arnold, J.R. Kiniry, R. Srinivasan, J.R. Williams. 2002. Soil and Water
Assessment Tool. User’s Manual. Version 2000. Published 2002 by Texas Water Resources
Institute, College Station, Texas. TWRI Report TR-192.
Novotny, Vladimir. 2003. Water Quality: Diffuse Pollution and Watershed Management.
Second Edition. Northeastern University, Boston, MA. John Wily & Sons, Inc. New York.
Refsgaard, J,C. and H.J. Henriksen. 2003. Modeling guidelines – terminology and guiding
principles, Advances in Water Resources 27, 71-82.
Savage, Rick and Virginia Baker. 2007. Development of a Headwater Monitoring Program for
Headwater Wetlands in North Carolina – Water Quality Analysis. Final Report. NC Department
of Environment and Natural Resources. Division of Water Quality. Wetland Program
Development Unit.
UIUC. 2007. http://nadp.sws.uiuc.edu/sites/siteinfo.asp?id=NC35&net=NTN
USEPA (U.S. Environmental Protection Agency). 1999. Technical Guidance Manual for
Performing Waste Load Allocations, Book III Estuaries, Part 2. Application of Estuarine Waste
Load Allocation Models. EPA 823-R-92-003.
USEPA (U.S. Environmental Protection Agency). 2002. Guidance for Quality Assurance Project
Plans for Modeling. EPA QA/C-5 M. Report EPA/240/R-02/007. Office of Environmental
Information, Washington D.C.
USGS. July 2007. http://www.ncgc.nrcs.usda.gov/products/datasets/statsgo/
USGS. October 2007. http://waterdata.usgs.gov/nc/
USGS. April 2005. http://gisdata.usgs.net/website/MRLC/viewer.php.
Walker, William W. 1999. Simplified Procedures for Eutrophication Assessment and Prediction:
User Manual. Instruction Report W-96-2. Water Operations Technical Support Program. U.S.
Army Corps of Engineers. Waterways Experiment Station. Washington, D.C.
Weaver, J. Curtis and Benjamin F. Pope. 2001. Low-Flow Characteristics and Discharge
Profiles for Selected Streams in the Cape Fear River Basin, North Carolina, Through
1998. US Geological Survey. Water –Resources Investigations Report 01-4094.
Raleigh, NC.

Northeast Cape Fear River Watershed Report - Draft
33
Appendix 1. Annual average load from NPDES program
Permit No. Year Flow TN TP DO
(m3/day) (kg/day) (kg/day) (kg/day)
NC0000817 1999 85.604 0.241 0.028 0.444
NC0000817 2000 54.504 0.082 0.023 0.331
NC0000817 2001 77.076 0.282 0.025 0.525
NC0000817 2002 57.881 0.205 0.012 0.253
NC0000817 2003 58.668 0.126 0.012 0.294
NC0001074 1999 1274.346 10.741 6.870 10.601
NC0001074 2000 1249.649 30.525 16.842 10.482
NC0001074 2001 1268.154 16.115 9.142 10.707
NC0001074 2002 7264.758 10.127 10.572 60.683
NC0001074 2003 1345.875 10.551 9.527 11.390
NC0001074 2004 1480.136 10.621 6.828 12.556
NC0001074 2005 1298.292 10.049 20.327 10.999
NC0001112 1999 9255.492 142.410 86.918 0.000
NC0001112 2000 9132.517 106.002 58.517 0.000
NC0001112 2001 8020.037 66.446 33.068 0.000
NC0001112 2002 7975.043 65.069 38.951 0.000
NC0001112 2003 7679.084 89.797 56.175 0.000
NC0001112 2004 8148.120 45.000 85.732 0.000
NC0001112 2005 11145.792 44.015 85.798 0.000
NC0001228 1999 1861.526 0.000 0.000 0.000
NC0001228 2000 1763.274 0.000 0.000 0.000
NC0001228 2001 1759.720 0.000 0.000 0.000
NC0001228 2002 1749.326 0.000 0.000 0.000
NC0001228 2003 1892.669 0.000 0.000 0.000
NC0001228 2004 1931.326 0.000 0.000 0.000
NC0001228 2005 1987.619 0.000 0.000 0.000
NC0001970 1999 1296.205 25.471 2.522 12.547
NC0001970 2000 1439.877 13.518 1.054 11.711
NC0001970 2001 1218.139 4.941 0.863 10.129
NC0001970 2002 1258.828 8.537 1.219 10.620
NC0001970 2003 1258.828 1.099 0.187 11.105
NC0001970 2004 1085.644 3.978 0.892 8.762
NC0001970 2005 1256.736 9.298 1.869 10.424
NC0002305 1999 2898.415 8.569 18.845 21.005
NC0002305 2000 3133.255 17.041 19.018 22.388
NC0002305 2001 3223.148 26.778 24.800 23.471
NC0002305 2002 3848.301 35.507 25.779 25.157
NC0002305 2003 2998.234 22.687 3.491 21.232
NC0002305 2004 3489.765 62.847 3.102 23.557
NC0002305 2005 3264.007 62.417 3.115 21.946
NC0002763 1999 85.983 0.000 0.000 0.000
NC0002763 2000 27.977 0.000 0.000 0.000
NC0002763 2001 47.313 0.000 0.000 0.000
NC0002763 2002 15.550 0.000 0.000 0.000

Northeast Cape Fear River Watershed Report - Draft
34
Appendix 1: Continued
Permit No. Year Flow TN TP DO
(m3/day) (kg/day) (kg/day) (kg/day)
NC0002763 2003 35.011 0.000 0.000 0.000
NC0002763 2004 52.265 0.000 0.000 0.000
NC0002763 2005 26.495 0.000 0.000 0.000
NC0002879 1999 3398.615 0.000 0.000 0.000
NC0002879 2000 3658.518 0.000 0.000 0.000
NC0002879 2001 4301.337 0.000 0.000 0.000
NC0002879 2002 2683.463 0.000 0.000 0.000
NC0002879 2003 2760.211 0.000 0.000 0.000
NC0002879 2004 3460.121 0.000 0.000 0.000
NC0002879 2005 1718.102 0.000 0.000 0.000
NC0002933 1999 24.445 0.000 0.000 0.000
NC0002933 2000 24.918 0.000 0.000 0.000
NC0002933 2001 22.868 0.000 0.000 0.000
NC0002933 2002 26.337 0.000 0.000 0.000
NC0002933 2003 25.391 0.000 0.000 0.000
NC0002933 2004 27.126 0.000 0.000 0.000
NC0002933 2005 21.764 0.000 0.000 0.000
NC0003051 2002 77.755 0.000 0.000 0.000
NC0003051 2003 75.700 0.000 0.000 0.000
NC0003051 2004 92.354 0.000 0.000 0.000
NC0003051 2005 80.248 0.000 0.000 0.000
NC0003344 1999 3196.088 72.767 10.806 25.206
NC0003344 2000 3874.547 90.941 16.883 32.216
NC0003344 2001 3928.672 92.629 21.933 34.167
NC0003344 2002 3401.273 85.711 20.261 26.622
NC0003344 2003 2608.880 64.977 16.961 22.463
NC0003344 2004 2774.781 75.253 25.063 22.797
NC0003344 2005 400.968 4.509 0.909 4.319
NC0003450 1999 11.103 0.000 0.000 0.000
NC0003450 2000 0.000 0.000 0.000 0.000
NC0003450 2001 0.000 0.000 0.000 0.000
NC0003450 2002 0.000 0.000 0.000 0.000
NC0003794 1999 451.424 0.000 0.000 0.000
NC0003794 2000 132.759 0.000 0.000 0.000
NC0003794 2001 184.960 0.000 0.000 0.000
NC0003794 2002 354.173 0.000 0.000 0.000
NC0003794 2003 418.463 0.000 0.000 0.000
NC0003794 2004 415.688 0.000 0.000 0.000
NC0003794 2005 406.888 0.000 0.000 0.000
NC0003875 1999 2687.075 18.289 3.309 22.965
NC0003875 2000 2597.299 14.061 0.304 21.753
NC0003875 2001 2481.575 11.407 0.373 20.819
NC0003875 2002 2213.031 13.294 1.350 18.792
NC0003875 2003 2560.297 18.097 0.207 22.028
NC0003875 2004 2629.380 14.275 1.365 22.979

Northeast Cape Fear River Watershed Report - Draft
35
Appendix 1: Continued
Permit No. Year Flow TN TP DO
(m3/day) (kg/day) (kg/day) (kg/day)
NC0003875 2005 2529.818 11.367 7.159 22.232
NC0020575 1999 3461.383 23.113 3.933 26.769
NC0020575 2000 3201.385 14.699 2.348 25.766
NC0020575 2001 2525.878 17.711 2.478 20.245
NC0020575 2002 2491.801 14.667 3.177 21.087
NC0020575 2003 3523.679 17.037 8.642 37.843
NC0020575 2004 3001.120 22.456 3.487 25.990
NC0020575 2005 2744.303 22.896 3.660 24.016
NC0020702 1999 2308.503 21.611 5.148 16.492
NC0020702 2000 2645.273 29.613 3.038 22.130
NC0020702 2001 2766.457 31.487 2.565 23.910
NC0020702 2002 2381.799 29.470 3.007 21.019
NC0020702 2003 3296.651 38.404 3.142 29.636
NC0020702 2004 2634.020 32.758 3.826 23.578
NC0020702 2005 2478.063 44.303 2.923 23.442
NC0021113 1999 1547.087 27.259 3.404 13.010
NC0021113 2000 1334.528 19.456 3.532 11.186
NC0021113 2001 1418.519 31.478 3.263 12.305
NC0021113 2002 1380.444 30.112 3.940 11.622
NC0021113 2003 1884.803 34.905 4.958 16.419
NC0021113 2004 1722.201 29.439 4.288 14.723
NC0021113 2005 1937.122 28.168 4.990 17.281
NC0023477 1999 113.550 0.000 0.000 0.000
NC0023477 2000 108.733 0.000 0.000 0.000
NC0023477 2001 110.396 0.000 0.000 0.000
NC0023477 2002 113.550 0.000 0.000 0.000
NC0023477 2003 108.556 0.000 0.000 0.000
NC0023477 2004 103.617 0.000 0.000 0.000
NC0023477 2005 120.449 0.000 0.000 0.000
NC0026018 1999 854.779 10.617 1.407 7.179
NC0026018 2000 727.067 10.908 1.836 6.070
NC0026018 2001 724.102 11.879 1.792 6.363
NC0026018 2002 889.946 8.711 2.164 8.551
NC0026018 2003 1146.667 20.763 1.668 10.112
NC0026018 2004 1016.612 14.265 1.604 9.124
NC0026018 2005 845.842 12.829 1.329 7.656
NC0036668 1999 690.590 11.534 1.679 5.770
NC0036668 2000 706.407 15.133 1.926 5.527
NC0036668 2001 664.508 14.112 1.944 5.296
NC0036668 2002 623.142 8.523 1.523 5.261
NC0036668 2003 808.150 11.089 1.511 7.031
NC0036668 2004 717.404 10.808 1.815 5.956
NC0036668 2005 713.856 15.437 2.106 6.870
NC0039527 1999 295.545 0.000 0.539 1.791
NC0039527 2000 328.349 0.000 0.782 2.068

Northeast Cape Fear River Watershed Report - Draft
36
Appendix 1: Continued
Permit No. Year Flow TN TP DO
(m3/day) (kg/day) (kg/day) (kg/day)
NC0039527 2001 312.263 0.000 0.879 1.953
NC0039527 2002 285.768 0.000 0.740 1.836
NC0039527 2003 265.265 0.000 0.691 1.675
NC0039527 2004 272.899 0.000 0.865 1.698
NC0039527 2005 246.998 7.284 0.597 1.647
NC0042251 1999 28.640 0.000 0.000 0.259
NC0042251 2000 17.253 0.000 0.000 0.147
NC0042251 2001 12.641 0.000 0.000 0.106
NC0042251 2002 12.396 0.000 0.000 0.107
NC0042251 2003 14.951 0.000 0.000 0.129
NC0042251 2004 17.348 0.000 0.000 0.148
NC0042251 2005 20.843 0.000 0.000 0.181
NC0049743 1999 285.137 59.032 0.057 0.000
NC0049743 2000 134.368 22.931 0.037 0.000
NC0049743 2001 157.393 26.624 0.038 0.000
NC0049743 2002 100.718 8.142 0.012 0.489
NC0049743 2003 138.153 17.171 0.015 0.000
NC0049743 2004 224.382 16.313 0.019 0.000
NC0049743 2005 96.447 7.701 0.008 0.000
NC0051969 1999 29.870 0.000 0.000 0.201
NC0051969 2000 4048.333 0.000 0.000 26.141
NC0051969 2001 27.599 0.000 0.000 0.221
NC0051969 2002 24.571 0.000 0.000 0.175
NC0051969 2003 28.230 0.000 0.000 0.204
NC0051969 2004 25.339 0.000 0.000 0.204
NC0051969 2005 22.836 0.000 0.000 0.210
NC0056863 1999 884.901 11.336 0.977 6.666
NC0056863 2000 804.123 6.713 0.867 6.218
NC0056863 2001 702.541 7.457 0.887 5.758
NC0056863 2002 617.084 7.305 1.122 4.390
NC0056863 2003 971.124 8.684 0.867 7.563
NC0056863 2004 647.946 6.067 0.679 5.589
NC0056863 2005 1008.612 6.980 1.078 7.916
NC0058271 1999 794.850 0.000 0.000 0.000
NC0058271 2000 911.239 0.000 0.000 0.000
NC0058271 2001 1117.206 0.000 0.000 0.000
NC0058271 2002 1182.813 0.000 0.000 0.000
NC0058271 2003 1487.547 0.000 0.000 0.000
NC0058271 2004 1091.342 0.000 0.000 0.000
NC0058271 2005 870.461 0.000 0.000 0.000
NC0058971 1999 4.668 0.000 0.000 0.000
NC0058971 2000 0.252 0.000 0.000 0.000
NC0058971 2001 0.000 0.000 0.000 0.000
NC0065307 1999 15.613 0.000 0.000 0.114
NC0065307 2000 14.541 0.000 0.000 0.097

Northeast Cape Fear River Watershed Report - Draft
37
Appendix 1: Continued
Permit No. Year Flow TN TP DO
(m3/day) (kg/day) (kg/day) (kg/day)
NC0065307 2001 9.620 0.000 0.000 0.060
NC0065307 2002 8.295 0.000 0.000 0.052
NC0065307 2003 8.453 0.000 0.000 0.053
NC0065307 2004 8.169 0.000 0.000 0.050
NC0065307 2005 8.123 0.000 0.000 0.050
NC0066320 1999 1044.660 0.000 0.000 0.000
NC0066320 2000 1044.660 0.000 0.000 0.000
NC0066320 2001 1044.660 0.000 0.000 0.000
NC0066320 2002 1044.660 0.000 0.000 0.000
NC0066320 2003 1044.660 0.000 0.000 0.000
NC0066320 2004 1042.768 0.000 0.000 0.000
NC0066320 2005 1044.660 0.000 0.000 0.000
NC0085481 1999 48.792 0.000 0.000 0.464
NC0085481 2000 30.154 0.000 0.000 0.263
NC0085481 2001 22.552 0.000 0.000 0.196
NC0085481 2002 15.045 0.000 0.000 0.132
NC0085481 2003 21.322 0.000 0.000 0.194
NC0085481 2004 19.209 0.000 0.000 0.183
NC0085481 2005 20.075 0.000 0.000 0.180
NC0086801 2000 0.000 0.000 0.000 0.000
NC0086801 2001 0.000 0.000 0.000 0.000
NC0086801 2002 86.740 0.000 0.000 0.000
NC0086801 2003 73.808 0.000 0.000 0.000
NC0086801 2004 48.890 0.000 0.000 0.000
NC0086801 2005 30.690 0.000 0.000 0.000
Northeast Cape Fear River Watershed Report - Draft
38
Appendix 2. Observed vs estimated monthly total flow Year Month Observed SWAT Year Month Observed SWAT Year Month Observed SWAT
(ft) (ft) (ft) (ft) (ft) (ft)
1999 Jan 0.328 0.232 2002 Jan 0.099 0.129 2005 Jan 0.087 0.099
1999 Feb 0.156 0.151 2002 Feb 0.088 0.086 2005 Feb 0.078 0.078
1999 Mar 0.107 0.134 2002 Mar 0.196 0.186 2005 Mar 0.118 0.086
1999 Apr 0.068 0.068 2002 Apr 0.111 0.151 2005 Apr 0.119 0.093
1999 May 0.082 0.110 2002 May 0.020 0.039 2005 May 0.089 0.109
1999 Jun 0.029 0.090 2002 Jun 0.009 0.038 2005 Jun 0.037 0.072
1999 Jul 0.056 0.113 2002 Jul 0.009 0.034 2005 Jul 0.046 0.046
1999 Aug 0.031 0.233 2002 Aug 0.011 0.036 2005 Aug 0.030 0.021
1999 Sept 1.155 1.162 2002 Sept 0.029 0.060 2005 Sept 0.013 0.038
1999 Oct 0.527 0.350 2002 Oct 0.011 0.043 2005 Oct 0.189 0.128
1999 Nov 0.150 0.234 2002 Nov 0.063 0.104 2005 Nov 0.081 0.075
1999 Dec 0.091 0.098 2002 Dec 0.080 0.094 2005 Dec 0.190 0.112
2000 Jan 0.183 0.077 2003 Jan 0.065 0.073
2000 Feb 0.228 0.223 2003 Feb 0.129 0.110
2000 Mar 0.196 0.215 2003 Mar 0.267 0.223
2000 Apr 0.145 0.147 2003 Apr 0.269 0.247
2000 May 0.047 0.060 2003 May 0.157 0.173
2000 Jun 0.048 0.047 2003 Jun 0.276 0.162
2000 Jul 0.084 0.075 2003 Jul 0.520 0.615
2000 Aug 0.064 0.062 2003 Aug 0.223 0.219
2000 Sept 0.179 0.194 2003 Sept 0.042 0.120
2000 Oct 0.070 0.097 2003 Oct 0.105 0.143
2000 Nov 0.041 0.051 2003 Nov 0.179 0.122
2000 Dec 0.084 0.043 2003 Dec 0.227 0.163
2001 Jan 0.054 0.013 2004 Jan 0.083 0.092
2001 Feb 0.078 0.060 2004 Feb 0.150 0.110
2001 Mar 0.285 0.206 2004 Mar 0.103 0.109
2001 Apr 0.121 0.125 2004 Apr 0.110 0.131
2001 May 0.028 0.073 2004 May 0.180 0.205
2001 Jun 0.103 0.138 2004 Jun 0.075 0.102
2001 Jul 0.019 0.038 2004 Jul 0.032 0.049
2001 Aug 0.123 0.101 2004 Aug 0.174 0.136
2001 Sept 0.038 0.077 2004 Sept 0.143 0.199
2001 Oct 0.016 0.025 2004 Oct 0.033 0.135
2001 Nov 0.007 0.010 2004 Nov 0.070 0.141
2001 Dec 0.016 0.008 2004 Dec 0.089 0.109

Northeast Cape Fear River Watershed Report - Draft
39
Appendix 3. Observed vs estimated nutrient concentration at
B9480000.
Month Year EstTN ObsTN EstTP ObsTP EstDO ObsDO
(mg/L) (mg/L) (mg/L) (mg/L) (mg/L) (mg/L)
1 1999 1.13 1.23 0.15 0.05 9.46 11.00
2 1999 1.47 1.23 0.13 0.06 8.81 7.90
3 1999 1.07 0.75 0.17 0.07 10.62 9.70
4 1999 1.55 0.78 0.16 0.11 8.61 6.80
5 1999 1.34 0.87 0.16 0.14 7.35 6.10
6 1999 1.09 0.98 0.27 0.18 6.24 5.40
7 1999 1.01 1.1 0.09 0.21 8.00 5.90
8 1999 1.62 1.05 0.23 0.21 7.82 0.24
8 1999 1.29 1.31 0.09 0.24 1.14 4.40
9 1999 1.01 1.37 0.09 0.21 7.61 4.00
10 1999 0.78 1.42 0.16 0.22 5.81 3.10
11 1999 0.71 1.74 0.14 0.14 9.06 7.20
12 1999 0.67 0.92 0.16 0.12 8.96 10.20
1 2000 0.83 1.27 0.19 0.08 8.69 10.40
2 2000 1.27 1.6 0.13 0.06 8.83 9.80
3 2000 0.79 1.35 0.19 0.11 8.44 8.40
4 2000 1.26 1.11 0.13 0.11 9.08 7.40
5 2000 1.18 1.32 0.15 0.12 8.09 4.80
6 2000 1.37 1.13 0.25 0.15 5.36 5.30
7 2000 1.63 1.08 0.19 0.19 6.03 5.50
8 2000 0.95 0.79 0.21 0.22 7.27 4.90
9 2000 1.16 1.16 0.09 0.2 7.64 5.40
10 2000 0.63 0.82 0.19 0.14 9.44 7.40
11 2000 1.23 0.93 0.20 0.16 8.04 6.90
12 2000 1.43 1.12 0.15 0.07 7.53 10.90
1 2001 1.09 1.05 0.25 0.06 8.75 12.70
2 2001 NA NA 0.12 0.50 9.52 9.60
4 2001 NA NA 0.33 0.19 9.31 6.60
5 2001 NA NA 0.16 0.20 6.94 6.30
6 2001 NA NA NA NA 4.23 4.60
7 2001 1.25 1.45 0.22 0.24 6.51 4.00
8 2001 1.32 1.31 0.12 0.27 6.82 5.70
9 2001 NA NA NA NA 7.77 5.30
10 2001 NA NA NA NA 9.33 6.80
11 2001 NA NA NA NA 5.42 7.70
12 2001 NA NA NA NA 0.47 5.80
1 2002 NA NA NA NA 3.72 5.20
2 2002 NA NA NA NA 9.24 9.90
3 2002 NA NA NA NA 4.95 7.60
4 2002 NA NA NA NA 9.00 7.20
5 2002 NA NA NA NA 7.52 7.00
6 2002 NA NA NA NA 4.31 5.70
7 2002 NA NA NA NA 6.62 3.50
8 2002 NA NA NA NA 2.55 3.90

Northeast Cape Fear River Watershed Report - Draft
40
Appendix 3: Continued
Month Year EstTN ObsTN EstTP ObsTP EstDO ObsDO
(mg/L) (mg/L) (mg/L) (mg/L) (mg/L) (mg/L)
9 2002 NA NA NA NA 6.68 4.70
10 2002 NA NA NA NA 7.42 3.90
12 2002 NA NA NA NA 10.23 11.10
1 2003 NA NA NA NA 10.95 10.90
2 2003 NA NA NA NA 8.75 11.00
3 2003 NA NA NA NA 9.17 7.50
4 2003 NA NA NA NA 9.08 5.20
5 2003 NA NA NA NA 7.92 5.30
6 2003 1.14 1.32 0.16 0.20 6.88 4.80
7 2003 1.10 1.11 0.13 0.16 7.42 3.30
8 2003 0.69 1.29 0.16 0.25 7.78 4.40
9 2003 0.57 1.25 0.18 0.23 7.5 4.30
10 2003 0.64 1.13 0.16 0.12 9.09 7.10
11 2003 1.02 1.36 0.11 0.11 8.01 5.90
12 2003 0.6 1.06 0.18 0.09 9.28 9.30
1 2004 0.53 1.37 0.17 0.08 11.28 9.20
2 2004 1.15 1.53 0.14 0.06 9.85 11.60
3 2004 1.11 1.62 0.11 0.07 8.45 8.70
4 2004 1.3 1.09 0.18 0.12 9.45 8.80
5 2004 1.37 1.74 0.07 0.21 8.13 5.10
6 2004 1.24 1.25 0.13 0.19 7.89 5.10
7 2004 2.04 0.96 0.18 0.16 4.02 4.30
7 2004 1.3 1.02 0.23 0.17 2.84 4.30
7 2004 2.09 1.07 0.24 0.18 4.66 4.60
7 2004 2.61 1.09 0.1 0.18 4.99 4.60
7 2004 1.7 1.25 0.25 0.19 7.16 4.60
7 2004 1.6 1.41 0.17 0.2 5.86 4.70
7 2004 1.69 1.8 0.1 0.23 6.15 5.20
8 2004 1.4 1.12 0.11 0.16 6.5 5.00
8 2004 1.42 1.19 0.08 0.17 7.17 5.40
8 2004 1.35 1.28 0.1 0.2 6.14 6.00
9 2004 1.23 1.29 0.09 0.21 6.86 5.30
10 2004 0.67 1.07 0.16 0.18 8.38 6.00
11 2004 0.99 1.03 0.17 0.16 9.00 7.40
12 2004 1.24 1.28 0.16 0.16 7.86 11.40
1 2005 1.83 1.22 0.15 0.11 11.34 11.30
2 2005 0.88 1.33 0.15 0.08 9.25 10.00
3 2005 0.98 1.08 0.15 0.08 10.13 9.50
4 2005 1.90 1.27 0.14 0.14 8.68 7.60
5 2005 1.57 1.65 0.13 0.18 8.45 7.80
6 2005 1.2 1.41 0.07 0.18 7.95 5.50
7 2005 1.19 1.07 0.16 0.19 6.62 4.90
8 2005 1.47 1.03 0.16 0.18 2.12 5.50
10 2005 0.95 1.31 0.25 0.19 6.19 4.50
11 2005 0.47 1.09 0.19 0.09 8.63 7.80
12 2005 0.70 1.00 0.15 0.06 10.02 10.5

Northeast Cape Fear River W
atershed Report - Draft
41
Appendix 4. M
onthly average nutrient loads from different land types.
Normal Period
Nutrient/Land use
Jan
Feb
Mar
Apr
May
Jun
July
Aug
Sept
Oct
Nov
Dec
A. Total Nitrogen (tons)
Agriculture
75.51
72.42 106.54 119.05 111.47
78.52 108.35 101.91 211.49
94.83
56.09
47.81
Forest
75.69
65.66
78.45
77.51
69.61
44.86
70.01
67.04 180.08
91.88
55.17
52.72
Open Space
16.98
10.06
15.47
13.49
8.75
10.52
18.77
20.06
46.66
22.22
12.17
9.57
Urban
13.96
11.68
15.30
16.52
15.99
13.10
17.89
19.39
30.04
17.51
11.43
9.54
Forested Wetland
144.21 128.77 174.13 205.75 132.49
77.31 105.94 119.58 251.34 124.26 115.22
76.31
Wetland Non-Forest
2.39
1.63
2.40
2.53
2.57
1.99
2.81
3.01
6.45
3.28
1.85
1.50
Total
328.75 290.22 392.30 434.85 340.88 226.30 323.77 330.98 726.06 353.98 251.92 197.45
B. Total Phosphorus (tons)
Agriculture
13.51
12.17
18.41
19.12
19.06
12.92
19.97
18.67
35.25
22.53
14.96
10.71
Forest
2.68
2.23
3.05
2.87
2.56
1.23
1.73
1.77
4.61
3.49
2.58
2.40
Open Space
1.45
0.51
1.07
0.87
0.44
0.66
1.37
1.34
4.09
1.60
0.72
0.51
Urban
0.96
0.58
0.89
1.12
1.16
0.95
1.41
1.39
2.45
1.07
0.55
0.42
Forested Wetland
8.10
6.34
11.03
14.27
6.08
2.04
2.47
2.79
6.02
3.78
7.65
3.47
Wetland Non-Forest
0.15
0.10
0.14
0.16
0.17
0.12
0.16
0.17
0.34
0.24
0.14
0.12
Total
26.86
21.92
34.60
38.40
29.48
17.92
27.11
26.12
52.76
32.72
26.59
17.64

Northeast Cape Fear River W
atershed Report - Draft
42
Appendix 4: Continued
Dry Period
A. Total Nitrogen (tons)
Agriculture
41.32
47.12 207.29
37.73
54.37
87.17
44.17
67.36
50.76
23.98
37.47
25.68
Forest
29.13
28.11 126.92
26.63
25.07
41.88
27.59
40.52
30.48
13.10
27.12
22.70
Open Space
6.92
5.88
29.94
6.91
3.02
10.33
7.77
12.67
9.64
4.59
5.82
4.14
Urban
7.65
8.05
23.87
7.33
9.63
13.24
11.03
14.91
10.77
6.09
7.55
6.34
Forested Wetland
37.29
71.39 319.37
45.65
58.29
91.86
49.63
74.15
68.86
30.51
91.08
60.90
Wetland Non-Forest
1.19
1.15
4.47
0.64
1.28
2.29
1.13
2.20
1.59
0.75
1.19
0.72
Total
123.51 161.69 711.87 124.91 151.65 246.77 141.31 211.81 172.10
79.01 170.22 120.49
B. Total Phosphorus (tons)
Agriculture
7.17
7.73
35.20
7.57
10.48
18.49
6.26
10.49
11.76
5.44
9.01
5.59
Forest
0.76
0.72
3.75
2.35
0.63
0.76
0.35
0.59
0.44
0.24
0.37
0.39
Open Space
0.46
0.27
2.41
0.43
0.11
0.64
0.39
0.72
0.52
0.26
0.25
0.18
Urban
0.59
0.47
2.09
0.24
0.65
1.03
0.77
1.16
0.59
0.27
0.39
0.20
Forested Wetland
1.10
3.72
22.10
2.41
1.99
2.26
0.83
1.32
1.15
0.79
4.99
2.39
Wetland Non-Forest
0.07
0.06
0.25
0.07
0.07
0.12
0.06
0.11
0.08
0.06
0.07
0.05
Total
10.15
12.97
65.80
13.07
13.93
23.30
8.66
14.39
14.56
7.06
15.07
8.81