Embed Size (px)
Citation preview

wq-iw5-12b
Draft Bois de Sioux River Watershed Total Maximum Daily Load Study
A quantification of the total amount of phosphorus, total suspended solids, and bacteria that can be received by the lakes and streams in the Bois de Sioux River Watershed, and maintain their ability to support swimming, fishing, and healthy biological communities.
March 2018

Bois de Sioux River Watershed TMDL • DRAFT 2018 Minnesota Pollution Control Agency
Authors and contributors: Emmons & Olivier Resources, Inc.:
Meghan Funke, PhD
Jason Ulrich
Paula Kalinosky
Jason Naber
Sean Marczewski
Etoile Jensen
Minnesota Pollution Control Agency:
Cary Hernandez
Kevin Stroom
Holly Christiansen
Josh Stock
Marco Graziani
Tim James
Jon Roeschlein (Bois de Sioux Watershed District)

Bois de Sioux River Watershed TMDL • DRAFT 2018 Minnesota Pollution Control Agency
Contents Acronyms .......................................................................................................................................... i
Executive Summary ........................................................................................................................... iii
1 Project Overview ........................................................................................................................1
Purpose ................................................................................................................................................ 1
Identification of Waterbodies .............................................................................................................. 3
Priority Ranking .................................................................................................................................... 5
Description of the Impairments and Stressors .................................................................................... 5
Lake Eutrophication .............................................................................................................. 5
Stream E. coli ......................................................................................................................... 6
Stream Turbidity ................................................................................................................... 6
Stream Fish and Macroinvertebrate Bioassessments ........................................................... 6
Stream Dissolved Oxygen ...................................................................................................... 7
2 Applicable Water Quality Standards and Numeric Water Quality Targets .....................................8
Lakes ..................................................................................................................................................... 8
Lake Eutrophication .............................................................................................................. 8
Streams ................................................................................................................................................ 9
Bacteria ................................................................................................................................. 9
Turbidity .............................................................................................................................. 10
Stream Eutrophication ........................................................................................................ 11
3 Watershed and Water body Characterization ............................................................................ 12
Lakes ................................................................................................................................................... 12
Streams .............................................................................................................................................. 14
Subwatersheds ................................................................................................................................... 15
Land Use ............................................................................................................................................. 16
Current/Historical Water Quality ....................................................................................................... 18
Lake Eutrophication (Phosphorus) ...................................................................................... 18
Shallow Lakes .................................................................................................................. 18
Stream Monitoring Stations ................................................................................................ 20
River Eutrophication (Phosphorus) ..................................................................................... 22
Bois de Sioux River (09020101-501) ............................................................................... 22
Rabbit River (09020101-502) .......................................................................................... 24
Rabbit River – South Fork (09020101-512) ..................................................................... 26
Stream Dissolved Oxygen .................................................................................................... 26
Bois de Sioux River (09020101-501) ............................................................................... 26

Bois de Sioux River Watershed TMDL • DRAFT 2018 Minnesota Pollution Control Agency
Rabbit River (09020101-502) .......................................................................................... 28
Rabbit River – South Fork (09020101-512) ..................................................................... 32
Stream E. coli ....................................................................................................................... 34
Bois de Sioux River (09020101-501) ............................................................................... 34
Rabbit River (09020101-502) .......................................................................................... 35
Unnamed Creek – Doran Slough (09020101-510) .......................................................... 38
Stream Total Suspended Solids ........................................................................................... 39
Bois de Sioux River (09020101-501) ............................................................................... 39
Rabbit River (09020101-502) .......................................................................................... 41
Rabbit River – South Fork (09020101-512) ..................................................................... 43
Pollutant Source Summary ................................................................................................................. 43
Lake Phosphorus ................................................................................................................. 43
Permitted Sources ........................................................................................................... 43
Non-permitted Sources ................................................................................................... 43
Stream Total Phosphorus and Total Suspended Solids ....................................................... 50
Permitted ........................................................................................................................ 50
Non-permitted ................................................................................................................ 50
Stream E. coli ....................................................................................................................... 59
Permitted ........................................................................................................................ 60
Non-NPDES Permitted .................................................................................................... 61
Strengths and Limitations ............................................................................................... 65
Summary ......................................................................................................................... 66
4 TMDL Development .................................................................................................................. 68
Phosphorus ........................................................................................................................................ 68
Loading Capacity ................................................................................................................. 68
Lake Response Model ..................................................................................................... 68
Stream Load Duration Curves ......................................................................................... 70
Load Allocation Methodology ............................................................................................. 71
Wasteload Allocation Methodology ................................................................................... 71
MS4 Regulated Stormwater ............................................................................................ 71
Regulated Construction Stormwater .............................................................................. 72
Regulated Industrial Stormwater .................................................................................... 72
Feedlots Requiring NPDES/SDS Permit Coverage ........................................................... 72
Municipal and Industrial Waste Water Treatment Systems ........................................... 73
Margin of Safety .................................................................................................................. 75
Seasonal Variation .............................................................................................................. 75

Bois de Sioux River Watershed TMDL • DRAFT 2018 Minnesota Pollution Control Agency
TMDL Summary ................................................................................................................... 76
Ash Lake (26-0294-00) TP TMDL ..................................................................................... 76
Upper Lightning Lake (56-0957-00) TP TMDL ................................................................. 77
Bois de Sioux River (09020101-501) TP TMDL ................................................................ 78
Rabbit River (09020101-502) TP TMDL ........................................................................... 82
Rabbit River – South Fork (09020101-512) TP TMDL ...................................................... 84
TMDL Baseline ..................................................................................................................... 85
Turbidity/TSS ...................................................................................................................................... 85
Loading Capacity Methodology .......................................................................................... 85
Load Allocation Methodology ............................................................................................. 86
Wasteload Allocation Methodology ................................................................................... 86
MS4 Regulated Stormwater ............................................................................................ 86
Regulated Construction Stormwater .............................................................................. 86
Regulated Industrial Stormwater .................................................................................... 87
Feedlots Requiring NPDES/SDS Permit Coverage ........................................................... 87
Municipal and Industrial Waste Water Treatment Systems ........................................... 87
Margin of Safety .................................................................................................................. 88
Seasonal Variation .............................................................................................................. 88
TMDL Summary ................................................................................................................... 89
Bois de Sioux River (09020101-501) TSS TMDL .............................................................. 89
Rabbit River (09020101-502) TSS TMDL ......................................................................... 91
Rabbit River – South Fork (09020101-512) TSS TMDL .................................................... 93
TMDL Baseline ..................................................................................................................... 94
Bacteria (E. coli) .................................................................................................................................. 94
Loading Capacity Methodology .......................................................................................... 94
Load Allocation Methodology ............................................................................................. 95
Wasteload Allocation Methodology ................................................................................... 95
MS4 Regulated Stormwater ............................................................................................ 95
Regulated Construction Stormwater .............................................................................. 95
Regulated Industrial Stormwater .................................................................................... 95
Feedlots Requiring NPDES/SDS Permit Coverage ........................................................... 95
Municipal and Industrial Waste Water Treatment Systems ........................................... 96
Margin of Safety .................................................................................................................. 97
Seasonal Variation .............................................................................................................. 97
TMDL Summary ................................................................................................................... 98
Bois de Sioux River (09020101-501) E. coli TMDL ........................................................... 98
Rabbit River (09020101-502) E. coli TMDL ................................................................... 100

Bois de Sioux River Watershed TMDL • DRAFT 2018 Minnesota Pollution Control Agency
Doran Slough (09020101-510) E. coli TMDL ................................................................. 102
TMDL Baseline ................................................................................................................... 103
Impairments not addressed by TMDLs ............................................................................................ 103
5 Future Growth/Reserve Capacity ............................................................................................ 105
New or Expanding Permitted MS4 WLA Transfer Process ............................................................... 105
New or Expanding Wastewater........................................................................................................ 105
6 Reasonable Assurance ............................................................................................................ 107
Non-regulatory ................................................................................................................................. 107
Regulatory ........................................................................................................................................ 107
Regulated Construction Stormwater ................................................................................ 107
Regulated Industrial Stormwater ...................................................................................... 108
Wastewater & State Disposal System (SDS) Permits ........................................................ 108
Subsurface Sewage Treatment Systems Program (SSTS) .................................................. 108
Feedlot Rules ..................................................................................................................... 108
Nonpoint Source ............................................................................................................... 108
7 Monitoring Plan ...................................................................................................................... 110
Lake and Stream Monitoring ............................................................................................................ 110
BMP Monitoring ............................................................................................................................... 110
8 Implementation Strategy Summary ......................................................................................... 111
Permitted Sources ............................................................................................................................ 111
Construction Stormwater ................................................................................................. 111
Industrial Stormwater ....................................................................................................... 111
Wastewater ....................................................................................................................... 111
Phosphorus ................................................................................................................... 112
Non-Permitted Sources .................................................................................................................... 112
Best Management Practices ............................................................................................. 112
Education and Outreach ................................................................................................... 112
Technical Assistance ......................................................................................................... 112
Partnerships ...................................................................................................................... 113
Cost .................................................................................................................................................. 113
Phosphorus ....................................................................................................................... 113
TSS ..................................................................................................................................... 113
Bacteria ............................................................................................................................. 113
Adaptive Management..................................................................................................................... 114
9 Public Participation ................................................................................................................. 115
Technical Committee Meetings ....................................................................................................... 115

Bois de Sioux River Watershed TMDL • DRAFT 2018 Minnesota Pollution Control Agency
Civic Engagement ............................................................................................................................. 115
10 Literature Cited ................................................................................................................... 116
11 Appendix A: BATHTUB Supporting Information .................................................................... 117
12 Appendix B: Lake Summaries .............................................................................................. 125
Ash Lake ........................................................................................................................................... 125
Mud Lake .......................................................................................................................................... 128
Lake Traverse ................................................................................................................................... 130
Upper Lightning Lake ....................................................................................................................... 132
List of Tables Table 1. Bois de Sioux River Watershed Impaired Streams and Lakes ................................................................... 3
Table 2. Pollutants addressed by TMDL for impaired streams .............................................................................. 5
Table 3. Summary of stressors causing biological impairment in BdSRW streams by location (AUID) ...................... 7
Table 4. Lake Eutrophication Standards ............................................................................................................. 9
Table 5. Past and current numeric water quality standards of bacteria (fecal coliform and E. coli) for the beneficial use of aquatic recreation (primary and secondary body contact) ....................................................................... 10
Table 6. Total suspended solids standard by stream class ................................................................................. 10
Table 7. Stream Eutrophication Standards ....................................................................................................... 11
Table 8. Impaired lake physical characteristics ................................................................................................. 13
Table 9. Impaired stream direct drainage and total watershed areas ................................................................. 14
Table 10. Bois de Sioux River Watershed and impaired lake and stream subwatershed land cover (NLCD 2011) .... 16
Table 11. Ten-year growing season mean TP, Chl-a, and Secchi (2002-2011) ...................................................... 18
Table 12. Ten-year growing season average total phosphorus (mg/l) by monitoring station in Bois de Sioux River (09020101-501), 2002-2011 ........................................................................................................................... 22
Table 13. Ten-year growing season average total phosphorus (mg/l) by monitoring station in Rabbit River (09020101-502), 2002-211 ............................................................................................................................. 24
Table 14. Ten-year monthly DO water quality standard exceedances in Bois de Sioux River (09020101-501), 2002-2011. ............................................................................................................................................................ 26
Table 15. Ten-year monthly DO water quality standard exceedances in Rabbit River (09020101-502), 2002-2011. 28
Table 16. Ten-year monthly DO water quality standard exceedances in Rabbit River – South Fork (09020101-512), 2002-2011. .................................................................................................................................................... 32
Table 17. Ten-year geometric mean E. coli (org./100ml) concentrations by month in Bois de Sioux River (09020101-501), 2002-2011. Geometric means that exceed the water quality standard of 126 org./100ml for which there are at least 5 samples are highlighted in bold. ....................................................................................................... 34
Table 18. Ten-year geometric mean E. coli (org./100ml) concentrations by month Rabbit River (09020101-502), 2002-2011. Geometric means that exceed the water quality standard of 126 org./100ml for which there are at least 5 samples are highlighted in bold. ........................................................................................................... 35

Bois de Sioux River Watershed TMDL • DRAFT 2018 Minnesota Pollution Control Agency
Table 19. Ten-year geometric mean E. coli (org./100ml) concentrations by month in Unnamed Creek – Doran Slough (09020101-510), 2002-2011. Geometric means that exceed the water quality standard of 126 org./100ml for which there are at least 5 samples are highlighted in bold. .......................................................................... 38
Table 20. Ten-year total suspended solids water quality exceedances by station in Bois de Sioux River (09020101-501), 2002-2011 (April – September). Stations are listed in order from upstream to downstream. ....................... 39
Table 21. Ten-year total suspended solids water quality exceedances by station in Rabbit River (09020101-502), 2002-2011 (April – September). Stations are listed in order from upstream to downstream. ............................... 41
Table 22. HSPF six-year (2001-2006) average annual flow volumes and TP loads for lake direct drainage areas ..... 44
Table 23. Existing upstream phosphorus loads to impaired lakes and streams .................................................... 44
Table 24. Feedlot assumptions and phosphorus loads to impaired lakes ............................................................ 45
Table 25. SSTS assumptions and phosphorus loads to impaired lakes ................................................................. 46
Table 26. Atmospheric deposition phosphorus loads to impaired lakes (MPCA 2004) .......................................... 47
Table 27. Internal phosphorus load assumptions and summary ......................................................................... 49
Table 28. Bacteria production by source .......................................................................................................... 59
Table 29. WWTF design flows and permitted bacteria loads .............................................................................. 60
Table 30. NPDES permitted CAFO AUs ............................................................................................................. 61
Table 31. Sewered and unsewered population and households by subwatershed ............................................... 62
Table 32. Estimate of percent ITPHSS as reported by each county ..................................................................... 63
Table 33. MPCA registered feedlot animals by subwatershed, verified by each county ........................................ 64
Table 34. Wildlife population estimates by subwatershed ................................................................................. 65
Table 35. Population Estimate Data Sources and Habitat Assumptions for Wildlife ............................................. 65
Table 36. Annual E. coli production estimates by producer................................................................................ 67
Table 37. Total annual E. coli production estimates .......................................................................................... 67
Table 38. BATHTUB segment input data for impaired lakes ............................................................................... 69
Table 39. Model calibration summary for the impaired lakes ............................................................................ 70
Table 40. Average Annual NPDES/SDS Construction Stormwater Permit Activity by County (1/1/2007-10/6/2012) 72
Table 41. NPDES permitted feedlot operation number of animals ..................................................................... 73
Table 42. WWTF design flows, daily TP effluent concentration assumptions and WLAs within the BdSRW ............ 74
Table 43. WWTF design flows and annual TP load assumptions within the Mustinka River Watershed ................. 74
Table 44. Ash Lake TP TMDL and Allocations .................................................................................................... 76
Table 45. Upper Lightning Lake TP TMDL and Allocations .................................................................................. 77
Table 46. Bois de Sioux River (09020101-501) TP TMDL and Allocations ............................................................. 79
Table 47. Mud Lake Suggested Goals and Reductions by Pollutant Source .......................................................... 80
Table 48. Lake Traverse Suggested Goals and Reductions by Pollutant Source .................................................... 81
Table 49. Rabbit River (09020101-502) TP TMDL and Allocations ....................................................................... 83
Table 50. Rabbit River – South Fork (09020101-512) TP TMDL and Allocations ................................................... 85

Bois de Sioux River Watershed TMDL • DRAFT 2018 Minnesota Pollution Control Agency
Table 51. Average Annual NPDES/SDS Construction Stormwater Permit Activity by County (1/1/2007-10/6/2012) 87
Table 52. NPDES permitted feedlot operations in a TSS impaired stream reach subwatershed ............................. 87
Table 53. WWTF design flows and permitted TSS loads ..................................................................................... 88
Table 54. Bois de Sioux River (09020101-501) TSS TMDL and Allocations ........................................................... 90
Table 55. Rabbit River (09020101-502) TSS TMDL and Allocations ..................................................................... 92
Table 56. Rabbit River – South Fork (09020101-512) TSS TMDL and Allocations .................................................. 94
Table 57. NPDES permitted feedlot operation number of animals ..................................................................... 96
Table 58. WWTF design flows and permitted bacteria loads .............................................................................. 97
Table 59. Bois de Sioux River (09020101-501) E. coli TMDL and allocations ........................................................ 99
Table 60. Rabbit River (09020101-502) E. coli TMDL and allocations ................................................................ 101
Table 61. Doran Slough (09020101-510) E. coli TMDL and allocations .............................................................. 103
Table 62. Bois de Sioux River Watershed aquatic life use impairments not addressed by TMDLs ........................ 104
Table 63. Bois de Sioux River Watershed TMDL Technical Committee Meetings ............................................... 115
Table 64. Bois de Sioux River Watershed TMDL Civic Engagement Meetings..................................................... 115
Table 65. Ash Lake Calibrated Model Predicted & Observed Values ................................................................. 117
Table 66. Ash Lake Calibrated Model Water and Phosphorus Balances............................................................. 117
Table 67. Ash Lake TMDL Goal Scenario Model Predicted & Observed Values ................................................... 118
Table 68. Ash Lake TMDL Goal Scenario Model Water and Phosphorus Balances .............................................. 118
Table 69. Mud Lake Calibrated Model Predicted & Observed Values ................................................................ 119
Table 70. Mud Lake Calibrated Model Water and Phosphorus Balances ........................................................... 119
Table 71. Mud Lake Suggested Goal Scenario Model Predicted & Observed Values ........................................... 120
Table 72. Mud Lake Suggested Goal Scenario Model Water and Phosphorus Balances ...................................... 120
Table 73. Lake Traverse Calibrated Model Predicted & Observed Values .......................................................... 121
Table 74. Lake Traverse Calibrated Model Water and Phosphorus Balances ..................................................... 121
Table 75. Lake Traverse Suggested Goal Scenario Model Predicted & Observed Values ..................................... 122
Table 76. Lake Traverse Suggested Goal Scenario Model Water and Phosphorus Balances ................................ 122
Table 77. Upper Lightning Lake Calibrated Model Predicted & Observed Values ............................................... 123
Table 78. Upper Lightning Lake Calibrated Model Water and Phosphorus Balances .......................................... 123
Table 79. Upper Lightning Lake TMDL Goal Scenario Model Predicted & Observed Values................................. 124
Table 80. Upper Lightning Lake TMDL Goal Scenario Model Water and Phosphorus Balances ............................ 124
Table 81. Vegetation summary for Ash Lake (DNR) ......................................................................................... 126
Table 82. Vegetation summary for Upper Lightning Lake (DNR) ....................................................................... 133
List of Figures Figure 1. Impaired lakes and streams in the Bois de Sioux River Watershed .......................................................... 2

Bois de Sioux River Watershed TMDL • DRAFT 2018 Minnesota Pollution Control Agency
Figure 2. Impaired lake and stream drainage areas ........................................................................................... 15
Figure 3. Bois de Sioux River Watershed Land Cover (NLCD 2011) ...................................................................... 17
Figure 4. Alternative Stable States in Shallow Lakes .......................................................................................... 20
Figure 5. Monitoring stations on impaired reaches in the Bois de Sioux River Watershed .................................... 21
Figure 6. Ten-year growing season average total phosphorus (mg/l) by monitoring station in Bois de Sioux River (09020101-501), 2002-2011. Monitoring stations are shown in order from upstream to downstream. The dashed line represents the TP eutrophication standard for Southern Region Streams (0.15 mg/L). .................................. 22
Figure 7. Total phosphorus (mg/l) by month in Bois de Sioux River (09020101-501) at monitoring station S000-553, 2002-2011. The dashed line represents the TP eutrophication standard for Southern Region Streams (0.15 mg/L). .................................................................................................................................................................... 23
Figure 8. Total phosphorus (mg/l) by month in Bois de Sioux River (09020101-501) at monitoring station S000-089, 2002-2011. The dashed line represents the TP eutrophication standard for Southern Region Streams (0.15 mg/L). .................................................................................................................................................................... 23
Figure 9. Ten-year growing season average total phosphorus (mg/l) by monitoring station in Rabbit River (09020101-502), 2002-2011. Monitoring stations are shown in order from upstream to downstream. The dashed line represents the TP eutrophication standard for Southern Region Streams (0.15 mg/L). .................................. 24
Figure 10. Total phosphorus (mg/l) by month in Rabbit River (09020101-502) at monitoring station S001-053, 2002-2011. The dashed line represents the TP eutrophication standard for Southern Region Streams (0.15 mg/L). ....... 25
Figure 11. Total phosphorus (mg/l) by month in Rabbit River (09020101-502) at monitoring station S002-002, 2002-2011. The dashed line represents the TP eutrophication standard for Southern Region Streams (0.15 mg/L). ....... 25
Figure 12. Total phosphorus (mg/l) by month in Rabbit River (09020101-502) at monitoring station S001-029, 2002-2011. The dashed line represents the TP eutrophication standard for Southern Region Streams (0.15 mg/L). ....... 26
Figure 13. Dissolved oxygen (mg/L) by month in Bois de Sioux River (09020101-501) at monitoring station S000-553, 2002-2011. The dashed line represents the DO standard for warm-water streams. ..................................... 27
Figure 14. Dissolved oxygen (mg/L) by month in Bois de Sioux River (09020101-501) at monitoring station S000-089, 2002-2011. The dashed line represents the DO standard for warm-water streams. ..................................... 28
Figure 15. Dissolved oxygen (mg/L) by month in Rabbit River (09020101-502) at monitoring station S001-053, 2002-2011. The dashed line represents the DO standard for warm-water streams. ............................................ 30
Figure 16. Dissolved oxygen (mg/L) by month in Rabbit River (09020101-502) at monitoring station S002-002, 2002-2011. The dashed line represents the DO standard for warm-water streams. ............................................ 31
Figure 17. Dissolved oxygen (mg/L) by month in Rabbit River (09020101-502) at monitoring station S001-029, 2002-2011. The dashed line represents the DO standard for warm-water streams. ............................................ 31
Figure 18. Dissolved oxygen (mg/L) by month in Rabbit River (09020101-502) at monitoring station S001-051, 2002-2011. The dashed line represents the DO standard for warm-water streams. ............................................ 32
Figure 19. Dissolved oxygen (mg/L) by month in Rabbit River – South Fork (09020101-512) at monitoring station S006-853, 2002-2011. The dashed line represents the DO standard for warm-water streams. ............................. 33
Figure 20. Dissolved oxygen (mg/L) by month in Rabbit River – South Fork (09020101-512) at monitoring station S004-176, 2002-2011. The dashed line represents the DO standard for warm-water streams. ............................. 33
Figure 21. E. coli (org./100mL) by month in Bois de Sioux River (09020102-501) at monitoring station S000-553, 2002-2011. The dashed line represents the stream water quality standard (126 org./100mL) .............................. 34
Figure 22. E. coli (org./100mL) by month in Bois de Sioux River (09020102-501) at monitoring station S000-089, 2002-2011. The dashed line represents the stream water quality standard (126 org./100mL) .............................. 35

Bois de Sioux River Watershed TMDL • DRAFT 2018 Minnesota Pollution Control Agency
Figure 23. E. coli (org./100mL) by month in Rabbit River (09020102-502) at monitoring station S001-053, 2002-2011. The dashed line represents the stream water quality standard (126 org./100mL) ...................................... 36
Figure 24. E. coli (org./100mL) by month in Rabbit River (09020102-502) at monitoring station S002-002, 2002-2011. The dashed line represents the stream water quality standard (126 org./100mL) ...................................... 37
Figure 25. E. coli (org./100mL) by month in Rabbit River (09020102-502) at monitoring station S001-029, 2002-2011. The dashed line represents the stream water quality standard (126 org./100mL) ...................................... 37
Figure 26. E. coli (org./100mL) by month in Unnamed Creek – Doran Slough (09020102-510) at monitoring station S005-145, 2002-2011. The dashed line represents the stream water quality standard (126 org./100mL) .............. 38
Figure 27. E. coli (org./100mL) by month in Unnamed Creek – Doran Slough (09020102-510) at monitoring station S005-144, 2002-2011. The dashed line represents the stream water quality standard (126 org./100mL) .............. 39
Figure 28. Total suspended solids (mg/L) by month in Bois de Sioux River (09020101-501) at monitoring station S000-553, 2002-2011. The dashed red line represents the TSS water quality standard for Southern Region Streams (65 mg/L). ..................................................................................................................................................... 40
Figure 29. Total suspended solids (mg/L) by month in Bois de Sioux River (09020101-501) at monitoring station S000-089, 2002-2011. The dashed red line represents the TSS water quality standard for Southern Region Streams (65 mg/L). ..................................................................................................................................................... 40
Figure 30. Total suspended solids (mg/L) by month in Rabbit River (09020101-502) at monitoring station S001-053, 2002-2011. The dashed red line represents the TSS water quality standard for Southern Region Streams (65 mg/L). .................................................................................................................................................................... 41
Figure 31. Total suspended solids (mg/L) by month in Rabbit River (09020101-502) at monitoring station S002-002, 2002-2011. The dashed red line represents the TSS water quality standard for Southern Region Streams (65 mg/L). .................................................................................................................................................................... 42
Figure 32. Total suspended solids (mg/L) by month in Rabbit River (09020101-502) at monitoring station S001-029, 2002-2011. The dashed red line represents the TSS water quality standard for Southern Region Streams (65 mg/L). .................................................................................................................................................................... 42
Figure 33. Topography of the Bois de Sioux River Watershed ............................................................................ 52
Figure 34. Crop covers in the Bois de Sioux River Watershed (2006 NASS) .......................................................... 53
Figure 35. Hydrologic soil group distribution in the Bois de Sioux River Watershed ............................................. 54
Figure 36. HSPF 2001-2006 average annual precipitation by subbasin ................................................................ 55
Figure 37. HSPF 2001-2006 average annual runoff flow yields by subbasin ......................................................... 56
Figure 38. HSPF 2001-2006 average annual total phosphorus yields by subbasin ................................................ 57
Figure 39. HSPF 2001-2006 average annual total phosphorus yields by subbasin ................................................ 58
Figure 40. Bois de Sioux River (09020101-501) TP Load Duration Curve ............................................................. 78
Figure 41. Rabbit River (09020101-502) TP Load Duration Curve ....................................................................... 82
Figure 42. Rabbit River – South Fork (09020101-512) TP Load Duration Curve .................................................... 84
Figure 43. Bois de Sioux River (09020101-501) TSS Load Duration Curve ............................................................ 89
Figure 44. Rabbit River (09020101-502) TSS Load Duration Curve ...................................................................... 91
Figure 45. Rabbit River – South Fork (09020101-512) TSS Load Duration Curve................................................... 93
Figure 46. Bois de Sioux River (09020101-501) E. coli Load Duration Curve ......................................................... 98
Figure 47. Rabbit River (09020101-502) E. coli Load Duration Curve ................................................................ 100

Bois de Sioux River Watershed TMDL • DRAFT 2018 Minnesota Pollution Control Agency
Figure 48. Doran Slough (09020101-510) E. coli Load Duration Curve............................................................... 102
Figure 49. Adaptive Management ................................................................................................................. 114
Figure 50. Growing Season Means ± SE of Total Phosphorus for Ash Lake by Year ............................................. 126
Figure 51. Growing Season Means ± SE of Chlorophyll-a for Ash Lake by Year ................................................... 127
Figure 52. Growing Season Means ± SE of Secchi transparency for Ash Lake by Year ......................................... 127
Figure 53. Growing Season Means ± SE of Total Phosphorus for Mud Lake by Year ........................................... 128
Figure 54. Growing Season Means ± SE of Chlorophyll-a for Mud Lake by Year ................................................. 129
Figure 55. Growing Season Means ± SE of Secchi transparency for Mud Lake by Year........................................ 129
Figure 56. Growing Season Means ± SE of Total Phosphorus for Lake Traverse by Year ..................................... 131
Figure 57. Growing Season Means ± SE of Chlorophyll-a for Lake Traverse by Year ........................................... 131
Figure 58. Growing Season Means ± SE of Secchi transparency for Lake Traverse by Year .................................. 132
Figure 59. Growing Season Means ± SE of Total Phosphorus for Upper Lightning Lake by Year ........................... 134
Figure 60. Growing Season Means ± SE of Chlorophyll-a for Upper Lightning Lake by Year ................................. 134
Figure 61. Growing Season Means ± SE of Secchi transparency for Lake Traverse by Year .................................. 135

Bois de Sioux River Watershed TMDL • DRAFT 2018 Minnesota Pollution Control Agency
i
Acronyms ac-ft/yr acre feet per year
AF Anoxic factor
AFO Animal Feeding Operation
AUID Assessment Unit ID
BD-P Bicarbonate Dithionite extractable Phosphorus
BMP Best Management Practice
CAFO Concentrated Animal Feeding Operation
cfu colony-forming unit
Chl-a Chlorophyll-a
CRP Conservation Reserve Program
DNR Minnesota Department of Natural Resources
DO Dissolved Oxygen
E. coli Escherichia coli
EPA United States Environmental Protection Agency
EQIP Environmental Quality Incentives Program
EQuIS Environmental Quality Information System
GIS Geographic Information Systems
HUC Hydrologic Unit Code
IBI Index of Biological Integrity
ITPHS Imminent Threat to Public Health and Safety
km2 square kilometer
LA Load Allocation
Lb pound
lb/yr pounds per year
LGU Local Government Unit
m meter
mg/L milligrams per liter
mg/m2-day milligram per square meter per day
ml milliliter
MOS Margin of Safety
MPCA Minnesota Pollution Control Agency
MS4 Municipal Separate Storm Sewer Systems
NA North American

Bois de Sioux River Watershed TMDL • DRAFT 2018 Minnesota Pollution Control Agency
ii
NASS National Agricultural Statistics Service
NLCD National Land Cover Dataset
NPDES National Pollutant Discharge Elimination System
org. organisms
P Phosphorus
RNR River Nutrient Region
SDS State Disposal System
SSTS Subsurface Sewage Treatment Systems
SWCD Soil and Water Conservation District
T Temperature
TMDL Total Maximum Daily Load
TP Total phosphorus
USDA United States Department of Agriculture
USGS United States Geological Survey
UV Ultra Violet
WLA Wasteload Allocation
WRAPS Watershed Restoration and Protection Strategies
WWTF Wastewater Treatment Facility
WWTP Wastewater Treatment Plant

Bois de Sioux River Watershed TMDL • DRAFT 2018 Minnesota Pollution Control Agency
iii
Executive Summary The Clean Water Act of 1972 (CWA) requires that each state identify and conduct a Total Maximum Daily Load (TMDL) study on their impaired waters. A TMDL identifies the pollutant that is causing the impairment, and how much of that pollutant can enter the waterbody and still allow it to meet water quality standards.
This TMDL study addresses phosphorus (P), total suspended solids (TSS), and bacteria (in the form of Escherichia coli [E. coli]) impairments in two lakes and four streams located in the Bois de Sioux River Watershed (BdSRW), Hydrologic Unit Code (HUC), 09020101, as identified in the 2014 EPA CWA Section 303(d) list of impaired waters. The BdSRW is a tributary to the Red River of the North, in west-central Minnesota.
Information from multiple sources was used to evaluate the ecological health of each waterbody, including:
· All available water quality data from the TMDL study 10-year time period (2002 through 2011) · BdSRW Hydrologic Simulation Program – FORTRAN (HSPF) model · Sediment phosphorus concentrations · Fisheries surveys · Aquatic plant surveys · Stream geomorphology and field surveys · Stressor identification (SID) investigations · Stakeholder input
The following pollutant sources were evaluated for each lake or stream: watershed runoff, loading from upstream waterbodies, atmospheric deposition, lake internal loading, point sources, feedlots, septic systems, and in-stream alterations. This TMDL study used an inventory of pollutant sources to develop a lake response model for each impaired lake and a load duration curve (LDC) model for each impaired stream. These models were then used to determine the pollutant reductions needed for the impaired waterbodies to meet water quality standards. The BdSRW HSPF model included the entire drainage area within Minnesota, North Dakota, and South Dakota; however, point source wasteload allocations (WLAs) were determined for Minnesota sources only. Point sources in North Dakota and South Dakota will be assigned WLAs as part of their states’ TMDL and National Pollutant Discharge Elimination System (NPDES) programs.
The TMDL study’s results will aid in the selection of implementation activities during the Bois de Sioux Watershed Restoration and Protection Strategy (WRAPS) process. The purpose of the WRAPS process is to support local working groups in developing scientifically supported restoration and protection strategies for subsequent implementation planning. Following completion of the WRAPS process, the Bois de Sioux River WRAPS Report will be publically available on the MPCA BdSRW website: https://www.pca.state.mn.us/water/watersheds/bois-de-sioux-river.
Additional supporting information and reports can be found on the Bois de Sioux Watershed District’s Health of the Valley website: http://www.healthofthevalley.com/bois-de-sioux-wraps.

Bois de Sioux River Watershed TMDL • DRAFT 2018 Minnesota Pollution Control Agency
1
1 Project Overview
Purpose The state of Minnesota has determined that some lakes and streams in the BdSRW exceed established state water quality standards and have impaired designated beneficial uses. In accordance with the CWA, the state must conduct TMDL studies on the impaired waters. The goals of this TMDL study are to provide WLAs for regulated pollutant sources and load allocations (LA) for unregulated pollutant sources within the BdSRW, and to quantify the pollutant reductions needed to meet Minnesota water quality standards. Pollutant sources within North and South Dakota will be addressed through the North Dakota and South Dakota TMDL studies and NPDES programs. This TMDL study addresses the following impairments within the BdSRW (HUC 09020101) (Figure 1) that are included on the Minnesota 2014 303(d) list:
· aquatic recreation use impairments due to eutrophication (total phosphorus [TP]) in two lakes,
· aquatic recreation use impairments due to E. coli in three stream reaches, and
· aquatic life use impairments due to turbidity (TSS), fish/macroinvertebrate bioassessments, and/or dissolved oxygen (DO) in three stream reaches.
Other BdSRW studies referenced in the development of this TMDL study include:
· Bois de Sioux River SID Study (MPCA 2016)
· Bois de Sioux River Monitoring and Assessment Report (MPCA 2013)
· Rabbit River Turbidity TMDL Study (MPCA 2010)
This TMDL study’s results will aid in the selection of implementation activities during the BdSRW WRAPS process. The purpose of the WRAPS process is to support local working groups in developing scientifically-supported restoration and protection strategies for subsequent implementation planning. Following completion of the WRAPS process, the Bois de Sioux River WRAPS Report will be publically available on the MPCA’s BdSRW website: https://www.pca.state.mn.us/water/watersheds/bois-de-sioux-river
Additional supporting information and reports can be found on the Bois de Sioux Watershed District’s Health of the Valley website: http://www.healthofthevalley.com/bois-de-sioux-wraps.

Bois de Sioux River Watershed TMDL • DRAFT 2018 Minnesota Pollution Control Agency
2
Figure 1. Impaired lakes and streams in the Bois de Sioux River Watershed

Bois de Sioux River Watershed TMDL • DRAFT 2018 Minnesota Pollution Control Agency
3
Identification of Waterbodies Table 1. Bois de Sioux River Watershed Impaired Streams and Lakes
Affected Use: Pollutant/Stressor AUID/ Lake ID Name Location/Reach Description
Designated Use Class
Listing Year
Target Start/ Completion
Impairment addressed by:
Aquatic Recreation: Nutrient/ Eutrophication Biological Indicators (Phosphorus)
26-0294-00 Ash 3 mi. NW of Wendell 2B, 3C 2014 2012/2016 TP TMDL
78-0024-00 Mud 3 mi W of Wheaton 2B, 3C 2014 2012/2016 Deferred until next cycle*
56-0957-00 Upper Lightning Near Western 2B, 3C 2014 2012/2016 TP TMDL
Aquatic Recreation:
E. coli
09020101-501 Bois de Sioux River Rabbit R to Otter Tail R 2C 2014 2012/2016 E. coli TMDL
09020101-502 Rabbit River Wilkin County line to Bois de Sioux R 2C 2010 2012/2016 E. coli TMDL
09020101-510 Unnamed Creek (Doran Slough) Headwaters to Bois de Sioux R 2C 2014 2012/2016 E. coli TMDL
Aquatic Life: Dissolved oxygen
09020101-501 Bois de Sioux River Rabbit R to Otter Tail R 2C 1998 2014/2018 TP & TSS TMDL
09020101-502 Rabbit River Wilkin County line to Bois de Sioux R 2C 2004 2012/2016 TP & TSS
TMDL
09020101-510 Unnamed Creek (Doran Slough) Headwaters to Bois de Sioux R 2C 2014 2012/2016
Non-pollutant based
stressors
09020101-512 Rabbit River, South Fork Wilkin County line to Rabbit R 2C 2014 2012/2016 TP & TSS
TMDL
09020101-515 Unnamed Creek Unnamed Cr to Rabbit R 2B, 2C 2014 2012/2016 Deferred until next cycle**
Aquatic Life: Macroinvertebrate Bioassessments
09020101-502 Rabbit River Wilkin County line to Bois de Sioux R 2C 2014 2012/2016 TP & TSS
TMDL

Bois de Sioux River Watershed TMDL • DRAFT 2018 Minnesota Pollution Control Agency
4
Affected Use: Pollutant/Stressor AUID/ Lake ID Name Location/Reach Description
Designated Use Class
Listing Year
Target Start/ Completion
Impairment addressed by:
Aquatic Life: Fish Bioassessments
09020101-501 Bois de Sioux R Rabbit R to Otter Tail R 2C 2002 2012/2016 TP & TSS TMDL
09020101-502 Rabbit River Wilkin County line to Bois de Sioux R 2C 2002 2012/2016 TP & TSS
TMDL
09020101-512 Rabbit River, South Fork Wilkin County line to Rabbit R 2C 2014 2012/2016 TP & TSS
TMDL
09020101-535 Unnamed Creek Unnamed Cr to Lk Traverse 2B, 3C 2014 2012/2016 Non-pollutant
based stressors
09020101-540 County Ditch 52 Unnamed Cr to Unnamed Cr 2B, 3C 2014 2012/2016 Non-pollutant
based stressors
Aquatic Life: Turbidity
09020101-501 Bois de Sioux River Rabbit R to Otter Tail R 2C 2008 2012/2016 TSS TMDL
09020101-502 Rabbit River Wilkin County line to Bois de Sioux R 2C 1996 2010*** TSS TMDL
09020101-512 Rabbit River, South Fork Wilkin County line to Rabbit R 2C 2014 2012/2016 TSS TMDL
09020101-515 Unnamed Creek Unnamed Cr to Rabbit R 2B, 2C 2014 2012/2016 Deferred until next cycle**
* Additional monitoring and modeling is needed to complete a well-calibrated lake water quality response model for Mud Lake Reservoir. This lake will be reassessed in the next 10-year monitoring and assessment cycle (2020). ** Little to no monitoring data has been collected from this reach during the 2002-2011 time period. Very low to stagnant flow conditions were observed during all visits by MPCA monitoring staff in 2013-2015, resulting in unsuitable conditions for monitoring. MPCA will collect more data from this reach and reassess these impairments during the next 10-year monitoring and assessment cycle (2020). *** A Turbidity TMDL was completed for the Rabbit River in 2010. However, a TSS TMDL was completed for this impaired reach based on the new Minnesota stream TSS standard as part of this TMDL study, but consistent with the assumptions from the 2010 Turbidity TMDL.

Bois de Sioux River Watershed TMDL • DRAFT 2018 Minnesota Pollution Control Agency
5
Priority Ranking The MPCA’s projected schedule for TMDL study completions, as indicated on the 303(d) impaired waters list, implicitly reflects Minnesota’s priority ranking of this TMDL study (see Table 1). Minnesota continues to conduct TMDL studies on the major watershed scale on a 10-year cycle to address TMDLs more efficiently and effectively. The schedule of the 10- year watershed monitoring cycle drives the sequencing of TMDL completions.
Description of the Impairments and Stressors The following section identifies and describes the causes of lake and stream impairments in the BdSRW and the pollutant-based stressors that will be addressed by TMDLs in this study. Table 2 summarizes the TMDLs that will be completed for each impaired stream reach, listed by its Assessment Unit Identification (AUID) number.
Table 2. Pollutants addressed by TMDL for impaired streams
AUID Impairment Designated Use Class E. coli TP TSS
-501
Bacteria
Dissolved oxygen
Fish bioassessments
Turbidity
2C ● ● ●
-502
Bacteria
Dissolved oxygen
Fish & macroinvertebrate bioassessments
Turbidity
2C ● ● ●
-510 Bacteria 2C ●
-512
Dissolved oxygen
Fish bioassessments
Turbidity
2C ● ●
Lake Eutrophication The lake eutrophication impairments in the BdSRW were characterized by P and the response variables of chlorophyll-a (Chl-a) concentrations and Secchi transparency depths that failed to meet the state water quality standards. Excessive nutrient loads, in particular TP, lead to an increase in algal blooms and reduced transparency – both of which may significantly impair or prohibit the use of lakes for aquatic recreation. This TMDL study developed P lake response models and calculated TMDLs for all lake eutrophication impairments.

Bois de Sioux River Watershed TMDL • DRAFT 2018 Minnesota Pollution Control Agency
6
Stream E. coli
The stream bacteria impairments in the BdSRW were characterized by high E. coli concentrations during June through September. Minnesota E. coli water quality standards were developed to directly protect for primary (swimming and other recreation where immersion and inadvertently ingesting water is likely) and secondary (boating and wading where the likelihood of ingesting water is much less) body contact during the warm season months, as there is very little swimming in Minnesota during the cold season months. This TMDL study developed E. coli LDCs and TMDLs for all stream E. coli impairments.
Stream Turbidity
The stream aquatic life impairments due to turbidity in the BdSRW were characterized by high turbidity levels. Turbidity is a physical characteristic of water that describes the degree to which light is scattered and absorbed in the water column (therefore reducing water clarity). Turbidity is caused by suspended sediment or impurities, such as clay, silt, fine organic matter, algae, and other organic and inorganic sources. Because turbidity is a physical characteristic of water and not a pollutant, this TMDL study developed LDCs and TMDLs for TSS, a measure of suspended sediment and the primary cause of turbidity in the BdSRW.
Stream Fish and Macroinvertebrate Bioassessments
The fish and/or macroinvertebrate bioassessment impairments in the BdSRW were characterized by low Index of Biological Integrity (IBI) scores for fish and/or macroinvertebrates. The presence of a healthy, diverse, and reproducing aquatic community is a good indication that the aquatic life beneficial use is being supported by a lake, stream, or wetland. The aquatic community integrates the cumulative impacts of pollutants, habitat alteration, and hydrologic modification on a waterbody over time. Characterization of an aquatic community is accomplished using IBI, which incorporates multiple attributes of the aquatic community, called “metrics”, to evaluate complex biological systems. For further information regarding the development of stream IBIs, refer to the MPCA Guidance Manual for Assessing the Quality of Minnesota Surface Waters for the Determination of Impairment: 305(b) Report and 303(d) List.
In 2016, the MPCA completed a SID study to determine the cause of low fish and macroinvertebrate IBI scores in the BdSRW. The SID study results are summarized in Table 3. This TMDL study developed LDCs and TMDLs for the pollutant-based stressors (TP and TSS) identified as needing TMDLs through the SID process (Table 3).
The TMDL computations were completed for the mass pollutant based stressors of TSS and TP. In the case of many stressors, a mass reduction is not the appropriate means of addressing these issues, thus no TMDL is computed (i.e., habitat stressors). Non-pollutant stressors will be addressed through the WRAPS process.

Bois de Sioux River Watershed TMDL • DRAFT 2018 Minnesota Pollution Control Agency
7
Table 3. Summary of stressors causing biological impairment in BdSRW streams by location (AUID)
Stream
AUID Last 3 digits
Biological Impairment
Stressor
Diss
olve
d O
xyge
n
Phos
phor
us
Sedi
men
t/
Turb
idity
Conn
ectiv
ity
Alte
red
Hydr
olog
y*
Chan
nel
Alte
ratio
n
Pest
icid
es
Bois de Sioux R. -501 Fish • ¨,+ • ¨ ◊ ?
Rabbit River -502 Fish and Macroinvertebrates • ¨,+ • ¨ • ?
South Fork Rabbit River -512 Fish • ¨,+ • ◦ ¨ ?
Unnamed Trib. to Lk. Traverse -535 Fish ¨ ¨ ?
Judicial Ditch 52 -540 Fish • ¨ ¨ ? * Includes intermittency and/or geomorphology/physical channel issues ¨ A “root cause” stressor, which causes other consequences that become the direct stressors. ◊ Possible contributing root cause. • Determined to be a direct stressor. o A stressor, but anthropogenic contribution, if any, not quantified. Includes beaver dams as a natural stressor. + Based on river nutrient concentration threshold, but not officially assessed and listed for this parameter. ? Inconclusive - not enough is known to make a conclusion either way. See reports on pesticide monitoring in Minnesota
conducted by the Minnesota Department of Agriculture.
Stream Dissolved Oxygen Aquatic life impairments in the Bois de Sioux River (AUID 09020101-501), Rabbit River (AUID 09020101-502), and Rabbit River- South Fork (AUID 09020101-512) were characterized by low DO levels. In 2016, the MPCA completed a SID study to determine the cause of low fish and macroinvertebrate IBI scores in the BdSRW. As part of this study, the cause of low DO levels in each impaired reach was also identified. In all cases, excess TP was identified as the primary stressor causing low DO. Excess TP in the stream increases algae and other plant growth. When algae and plant growth reach very high levels, the decomposition of and respiration from algae and aquatic plants can consume large amounts of DO resulting in stream DO levels that are too low to support fish.

Bois de Sioux River Watershed TMDL • DRAFT 2018 Minnesota Pollution Control Agency
8
2 Applicable Water Quality Standards and Numeric Water Quality Targets
All waterbodies have a Designated Use Classification, defined by the MPCA, which defines the optimal purpose for that waterbody (see Table 1). The lakes and streams addressed by this TMDL study fall into one of the following two designated use classifications:
2B, 3C – a healthy warm water aquatic community; industrial cooling and materials transport without a high level of treatment
2C – a healthy indigenous fish community
Class 2 waters are protected for aquatic life and aquatic recreation, and Class 3 waters are protected for industrial consumption as defined by Minn. R. ch. 7050.0140. The most protective of these classes is 2B, for which water quality standards are provided below.
The Minnesota narrative water quality standard for all Class 2 waters (Minn. R. 7050.0150, subp. 3) states, “For all Class 2 waters, the aquatic habitat, which includes the waters of the state and stream bed, shall not be degraded in any material manner, there shall be no material increase in undesirable slime growths or aquatic plants, including algae, nor shall there be any significant increase in harmful pesticide or other residues in the waters, sediments, and aquatic flora and fauna; the normal fishery and lower aquatic biota upon which it is dependent and the use thereof shall not be seriously impaired or endangered, the species composition shall not be altered materially, and the propagation or migration of the fish and other biota normally present shall not be prevented or hindered by the discharge of any sewage, industrial waste, or other wastes to the waters”.
Lakes
Lake Eutrophication
Total phosphorus is often the limiting factor controlling primary production in freshwater lakes; as in-lake P concentrations increase, algal growth increases resulting in higher Chl-a concentrations and lower water transparency. In addition to meeting P limits, lakes must also meet Chl-a concentrations and Secchi transparency depth standards. In developing the lake nutrient standards for Minnesota lakes (Minn. R. Ch. 7050), the MPCA evaluated data from a large cross-section of lakes within each of the state’s ecoregions (Heiskary and Wilson 2005). Clear relationships were established between the causal factor (TP) and the response variables (Chl-a and Secchi transparency). Based on these relationships, it is expected that by meeting the P target in each lake, the Chl-a and Secchi standards will, likewise, be met.
The impaired lakes within the BdSRW were assessed against the Northern Glaciated Plains Ecoregion water quality standards (Table 4). A separate water quality standard was developed for shallow lakes, which tend to have poorer water quality than deeper lakes in this ecoregion. According to the MPCA definition of shallow lakes, a lake is considered shallow if its maximum depth is less than 15 feet, or if

Bois de Sioux River Watershed TMDL • DRAFT 2018 Minnesota Pollution Control Agency
9
the littoral zone (area where depth is less than 15 feet) covers at least 80%of the lake’s surface area. All of the impaired lakes in the BdSRW are shallow by this definition.
To be listed as impaired (Minn. R. 7050.0150, subp 5), the summer growing season (June through September) monitoring data must show that the standards for both TP (the causal factor) and either Chl-a or Secchi transparency (the response variables) were exceeded. If a lake is impaired with respect to only one of these criteria, it may be placed on a review list; a weight of evidence approach is then used to determine if it will be listed as impaired. For more details regarding the listing process, see the Guidance Manual for Assessing the Quality of Minnesota Surface Waters for Determination of Impairment: 303(b) Report and 303(d) List (MPCA 2012).
Table 4. Lake Eutrophication Standards
Ecoregion TP (µg/L) Chl-a (µg/L) Secchi (m)
Northern Glaciated Plains: Shallow Lakes < 90 < 30 > 0.7
Streams
Bacteria The state of Minnesota has developed numeric water quality standards for bacteria (Minn. R. 7050.0222), specifically E. coli, which are protective concentrations for short- and long-term exposure to pathogens in water. The past fecal coliform and current E. coli numeric water quality standards for Class 2 waters are shown in Table 5. E. coli and fecal coliform are fecal bacteria used as indicators for waterborne pathogens that have the potential to cause human illness. Although most are harmless themselves, fecal indicator bacteria are used as an easy-to-measure surrogate to evaluate the suitability of recreational and drinking waters, specifically, the presence of pathogens and probability of illness. Pathogenic bacteria, viruses, and protozoa pose a health risk to humans, potentially causing illnesses with gastrointestinal symptoms (nausea, vomiting, fever, headache, and diarrhea), skin irritations, or other symptoms. Pathogen types and quantities vary among fecal sources; therefore, human health risk varies based on the source of fecal contamination.
This TMDL study will use the Minnesota standard for E. coli. The change in the water quality standard from fecal coliform to E. coli is supported by a United State Environmental Protection Agency (EPA) guidance document on bacteriological criteria (EPA 1986). As of March 17, 2008, Minn. R. ch. 7050 water quality standards for E. coli are:
Escherichia (E.) coli - Not to exceed 126 organisms per 100 milliliters as a geometric mean of not less than five samples representative of conditions within any calendar month, nor shall more than ten percent of all samples taken during any calendar month individually exceed 1,260 organisms per 100 milliliters. The standard applies only between April 1 and October 31.
Although surface water quality standards are now based on E. coli, wastewater treatment facilities (WWTFs) are permitted based on fecal coliform (not E. coli) concentrations.

Bois de Sioux River Watershed TMDL • DRAFT 2018 Minnesota Pollution Control Agency
10
Geometric mean is used in place of arithmetic mean in order to measure the central tendency of the data, dampening the effect that very high or very low values have on arithmetic means. The MPCA’s Guidance Manual for Assessing the Quality of Minnesota Surface Waters for Determination of Impairment: 305(b) Report and 303(d) List provides details regarding how waters are assessed for conformance to the E. coli standard (MPCA 2012).
Table 5. Past and current numeric water quality standards of bacteria (fecal coliform and E. coli) for the beneficial use of aquatic recreation (primary and secondary body contact)
Past Standard Units Current Standard Units Notes
Fecal coliform 200 organisms per 100 ml E. coli 126 organisms
per 100 ml Geometric mean of >5 samples per month (April - October)
Fecal coliform 2,000 organisms per 100 ml
E. coli 1,260 organisms per 100 ml
<10% of all samples per month (April - October) that individually exceed
Turbidity Turbidity is a measure of reduced transparency due to suspended particles such as sediment, algae, and organic matter. The Minnesota turbidity standard was 10 Nephelometric Turbidity Units (NTU) for class 2A waters and 25 NTU for class 2B waters. The state of Minnesota has amended state water quality standards and replaced stream water quality standards for turbidity with standards for TSS. One component of the rationale for this change is that the turbidity unit (NTUs) is not concentration-based and therefore not well-suited to load-based studies (Markus, 2011; http://www.pca.state.mn.us/index.php/view-document.html?gid=14922)
The new TSS criteria are stratified by geographic region and stream class due to differences in natural background conditions resulting from the varied geology of the state and biological sensitivity. The assessment window for these samples is April through September, so any TSS data collected outside of this period will not be considered for assessment purposes. The TSS standard for streams in the South River Nutrient Region (RNR) is 65 milligrams per liter (mg/L). For assessment, this concentration is not to be exceeded in more than 10% of samples within a 10-year data window. TSS results are available for the watershed from state-certified laboratories, and the existing data covers a much larger spatial and temporal scale in the watershed. TSS LDCs and TMDLs were developed for all stream turbidity impairments.
Table 6. Total suspended solids standard by stream class
River Nutrient Region Total Suspended Solids (mg/L)
South 65
For more information, refer to the Aquatic Life Water Quality Standards Draft Technical Support Document for TSS (Turbidity), http://www.pca.state.mn.us/index.php/view-document.html?gid=14922,

Bois de Sioux River Watershed TMDL • DRAFT 2018 Minnesota Pollution Control Agency
11
and the Minnesota Nutrient Criteria Development for Rivers Report, http://www.pca.state.mn.us/index.php/view-document.html?gid=14947.
Stream Eutrophication
Stream eutrophication standards, and in particular P standards, were developed based on data evaluated from a large cross-section of rivers from across the state (Heiskary et al. 2013, http://www.pca.state.mn.us/index.php/view-document.html?gid=14947). Clear relationships were established between TP as the causal factor and the biological response variables (stressors) of sestonic Chl-a, DO flux, and the 5-day biochemical oxygen demand (BOD5). Based on these relationships, it is expected that by meeting the P target, the Chl-a, DO flux, and BOD5 standards will likewise be met. DO flux is the magnitude of change in DO over the course of one day (daily maximum DO minus the daily minimum DO), and measures the amount of algal production in a stream, with large DO fluxes indicative of excess algal production and due to excess P. BOD5 is the 5-day biochemical oxygen demand and is another measure of excess algal production in a stream. Consistent with EPA guidance, stream eutrophication criteria were developed for three RNR.
The river eutrophication P standard for the Southern Nutrient Region streams is 150 micrograms per liter (µg/L) as a growing season (June through September) average, and will be used as the water quality target for stream P (Table 7).
Table 7. Stream Eutrophication Standards
River Nutrient Region Nutrient Stressor
TP (µg/L) Chl-a (µg/L) DO flux (mg/L) BOD5 (mg/L)
South ≤ 150 ≤ 35 ≤ 4.5 ≤ 3.0
For more information, refer to the draft Minnesota Nutrient Criteria Development for Rivers Report, http://www.pca.state.mn.us/index.php/view-document.html?gid=14947, and the Minnesota Nutrient Criteria Development for Rivers Report, http://www.pca.state.mn.us/index.php/view-document.html?gid=14947.

Bois de Sioux River Watershed TMDL • DRAFT 2018 Minnesota Pollution Control Agency
12
3 Watershed and Water body Characterization The BdSRW (HUC-8 09020101) is located in central western Minnesota and includes the drainage areas of Lake Traverse and the Bois de Sioux River. The Bois de Sioux and Otter Tail Rivers converge to form the headwaters of the Red River of the North. The BdSRW covers 2,908 square kilometers (km2) (718,685 acres) in areas of Otter Tail, Grant, Wilkin, Big Stone, and Traverse Counties in Minnesota, Roberts County in South Dakota, and Richland County in North Dakota. Land use in the BdSRW is largely agriculture with an extensive drainage network and has low urban development pressure.
The MPCA 2013 Bois de Sioux River Watershed Monitoring and Assessment report provides a brief history of agricultural development in the BdSRW: “Historically much of the Bois de Sioux River Watershed was covered in tall grass prairie and featured large areas of permanent and temporary wetlands (Krenz 1993).Throughout the mid to late 1800s steamboats and railroads fostered settlement within the area (Krenz 1993). Settlers could purchase cheap land from the railroads or acquire it through government programs such as the Homestead Act (Krenz 1993). Most early residents settled along waterways in well drained areas due to the availability of natural resources and fertile river bottom soil (Krenz 1993). Eventually a shortage of well drained land occurred and attention was directed towards the flat saturated lands within the Red River Valley (Krenz 1993). Agricultural land drainage began as early as the mid-1800s to make more land within the Red River Basin available for agricultural production. Today approximately 86% of the Bois de Sioux River Watershed acreage is used for agricultural purposes. Most of the original wetlands have been lost to agricultural drainage.”
Lakes The physical characteristics of the impaired lakes and upstream lakes of the Bois de Sioux River (-501) are listed in Table 8. Lake surface areas, lake volumes, mean depths, and littoral areas (less than 15 feet) were calculated using Minnesota Department of Natural Resources (DNR) bathymetry data; maximum depths were reported from the DNR Lake Finder website; and watershed areas and watershed to surface area ratios were calculated using BdSRW HSPF model subbasins (EOR 2014).
Ash Lake (DNR Lake ID 26-0294) is located in Grant County with portions of its watershed located in Grant County (92%) and Otter Tail County (8%).
Upper Lightning Lake (DNR Lake ID 56-0957) is located in Otter Tail County with portions of its watershed located in Otter Tail County (8%) and Grant County (92%).

Bois de Sioux River Watershed TMDL • DRAFT 2018 Minnesota Pollution Control Agency
13
Table 8. Impaired lake physical characteristics Note that the watershed area includes the surface area of the lake
Impaired Lake or Upstream Lake
Surf
ace
area
(ac)
Litt
oral
are
a (%
tota
l ar
ea)
Volu
me
(acr
e-fe
et)
Mea
n de
pth
(feet
)
Max
imum
dep
th
(feet
)
Wat
ersh
ed a
rea*
(in
cl. l
ake
area
) (ac
)
Wat
ersh
ed a
rea
: Su
rfac
e ar
ea
Ash 171 100% 207 1.2 2.5 6,464 38: 1
Mud** 2,462 100% 3,596 1.5 3.5 837,759 340: 1
Traverse*** 11,039 100% 85,283 7.7 12 235,340 21: 1
Upper Lightning 695 100% 2,596 3.7 8 7,866 11: 1
* Includes the entire drainage area located within the Mustinka River Watershed, North Dakota, and South Dakota. ** Mud Lake is a major tributary to the Bois de Sioux River (-501). *** Lake Traverse is not impaired, but is a major tributary to Mud Lake and the Bois de Sioux River. These data were used to construct a separate BATHTUB model for Lake Traverse.
The Mustinka River discharges to Lake Traverse and White Rock/Mud Lakes before entering the Bois de Sioux River system. Note that Lake Traverse has high P levels but does not have corresponding high algae levels nor low clarity and is therefore not listed as impaired due to eutrophication. White Rock/Mud Lake, however, was assessed as not supporting aquatic recreation due to eutrophication. Mud Lake is a large, shallow reservoir managed by the U.S. Army Corps of Engineers (ACOE) for flood control and for water conservation during periods of drought. The lake has a 2-meter deep channel with most of the lake between 0.3 and 0.6 meters deep; however, during high water, the depth can increase over 3 meters above normal pool elevation. Modeling was conducted to determine if the basin had sufficient residence time to be considered a lake. The results indicate that even though the mean depth is only 0.3 meters, the lake still had an estimated residence time of greater than 14 days at low flow. Flows throughout this system are highly managed by the ACOE and the contribution of flows from the Mustinka River to Lake Traverse and Mud Lake is complicated and depends on the flow regime. Mud Lake also receives discharge from three states: Minnesota, South Dakota, and North Dakota. Therefore, additional monitoring and modeling is needed to develop a well calibrated lake water quality response model for Mud Lake. Consequently, the TMDL study for Mud Lake has been deferred until the next MPCA assessment cycle.
Suggested P goals and reductions were developed for Mud Lake and Lake Traverse (see Table 47 and Table 48) to aid in implementation of the Bois de Sioux River (-501) P TMDL (Table 46), but these goals do not represent TMDLs. Suggested P load targets for NPDES permitted sources within the Mustinka River Watershed (Table 43) are represented in the Mud Lake goals and reduction table, and are based on the Bois de Sioux River (-501) achieving the river eutrophication standards. The suggested P load targets for NPDES permitted sources within the Mustinka River Watershed may be modified in the future depending on the outcome of additional monitoring and modeling of Mud Lake.

Bois de Sioux River Watershed TMDL • DRAFT 2018 Minnesota Pollution Control Agency
14
Streams Table 9 lists the direct drainage and total watershed areas of the impaired stream reaches in the BdSRW. Total watershed and direct drainage areas were delineated from BdSRW HSPF model subbasins (EOR 2014). The direct drainage areas include only the area downstream of any impaired upstream reach impaired for the same pollutant.
Table 9. Impaired stream direct drainage and total watershed areas
Impaired Reach
(09020101-XXX)
Total Suspended Solids/ Total Phosphorus
E. coli Total
Drainage Area (ac)
Upstream Impairments Direct Drainage Area (ac)
Upstream Impairments Direct Drainage Area (ac) Reaches Drainage
Area (ac) Reaches Drainage Area (ac)
501 502 198,006 505,357 502, 510 225,447 477,916 703,363
502 512 39,437 158,569 -- -- 198,006 198,006
510 -- -- 22,672 22,672
512 -- -- 39,437 39,437
Watershed 703,363

Bois de Sioux River Watershed TMDL • DRAFT 2018 Minnesota Pollution Control Agency
15
Subwatersheds The impaired lake and stream subwatersheds are illustrated in Figure 2 below.
Figure 2. Impaired lake and stream drainage areas

Bois de Sioux River Watershed TMDL • DRAFT 2018 Minnesota Pollution Control Agency
16
Land Use Land cover in the BdSRW was assessed using the Multi-Resolution Land Characteristics Consortium 2011 National Land Cover Dataset (NLCD) (http://www.mrlc.gov/nlcd2011.php). This information is necessary to draw conclusions about pollutant sources and best management practices (BMPs) that may be applicable within each subwatershed. The land cover distribution within impaired lake and stream watersheds is summarized in Table 10 and Figure 3. This data was simplified to reduce the overall number of categories. Forest includes: evergreen forests, deciduous forests, mixed forests, and shrub/scrub. Developed includes: developed open space, and low, medium, and high density developed areas. Grassland includes: native grass stands, alfalfa, clover, long term hay, and pasture. Cropland includes: all annually planted row crops (corn, soybeans, wheat, oats, barley, etc.), and fallow crop fields. Wetland includes: wetlands and marshes. Open water includes: all lakes and rivers.
The primary land cover within BdSRW is cropland (78%; Table 10).
Table 10. Bois de Sioux River Watershed and impaired lake and stream subwatershed land cover (NLCD 2011)
AUID
Waterbody Name De
velo
ped
Crop
land
Gra
ssla
nd/
Past
ure
Woo
dlan
d
Wet
land
s
Ope
n W
ater
26-0294-00 Ash 5% 75% 0% 2% 12% 7%
56-0957-00 Upper Lightning 4% 75% 0.6% 0.7% 4% 15%
09020101-501 Bois de Sioux River 6% 85% 3% 0.7% 5% 1%
09020101-502 Rabbit River 5% 88% 2% 0.4% 3% 2%
09020101-510 Doran Slough 6% 91% 0.7% 0.5% 1% 0.1%
09020101-512 Rabbit River – South Fork 5% 94% 0% 0.2% 0.4% 0.01%
Bois de Sioux River Watershed 5% 78% 5% 1% 6% 5%

Bois de Sioux River Watershed TMDL • DRAFT 2018 Minnesota Pollution Control Agency
17
Figure 3. Bois de Sioux River Watershed Land Cover (NLCD 2011)
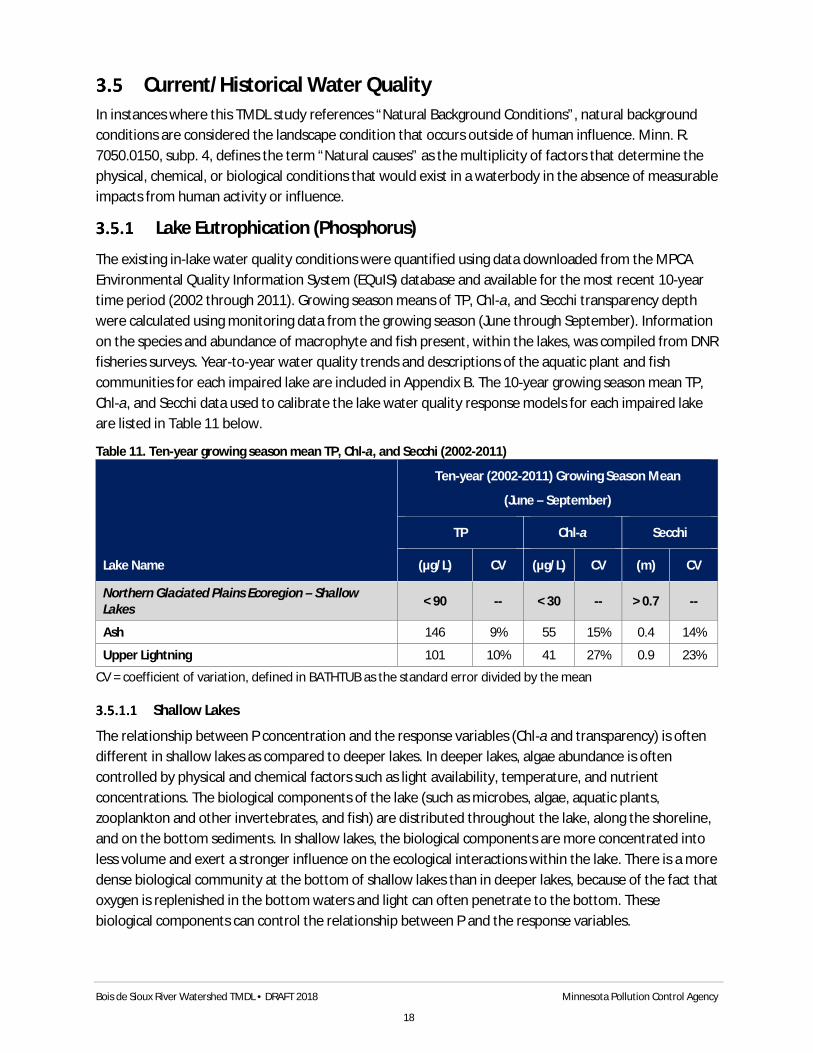
Bois de Sioux River Watershed TMDL • DRAFT 2018 Minnesota Pollution Control Agency
18
Current/Historical Water Quality In instances where this TMDL study references “Natural Background Conditions”, natural background conditions are considered the landscape condition that occurs outside of human influence. Minn. R. 7050.0150, subp. 4, defines the term “Natural causes” as the multiplicity of factors that determine the physical, chemical, or biological conditions that would exist in a waterbody in the absence of measurable impacts from human activity or influence.
Lake Eutrophication (Phosphorus)
The existing in-lake water quality conditions were quantified using data downloaded from the MPCA Environmental Quality Information System (EQuIS) database and available for the most recent 10-year time period (2002 through 2011). Growing season means of TP, Chl-a, and Secchi transparency depth were calculated using monitoring data from the growing season (June through September). Information on the species and abundance of macrophyte and fish present, within the lakes, was compiled from DNR fisheries surveys. Year-to-year water quality trends and descriptions of the aquatic plant and fish communities for each impaired lake are included in Appendix B. The 10-year growing season mean TP, Chl-a, and Secchi data used to calibrate the lake water quality response models for each impaired lake are listed in Table 11 below.
Table 11. Ten-year growing season mean TP, Chl-a, and Secchi (2002-2011)
Lake Name
Ten-year (2002-2011) Growing Season Mean
(June – September)
TP Chl-a Secchi
(µg/L) CV (µg/L) CV (m) CV
Northern Glaciated Plains Ecoregion – Shallow Lakes < 90 -- < 30 -- > 0.7 --
Ash 146 9% 55 15% 0.4 14%
Upper Lightning 101 10% 41 27% 0.9 23%
CV = coefficient of variation, defined in BATHTUB as the standard error divided by the mean
Shallow Lakes
The relationship between P concentration and the response variables (Chl-a and transparency) is often different in shallow lakes as compared to deeper lakes. In deeper lakes, algae abundance is often controlled by physical and chemical factors such as light availability, temperature, and nutrient concentrations. The biological components of the lake (such as microbes, algae, aquatic plants, zooplankton and other invertebrates, and fish) are distributed throughout the lake, along the shoreline, and on the bottom sediments. In shallow lakes, the biological components are more concentrated into less volume and exert a stronger influence on the ecological interactions within the lake. There is a more dense biological community at the bottom of shallow lakes than in deeper lakes, because of the fact that oxygen is replenished in the bottom waters and light can often penetrate to the bottom. These biological components can control the relationship between P and the response variables.

Bois de Sioux River Watershed TMDL • DRAFT 2018 Minnesota Pollution Control Agency
19
The result of this impact, of biological components on the ecological interactions, is that shallow lakes normally exhibit one of two ecologically alternative stable states (Figure 4): the turbid water, algae-dominated state, and the clear water, aquatic plant-dominated state. The clear state is the most preferred, since algae communities are held in check by diverse and healthy zooplankton and fish communities. Fewer nutrients are released from the sediments in this state. The roots of the aquatic plants stabilize the sediments, lessening the amount of sediment stirred up by wind-driven mixing.
Nutrient reduction or addition in a shallow lake does not lead to linear improvement or degradation in water quality (indicated by turbidity in Figure 4). As external nutrient loads are decreased in a lake in the turbid state, slight improvements in water quality may occur at first. At some point, a further decrease in nutrient loads will cause the lake to abruptly shift from the turbid state to the clear state. Conversely, as external nutrient loads are increased in a lake in the clear water state, slight degradations in water quality may occur at first. At some point, further increase in nutrient loads will cause the lake to abruptly shift from the clear state to the turbid state. The general pattern in Figure 4 is often referred to as “hysteresis,” meaning that when forces are applied to a system, it does not return completely to its original state nor does it follow the same trajectory on the way back.
The biological response of the lake to P inputs will depend on the state that the lake is in. For example, if the lake is in the clear state, the aquatic plants may be able to take up P instead of the algae. However, if enough stressors are present in the lake, increased P inputs may lead to a shift to the turbid state with an increase in algal density and decreased transparency. The two main categories of stressors that can shift the lake to the turbid state are:
· Disturbance to the aquatic plant community, for example from wind-driven mixing, benthivorous (bottom feeding) fish, boat motors, water skiing, or light availability (influenced by algal density or water depth); and
· A decrease in the number of zooplankton can result in an increase in algae. A decrease in the number of zooplankton is usually caused by an increase in the number of fish that feed directly on zooplankton due to a decrease in or absence of game fish.
This complexity in the relationships among the biological communities in shallow lakes leads to less certainty in predicting the in-lake water quality of a shallow lake based on the P load to the lake. The relationships between external P load and in-lake P concentration, Chl-a concentration, and transparency are less predictable than in deeper lakes, and therefore lake response models are less accurate.
Another implication of the alternative stable states in shallow lakes is that different management approaches are used for shallow lake restoration than those used for restoration of deeper lakes. Shallow lake restoration often focuses on restoring the macrophyte, zooplankton, and fish communities to the lake.

Bois de Sioux River Watershed TMDL • DRAFT 2018 Minnesota Pollution Control Agency
20
Figure 4. Alternative Stable States in Shallow Lakes
Stream Monitoring Stations Figure 5 displays the monitoring stations where water quality data, summarized in the following sections, were collected.

Bois de Sioux River Watershed TMDL • DRAFT 2018 Minnesota Pollution Control Agency
21
Figure 5. Monitoring stations on impaired reaches in the Bois de Sioux River Watershed

Bois de Sioux River Watershed TMDL • DRAFT 2018 Minnesota Pollution Control Agency
22
River Eutrophication (Phosphorus) Total phosphorus was identified as a stressor to aquatic life in three streams impaired by low DO or having unhealthy fish/macroinvertebrate communities. Ten-year (2002 through 2011) individual and growing season average (June through September) TP concentrations are summarized by station for these three stream reaches.
Bois de Sioux River (09020101-501)
Table 12. Ten-year growing season average total phosphorus (mg/l) by monitoring station in Bois de Sioux River (09020101-501), 2002-2011
Monitoring Station (upstream to downstream)
Ten-year growing season average TP
(mg/L)
Number of Samples
S000-553 0.328 98
S000-089 0.392 8
Figure 6. Ten-year growing season average total phosphorus (mg/l) by monitoring station in Bois de Sioux River (09020101-501), 2002-2011. Monitoring stations are shown in order from upstream to downstream. The dashed line represents the TP eutrophication standard for Southern Region Streams (0.15 mg/L).
0
0.1
0.2
0.3
0.4
0.5
S000-553 S000-089
TP (m
g/l)
Station
Mean +/- SE

Bois de Sioux River Watershed TMDL • DRAFT 2018 Minnesota Pollution Control Agency
23
Figure 7. Total phosphorus (mg/l) by month in Bois de Sioux River (09020101-501) at monitoring station S000-553, 2002-2011. The dashed line represents the TP eutrophication standard for Southern Region Streams (0.15 mg/L).
Figure 8. Total phosphorus (mg/l) by month in Bois de Sioux River (09020101-501) at monitoring station S000-089, 2002-2011. The dashed line represents the TP eutrophication standard for Southern Region Streams (0.15 mg/L).
0
0.1
0.2
0.3
0.4
0.5
0.6
May Jun Jul Aug Sep Oct
TP (m
g/l)
Month
Mean +/- SE

Bois de Sioux River Watershed TMDL • DRAFT 2018 Minnesota Pollution Control Agency
24
Rabbit River (09020101-502)
Table 13. Ten-year growing season average total phosphorus (mg/l) by monitoring station in Rabbit River (09020101-502), 2002-211
Monitoring Station (upstream to downstream)
Ten-year growing season average TP
(mg/L)
Number of Samples
S001-053 0.361 8
S002-002 0.343 9
S001-029 0.435 56
Figure 9. Ten-year growing season average total phosphorus (mg/l) by monitoring station in Rabbit River (09020101-502), 2002-2011. Monitoring stations are shown in order from upstream to downstream. The dashed line represents the TP eutrophication standard for Southern Region Streams (0.15 mg/L).
0
0.1
0.2
0.3
0.4
0.5
S001-053 S002-002 S001-029
TP (m
g/l)
Station
Mean +/- SE

Bois de Sioux River Watershed TMDL • DRAFT 2018 Minnesota Pollution Control Agency
25
Figure 10. Total phosphorus (mg/l) by month in Rabbit River (09020101-502) at monitoring station S001-053, 2002-2011. The dashed line represents the TP eutrophication standard for Southern Region Streams (0.15 mg/L).
Figure 11. Total phosphorus (mg/l) by month in Rabbit River (09020101-502) at monitoring station S002-002, 2002-2011. The dashed line represents the TP eutrophication standard for Southern Region Streams (0.15 mg/L).
0
0.1
0.2
0.3
0.4
0.5
0.6
May Jun Jul Aug Sep Oct
TP (m
g/l)
Month
0
0.1
0.2
0.3
0.4
0.5
0.6
May Jun Jul Aug Sep Oct
TP (m
g/l)
Month

Bois de Sioux River Watershed TMDL • DRAFT 2018 Minnesota Pollution Control Agency
26
Figure 12. Total phosphorus (mg/l) by month in Rabbit River (09020101-502) at monitoring station S001-029, 2002-2011. The dashed line represents the TP eutrophication standard for Southern Region Streams (0.15 mg/L).
Rabbit River – South Fork (09020101-512)
No TP monitoring data were collected from this stream between 2002 and 2011.
Stream Dissolved Oxygen Ten-year (2002 through 2011) instantaneous DO concentrations were summarized by station and month for the three stream reaches impaired by low DO concentrations addressed in this TMDL study.
Bois de Sioux River (09020101-501)
Table 14. Ten-year monthly DO water quality standard exceedances in Bois de Sioux River (09020101-501), 2002-2011.
Monitoring Station (upstream to downstream) Month No. of Samples
No. of Samples < 5 mg/L
S000-553
January 3 0
February 2 0
March 14 0
April 43 0
May 39 0
June 49 5
0
0.1
0.2
0.3
0.4
0.5
0.6
May Jun Jul Aug Sep Oct
TP (m
g/l)
Month
Mean +/- SE

Bois de Sioux River Watershed TMDL • DRAFT 2018 Minnesota Pollution Control Agency
27
Monitoring Station (upstream to downstream) Month No. of Samples
No. of Samples < 5 mg/L
July 25 5
August 17 2
September 17 0
October 14 0
November 9 0
December 4 0
S000-089
April 1 0
May 2 0
June 5 0
July 4 2
August 5 0
September 2 0
Figure 13. Dissolved oxygen (mg/L) by month in Bois de Sioux River (09020101-501) at monitoring station S000-553, 2002-2011. The dashed line represents the DO standard for warm-water streams.
Jan Feb Mar Apr May Jun Jul Aug Sep Oct Nov Dec
Month
0
2
4
6
8
10
12
14
16
18
20
22
DO
(mg/
L)
DO = 5 mg/L

Bois de Sioux River Watershed TMDL • DRAFT 2018 Minnesota Pollution Control Agency
28
Figure 14. Dissolved oxygen (mg/L) by month in Bois de Sioux River (09020101-501) at monitoring station S000-089, 2002-2011. The dashed line represents the DO standard for warm-water streams.
Rabbit River (09020101-502)
Table 15. Ten-year monthly DO water quality standard exceedances in Rabbit River (09020101-502), 2002-2011.
Monitoring Station (upstream to downstream) Month No. of Samples
No. of Samples < 5 mg/L
S001-053
January 1 0
February 1 0
March 1 1
April 8 0
May 7 0
June 5 0
July 5 1
August 8 0
September 7 0
October 6 0
November 2 0
Apr May Jun Jul Aug Sep
Month
0
2
4
6
8
10
12
DO
(mg/
L)
DO = 5 mg/L

Bois de Sioux River Watershed TMDL • DRAFT 2018 Minnesota Pollution Control Agency
29
Monitoring Station (upstream to downstream) Month No. of Samples
No. of Samples < 5 mg/L
December 2 0
S002-002
January 1 0
February 1 0
March 1 0
April 8 0
May 7 0
June 7 1
July 5 2
August 9 0
September 9 3
October 7 0
November 2 0
S001-029
January 1 0
February 1 0
March 3 0
April 10 0
May 16 0
June 34 7
July 20 6
August 17 5
September 15 0
October 5 0
S001-051
April 3 0
May 3 0
June 3 0
July 3 2

Bois de Sioux River Watershed TMDL • DRAFT 2018 Minnesota Pollution Control Agency
30
Monitoring Station (upstream to downstream) Month No. of Samples
No. of Samples < 5 mg/L
August 3 2
September 3 0
October 3 0
November 1 0
Figure 15. Dissolved oxygen (mg/L) by month in Rabbit River (09020101-502) at monitoring station S001-053, 2002-2011. The dashed line represents the DO standard for warm-water streams.
Jan Feb Mar Apr May Jun Jul Aug Sep Oct Nov Dec
Month
0
2
4
6
8
10
12
14
16
DO
(mg/
L)
DO = 5 mg/L

Bois de Sioux River Watershed TMDL • DRAFT 2018 Minnesota Pollution Control Agency
31
Figure 16. Dissolved oxygen (mg/L) by month in Rabbit River (09020101-502) at monitoring station S002-002, 2002-2011. The dashed line represents the DO standard for warm-water streams.
Figure 17. Dissolved oxygen (mg/L) by month in Rabbit River (09020101-502) at monitoring station S001-029, 2002-2011. The dashed line represents the DO standard for warm-water streams.
Jan Feb Mar Apr May Jun Jul Aug Sep Oct Nov
Month
0
2
4
6
8
10
12
14
16
DO
(mg/
L)
DO = 5 mg/L
Jan Feb Mar Apr May Jun Jul Aug Sep Oct
Month
0
2
4
6
8
10
12
14
16
18
20
DO
(mg/
L)
DO = 5 mg/L

Bois de Sioux River Watershed TMDL • DRAFT 2018 Minnesota Pollution Control Agency
32
Figure 18. Dissolved oxygen (mg/L) by month in Rabbit River (09020101-502) at monitoring station S001-051, 2002-2011. The dashed line represents the DO standard for warm-water streams.
Rabbit River – South Fork (09020101-512)
Table 16. Ten-year monthly DO water quality standard exceedances in Rabbit River – South Fork (09020101-512), 2002-2011.
Monitoring Station (upstream to downstream) Month No. of Samples
No. of Samples < 5 mg/L
S006-853
May 1 0 June 1 0 July 1 1 August 1 1 September 1 0
S004-176
April 6 0 May 5 0 June 3 1 July 4 3 August 5 3 September 5 0 October 4 0 November 2 0
Apr May Jun Jul Aug Sep Oct Nov
Month
0
2
4
6
8
10
12
14
16
DO
(mg/
L)
DO = 5 mg/L

Bois de Sioux River Watershed TMDL • DRAFT 2018 Minnesota Pollution Control Agency
33
Figure 19. Dissolved oxygen (mg/L) by month in Rabbit River – South Fork (09020101-512) at monitoring station S006-853, 2002-2011. The dashed line represents the DO standard for warm-water streams.
Figure 20. Dissolved oxygen (mg/L) by month in Rabbit River – South Fork (09020101-512) at monitoring station S004-176, 2002-2011. The dashed line represents the DO standard for warm-water streams.
May Jun Jul Aug Sep Oct
Month
0
2
4
6
8
10
12
14
DO
(mg/
L)
DO = 5 mg/L
Apr May Jun Jul Aug Sep Oct Nov
Month
0
2
4
6
8
10
12
14
16
DO
(mg/
L)
DO = 5 mg/L

Bois de Sioux River Watershed TMDL • DRAFT 2018 Minnesota Pollution Control Agency
34
Stream E. coli Using data from the most recent 10-year period (2002 through 2011), geometric mean E. coli concentrations were calculated by month for the three stream reaches impaired by E. coli.
Bois de Sioux River (09020101-501)
Table 17. Ten-year geometric mean E. coli (org./100ml) concentrations by month in Bois de Sioux River (09020101-501), 2002-2011. Geometric means that exceed the water quality standard of 126 org./100ml for which there are at least 5 samples are highlighted in bold.
Monitoring Station Month Number of
Samples
Geometric Mean
(org./100ml)
Min – Max (org./100ml)
S000-553
June 5 138 23-613
July 5 84 11-249
August 5 75 3-1,553
September 3 423 120-2,419
S000-089
June 5 31 11-130
July 4 148 11-2,419
August 5 42 12-111
Figure 21. E. coli (org./100mL) by month in Bois de Sioux River (09020102-501) at monitoring station S000-553, 2002-2011. The dashed line represents the stream water quality standard (126 org./100mL)
Jun Jul Aug Sep
Month
0
500
1000
1500
2000
2500
3000
E. c
oli (
org.
/100
mL)
E. coli = 126 org./100mL

Bois de Sioux River Watershed TMDL • DRAFT 2018 Minnesota Pollution Control Agency
35
Figure 22. E. coli (org./100mL) by month in Bois de Sioux River (09020102-501) at monitoring station S000-089, 2002-2011. The dashed line represents the stream water quality standard (126 org./100mL)
Rabbit River (09020101-502)
Table 18. Ten-year geometric mean E. coli (org./100ml) concentrations by month Rabbit River (09020101-502), 2002-2011. Geometric means that exceed the water quality standard of 126 org./100ml for which there are at least 5 samples are highlighted in bold.
Monitoring Station Month Number of
Samples
Geometric Mean
(org./100ml)
Min – Max (org./100ml)
S001-053
May 1 40 40-40
June 1 1,110 1,110-1,110
July 2 158 83-300
August 1 2 2-2
September 1 270 270-270
S002-002
April 1 10 10-10
May 2 11 4-28
June 2 130 120-140
August 2 325 230-460
Jun Jul Aug
Month
0
500
1000
1500
2000
2500
3000E
. col
i (or
g./1
00m
L)
E. coli = 126 org./100mL

Bois de Sioux River Watershed TMDL • DRAFT 2018 Minnesota Pollution Control Agency
36
Monitoring Station Month Number of
Samples
Geometric Mean
(org./100ml)
Min – Max (org./100ml)
September 1 150 150-150
S001-029
April 1 5 5-5
May 2 16 10-26
June 9 159 62-460
July 10 198 54-900
August 11 87 2-1,203
September 4 252 138-659
Figure 23. E. coli (org./100mL) by month in Rabbit River (09020102-502) at monitoring station S001-053, 2002-2011. The dashed line represents the stream water quality standard (126 org./100mL)
May Jun Jul Aug Sep
Month
0
200
400
600
800
1000
1200
E. c
oli (
org.
/100
mL)
E. coli = 126 org./100mL

Bois de Sioux River Watershed TMDL • DRAFT 2018 Minnesota Pollution Control Agency
37
Figure 24. E. coli (org./100mL) by month in Rabbit River (09020102-502) at monitoring station S002-002, 2002-2011. The dashed line represents the stream water quality standard (126 org./100mL)
Figure 25. E. coli (org./100mL) by month in Rabbit River (09020102-502) at monitoring station S001-029, 2002-2011. The dashed line represents the stream water quality standard (126 org./100mL)
Apr May Jun Jul Aug Sep
Month
0
50
100
150
200
250
300
350
400
450
500
E. c
oli (
org.
/100
mL)
E. coli = 126 org./100mL
Apr May Jun Jul Aug Sep
Month
0
200
400
600
800
1000
1200
1400
E. c
oli (
org.
/100
mL)
E. coli = 126 org./100mL

Bois de Sioux River Watershed TMDL • DRAFT 2018 Minnesota Pollution Control Agency
38
Unnamed Creek – Doran Slough (09020101-510)
Table 19. Ten-year geometric mean E. coli (org./100ml) concentrations by month in Unnamed Creek – Doran Slough (09020101-510), 2002-2011. Geometric means that exceed the water quality standard of 126 org./100ml for which there are at least 5 samples are highlighted in bold.
Figure 26. E. coli (org./100mL) by month in Unnamed Creek – Doran Slough (09020102-510) at monitoring station S005-145, 2002-2011. The dashed line represents the stream water quality standard (126 org./100mL)
Apr May Jun Jul Aug Sep
Month
0
200
400
600
800
1000
1200
1400
1600
1800
E. c
oli (
org.
/100
mL)
E. coli = 126 org./100mL
Monitoring Station Month Number of
Samples
Geometric Mean
(org./100ml)
Min – Max (org./100ml)
S005-145
April 2 13 11-15
June 3 169 46-921
July 5 426 131-1,553
August 5 374 127-1,533
September 1 326 326-326
S005-144
June 5 56 10-1,553
July 5 52 18-308
August 5 198 44-2,420
September 3 66 47-86

Bois de Sioux River Watershed TMDL • DRAFT 2018 Minnesota Pollution Control Agency
39
Figure 27. E. coli (org./100mL) by month in Unnamed Creek – Doran Slough (09020102-510) at monitoring station S005-144, 2002-2011. The dashed line represents the stream water quality standard (126 org./100mL)
Stream Total Suspended Solids Using data from the most recent 10-year period (2002 through 2011), the percent of TSSs samples exceeding the South RNR standard of 65 mg/L, from April through September, were calculated for these stream reaches.
Bois de Sioux River (09020101-501)
Table 20. Ten-year total suspended solids water quality exceedances by station in Bois de Sioux River (09020101-501), 2002-2011 (April – September). Stations are listed in order from upstream to downstream.
Monitoring Station (upstream to downstream) No. of Samples No. of Samples
> 65 mg/L
S000-053 231 100
S000-089 10 4
Jun Jul Aug Sep
Month
0
500
1000
1500
2000
2500
3000
E. c
oli (
org.
/100
mL)
E. coli = 126 org./100mL

Bois de Sioux River Watershed TMDL • DRAFT 2018 Minnesota Pollution Control Agency
40
Figure 28. Total suspended solids (mg/L) by month in Bois de Sioux River (09020101-501) at monitoring station S000-553, 2002-2011. The dashed red line represents the TSS water quality standard for Southern Region Streams (65 mg/L).
Figure 29. Total suspended solids (mg/L) by month in Bois de Sioux River (09020101-501) at monitoring station S000-089, 2002-2011. The dashed red line represents the TSS water quality standard for Southern Region Streams (65 mg/L).
0
25
50
75
100
125
150
175
200
Apr May Jun Jul Aug Sep
TSS
(mg/
l)
Month
Mean +/- SE
0
25
50
75
100
125
150
175
200
Apr May Jun Jul Aug Sep
TSS
(mg/
l)
Month

Bois de Sioux River Watershed TMDL • DRAFT 2018 Minnesota Pollution Control Agency
41
Rabbit River (09020101-502)
Table 21. Ten-year total suspended solids water quality exceedances by station in Rabbit River (09020101-502), 2002-2011 (April – September). Stations are listed in order from upstream to downstream.
Monitoring Station (upstream to downstream) No. of Samples No. of Samples
> 65 mg/L
S001-053 13 5
S002-002 10 3
S001-029 70 31
Figure 30. Total suspended solids (mg/L) by month in Rabbit River (09020101-502) at monitoring station S001-053, 2002-2011. The dashed red line represents the TSS water quality standard for Southern Region Streams (65 mg/L).
0
25
50
75
100
125
150
175
200
Apr May Jun Jul Aug Sep
TSS
(mg/
l)
Month

Bois de Sioux River Watershed TMDL • DRAFT 2018 Minnesota Pollution Control Agency
42
Figure 31. Total suspended solids (mg/L) by month in Rabbit River (09020101-502) at monitoring station S002-002, 2002-2011. The dashed red line represents the TSS water quality standard for Southern Region Streams (65 mg/L).
Figure 32. Total suspended solids (mg/L) by month in Rabbit River (09020101-502) at monitoring station S001-029, 2002-2011. The dashed red line represents the TSS water quality standard for Southern Region Streams (65 mg/L).
0
25
50
75
100
125
150
175
200
Apr May Jun Jul Aug Sep
TSS
(mg/
l)
Month
0
25
50
75
100
125
150
175
200
Apr May Jun Jul Aug Sep
TSS
(mg/
l)
Month
Mean +/- SE

Bois de Sioux River Watershed TMDL • DRAFT 2018 Minnesota Pollution Control Agency
43
Rabbit River – South Fork (09020101-512)
No TSS monitoring data were collected from this stream between 2002 and 2011.
Pollutant Source Summary Natural background conditions refer to inputs that would be expected under natural, undisturbed conditions. Natural background sources can include inputs from natural geologic processes such as soil loss from upland erosion and stream development, atmospheric deposition, and loading from forested land, wildlife, etc. For each impairment, natural background levels are implicitly incorporated in the water quality standards used by the MPCA to determine/assess impairment, and therefore natural background is accounted for and addressed through the MPCA’s waterbody assessment process. Natural background conditions were also evaluated, where possible, within the modeling and source assessment portion of this TMDL study. These source assessment exercises indicate natural background inputs are generally low compared to livestock, cropland, streambank, WWTFs, failing SSTSs, and other anthropogenic sources.
Based on the MPCA’s waterbody assessment process and the TMDL source assessment exercises, there is no evidence at this time to suggest that natural background sources are a major driver of any of the impairments and/or affect the waterbodies’ ability to meet state water quality standards. For all impairments addressed in this TMDL study, natural background sources are implicitly included in the LA portion of the TMDL allocation tables and TMDL reductions should focus on the major anthropogenic sources identified in the source assessment.
Lake Phosphorus
This section provides a brief description of the potential sources in the BdSRW that contribute to excess nutrients in the impaired lakes. P in lakes often originates on land. P from sources such as phosphorus-containing fertilizer, manure, and the decay of organic matter can adsorb to soil particles. Wind and water action erode the soil, detaching particles and conveying them via stormwater runoff to nearby waterbodies where the P becomes available for algal growth. Organic material, such as leaves and grass clippings, can leach dissolved P into standing water and runoff, or be conveyed directly to waterbodies where biological action breaks down the organic matter and releases P.
Permitted Sources
The regulated sources of P, within the subwatersheds of the eutrophication impairments addressed in this TMDL study, include WWTF effluent, construction stormwater, and industrial stormwater. P loads from NPDES permitted wastewater and stormwater sources were accounted for using the methods described in Section 4.1.3 below.
Non-permitted Sources
The following sources of P that do not require an NPDES permit were evaluated:
· Watershed runoff
· Loading from upstream waters
· Runoff from feedlots that do not require NPDES permit coverage

Bois de Sioux River Watershed TMDL • DRAFT 2018 Minnesota Pollution Control Agency
44
· Septic systems
· Atmospheric deposition
· Lake internal loading
Watershed runoff
A HSPF model (EOR 2014) was used to estimate watershed runoff volumes and TP loads from the direct drainage area of impaired lakes. The HSPF model generates overland runoff flows on a daily time step for 30 individual subwatersheds in the BdSRW based on land cover and soil type and was calibrated using meteorological data from 2001 through 2006. A six-year (2001 through 2006) average annual flow was calculated for lake BATHTUB models. Direct drainage flows to Ash Lake were area-weighted based on watershed delineations from United States Geological Survey (USGS) StreamStats, because the lake subwatershed was located within a portion of one HSPF subwatershed.
Phosphorus loads from specific sources within the watershed (upstream waters, feedlots not requiring NPDES permit coverage, and subsurface sewage treatment systems [SSTS]) were also independently estimated to determine their relative contributions, described below.
Table 22. HSPF six-year (2001-2006) average annual flow volumes and TP loads for lake direct drainage areas Impaired lake or Upstream Lake
Direct drainage area (ac)
TP Conc. (µg/L)
Flow (ac-ft/yr)
TP Load (lb/yr)
Ash 6,293 303 1,547 1,261
Mud* 45,540 600 6,664 10,755
Traverse** 224,301 634 39,896 68,093
Upper Lightning 7,171 409 1,485 1,633
* Mud Lake is not addressed by a TMDL in this study but was modeled to determine the phosphorus reductions needed to meet the assumptions of the Bois de Sioux River (-501) TP TMDL ** Lake Traverse is not impaired, but is a major tributary to Mud Lake. These data were used to construct a separate BATHTUB model for Lake Traverse.
Upstream lakes and streams
Upstream lakes and streams can contribute significant P loads to downstream impaired lakes and streams. Water quality monitoring data and flow from upstream lakes and streams, summarized in Table 23, were used to estimate the P loads to downstream impaired waters.
Table 23. Existing upstream phosphorus loads to impaired lakes and streams
Impaired Lake or Stream
Upstream Lake or Stream (Lake ID/ AUID)
TP (µg/L)
Flow (ac-ft/yr)
TP Load (lb/yr)
Mud* Traverse (78-0025) 214 179,842 104,826
Mud* Mustinka River (09020102-503) 205 137,653 75,973
* Mud Lake is not addressed by a TMDL in this study but was modeled to determine the phosphorus reductions needed to meet the assumptions of the Bois de Sioux River (-501) TP TMDL
Feedlots that do not require NPDES permits
Runoff during precipitation and snow melt can carry P from uncovered feedlots to nearby surface waters. For the purpose of this TMDL study, non-permitted feedlots are defined as being all registered

Bois de Sioux River Watershed TMDL • DRAFT 2018 Minnesota Pollution Control Agency
45
feedlots without an NPDES/State Disposal System (SDS) Permit that house under 1,000 animal units (AUs). While these feedlots do not fall under NPDES regulation, other regulations still apply. Phosphorus loads to impaired lakes, listed in Table 24, from non-permitted, registered feedlots were estimated based on assumptions described in the Detailed Assessment of Phosphorus Sources to Minnesota Watersheds (MPCA 2004) and correspondence with county officers in 2014.
Table 24. Feedlot assumptions and phosphorus loads to impaired lakes
Impaired Lake or
Upstream Lake
Beef Cattle Total P generated
Fraction of feedlots contributing to
waters
P fraction lost to surface waters (average flow)
Total Annual Feedlot Load
AU lb/ AU-yr lb/yr % % lb/yr
Ash 20 33.5 670 35 0.2 0.5
Mud* 0 33.5 0 35 0.2 0
Traverse** 147 33.5 4,925 35 0.2 3.5
Upper Lightning 0 33.5 0 35 0.2 0
* Mud Lake is not addressed by a TMDL in this study but was modeled to determine the phosphorus reductions needed to meet the assumptions of the Bois de Sioux River (-501) TP TMDL ** Lake Traverse is not impaired, but is a major tributary to Mud Lake. These data were used to construct a separate BATHTUB model for Lake Traverse.
Subsurface sewage treatment systems (SSTS)
Phosphorus loads from SSTS were estimated based on assumptions described in the Detailed Assessment of Phosphorus Sources to Minnesota Watershed (MPCA 2004) and county specific estimates of failing septic systems rates, based on reports from Big Stone County and Grant County planning and zoning officers.

Bois de Sioux River Watershed TMDL • DRAFT 2018 Minnesota Pollution Control Agency
46
Table 25. SSTS assumptions and phosphorus loads to impaired lakes
Impaired Lake or Upstream Lake
Shor
elin
e IS
TSa
Seas
onal
resi
denc
e (4
mo/
yr)
Perm
anen
t Res
iden
ce
Conf
orm
ing
Syst
ems
Faili
ng S
yste
msb
Capi
ta p
er R
esid
ence
c
P Pr
oduc
tion
per C
apita
Conf
orm
ing
ISTS
%P
“pas
sing
”
Faili
ng IS
TS %
P “p
assi
ng”
Conf
orm
ing
Syst
ems
Faili
ng S
yste
ms
P Lo
ad C
onfo
rmin
g IS
TS
P Lo
ad F
ailin
g IS
TS
Tota
l Sho
relin
e IS
TS P
Loa
d
Tota
l Sho
relin
e IS
TS P
Loa
d du
e to
Fai
ling
# % % % % # lb/yr % % # # lb/yr lb/yr lb/yr lb/yr
Ash 0 n/a n/a n/a n/a n/a 1.95 20 43 0 0 0 0 0 0
Mud* 6 33 67 81 19 2.46 1.95 20 43 5 1 3.7 1.6 5.3 0.9
Traverse** 241 88 12 81 19 2.41 1.95 20 43 195 46 75.9 38.5 114.4 20.6
Upper Lightning 2 100 0 100 0 2.29 1.95 20 43 2 0 0.6 0 0.6 0
* Mud Lake is not addressed by a TMDL in this study but was modeled to determine the phosphorus reductions needed to meet the assumptions of the Bois de Sioux River (-501) TP TMDL
** Lake Traverse is not impaired, but is a major tributary to Mud Lake. These data were used to construct a separate BATHTUB model for Lake Traverse.

Bois de Sioux River Watershed TMDL • DRAFT 2018 Minnesota Pollution Control Agency
47
Atmospheric Deposition
Atmospheric deposition represents the P that is bound to particulates in the atmosphere and is deposited directly onto surface waters. Average P atmospheric deposition loading rates were approximately 0.23 pounds per acre (lb/ac) of TP per year for an average rainfall year for the Red River Basin (Barr 2007 addendum to MPCA 2004). This rate was applied to the lake surface area to determine the total atmospheric deposition load per year to the impaired lakes and streams.
Table 26. Atmospheric deposition phosphorus loads to impaired lakes (MPCA 2004) Impaired Lake or Upstream Lake
Atmospheric Deposition Phosphorus Load (lb/yr)
Ash 40
Mud* 573
Traverse** 2,571
Upper Lightning 162
* Mud Lake is not addressed by a TMDL in this study but was modeled to determine the phosphorus reductions needed to meet the assumptions of the Bois de Sioux River (-501) TP TMDL ** Lake Traverse is not impaired, but is a major tributary to Mud Lake. These data were used to construct a separate BATHTUB model for Lake Traverse.
Internal Loading
Internal loading in lakes refers to the P load that originates in the bottom sediments or macrophytes and is released back into the water column. Internal loading can occur via:
1. Chemical release from the sediments: Caused by anoxic (lack of oxygen) conditions in the overlying waters or high pH (greater than 9). If a lake’s hypolimnion (bottom area) remains anoxic for a portion of the growing season, the P released due to anoxia will be mixed throughout the water column when the lake loses its stratification at the time of fall mixing. In shallow lakes, the periods of anoxia can last for short periods of time and occur frequently.
2. Physical disturbance of the sediments: Caused by bottom-feeding fish behaviors (such as carp and bullhead), motorized boat activity, and wind-driven mixing. This is more common in shallow lakes than in deeper lakes.
Internal loading due to the anoxic release from the sediments of each lake was estimated based on the expected release rate of P from the lakebed sediment, the lake anoxic factor (AF), and the lake area. Lake sediment samples were collected and tested for concentration of TP and bicarbonate dithionite extractable phosphorus (BD-P), which analyzes iron-bound P. Phosphorus release rates were calculated using statistical regression equations, developed using measured release rates and sediment P concentrations from a large set of North American lakes (Nürnberg 1988; Nürnberg 1996). Internal loading due to physical disturbance is difficult to reliably estimate and was therefore not included in the lake P analyses. In lakes where internal loading is believed to be substantial, the internal load estimates derived from lake sediment data shown in Table 27 are likely an underestimate of the actual internal load.
Some amount of internal loading is implicit in the BATHTUB lake water quality model; therefore, internal loading rates added to the BATHTUB model during calibration represents the excess sediment release

Bois de Sioux River Watershed TMDL • DRAFT 2018 Minnesota Pollution Control Agency
48
rate beyond the average background release rate, accounted for by the model development lake dataset. The implicit amount of internal loading in BATHTUB is typically smaller than the calibrated BATHTUB rates for shallow lakes because the BATHTUB model development lake dataset is less representative of this lake type, and therefore accounts for less implicit internal loading in shallow lakes. Shallow lake sediments can easily be disturbed by wind-driven mixing of the water column or physical disturbance from boats and carp.

Bois de Sioux River Watershed TMDL • DRAFT 2018 Minnesota Pollution Control Agency
49
Table 27. Internal phosphorus load assumptions and summary
Impaired Lake or Upstream Lake Lake Type
Sediment P Concentration
(mg/kg dry)
Anoxic Factor
Estimated Total Sediment P
Release Rate NA Lakes Dataset
(mg/m2-anoxic day)
Average Estimated
Total Sediment P Release Rate
NA Lakes Dataset
BATHTUB Calibrated
Excess Release
Rate
BATHTUB Calibrated
Excess Internal
Load
Iron P (BD-P)
Total P (TP)
(days) BD-P TP Average (mg/m2-
calendar day)
(mg/m2- calendar
day) (kg/yr) (lb/yr)
Ash Shallow 140 1,400 73 1.34 1.10 1.22 0.24 0 0 0
Mud* Shallow 40 1,200 96 n/a 0.34 0.34 0.09 23.84 86,752 191,253
Traverse** Shallow 84 1,300 81 0.57 0.72 0.65 0.14 3.751 61,206 134,934
Upper Lightning Shallow 33 1,600 65 n/a 1.85 1.85 0.33 0.126 129 284 * Mud Lake is not addressed by a TMDL in this study but was modeled to determine the phosphorus reductions needed to meet the assumptions of the Bois de Sioux River (-501) TP TMDL ** Lake Traverse is not impaired, but is a major tributary to Mud Lake. These data were used to construct a separate BATHTUB model for Lake Traverse.

Bois de Sioux River Watershed TMDL • DRAFT 2018 Minnesota Pollution Control Agency
50
Stream Total Phosphorus and Total Suspended Solids Permitted
The regulated sources of TP and TSSs within the subwatersheds of the impaired streams addressed in this TMDL study include WWTF effluent; NPDES permitted feedlots, construction stormwater, and industrial stormwater. Phosphorus and TSS loads from NPDES permitted wastewater and stormwater were accounted for using the methods described in Section 4.2 and 4.3 below.
Non-permitted The HSPF model was used to simulate non-permitted sources of total suspended sediment and TP in the BdSRW. HSPF has been used extensively in Minnesota and nationwide in support of TMDLs to simulate the complex nutrient cycling associated with P, nitrogen, DO, algal growth, and biological oxygen demand. The model splits a watershed into small segments based on unique combinations of homogenous soils, land slope, land cover, and climate. From these segments, daily landscape hydrology and water quality are simulated and routed through the channel network to the watershed outlet.
The Bois de Sioux HSPF model was set up to account for the varying landscapes of the watershed, most notably the different effect of depressional geology (ponds, wetlands, and lakes) versus glacial lake plain geology on hydrologic and water quality responses. While row-crop land covers predominate the watershed, this land cover type was further segmented based on unique combinations of depressional storage and soil infiltration capacity (i.e., soil type) categories, which result in very different hydrologic and water quality responses throughout the BdSRW for the same land cover type.
The model was calibrated and run using data from 2001 to 2006. Ideally, HSPF models would have much longer calibration and validation periods to account for greater climatic variability over time. However, at the time of model construction, continuous flow gage data were only available since 2001 and meteorological data available from 2006, which constrained the model calibration period between 2001 and 2006. The water quality constituents that were modeled and calibrated were flow, TSSs, orthophosphate, TP, nitrate, total Kjeldahl nitrogen (TKN; organic nitrogen plus ammonia), ammonia, DO, temperature, and Chl-a (a pigment found in algae cells). More intense consideration was given to TSS and TP because of their importance to impairments in the BdSRW.
Average annual precipitation, runoff flow, TP, and total sediment yields were calculated from HSPF modeled daily outputs and are summarized graphically in Figure 36 through Figure 39.
Sediment and phosphorus loading characteristics
HSPF modeled results indicate that TSS loading is generally highest in higher slope agricultural areas with higher runoff potential (i.e., less soil infiltration capacity). TP loading follows similar patterns but is more strongly influenced by runoff potential than slope. Both TSS and TP loading decrease with increased amounts of depressional storage (ponds, wetlands, and lakes) in the watershed, illustrating the importance of these features for reducing runoff and nutrient export.
Sediment source summary
In an effort to determine sediment sources in support of the Bois de Sioux HSPF model, EOR conducted a review of available literature (summarized below). No field/monitoring data were available, in this watershed, to make this determination. Two studies conducted in the Red River Basin (Lauer et al. 2006

Bois de Sioux River Watershed TMDL • DRAFT 2018 Minnesota Pollution Control Agency
51
and Brigham et al. 2001) show that field erosion accounts for 65% to 90% of the total suspended sediment. Lauer et al. (2006) determined that field erosion was the dominant (90%) source of sediments in the South Branch Buffalo River in the Red River Valley based on AnnAGNPS modeling. Additionally, Brigham et al. (2001) suggested that surface (field) erosion contributes 65% to 80% of the suspended sediment to the Wild Rice River. Based on these studies and observations made during the geomorphology stream survey, it is expected that the sediment loading in the BdSRW is from approximately 80% field sources and 20% non-field sources. This relative contribution was incorporated into the model during sediment calibration.
Phosphorus source summary
Stream P concentrations are high in the BdSRW across all flow regimes. Large peaks in P loads are generally tied to peaks in sediment loading under high flow conditions, indicating that watershed runoff is the dominant source of P under high flows. Under low flow conditions, an additional source of P was added to calibrate the HSPF model, indicating that groundwater/subsurface water or P entrainment from stream sediments is the dominant source of P under low flows. This is supported by observations of stream eutrophication throughout the watershed and wetland-dominated headwaters.

Bois de Sioux River Watershed TMDL • DRAFT 2018 Minnesota Pollution Control Agency
52
Figure 33. Topography of the Bois de Sioux River Watershed

Bois de Sioux River Watershed TMDL • DRAFT 2018 Minnesota Pollution Control Agency
53
Figure 34. Crop covers in the Bois de Sioux River Watershed (2006 NASS)

Bois de Sioux River Watershed TMDL • DRAFT 2018 Minnesota Pollution Control Agency
54
Figure 35. Hydrologic soil group distribution in the Bois de Sioux River Watershed

Bois de Sioux River Watershed TMDL • DRAFT 2018 Minnesota Pollution Control Agency
55
Figure 36. HSPF 2001-2006 average annual precipitation by subbasin

Bois de Sioux River Watershed TMDL • DRAFT 2018 Minnesota Pollution Control Agency
56
Figure 37. HSPF 2001-2006 average annual runoff flow yields by subbasin

Bois de Sioux River Watershed TMDL • DRAFT 2018 Minnesota Pollution Control Agency
57
Figure 38. HSPF 2001-2006 average annual total phosphorus yields by subbasin

Bois de Sioux River Watershed TMDL • DRAFT 2018 Minnesota Pollution Control Agency
58
Figure 39. HSPF 2001-2006 average annual total phosphorus yields by subbasin

Bois de Sioux River Watershed TMDL • DRAFT 2018 Minnesota Pollution Control Agency
59
Stream E. coli Humans, pets, livestock, and wildlife all contribute bacteria to the environment. These bacteria, after appearing in animal waste, are dispersed throughout the environment by an array of natural and man-made mechanisms. Bacteria fate and transport are affected by disposal and treatment mechanisms, methods of manure reuse, imperviousness of land surfaces, and natural decay and die-off due to environmental factors such as ultraviolet (UV) exposure and detention time in the landscape. The following discussion highlights sources of bacteria in the environment and mechanisms that drive the delivery of bacteria to surface waters.
To evaluate the potential sources of bacteria to surface waters a windshield survey of livestock was conducted in the BdSRW. In addition, a desktop analysis was conducted to identify other sources that are potentially contributing E. coli in the BdSRW. These populations may include humans, companion animals (horses, cats and dogs), and wildlife (deer, geese, ducks, and nesting birds).
Populations were calculated using published estimates for each source on an individual subwatershed basis in the TMDL study area. This is typically a Geographic Information Systems (GIS) exercise where population estimates are clipped to the individual subwatershed boundaries. In some cases, these population estimates are clipped to individual land uses (defined using the 2006 NLCD) within a subwatershed. For example, duck population estimates are assigned to open water land uses.
Bacteria production estimates are based on the bacteria content in feces and an average excretion rate (with units of colony forming units (cfu)/day-head; where head implies an individual animal). Bacteria content and excretion rates vary by animal type, as shown in Table 28. All production rates obtained from the literature are for fecal coliform rather than E. coli due to the lack of E. coli data. The fecal coliform production rates were converted to E. coli production rates based on 200 fecal coliforms to 126 E. coli per 100 milliliters (ml) (see discussion of E. coli water quality standard in Section 2.2).
However, recent research in Minnesota has shown that not all E. coli strains in streams originate from fecal matter and that many of these bacteria strains naturally occur in the sediments (http://www.mda.state.mn.us/protecting/cleanwaterfund/research/7milecreek.aspx). Therefore, the sources described here represent potential fecal sources of E. coli and should be field verified as part of the WRAPS process.
Table 28. Bacteria production by source
Source Category Producer E. coli Production Rate
[cfu/day-head] Literature Source
Humans & Pets Humans 1.26 x 10⁹ Metcalf and Eddy 1991
Dogs 3.15 x 10⁹ Horsley and Witten 1996
Livestock
Horses 2.65 x 10¹⁰ Zeckoski et al. 2005
Cattle 2.08 x 10¹⁰ Zeckoski et al. 2005
Dairy Cows 1.58 x 10¹⁰ Zeckoski et al. 2005
Sheep 7.56 x 10⁹ Zeckoski et al. 2005

Bois de Sioux River Watershed TMDL • DRAFT 2018 Minnesota Pollution Control Agency
60
Source Category Producer E. coli Production Rate
[cfu/day-head] Literature Source
Hogs 6.93 x 10⁹ Zeckoski et al. 2005
Livestock Turkeys 5.86 x 10⁷ Zeckoski et al. 2005
Chickens 5.61 x 10⁷ Zeckoski et al. 2005
Wildlife
Deer 2.21 x 10⁸ Zeckoski et al. 2005
Geese 5.04 x 10⁸ Zeckoski et al. 2005
Ducks 1.51 x 10⁹ Zeckoski et al. 2005
Permitted
Wastewater Treatment Facilities (WWTF)
WWTF are required to test fecal coliform bacteria levels in effluent twice per week during discharge. Dischargers to Class 2 waters are required to disinfect their wastewater from April through October. Wastewater disinfection is required during all months for dischargers within 25 miles of a water intake for a potable water supply system (Minn. R. 7053.0215, subp. 1). The geometric mean for all samples collected in a month must not exceed 200 cfu/ 100 ml fecal coliform bacteria. Table 29 summarizes the fecal coliform and E. coli data for the only WWTF located in the BdSRW, with a surface water discharge. This WWTF is a pond system. Bacteria loads from NPDES-permitted WWTF are estimated based on the design flow and permitted bacteria effluent limit of 200 org./ 100 ml.
Table 29. WWTF design flows and permitted bacteria loads
Stream Reach Facility Name, Permit #
6" per day discharge volume (mgd)
Permitted Bacteria Load
as Fecal Coliform:
200 org./ 100 ml
[billion org./day]
Equivalent Bacteria Load
as E. coli:
126 org. / 100 ml1
[billion org./day]
-502 Campbell WWTF MN0020915 0.285 2.16 1.4 1 WWTF permits are regulated for fecal coliform, not E. coli. The MPCA surface water quality standard for E. coli (126 org. / 100 ml) was used in place of the fecal coliform permitted limit of 200 org. / 100 ml, which was also the MPCA surface water quality standard prior to the March 2008 revisions to Minn. R. ch. 7050.
Land Application of Biosolids
The application of biosolids from WWTF are highly regulated, monitored, and tracked (see Minn. R. ch. 7041 Sewage Sludge Management). Disposal methods that inject or incorporate biosolids within 24 hours of land application result in minimal possibility for mobilization of bacteria to downstream surface waters. While surface application could conceivably present a risk to surface waters, little to no runoff

Bois de Sioux River Watershed TMDL • DRAFT 2018 Minnesota Pollution Control Agency
61
and bacteria transport are expected if permit restrictions are followed. Therefore, land application of biosolids was not included as a source of bacteria.
Concentrated Animal Feeding Operations
Animal waste containing fecal bacteria can be transported in watershed runoff to surface waters. The MPCA regulates concentrated animal feeding operations (CAFOs) in Minnesota, though counties may be delegated by the MPCA to administer the program for feedlots that are not under federal regulation. The primary goal of the state program for animal feeding operations (AFOs) is to ensure that surface waters are not contaminated by the runoff from feeding facilities, manure storage or stockpiles, and cropland with improperly applied manure. Livestock are also found on hobby farms, small-scale farms that are not large enough to require registration but may have small-scale feeding operations and associated manure application or stockpiles.
Livestock manure is often either surface applied or incorporated into farm fields as a fertilizer and soil amendment. This land application of manure has the potential to be a substantial source of fecal contamination, entering waterways from overland runoff and drain tile intakes. Minn. R. ch. 7020 contains manure application setback requirements based on research related to P transport, and not bacterial transport, and the effectiveness of these current setbacks on bacterial transport to surface waters is not known.
There is one active, NPDES permitted CAFO in the BdSRW located in the subwatershed of an E. coli impaired stream. The number of animals registered with the MPCA was verified by an Environmental Services or Feedlot officer for each county located in the BdSRW in the spring of 2014. Manure from these facilities is applied to nearby fields. The bacteria loads produced by animals at these operations were estimated based on the total number of animals (Table 30) and the bacteria production rate of each animal (Table 28).
Table 30. NPDES permitted CAFO AUs
Stream Reach Feedlot Name Permit # CAFO Beef
-502 Chad Hasbargen Farm Sec 2 MN0069744 Y 1,450
Non-NPDES Permitted
Humans
Sewered and unsewered populations and number of households were determined using the 2010 Census data (U.S. Census Bureau 2011). Total population and the number of households were obtained for each subwatershed using block groups1; census block groups that overlap subwatershed boundaries were distributed between each applicable subwatershed on an area-weighted basis. Populations located in a sewered community were estimated from census block group data and boundaries of municipalities
1 A census block in an urban area typically corresponds to individual city blocks bounded by streets; blocks in rural areas may include many square miles and may have some boundaries that are not streets. A block group is a group of census blocks. A block group is smaller than a census tract, which is a small statistical subdivision of a county (e.g., a municipality or a portion of a large city).

Bois de Sioux River Watershed TMDL • DRAFT 2018 Minnesota Pollution Control Agency
62
serviced by a WWTF (Table 29). A summary of the sewered and unsewered population and households by subwatershed are shown in Table 31.
Table 31. Sewered and unsewered population and households by subwatershed
Stream Reach Population Households
Sewered Unsewered Total Sewered Unsewered Total
-501 0 1,105 1,105 0 541 541
-502 312 611 923 182 311 493
-510 0 261 261 0 103 103
Releases
Wastewater collection systems may occasionally be overwhelmed by the infiltration of excessive volumes of groundwater or the inflow of excessive volumes of stormwater, which may result in the need to discharge untreated wastewater, referred to as ‘releases’. The occurrence of wastewater collection system releases is not known to be an issue in the BdSRW.
Illicit Discharges from Unsewered Communities
In many cases, onsite or small community cluster systems used to treat wastewater are installed and forgotten until problems arise. Residential lots in small communities throughout Minnesota cannot accommodate modern septic systems that meet the requirements of current codes due to small lot size and/or inadequate soils. In addition, many small communities are characterized by outdated, malfunctioning septic systems serving older residences. Small lots, poor soils, and inadequate septic system designs and installations may be implicated in bacterial contamination of groundwater, but the link to surface water contamination is tenuous.
“Failing” SSTS are specifically defined as systems that are failing to protect groundwater from contamination. Failing SSTS were not considered a source of fecal pollution to surface water. However, systems that discharge partially treated sewage to the ground surface, road ditches, tile lines, and directly into streams, rivers, and lakes are considered an imminent threat to public health and safety (ITPHS). ITPHS systems also include illicit discharges from unsewered communities (sometimes called “straight-pipes”). Straight pipes are illegal and pose an imminent threat to public health as they convey raw sewage from homes and businesses directly to surface water. Community straight pipes are more commonly found in small rural communities.
The Environmental Services officer of each county provided an estimate of the percent of systems in unsewered communities that are ITPHS in the spring of 2014 (Table 32). Bacteria load from ITPHS was estimated by subwatershed based on these percentages, the unsewered population (Table 31), and the bacteria production rate of humans (Table 28). Note that ITPHS data are derived from surveys of County staff and County level SSTS status inventories. The specific locations of ITPHS systems are not known. The table is not intended to suggest that ITPHS systems contribute excess bacteria to specific waterbodies addressed in this report; rather it suggests that, in general, ITPHS are believed to occur in the project area.

Bois de Sioux River Watershed TMDL • DRAFT 2018 Minnesota Pollution Control Agency
63
Table 32. Estimate of percent ITPHSS as reported by each county County %ITPHSS
Grant 0%
Otter Tail 0%
Traverse 4%
Wilkin 0%
Land Application of Septage
A state SSTS license, applicable to the type of work being performed, is required for any business that conducts work to design, install, repair, maintain, operate, or inspect all or part of an SSTS. A license is also required to land spread septage and operate a sewage collection system discharging to an SSTS. Disposal contractors are required to properly treat and disinfect septage through processing or lime stabilization. Treated septage may then be disposed of onto agricultural and forest lands. EPA Standards Section 503 provides general requirements, pollutant limits, management practices, and operational standards for the final use or disposal of septage generated during the treatment of domestic sewage in a treatment works.
The MPCA does not directly regulate the land application of septage, but management guidelines entail site suitability requirements with respect to soil conditions, slope, and minimum separation distances (MPCA 2002). Some cities and townships have SSTS septage ordinances (a list is available at http://www.pca.state.mn.us/index.php/view-document.html?gid=10139); these were not reviewed as a part of this TMDL study, and application of septage was not included as a source of fecal pollution in this TMDL study.
Pets
Human pets (dogs and cats) can contribute bacteria to a watershed when their waste is not properly managed. When this occurs, bacteria can be introduced to waterways from:
· Dog parks
· Residential yard runoff (spring runoff after winter accumulation)
· Rural areas where there are no pet cleanup ordinances
· Animal elimination of excrement directly into waterbodies
Dog waste can be a significant source of pathogen contamination of water resources (Geldreich 1996). Dog waste in the immediate vicinity of a waterway could be a significant local source with local water quality impacts. However, it is generally thought that these sources may be only minor contributors of fecal contamination on a watershed scale because the estimated magnitude of this source is very small compared to other sources. According to the American Veterinary Medical Association’s (AVMA) 2006 data, 34.2% of Minnesota households own dogs with a mean number of 1.4 dogs in each of those households (AVMA 2007). In addition, it was assumed that only 38% of dog waste is not collected by owners and can contribute fecal pollution to surface waters (TBEP 2012). Bacteria load from dogs was estimated based on total households in each subwatershed (Table 31), the assumptions mentioned in this paragraph, and the bacteria production rate of dogs (Table 28).

Bois de Sioux River Watershed TMDL • DRAFT 2018 Minnesota Pollution Control Agency
64
Domestic cats, even those that spend some time outdoors, are most likely to have their waste collected indoors and were not considered a source of bacteria for this TMDL study. Feral cats may contribute significantly to bacteria levels in urban streams and rivers (Ram et al. 2007). However, feral cat populations are unknown and were not included in this TMDL study.
Livestock
Livestock have the potential to contribute bacteria to surface water through grazing activities or if their manure is not properly managed or stored. Livestock manure is typically collected and applied to nearby fields through injection, which significantly reduces the transport of bacteria contained in manure to surface waters. The population estimates provided in this TMDL study are meant to identify areas where large numbers of livestock are located. These areas should be monitored closely by each county to ensure proper management and storage of manure.
The number of feedlot animals registered with the MPCA was reviewed by an Environmental Services or Feedlot officer for the portion of each county located in the BdSRW in the spring of 2014 (Table 33). The bacteria load from grazing livestock was estimated based on the number of animals (Table 33) and the bacteria production rate of those animals (Table 28).
Table 33. MPCA registered feedlot animals by subwatershed, verified by each county Stream Reach Beef Dairy Horses Hog Sheep Turkey Chickens
-501 202 0 0 10 0 0 0
-502 110 11 0 0 0 0 0
-510 40 0 0 0 0 0 0
Wildlife
Bacteria can be contributed to surface water by wildlife (e.g., deer, geese, and ducks) dwelling in waterbodies, within conveyances to waterbodies, or when their waste is carried to stormwater inlets, creeks, and ditches during stormwater runoff events. Areas such as DNR designated wildlife management areas, state parks, national parks, national wildlife refuges, golf courses, and state forests provide wildlife habitat encouraging congregation, and could be potential sources of higher fecal coliform due to the high densities of animals. There are likely many areas within the project area where wildlife congregates, especially in the wetland-dominated northeast portion of the watershed.
Wildlife populations were estimated based on DNR population data for permit areas and zones. Because permit areas or zones do not align with subwatershed boundaries, population data for any single permit area or zone was distributed among subwatersheds on an area-weighted basis (Table 34). Populations of wildlife (deer, ducks, and geese) were estimated from the data sources and assumptions listed in Table 35. Bacteria loads from wildlife were estimated based on the population (Table 34) and bacteria production rates of wildlife (Table 28).
The presence of large numbers of wild birds on or near surface waters can act as sources of fecal contamination. In two other Red River Basin watersheds, water samples were tested for gene biomarkers for fecal coliform bacteria. Birds were found to be a major contributor to fecal pollution in the Thief River (Thief River Watershed) and a potential contributor to fecal pollution the Kripple Creek (Red Lake River Watershed). Although similar testing has not been completed for water samples collected in the BdSRW, direct bacteria inputs from nesting and migratory birds likely contribute to fecal

Bois de Sioux River Watershed TMDL • DRAFT 2018 Minnesota Pollution Control Agency
65
pollution in the impaired streams. Future biomarker testing is needed to confirm the presence of this source, and is identified as a strategy in the Bois de Sioux River WRAPS Report.
Table 34. Wildlife population estimates by subwatershed Stream reach Deer Ducks Geese
-501 188 30 373
-502 1,102 103 1,133
-510 77 9 134
Table 35. Population Estimate Data Sources and Habitat Assumptions for Wildlife
Wildlife Population Estimate Data Sources and Habitat Assumptions
Ducks
According to a presentation by Steve Cordts of the DNR Wetland Wildlife Population and Research Group at the 2010 DNR Roundtable (http://files.dnr.state.mn.us/fish_wildlife/roundtable/2010/wildlife/wf_pop-harvest. pdf), Minnesota’s annual breeding duck population averaged 550,000 between the years 2005-2009. While the breeding range of the canvasback and lesser scaup is typically outside of the project area, the majority of the breeding duck population (including blue-winged teal, mallards, ring-necked ducks, and wood ducks) has a state-wide breeding range. Statewide there is approximately 90,555,611 acres of suitable open water NWI habitat, equivalent to 0.061 ducks per acre of open water. This duck population density was distributed over all suitable open water NWI land covers plus a 100 foot buffer within each subwatershed on an area-weighted basis.
Deer
The DNR report Status of Wildlife Populations, Fall 2009, includes a collection of studies that estimate wildlife populations of various species (Dexter 2009). Pre-fawn deer densities were reported by DNR deer permit area. Permit area deer population densities over all 2006 NLCD land covers except open water within each subwatershed on an area-weighted basis.
Geese
The DNR report Status of Wildlife Populations, Fall 2009, also includes a collection of studies that estimate wildlife populations of various species by Minnesota ecoregion (Dexter 2009). Geese population data were distributed over and within a 100-foot buffer of all open water areas (PWI basins, streams, ditches and rivers, and 2006 NLCD Open Water) on an area-weighted basis within each subwatershed.
Strengths and Limitations
The bacteria production estimates are provided at the subwatershed scale. The results inform stakeholders as to the types and relative magnitude of bacteria produced in their watershed. This information is a valuable tool for the planning and management of water bodies with respect to bacteria contamination. The potential bacteria source estimates in the project area were calculated using a GIS-based approach. However, available data sources are at different scales and have different boundaries than that of the study subwatersheds. A limitation to the estimation process is that population data at a statewide or ecoregion scale must be distributed to the subwatershed scale based on average population density. As a result, there is a probable minimum scale at which bacteria production estimates are useful.
A significant portion of bacteria producers were accounted for in the potential bacteria sources. However, several animals were not included, such as birds other than geese and ducks (e.g., song birds, and wading birds) and many wild animals (e.g., beavers, bear, and wild turkey). Data, resource

Bois de Sioux River Watershed TMDL • DRAFT 2018 Minnesota Pollution Control Agency
66
limitations, and consideration for the major bacteria producers in the project area led to the selected set of bacteria producers accounted for in these estimates. The project area estimates of potential bacteria sources is also limited by the fact that bacteria delivery is not addressed (e.g., treatment of human waste at WWTFs prior to discharge to receiving waters, pet waste management, zero discharge feedlot facilities, incorporation of manure into soil, geese gathering directly on stormwater ponds). The potential bacteria source estimates also do not account for the relative risk among different types of bacteria. Instead, E. coli production is estimated as an indicator of the likelihood of pathogen contamination of our waterbodies.
Summary
Refer to Section 3.3 for boundaries of the contributing subwatersheds to each impaired stream reach. Bacteria production estimates by subwatershed are listed by producer in Table 36 and for all producers in Table 37.

Bois de Sioux River Watershed TMDL • DRAFT 2018 Minnesota Pollution Control Agency
67
Table 36. Annual E. coli production estimates by producer
Impaired Stream Reach
Humans & Pets Livestock Wildlife
WWTF Effluent
ITPH SSTS Dogs Cattle Dairy Turkey Chickens Hogs Sheep Horses Nesting
Birds Deer Ducks Geese
-501 0 4 310 4,200 0 0 0 69 0 0 unknown 41 45 188
-502 1 3 283 2,287 170 0 0 0 0 0 unknown 243 155 571
-510 0 0 59 832 0 0 0 0 0 0 unknown 17 13 68
Table 37. Total annual E. coli production estimates
Impaired Stream Reach
Area Total Total Humans Livestock Wildlife*
(ac) (billion org./d) (billion org./ac/d) (% Total)
-501 58,936 4,857 0.08 6% 88% 6%
-502 152,886 3,713 0.02 8% 66% 26%
-510 27,441 989 0.04 6% 84% 10%
* Likely underestimates due to the unknown contribution of fecal contamination by nesting birds. Future biomarker testing is needed to confirm the presence of this source, and is identified as a strategy in the Bois de Sioux River WRAPS Report.

Bois de Sioux River Watershed TMDL • DRAFT 2018 Minnesota Pollution Control Agency
68
4 TMDL Development This section presents the overall approach to estimating the components of the TMDL. The pollutant sources were first identified and estimated in the pollutant source assessment. The loading capacity (TMDL) of each lake or stream was then estimated using an in-lake water quality response model or stream LDC and was divided among WLAs and LAs. A TMDL for a waterbody that is impaired, as the result of excessive loading of a particular pollutant, can be described by the following equation:
Where:
Loading capacity (LC): the greatest pollutant load a waterbody can receive without violating water quality standards;
Wasteload allocation (WLA): the pollutant load that is allocated to point sources, including WWTFs, regulated construction stormwater, and regulated industrial stormwater, all covered under NPDES permits for a current or future permitted pollutant source;
Load allocation (LA): the pollutant load that is allocated to sources not requiring NPDES permit coverage, including non-regulated stormwater runoff, atmospheric deposition, and internal loading;
Margin of Safety (MOS): an accounting of uncertainty about the relationship between pollutant loads and receiving water quality;
Reserve Capacity (RC): the portion of the loading capacity attributed to the growth of existing and future load sources.
Phosphorus
Loading Capacity
Lake Response Model
The modeling software BATHTUB (Version 6.1) was selected to link P loads with in-lake water quality. A publicly available model, BATHTUB was developed by William W. Walker for the U.S. ACOE (Walker 1999). It has been used successfully in many lake studies in Minnesota and throughout the United States. BATHTUB is a steady-state annual or seasonal model that predicts a lake’s summer (June through September) mean surface water quality. BATHTUB’s time-scales are appropriate because watershed P loads are determined on an annual or seasonal basis, and the summer season is critical for lake use and ecological health. BATHTUB has built-in statistical calculations that account for data variability and provide a means for estimating confidence in model predictions. The heart of BATHTUB is a mass-balance P model that accounts for water and P inputs from tributaries, watershed runoff, the atmosphere, sources internal to the lake, and groundwater; and outputs through the lake outlet, water loss via evaporation, and P sedimentation and retention in the lake sediments.
System Representation in Model
In typical applications of BATHTUB, lake and reservoir systems are represented by a set of segments and tributaries. Segments are the basins (lakes, reservoirs, etc.) or portions of basins for which water quality
TMDL = LC = ∑WLA + ∑LA + MOS + RC

Bois de Sioux River Watershed TMDL • DRAFT 2018 Minnesota Pollution Control Agency
69
parameters are being estimated, and tributaries are the defined inputs of flow and pollutant loading to a particular segment. For this study, the direct drainage area and outflow from an upstream lake or major river (e.g., Mustinka River) was defined as separate tributaries to each lake (i.e., segment).
Model Inputs
The input required to run the BATHTUB model includes lake geometry, climate data, and water quality and flow data for runoff contributing to the lake. Observed lake water quality data are also entered into the BATHTUB program in order to facilitate model verification and calibration. Lake segment inputs are listed in Table 38, and tributary inputs are listed in Table 22 and Table 23 from Section 3.6.1.2. HSPF model estimates of average annual precipitation and evaporation rates are reported for each lake. Precipitation and evaporation rates apply only to the lake surface areas. Average P atmospheric deposition loading rates were estimated to be 0.23 pounds per acre per year (lb/ac-yr) for the Red River Basin (Barr 2007), applied over each lake’s surface area. See discussion titled Atmospheric Deposition in Section 3.6.1 for more details.
Table 38. BATHTUB segment input data for impaired lakes
Impaired Lake or Upstream Lake
Average Annual
Precipitation (m/yr)
Average Annual
Evaporation (m/yr)
Surface area (sq km)
Lake fetch (km)
Mean depth (m)
Total Phosphorus
(µg/L) CV (%)
Ash 0.723 0.522 0.693 1.4021 0.37 146.2 9%
Mud* 0.609 0.531 9.9628 5.4864 0.45 442.0 22%
Traverse** 0.665 0.562 44.6738 22.86 2.35 214.4 6%
Upper Lightning
0.723 0.522 2.8121 2.7432 1.14 100.5 10%
CV = coefficient of variation, defined in BATHTUB as the standard error divided by the mean * Mud Lake is not addressed by a TMDL in this study but was modeled to determine the phosphorus reductions needed to meet the assumptions of the Bois de Sioux River (-501) TP TMDL ** Lake Traverse is not impaired, but is a major tributary to Mud Lake. These data were used to construct a separate BATHTUB model for Lake Traverse.
Model Equations
BATHTUB allows a choice among several different P sedimentation models. The Canfield-Bachmann Lake P sedimentation model (Canfield and Bachmann 1981) best represents the lake water quality response of Minnesota lakes, and is the model used by the majority of lake TMDLs in Minnesota. In order to perform a uniform analysis, Canfield-Bachmann Lakes was selected as the standard equation for the study. However, the Canfield-Bachmann Lakes P sedimentation model tends to under-predict the amount of internal loading in shallow, frequently mixing lakes. Therefore, an explicit internal load is added to shallow lake models to improve the lake water quality response of the Canfield-Bachmann Lakes P sedimentation model.
Model Calibration
The models were calibrated to existing water quality data, found in Table 39, and then were used to determine the P loading capacity (TMDL) of each lake. When the predicted in-lake TP concentration was

Bois de Sioux River Watershed TMDL • DRAFT 2018 Minnesota Pollution Control Agency
70
lower than the average observed (monitored) concentration, an explicit additional load was added to calibrate the model. It is widely recognized that Minnesota lakes in agricultural regions have histories of high P loading and/or very poor water quality. For this reason, it is reasonable that internal loading may be higher than that of the lakes in the data set used to derive the Canfield-Bachmann lakes formulation. When the predicted in-lake TP concentration was higher than the average observed (monitored) concentration, the P sedimentation factor was increased. Increased sedimentation is often found in shallow lakes that have high treatment capacity due to a clear water, aquatic plant-dominated state.
Table 39. Model calibration summary for the impaired lakes
Impaired Lake or Upstream Lake P Sedimentation Model Calibration Mode Calibration Value
Ash Canfield & Bachmann, Lakes Phosphorus Sedimentation Factor Increased to 1.398
Mud* Canfield & Bachmann, Lakes Added Internal Load 23.84 mg/m2-day
Traverse** Canfield & Bachmann, Lakes Added Internal Load 3.751 mg/m2-day
Upper Lightning Canfield & Bachmann, Lakes Added Internal Load 0.126 mg/m2-day * Mud Lake is not addressed by a TMDL in this study but was modeled to determine the phosphorus reductions needed to meet the assumptions of the Bois de Sioux River (-501) TP TMDL ** Lake Traverse is not impaired, but is a major tributary to Mud Lake. These data were used to construct a separate BATHTUB model for Lake Traverse.
Determination of Lake Loading Capacity
Using the calibrated existing conditions model as a starting point, the P concentrations associated with tributaries were reduced until the model indicated that the TP state standard was met, to the nearest tenth of a whole number. First, upstream lake and major river P concentrations were assumed to meet eutrophication water quality standards. Next, the direct drainage flow-weighted mean TP concentration was reduced to no less than 150 parts per billion (µg/L) until in-lake P concentration met the lake water quality standard. A flow-weighted mean concentration goal of 150 µg/L was chosen to represent reasonable baseline loading conditions from the highly agricultural watershed. If further reductions were needed, any added internal loads were reduced until the in-lake P concentration met the lake water quality standard. Minnesota lake water quality standards assume that once the TP goals are met, the Chl-a and Secchi transparency standards will likewise be met (see Section 2.1.1 Applicable Water Quality Standards). With this process, a series of models were developed that included a level of P loading consistent with lake water quality state standards, or the TMDL goal. Actual load values are calculated within the BATHTUB software, so loads from the TMDL goal models could be compared to the loads from the existing conditions models to determine the amount of load reduction required.
Stream Load Duration Curves
The loading capacities for impaired stream reaches receiving a TMDL, as a part of this study, were determined using LDCs. Flow and LDCs are used to determine the flow conditions (flow regimes) under which exceedances occur. Flow duration curves provide a visual display of the variation in flow rate for the stream. The x-axis of the plot indicates the percentage of time that a flow exceeds the corresponding flow rate as expressed by the y-axis. LDCs take the flow distribution information, constructed for the stream, and factor in pollutant loading to the analysis. A standard curve is developed by applying a particular pollutant standard or criteria to the stream flow duration curve and is expressed as a load of pollutant per day. The standard curve represents the upper limit of the allowable in-stream

Bois de Sioux River Watershed TMDL • DRAFT 2018 Minnesota Pollution Control Agency
71
pollutant load (loading capacity) at a particular flow. Monitored loads of a pollutant are plotted against this curve to display how they compare to the standard. Monitored values that fall above the curve represent an exceedance of the standard.
For the stream TMDL derivation, 2002 through 2011 USGS gaged flows (5051300 for -501, and 54017001 for -502 and -512), area-weighted to the outlet of each impaired stream reach, were used to develop flow duration curves. The loading capacities were determined by applying the TP water quality standard (0.150 mg/L) to the flow duration curve to produce a TP standard curve. Minnesota stream eutrophication standards were developed such that by meeting the P target, the Chl-a, DO flux, and biological oxygen demand (BOD5) standards will likewise be met. Loading capacities presented in the allocation tables represent the median TP load (in kg/day) along the TP standard curve within each flow regime. A TP LDC and a TMDL allocation table are provided for each stream in Section 4.1.6. Monitored TP concentrations for simulation dates within the P assessment window (June through September) are plotted along with the TP standard curve on LDCs. Within each flow duration interval, the existing load is approximated as the median value of the monitored TP loads.
The LDC method is based on an analysis that encompasses the cumulative frequency of historical flow data over a specified period. Because this method uses a long-term record of daily flow volumes, virtually the full spectrum of allowable loading capacities is represented by the resulting curve. In the TMDL tables of this report, only five points on the entire loading capacity curve are depicted (the midpoints of the designated flow zones). However, it should be understood that the entire curve represents the TMDL and is what is ultimately approved by EPA.
Load Allocation Methodology
The LA represents the portion of the loading capacity designated for nonpoint sources of P. The LA includes all sources of P that do not require NPDES permit coverage, including unregulated watershed runoff, internal loading, groundwater, and atmospheric deposition, a consideration for natural background conditions, and any other identified loads described in Section 3.6.1. The LA is calculated as the remaining portion of the LC once the WLA and MOS are subtracted for each impaired lake or stream. The remainder of the LA, after subtraction of atmospheric deposition LA and internal loading LA was used to determine the watershed runoff LA for each impaired lake or stream on an areal basis. Note that the MOS was distributed proportionately among internal loading and watershed runoff based on the proportion of existing loads relative to the loading capacity. The MOS cannot be accounted for in the atmospheric deposition and upstream impaired lake or stream out-flow allocations, as no further reductions can be achieved from these sources beyond what is needed to achieve the loading capacity (i.e., atmospheric loads cannot be reduced and upstream impaired lakes are not required to improve in-lake water quality beyond the state eutrophication standards).
Wasteload Allocation Methodology
All regulated stormwater and wastewater were assigned a WLA based on the methods described in the following section.
MS4 Regulated Stormwater
There is no Municipal Separate Storm Sewer Systems (MS4) regulated stormwater in the BdSRW.

Bois de Sioux River Watershed TMDL • DRAFT 2018 Minnesota Pollution Control Agency
72
Regulated Construction Stormwater
Construction stormwater is regulated by NPDES permits for any construction activity disturbing: (a) one acre or more of soil, (b) less than one acre of soil if that activity is part of a "larger common plan of development or sale" that is greater than one acre, or (c) less than one acre of soil, but the MPCA determines that the activity poses a risk to water resources. The WLA for stormwater discharges, from sites where there are construction activities, reflects the number of construction sites greater than one acre in size that are expected to be active in the impaired lake or stream subwatershed at any one time.
A categorical WLA was assigned to all construction activity in each impaired stream or lake subwatershed. First, the average annual fraction of the impaired subwatershed area, under construction activity over the past five years, was calculated based on the MPCA Construction Stormwater Permit data from January 1, 2007 to October 6, 2012 (Table 40), area-weighted based on the fraction of the subwatershed located in each county. This percentage was multiplied by the watershed runoff load component to determine the construction stormwater WLA. The watershed runoff load component is equal to the total TMDL (loading capacity) minus the sum of the non-watershed runoff load components (atmospheric load, upstream lake loads, internal loads, and MOS).
Table 40. Average Annual NPDES/SDS Construction Stormwater Permit Activity by County (1/1/2007-10/6/2012)
County Total Area
(ac)
Average Annual Construction Activity
(% Total Area)
Big Stone 338,286 0.014%
Grant 368,568 0.007%
Otter Tail 1,423,973 0.036%
Stevens 368,359 0.014%
Traverse 375,292 0.004%
Regulated Industrial Stormwater
Industrial stormwater is regulated by NPDES permits if the industrial activity has the potential for significant materials and activities to be exposed to stormwater discharges. The WLA for stormwater discharges from sites where there is industrial activity reflects the number of sites in an impaired lake or stream subwatershed for which NPDES Industrial Stormwater Permit coverage is required.
A categorical WLA was assigned to all industrial activity in each impaired lake or stream subwatershed. The industrial stormwater WLA was set equal to the construction stormwater WLA because industrial activities make up a very small fraction of the watershed area.
Feedlots Requiring NPDES/SDS Permit Coverage
Animal waste, containing P, can be transported in watershed runoff to surface waters. The primary goal of the state feedlot program is to ensure that surface waters are not contaminated by runoff from feedlots, manure storage or stockpiles, and cropland with improperly applied manure. AFOs that either: (a) have a capacity of 1,000 AUs or more, or (b) meet or exceed the EPA’s CAFO threshold and discharge to Waters of the United States, are required to apply for permit coverage through the MPCA. If item (a) is triggered, the permit can be an SDS or NPDES/SDS permit; if item (b) is triggered, the permit must be an NPDES permit. These permits require that the feedlots have zero discharge to surface water. There is

Bois de Sioux River Watershed TMDL • DRAFT 2018 Minnesota Pollution Control Agency
73
one active NPDES permitted feedlot operations (CAFO) within a P impaired stream reach drainage area, in the BdSRW. The number of animals registered with the MPCA was verified by an Environmental Services or Feedlot officer for each county located in the BdSRW in the spring of 2014 (Table 41). This facility was assigned a zero WLAconsistent with the conditions of the permit, which allows no discharge of pollutants from the production area of the NPDES permitted feedlot.
Table 41. NPDES permitted feedlot operation number of animals Stream Reach Feedlot Name Permit # CAFO Beef
-512 Chad Hasbargen Farm Sec 2 MN0069744 Y 1,450
Municipal and Industrial Waste Water Treatment Systems
An individual WLA was provided for one NPDES-permitted wastewater treatment facility (WWTF) whose surface discharge stations fall within a P impaired stream subwatershed (city of Campbell in the Rabbit River system, AUID 09020101-502). This WWTF is a pond system, and past discharge monitoring records for the city of Campbell indicate that this facility does not usually discharge in June nor September due to surplus capacity ponds (designed to hold 215 days’ worth of hydraulic capacity). The city of Doran is served by a community mound system, which does not discharge to surface waters.
The NPDES permits allow for two discharge windows between March 1 and June 30, and between September 1 and December 31, annually. Normally, WWTFs are only allowed to discharge six inches of volume from the secondary pond system in a 24-hour period. However, there is not sufficient stream assimilative capacity in the month of June and September for the city of Campbell to discharge.
Minn-Dak Farmers’ Cooperative is a sugar beet processing company that owns and operates five remote storage facilities (piling grounds) in Minnesota. The piling grounds are used for the temporary storage of sugar beets after harvesting, but prior to processing. The beet piling grounds/sites are designed to capture all liquid discharges in on-site sedimentation ponds. There is one sedimentation pond at each piling site. Effluent from each pond is discharged through a pump discharge station at a rate of 500 gallons per minute (gpm) which is the rated pump capacity for all of the pumping systems at each site. Two piling grounds are located in a P impaired stream drainage area, but only one piling ground is hydrologically connected via surface water to the impaired stream.
The WLAs were calculated based on the design flow and the daily TP effluent concentration assumption, expressed in kilograms per day (kg/day) (Table 42). At the lower flow regimes, the design flows are much greater than the flow in the Rabbit River, and therefore the facilities would need to discharge at P concentrations near the stream target.
To meet the assumptions of the TMDL, the city of Campbell will only be allowed to discharge in June and September at a TP effluent concentration assumption of 1.0 mg/L when the Rabbit River flow at USGS gage 05051000 is equal to or greater than the TMDL median low flow regime value of 12 cubic feet per second (cfs), which corresponds to the minimum flow whereby the facility can discharge at a TP effluent concentration assumption of 1.0 mg/L without causing the receiving stream to exceed the stream TP target.
The Hawes piling ground will be allowed to either discharge in the months of June through September at a TP effluent concentration assumption of 0.15 mg/L (the stream TP target) when the stream flow at the

Bois de Sioux River Watershed TMDL • DRAFT 2018 Minnesota Pollution Control Agency
74
Rabbit River USGS gage 05051000 is less than 12 cfs, or at a TP effluent concentration assumption of 1.0 mg/L when the stream flow at the Rabbit River USGS gage 05051000 is equal to or greater than 12 cfs.
To meet the Rabbit River (-502) P loading capacity, a requirement in the city of Campbell WWTF and Hawes Piling Ground NPDES Permits will be added to only allow discharge at a TP effluent concentration assumption of 1.0 mg/L in the months of June and September when the stream flow at the Rabbit River USGS gage 05051000 is equal to or greater than 12 cfs. A stage-discharge rating curve has been developed at this gage by the DNR/MPCA and can be used to determine the equivalent stream stage at 12 cfs. The WWTF and piling ground operators will be required by their NPDES permit to verify the stream stage/flow on the day prior to discharging from their ponds. Past discharge monitoring records for the city of Campbell indicate that this facility does not usually discharge in June or September. A second provision will be included in the Hawes Piling Ground NPDES permit to allow discharge in the months of June through September at a TP effluent concentration assumption of 0.15 mg/L (the stream TP target) when the stream flow at the Rabbit River USGS gage 05051000 is less than 12 cfs. No restrictions on discharge are needed for the non-growing season (October through May).
To meet the Bois de Sioux River (-501) P loading capacity assumptions, daily TP effluent concentration assumptions were determined for WWTFs that discharge to the Mustinka River, upstream of Mud Lake (Table 43).
Table 42. WWTF design flows, daily TP effluent concentration assumptions and WLAs within the BdSRW
Impaired Reach Facility NAME Permit #
Secondary Pond Area
(acres)
Discharge volume (mgd)
Daily TP Effluent
Concentration Assumption
(mg/L) Daily TP WLA
(kg/day)
-502 city of Campbell MN0020915 1.75 0.285 1.0 1.08
-502 Hawes Piling Ground MN0070386 n/a 0.39 1.0* 1.48*
0.15** 0.22** * Applicable when stream flow at the Rabbit River USGS gage 05051000 is equal to or greater than 12 cfs ** Applicable when stream flow at the Rabbit River USGS gage 05051000 is less than 12 cfs Table 43. WWTF design flows and annual TP load assumptions within the Mustinka River Watershed
Facility NAME Permit #
Annual Wet Weather Discharge
Volume (mgd)
Daily TP Effluent Concentration
Assumption (mg/L)
Annual TP Load (kg/yr)
Big Stone Hutterite Colony MNG580168 0.0104 1.5 21.6
city of Dumont MN0064831 0.0149 1.5 30.9
city of Elbow Lake MNG580082 0.2079 2.0 574.4
city of Graceville MNG580159 0.1256 2.0 347.0
city of Herman MNG580177 0.1015 1.0 140.2
city of Wendell MNG580153 0.0195 1.0 26.9
city of Wheaton MN0047287 0.2350 0.5 162.3

Bois de Sioux River Watershed TMDL • DRAFT 2018 Minnesota Pollution Control Agency
75
Margin of Safety An explicit 10% MOS was accounted for in the TMDL for each impaired lake. This MOS is sufficient to account for uncertainties in predicting P loads to lakes and predicting how lakes respond to changes in P loading. This explicit MOS is considered to be appropriate based on:
· precedence for using an explicit 10% MOS in most other lake TMDLs in Minnesota;
· BATHTUB model calibration using added internal load with values typical of very shallow, eutrophic lakes (see Section 3.6.1.2: Internal Loading);
· the generally good agreement between BATHTUB model predicted and observed values indicating that the models reasonably reflect the conditions in the lakes and their subwatersheds; and
· three or more years of in-lake water quality data used to calibrate the BATHTUB model.
An explicit MOS equal to 10% of the loading capacity was used for the stream TMDLs based on the following considerations:
· Most of the uncertainty in flow is the result of extrapolating flows in upstream areas of the watershed based on HSPF model calibration at stream gages near the outlet of the BdSRW. The explicit MOS, in part, accounts for this; and
· Allocations are a function of flow, which varies from high to low flows. This variability is accounted for through the development of a TMDL for each of five flow regimes.
Seasonal Variation
In-lake and in-stream water quality varies seasonally. In Minnesota lakes and streams, the majority of the watershed P load often enters the lake during the spring. During the growing season months (June through September), P concentrations may not change drastically if major runoff events do not occur. However, Chl-a concentrations may still increase throughout the growing season due to warmer temperatures fostering higher algal growth rates. In shallow lakes, the P concentration more frequently increases throughout the growing season due to the additional P load from internal sources. This can lead to even greater increases in Chl-a since not only is there more P but temperatures are also higher. This seasonal variation is taken into account in the TMDL by using the eutrophication standards (which are based on growing season averages) as the TMDL goals. The eutrophication standards were set with seasonal variability in mind. The load reductions are designed so that the lakes and streams will meet the water quality standards over the course of the growing season (June through September).
Critical conditions in these lakes occur during the growing season, which is when the lakes are used for aquatic recreation. Similar to the manner in which the standards take into account seasonal variation, since the TMDL is based on growing season averages, the critical condition is covered by the TMDL.
Critical conditions and seasonal variation in stream water quality are also addressed in this TMDL through the use of LDCs and the evaluation of load variability in five flow regimes, from high flows such as flood events, to low flows such as base flow. Through the use of LDCs, P loading was evaluated at actual flow conditions at the time of sampling (and by month).

Bois de Sioux River Watershed TMDL • DRAFT 2018 Minnesota Pollution Control Agency
76
TMDL Summary
Ash Lake (26-0294-00) TP TMDL
Table 44. Ash Lake TP TMDL and Allocations
Ash Lake Load Component
Existing Goal Reduction
(kg/yr) (kg/yr) (kg/day) (kg/yr) (%)
Wasteload Allocations
Construction stormwater (MNR100001) 0.025 0.025 0.0001 0.0 0%
Industrial stormwater (MNR50000) 0.025 0.025 0.0001 0.0 0%
Total WLA 0.05 0.05 0.0001 0.0
Load Allocations*
Watershed runoff 573.2 269.4 0.738 303.8 53%
Livestock 0.21 0.10 0.000 0.1 53%
Failing septics 0.0 0.0 0.000 0.0 0%
Internal load 0.0 0.0 0.000 0.0 0%
Total Watershed/In-lake 573.4 269.5 0.738 303.9 53%
Atmospheric 18.1 18.1 0.050 0.0 0%
Total LA 591.5 287.6 0.788 303.9
MOS 32.0 0.088
TOTAL 591.5 319.6 0.876 303.9 51%
*LA components are broken down for guidance in implementation planning; loading goals for these components may change through the adaptive implementation process, but the total LA for each lake will not be modified from the total listed in the table above.
Phosphorus Source Summary
· Approximately 80%of the subwatershed is cropland or developed.
· The lake is extremely shallow (max depth of 2.5 feet) and mixing of sediments into the water column can contribute to internal P load (see Section 3.5.1.1).
· Ash Lake is managed for wildlife habitat and water quality through the DNR Shallow Lakes Program. A lake level drawdown occurred in 2012, which has re-established aquatic vegetation and reduced algae levels to promote a clear water state.

Bois de Sioux River Watershed TMDL • DRAFT 2018 Minnesota Pollution Control Agency
77
Upper Lightning Lake (56-0957-00) TP TMDL
Table 45. Upper Lightning Lake TP TMDL and Allocations
Upper Lightning Lake Load Component
Existing Goal Reduction
(kg/yr) (kg/yr) (kg/day) (kg/yr) (%)
Wasteload Allocations
Construction stormwater (MNR100001) 0.2 0.2 0.0005 0.0 0%
Industrial stormwater (MNR50000) 0.2 0.2 0.0005 0.0 0%
Total WLA 0.4 0.4 0.0010 0.0
Load Allocations*
Watershed runoff 742.0 517.2 1.417 224.8 30%
Livestock 0.0 0.0 0.000 0.0 0%
Failing septics 0.0 0.0 0.000 0.0 0%
Internal load 129.4 129.4 0.355 0.0 0%
Total Watershed/In-lake 871.4 646.6 1.771 224.8 26%
Atmospheric 73.4 73.4 0.201 0.0 0%
Total LA 944.8 720.0 1.972 224.8
MOS 80.0 0.219
TOTAL 945.2 800.4 2.192 224.8 24%
*LA components are broken down for guidance in implementation planning; loading goals for these components may change through the adaptive implementation process, but the total LA for each lake will not be modified from the total listed in the table above.
Phosphorus Source Summary
· Approximately 79% of the subwatershed is cropland or developed.
· The lake is extremely shallow (max depth of eight feet) and mixing of sediments into the water column can contribute to internal P load (see Section 3.5.1.1).
· Upper Lightning Lake is managed by the DNR Shallow Lakes program for wildlife habitat and water quality. A pump and lift station are planned for installation at the lake outlet to manage lake levels with a goal of re-establishing aquatic vegetation and reducing algae levels to promote a clear water state.

Bois de Sioux River Watershed TMDL • DRAFT 2018 Minnesota Pollution Control Agency
78
Bois de Sioux River (09020101-501) TP TMDL
Figure 40. Bois de Sioux River (09020101-501) TP Load Duration Curve
The LDC is the TP standard load at 0.15 mg/L. Plotted sample loads are based on monitored TP concentrations from station S000-553 collected between 2001 and 2006.

Bois de Sioux River Watershed TMDL • DRAFT 2018 Minnesota Pollution Control Agency
79
Table 46. Bois de Sioux River (09020101-501) TP TMDL and Allocations
Bois de Sioux River 09020101-501
Load Component
Flow Regime
Very High High Mid Dry Very Dry
Total Phosphorus (kg/day)
Existing Load 2,430.3 979.9 134.3 8.8 1.3
Wasteload Allocations
Construction Stormwater (MNR100001) 0.075 0.031 0.005 0.00003 0.00001
Industrial Stormwater (MNR500000) 0.075 0.031 0.005 0.00003 0.00001
Total WLA 0.15 0.06 0.010 0.00006 0.00002
Load Allocations
Rabbit River (-502) 261.2 31.9 10.7 4.0 0.1
Watershed Runoff* 468.4 193.4 32.4 0.1 0.3
Total LA 729.6 225.3 43.1 4.1 0.4
10% MOS 81.1 25.0 4.8 0.5 0.04
Total Loading Capacity 810.8 250.4 47.9 4.6 0.4
Estimated Load Reduction 1,620 729 86 4 1
67% 74% 64% 48% 68% * The watershed runoff goal assumes that Mud Lake discharges at a growing season (June-September) average TP concentration of 150 ug/L. See Table 47 for Mud Lake suggested phosphorus load goals and reductions by pollutant source.

Bois de Sioux River Watershed TMDL • DRAFT 2018 Minnesota Pollution Control Agency
80
Table 47. Mud Lake Suggested Goals and Reductions by Pollutant Source Mud Lake
Suggested Load Component Existing Goal Reduction (kg/yr) (kg/yr) (kg/day) (kg/yr) (%)
Suggested Wasteload Allocations
Big Stone Hutterite Colony WWTF (MNG580168) 21.6 21.6 0.1 0.0 0%
Dumont WWTF (MN0064831) 30.9 30.9 0.1 0.0 0%
Elbow Lake WWTF (MNG580082) 574.4 574.4 1.6 0.0 0%
Graceville WWTF (MNG580159) 347.0 347.0 1.0 0.0 0%
Herman WWTF (MNG580177) 140.2 140.2 0.4 0.0 0%
Wendell WWTF (MNG580153) 26.9 26.9 0.1 0.0 0%
Wheaton WWTF (MN0047287) 162.3 162.3 0.4 0.0 0%
Construction stormwater (MNR100001) 0.02 0.02 0.00006 0.0 0%
Industrial stormwater (MNR500000) 0.02 0.02 0.00006 0.0 0%
Total WLA 1,303.44 1,303.44 3.6 0.0
Suggested Load
Allocations*
Watershed runoff 5,054.0 1,265.7 3.5 3,788.4 75% Livestock 0.0 0.0 0.0 0.0 0%
Failing septics 0.4 0.0 0.0 0.4 100% Lake Traverse** 11,449.5 11,449.5 31.4 0.0 0%
Mustinka River*** 34,181.7 22,727.2 62.3 11,454.5 34% Internal load 86,751.7 2,030.5 5.6 84,721.2 98%
Total Watershed/In-lake 137,437.3 37,472.9 102.7 99,964.5 73% Atmospheric 260.0 260.0 0.7 0.0 0%
Total LA 137,697.3 37,732.9 103.4 99,964.5 MOS 2,873.1 7.9 TOTAL 139,000.8 41,909.4 114.8 99,964.5 72%
*LA components are broken down for guidance in implementation planning; loading goals for these components may change through the adaptive implementation process, but the total LA for each lake will not be modified from the total listed in the table above. **A separate existing and goal condition BATHTUB model was constructed for Lake Traverse to aid implementation planning for load reductions to Lake Traverse. See Table 48 below. ***The Mustinka River, addressed by a separate TMDL study, flows into Lake Traverse just upstream of the outlet to Mud Lake. It was assumed for this model that negligible sedimentation of Mustinka River phosphorus loads occur in Lake Traverse prior to entering Mud Lake. The LA goal for the Mustinka River assumes that the river eutrophication standards (RES) are met (see Section 2.2.3). Note that the Mustinka River is not currently impaired for eutrophication.
Phosphorus Source Summary
· Approximately 65% of the subwatershed is cropland or developed.
· One impaired lake (Lake Traverse) discharges into Mud Lake.
· The lake is extremely shallow (max depth of 3.5 feet) with a long fetch and mixing of sediments into the water column can contribute to internal P load (see Section 3.5.1.1).
· Mud Lake has a high potential for winter fish kills.

Bois de Sioux River Watershed TMDL • DRAFT 2018 Minnesota Pollution Control Agency
81
Table 48. Lake Traverse Suggested Goals and Reductions by Pollutant Source
Lake Traverse Suggested Load Component
Existing Goal Reduction (kg/yr) (kg/yr) (kg/day) (kg/yr) (%)
Suggested Wasteload Allocations
Construction stormwater (MNR100001) 0.14 0.14 0.0004 0.0 0%
Industrial stormwater (MNR500000) 0.14 0.14 0.0004 0.0 0%
Total WLA 0.28 0.28 0.0008 0.0
Suggested Load
Allocations*
Watershed runoff 30,692.1 6,586.5 18.0 24,105.6 79% Livestock 1.6 0.3 0.0 1.2 79%
Failing septics 9.3 0.0 0.0 9.3 100% Internal load 61,205.5 12,879.1 35.3 48,326.4 79%
Total Watershed/In-lake 91,908.5 19,465.9 53.3 72,442.6 79% Atmospheric 1,166.0 1,166.0 3.2 0.0 0%
Total LA 93,074.5 20,631.9 56.5 72,442.6 MOS 2,162.9 5.9 TOTAL 93,074.8 22,795.1 62.5 72,442.6 78%
*LA components are broken down for guidance in implementation planning; loading goals for these components may change through the adaptive implementation process, but the total LA for each lake will not be modified from the total listed in the table above.
Phosphorus Source Summary
· Approximately 69% of the subwatershed is cropland or developed.
· The lake is extremely shallow (max depth of 12 feet) with a very long fetch and mixing of sediments into the water column can contribute to internal P load (see Section 3.5.1.1).

Bois de Sioux River Watershed TMDL • DRAFT 2018 Minnesota Pollution Control Agency
82
Rabbit River (09020101-502) TP TMDL
Figure 41. Rabbit River (09020101-502) TP Load Duration Curve
The LDC is the TP standard load at 0.15 mg/L. Plotted sample loads are based on monitored TP concentrations from station S001-029 collected between 2001 and 2006.

Bois de Sioux River Watershed TMDL • DRAFT 2018 Minnesota Pollution Control Agency
83
Table 49. Rabbit River (09020101-502) TP TMDL and Allocations
Rabbit River 09020101-502
Load Component
Flow Regime
Very High High Mid Dry Very Dry
Total Phosphorus (kg/day)
Existing Load 1,280.9 128.2 27.9 11.5 1.9
Wasteload Allocations
Campbell WWTF (MN0020915) 1.08 1.08 1.08 1.08 * Hawes Piling Grounds
(MN0070386) 1.48 1.48 1.48 1.48 0.22
Construction Stormwater (MNR100001) 0.038 0.004 0.001 0.0001 0.00001
Industrial Stormwater (MNR500000) 0.038 0.004 0.001 0.0001 0.00001
NPDES Permitted Feedlots 0 0 0 0 0
Total WLA 2.6 2.6 2.6 2.6 0.22
Load Allocations
Rabbit River - South Fork (-512) 20.7 3.4 1.3 0.6 0.02
Watershed Runoff 237.9 25.9 6.8 0.8 0.07
Total LA 258.6 29.3 8.1 1.4 0.09
10% MOS 29.0 3.5 1.2 0.4 0.03
Total Loading Capacity 290.2 35.4 11.9 4.4 0.34
Estimated Load Reduction 991 93 16 7 1.6
77% 72% 57% 61% 82% * See Section 4.1.3.5 for WLA methodology in the lower flow zones

Bois de Sioux River Watershed TMDL • DRAFT 2018 Minnesota Pollution Control Agency
84
Rabbit River – South Fork (09020101-512) TP TMDL
Figure 42. Rabbit River – South Fork (09020101-512) TP Load Duration Curve
The LDC is the TP standard load at 0.15 mg/L. No TP monitoring data were available between 2002 and 2011.

Bois de Sioux River Watershed TMDL • DRAFT 2018 Minnesota Pollution Control Agency
85
Table 50. Rabbit River – South Fork (09020101-512) TP TMDL and Allocations
Rabbit River - South Fork 09020101-512
Load Component
Flow Regime Very High High Mid Dry Very Dry
Total Phosphorus (kg/day)
Existing Load NA NA NA NA NA
Wasteload Allocations
Construction Stormwater
(MNR100001) 0.003 0.001 0.0002 0.00009 0.000002
Industrial Stormwater (MNR500000) 0.003 0.001 0.0002 0.00009 0.000002
NPDES Permitted Feedlots 0 0 0 0 0
Total WLA 0.006 0.002 0.0004 0.00018 0.000004
Load Allocations
Watershed runoff 20.7 3.4 1.3 0.5 0.02
Total LA 20.7 3.4 1.3 0.5 0.02
10% MOS 2.3 0.4 0.1 0.1 0.002
Total Loading Capacity 23.0 3.8 1.4 0.6 0.02
Estimated Load Reduction NA NA NA NA NA
NA NA NA NA NA
TMDL Baseline The stream P TMDLs are based on modeling results for the period 2001 through 2006 (see HSPF modeling). Any activities implemented during or after 2006 that lead to a reduction in loads or an improvement in an impaired stream water quality may be considered as progress towards meeting a WLA or LA.
Turbidity/TSS
Loading Capacity Methodology The loading capacities for impaired stream reaches receiving a TMDL, as a part of this study, were determined using LDCs. Flow and LDCs are used to determine the flow conditions (flow regimes) under which exceedances occur. Flow duration curves provide a visual display of the variation in flow rate for the stream. The x-axis of the plot indicates the percentage of time that a flow exceeds the corresponding flow rate as expressed by the y-axis. LDCs take the flow distribution information, constructed for the stream, and factor in pollutant loading to the analysis. A standard curve is developed by applying a particular pollutant standard or criteria to the stream flow duration curve and is expressed as a load of pollutant per day. The standard curve represents the upper limit of the allowable in-stream pollutant load (loading capacity) at a particular flow. Monitored loads of a pollutant are plotted against this curve to display how they compare to the standard. Monitored values that fall above the curve represent an exceedance of the standard.

Bois de Sioux River Watershed TMDL • DRAFT 2018 Minnesota Pollution Control Agency
86
For the stream TMDL derivation, 2002 through 2011 USGS gaged flows (5051300 for -501, and 54017001 for -502 and -512), area-weighted to the outlet of each impaired stream reach, were used to develop flow duration curves. The loading capacities were determined by applying the TSS water quality standard (65 mg/L) to the flow duration curve to produce a TSS standard curve. Loading capacities presented in the allocation tables represent the median TSS load (in kg/day) along the TSS standard curve within each flow regime. A TSS LDC and a TMDL allocation table are provided for each stream in Section 4.2.6. Monitored TSS concentrations for simulation dates within the TSS assessment window (April through September) are plotted along with the TSS standard curve on LDCs. Within each flow duration interval, the existing TSS load is approximated as the median value of monitored TSS loads.
The LDC method is based on an analysis that encompasses the cumulative frequency of historical flow data over a specified period. Because this method uses a long-term record of daily flow volumes, virtually the full spectrum of allowable loading capacities is represented by the resulting curve. In the TMDL tables of this report, only five points on the entire loading capacity curve are depicted (the midpoints of the designated flow zones). However, it should be understood that the entire curve represents the TMDL and is what is ultimately approved by the EPA.
Load Allocation Methodology
LAs represent the portion of the loading capacity that is designated for non-regulated sources of TSS (as described in Section 3.6.3) and a consideration for natural background conditions, that are located downstream of any other impaired waters with TMDLs located in the BdSRW. The remainder of the loading capacity (TMDL) after subtraction of the MOS, atmospheric deposition, and calculation of the WLA was used to determine the LA for each impaired stream on an areal basis.
Wasteload Allocation Methodology
All regulated stormwater and wastewater were assigned a WLA based on the methods described in the following section.
MS4 Regulated Stormwater
There is no MS4 regulated stormwater in the BdSRW.
Regulated Construction Stormwater
Construction stormwater is regulated by NPDES permits for any construction activity disturbing: (a) one acre or more of soil, (b) less than one acre of soil if that activity is part of a "larger common plan of development or sale" that is greater than one acre, or (c) less than one acre of soil, but the MPCA determines that the activity poses a risk to water resources. The WLA for stormwater discharges from sites where there are construction activities reflects the number of construction sites greater than one acre in size and that are expected to be active in the impaired lake or stream subwatershed at any one time.
A categorical WLA was assigned to all construction activity in the each impaired stream or lake subwatershed. First, the average annual fraction of the impaired subwatershed area under construction activity over the past five years was calculated based on the MPCA Construction Stormwater Permit data from January 1, 2007 to October 6, 2012 (Table 40), area-weighted based on the fraction of the subwatershed located in each county. This percentage was multiplied by the watershed runoff load

Bois de Sioux River Watershed TMDL • DRAFT 2018 Minnesota Pollution Control Agency
87
component to determine the construction stormwater WLA. The watershed runoff load component is equal to the total TMDL (loading capacity) minus the sum of the non-watershed runoff load components (atmospheric load, upstream lake loads, internal loads, and MOS).
Table 51. Average Annual NPDES/SDS Construction Stormwater Permit Activity by County (1/1/2007-10/6/2012)
County Total Area
(ac)
Average Annual Construction Activity
(% Total Area)
Big Stone 338,286 0.014%
Grant 368,568 0.007%
Otter Tail 1,423,973 0.036%
Stevens 368,359 0.014%
Traverse 375,292 0.004%
Regulated Industrial Stormwater
Industrial stormwater is regulated by NPDES permits if the industrial activity has the potential for significant materials and activities to be exposed to stormwater discharges. The WLA for stormwater discharges from sites where there is industrial activity reflects the number of sites in an impaired stream subwatershed for which NPDES industrial stormwater permit coverage is required.
A categorical WLA was assigned to all industrial activity in each impaired stream subwatershed. The industrial stormwater WLA was set equal to the construction stormwater WLA because industrial activities make up a very small fraction of the watershed area.
Feedlots Requiring NPDES/SDS Permit Coverage
Animal waste, containing solids, can be transported in watershed runoff to surface waters. The primary goal of the state feedlot program is to ensure that surface waters are not contaminated by runoff from feedlots, manure storage or stockpiles, and cropland with improperly applied manure. AFOs that either: (a) have a capacity of 1,000 AUs or more, or (b) meet or exceed the EPA’s CAFO threshold and discharge to Waters of the United States, are required to apply for permit coverage through the MPCA. If item (a) is triggered, the permit can be an SDS or NPDES/SDS permit; if item (b) is triggered, the permit must be an NPDES permit. These permits require that the feedlots have zero discharge to surface water.
There is one active NPDES permitted feedlot operation (CAFO) within a TSS impaired stream reach drainage area in the BdSRW. The number of animals registered with the MPCA was verified by an Environmental Services or Feedlot officer for each county located in the BdSRW in the spring of 2014. This facility was assigned a zero WLA consistent with the conditions of the permit, which allows no discharge of pollutants from the production area of the NPDES permitted feedlot.
Table 52. NPDES permitted feedlot operations in a TSS impaired stream reach subwatershed Stream Reach Feedlot Name Permit # CAFO Beef
-512 Chad Hasbargen Farm Sec 2 MN0069744 Y 1,450
Municipal and Industrial Waste Water Treatment Systems
Minnesota’s TSS water quality standard is intended to protect aquatic life from the damaging effects of inorganic non-volatile suspended solids (NVSS) to the gills and filter feeding organs of fish and aquatic

Bois de Sioux River Watershed TMDL • DRAFT 2018 Minnesota Pollution Control Agency
88
invertebrates. TSS associated with municipal wastewater discharges are predominantly organic volatile suspended solids (VSS) which do not tend to persist in the environment. WLAs developed for these TMDLs will be expressed in terms of TSS. NPDES permits for WWTFs may contain water quality-based effluent limits that account for the NVSS characteristics of the discharge. Such limits would be consistent with the assumptions and requirements of the TMDLs’ WLAs.
An individual WLA was provided for one NPDES-permitted WWTF, whose surface discharge stations fall within a turbidity impaired stream subwatershed (city of Campbell in the AUID 09020101-502 subwatershed). This WWTF is a pond system. The city of Doran is served by a community mound system, which does not discharge to surface waters. The NPDES permits allow for two discharge windows between March 1 and June 30, and between September 1 and December 31, annually. The WWTFs are only allowed to discharge six inches of volume from the secondary pond system in a 24-hour period. The WLA was calculated based on the design flow and the NPDES/SDS discharge limit of 45 mg/L, expressed in kilograms per day (Table 58).
Minn-Dak Farmers’ Cooperative is a sugar beet processing company that owns and operates five remote storage facilities (piling grounds) in Minnesota. The piling grounds are used for the temporary storage of sugar beets after harvesting, but prior to processing. The beet piling grounds/sites are designed to capture all liquid discharges in on-site sedimentation ponds. There is one sedimentation pond at each piling site. Effluent from each pond is discharged through a pump discharge station at a rate of 500 gpm, which is the rated pump capacity for all of the pumping systems at each site. Two piling grounds are located in a TSS impaired stream drainage area, but only one piling ground is hydrologically connected via surface water to the impaired stream. The WLA was calculated based on the design flow and the NPDES/SDS discharge limit of 30 mg/L, expressed in kilograms per day (Table 53).
Table 53. WWTF design flows and permitted TSS loads
Impaired Reach Facility NAME Permit #
Secondary Pond Area
(acres)
Discharge volume (mgd)
Daily TSS Effluent
Limit (mg/L)
Daily TSS WLA
(kg/day)
-502 Campbell WWTF MN0020915 1.75 0.285 45 48.6
-502 Hawes Piling Ground MN0070386 n/a 0.39 30 44.3
Margin of Safety An explicit MOS equal to 10% of the loading capacity was used for the stream TMDLs based on the following considerations:
· Most of the uncertainty in flow is the result of extrapolating flows in upstream areas of the subwatershed based on HSPF model calibration at stream gages near the outlet of the BdSRW. The explicit MOS, in part, accounts for this; and
· Allocations are a function of flow, which varies from high to low flows. This variability is accounted for through the development of a TMDL for each of five flow regimes.
Seasonal Variation
The TSS water quality standard applies for the period April through September, which corresponds to the open water season when aquatic organisms are most active and when high stream TSS

Bois de Sioux River Watershed TMDL • DRAFT 2018 Minnesota Pollution Control Agency
89
concentrations generally occur. TSS loading varies with the flow regime and season. Spring is associated with large flows from snowmelt, the summer is associated with the growing season as well as periodic storm events and receding stream flows, and the fall brings increasing precipitation and rapidly changing agricultural landscapes.
Critical conditions and seasonal variation are addressed in this TMDL through several mechanisms. The TSS standard applies during the open water months. Data was collected throughout this period. The water quality analysis conducted on these data evaluated variability in flow using five flow regimes: from high flows, such as flood events, to low flows, such as base flow. With LDCs and monthly summary figures, TSS loading was evaluated at actual flow conditions at the time of sampling (and by month).
TMDL Summary
Bois de Sioux River (09020101-501) TSS TMDL
Figure 43. Bois de Sioux River (09020101-501) TSS Load Duration Curve
The LDC is the TSS standard load at 0.65 mg/L. Plotted sample loads are based on monitored TSS concentrations from station S000-553 collected between 2001 and 2006.

Bois de Sioux River Watershed TMDL • DRAFT 2018 Minnesota Pollution Control Agency
90
Table 54. Bois de Sioux River (09020101-501) TSS TMDL and Allocations
Bois de Sioux River 09020101-501
Load Component
Flow Regime
Very High High Mid Dry Very Dry
Total Suspended Solids (kg/day)
Existing Load 466,992 167,209 40,673 1,467 177
Wasteload Allocations
Construction Stormwater (MNR100001) 32.77 13.41 2.20 0.02 0.02
Industrial Stormwater (MNR500000) 32.77 13.41 2.20 0.02 0.02
Total WLA 65.5 26.8 4.4 0.04 0.04
Load Allocations
Rabbit River (-502)* 112,165 13,635 4,645 1,696 42
Watershed Runoff 203,988 83,462 13,722 111 124
Total LA 316,153 97,097 18,367 1,807 166
10% MOS 35,135 10,792 2,041 201 18
Total Loading Capacity 351,354 107,916 20,412 2,008 184
Estimated Load Reduction 115,638 59,293 20,261 NA NA
25% 35% 50% NA NA * The load allocation for the Rabbit River (-502) is based on the sum of the WLA and LA from the Rabbit River (-502) TSS TMDL (see Table 55)

Bois de Sioux River Watershed TMDL • DRAFT 2018 Minnesota Pollution Control Agency
91
Rabbit River (09020101-502) TSS TMDL
Figure 44. Rabbit River (09020101-502) TSS Load Duration Curve
The LDC is the TSS standard load at 0.65 mg/L. Plotted sample loads are based on monitored TSS concentrations from station S001-029 collected between 2001 and 2006.

Bois de Sioux River Watershed TMDL • DRAFT 2018 Minnesota Pollution Control Agency
92
Table 55. Rabbit River (09020101-502) TSS TMDL and Allocations
Rabbit River 09020101-502
Load Component
Flow Regime
Very High High Mid Dry Very Dry
Total Suspended Solids (kg/day)
Existing Load 190,609 13,715 7,825 1,303 207
Wasteload Allocations
Campbell WWTF (MN0020915) 48.6 48.6 48.6 48.6 *
Hawes Piling Grounds (MN0070386) 44.3 44.3 44.3 44.3 *
Construction Stormwater (MNR100001) 16.6 1.9 0.6 0.2 0.01
Industrial Stormwater (MNR500000) 16.6 1.9 0.6 0.2 0.01
NPDES Permitted Feedlots 0 0 0 0 0
Total WLA 126.1 96.7 94.1 93.3 *
Load Allocations
Rabbit River - South Fork (-512)** 8,969 1,495 558 250 6
Watershed Runoff 103,070 12,043 3,992 1,353 *
Total LA 112,039 13,538 4,550 1,603 *
10% MOS 12,463 1,515 516 188 5
Total Loading Capacity 124,628 15,150 5,160 1,884 47
Estimated Load Reduction 65,981 NA 2,665 NA 160
35% NA 34% NA 77%` *The WLA for treatment facilities requiring NPDES permits is based on the design flow. The WLA exceeded Very Low flow regime TMDL allocation to the Rabbit River. The WLA and LA allocations are determined instead by the formula: TSS Allocation = (flow volume contribution from a given source) x (Daily TSS effluent limit in mg/L TSS from Table 53 in Section 4.2.3.5) ** The load allocation for the Rabbit River, South Fork (-512) is based on the sum of the WLA and LA from the Rabbit River, South Fork (-512) TSS TMDL (see Table 56)

Bois de Sioux River Watershed TMDL • DRAFT 2018 Minnesota Pollution Control Agency
93
Rabbit River – South Fork (09020101-512) TSS TMDL
Figure 45. Rabbit River – South Fork (09020101-512) TSS Load Duration Curve
The LDC is the TSS standard load at 0.65 mg/L. No TSS monitoring data were available between 2002 and 2011.
Bois de Sioux River Watershed TMDL • DRAFT 2018 Minnesota Pollution Control Agency
94
Table 56. Rabbit River – South Fork (09020101-512) TSS TMDL and Allocations
Rabbit River - South Fork 09020101-512
Load Component
Flow Regime
Very High High Mid Dry Very Dry
Total Suspended Solids (kg/day)
Existing Load NA NA NA NA NA
Wasteload Allocations
Construction Stormwater
(MNR100001) 1.44 0.24 0.09 0.04 0.001
Industrial Stormwater (MNR500000) 1.44 0.24 0.09 0.04 0.001
NPDES Permitted Feedlots 0 0 0 0 0
Total WLA 2.9 0.5 0.2 0.1 *
Load Allocations
Watershed Runoff 8,966 1,494 558 250 *
Total LA 8,966 1,494 558 250 *
10% MOS 997 166 62 28 1
Total Loading Capacity 9,966 1,660 620 278 7
Estimated Load Reduction NA NA NA NA NA
NA NA NA NA NA *The WLA for treatment facilities requiring NPDES permits is based on the design flow. The WLA exceeded Very Low flow regime TMDL allocation to the Rabbit River. The WLA and LA allocations are determined instead by the formula: TSS Allocation = (flow volume contribution from a given source) x (Daily TSS effluent limit in mg/L TSS from Table 53 in Section 4.2.3.5)
TMDL Baseline The stream TSS TMDLs are based on modeling results for the period 2001 through 2006 (see HSPF modeling). Any activities implemented during or after 2006 that lead to a reduction in loads or an improvement in an impaired stream water quality may be considered as progress towards meeting a WLA or LA.
Bacteria (E. coli)
Loading Capacity Methodology The loading capacities for impaired stream reaches receiving a TMDL as a part of this study were determined using LDCs. Flow and LDCs are used to determine the flow conditions (flow regimes) under which exceedances occur. Flow duration curves provide a visual display of the variation in flow rate for the stream. The x-axis of the plot indicates the percentage of time that a flow exceeds the corresponding flow rate as expressed by the y-axis. LDCs take the flow distribution information constructed for the stream and factor in pollutant loading to the analysis. A standard curve is developed by applying a particular pollutant standard or criteria to the stream flow duration curve and is expressed as a load of pollutant per day. The standard curve represents the upper limit of the allowable in-stream pollutant load (loading capacity) at a particular flow. Monitored loads of a pollutant are plotted against this curve to display how they compare to the standard. Monitored values that fall above the curve represent an exceedance of the standard.

Bois de Sioux River Watershed TMDL • DRAFT 2018 Minnesota Pollution Control Agency
95
For the -501 and -502 TMDL derivation, 2002 through 2011 USGS gaged flows (5051300 for -501 and 54017001 for -502), area-weighted to the outlet of each impaired stream reach, were used to develop flow duration curves. For the -510 TMDL derivation, 2002 through 2011 USGS gaged flows (54017001), volume weighted to the E. coli monitoring station using the HSPF model, were used to develop flow duration curves. The loading capacities were determined by applying the E. coli water quality standard (126 org./ 100 ml) to the flow duration curve to produce a bacteria standard curve. Loading capacities presented in the allocation tables represent the median E. coli load (in billion org./day) along the bacteria standard curve within each flow regime. A bacteria LDC and a TMDL allocation table are provided for each stream in Section 4.3.6. Monitored E. coli concentrations for simulation dates within the E. coli assessment window (April through October) are plotted along with the E. coli standard curve on LDCs. Within each flow duration interval, the existing E. coli load is approximated as the median value of monitored E. coli loads.
The LDC method is based on an analysis that encompasses the cumulative frequency of historical flow data over a specified period. Because this method uses a long-term record of daily flow volumes virtually the full spectrum of allowable loading capacities is represented by the resulting curve. In the TMDL tables of this report, only five points on the entire loading capacity curve are depicted (the midpoints of the designated flow zones). However, it should be understood that the entire curve represents the TMDL and is what is ultimately approved by the EPA.
Load Allocation Methodology
LAs represent the portion of the loading capacity that is designated for non-regulated sources of E. coli (as described in Section 3.6.2) and a consideration for natural background conditions, that are located downstream of any other impaired waters with TMDLs located in the BdSRW. The remainder of the loading capacity (TMDL) after subtraction of the MOS and calculation of the WLA was used to determine the LA for each impaired stream, on an areal basis.
Wasteload Allocation Methodology
MS4 Regulated Stormwater
There is no MS4 regulated stormwater in the BdSRW.
Regulated Construction Stormwater
E. coli WLAs for regulated construction stormwater (Permit #MNR100001) were not developed since E. coli is not a typical pollutant from construction sites.
Regulated Industrial Stormwater
There are no E. coli benchmarks associated with the Industrial Stormwater Permit because no industrial sectors regulated under the permit are known to be E. coli sources. Therefore, E. coli TMDLs will not include an industrial stormwater WLA.
Feedlots Requiring NPDES/SDS Permit Coverage
Animal waste, containing fecal contamination (E. coli), can be transported in watershed runoff to surface waters. The primary goal of the state feedlot program is to ensure that surface waters are not contaminated by runoff from feedlots, manure storage or stockpiles, and cropland with improperly

Bois de Sioux River Watershed TMDL • DRAFT 2018 Minnesota Pollution Control Agency
96
applied manure. AFOs that either: (a) have a capacity of 1,000 AUs or more, or (b) meet or exceed the EPA’s CAFO threshold and discharge to Waters of the United States, are required to apply for permit coverage through the MPCA. If item (a) is triggered, the permit can be an SDS or NPDES/SDS permit; if item (b) is triggered, the permit must be an NPDES permit. These permits require that the feedlots have zero discharge to surface water.
There is one active NPDES permitted feedlot operation (CAFO) within an E. coli impaired stream reach drainage area, in the BdSRW. The number of animals registered with the MPCA was verified by an Environmental Services or Feedlot officer for each county located in the BdSRW in the spring of 2014. These facilities are assigned a zero WLA consistent with the conditions of the permit, which allows no discharge of pollutants from the production area of the NPDES permitted feedlot.
Table 57. NPDES permitted feedlot operation number of animals Stream Reach Feedlot Name Permit # CAFO Beef
-502 Chad Hasbargen Farm Sec 2 MN0069744 Y 1,450
Municipal and Industrial Waste Water Treatment Systems
An individual WLA was provided for all NPDES-permitted WWTF that have fecal coliform discharge limits (200 org./100ml, March 1 through October 31) and whose surface discharge stations fall within an impaired stream subwatershed. There is one NPDES-permitted WWTF whose surface discharge stations fall within an E. coli impaired stream subwatershed (city of Campbell in the AUID 09020101-502 subwatershed). This WWTF is a pond system. The city of Doran is served by a community mound system, which does not discharge to surface waters.
The NPDES permits allow for two discharge windows between March 1 and June 30, and between September 1 and December 31, annually. The WWTFs are only allowed to discharge six inches of volume from the secondary pond system in a 24-hour period. The WLA was calculated based on the design flow and a permitted fecal coliform effluent limit of 200 org./ 100 ml (Table 58).
The WLAs are based on E. coli loads even though the facilities’ discharge limits are based on fecal coliform. If a discharger is meeting the fecal coliform limits of their permit, it is assumed that they are also meeting the E. coli WLA in these TMDLs.
Minn-Dak Farmers’ Cooperative is a sugar beet processing company that owns and operates five remote storage facilities (piling grounds) in Minnesota. The piling grounds are used for the temporary storage of sugar beets after harvesting, prior to processing. The beet piling grounds/sites are designed to capture all liquid discharges in on-site sedimentation ponds. There is one sedimentation pond at each piling site. Effluent from each pond is discharged through a pump discharge station at a rate of 500 gpm, which is the rated pump capacity for all of the pumping systems at each site. Two piling grounds are located in an E. coli impaired stream drainage area; however, the Minn-Dak effluents are not expected to contain bacteria.

Bois de Sioux River Watershed TMDL • DRAFT 2018 Minnesota Pollution Control Agency
97
Table 58. WWTF design flows and permitted bacteria loads
Impaired Reach Facility Name Permit #
Secondary Pond Area
(acres)
6" per day discharge volume (mgd)
Permitted Bacteria Load
as Fecal Coliform:
200 org./ 100 ml
[billion org./day]
Equivalent Bacteria Load
as E. coli:
126 org. / 100 ml1
[billion org./day]
-502 Campbell WWTF MN0020915 1.75 0.285 2.16 1.4 1 WWTF permits are regulated for fecal coliform, not E. coli. The MPCA surface water quality standard for E. coli (126 org. / 100 ml) was used in place of the fecal coliform permitted limit of 200 org. / 100 ml, which was also the MPCA surface water quality standard prior to the March 2008 revisions to Minn. R. ch. 7050.
Margin of Safety An explicit MOS equal to 10% of the loading capacity was used for the stream TMDLs based on the following considerations:
· Most of the uncertainty in flow is the result of extrapolating flows in upstream areas of the watershed based on HSPF model calibration at stream gages near the outlet of the BdSRW. The explicit MOS, in part, accounts for this;
· Allocations are a function of flow, which varies from high to low flows. This variability is accounted for through the development of a TMDL for each of five flow regimes; and
· With respect to the E. coli TMDLs, the load duration analysis does not address bacteria re-growth in sediments, die-off, and natural background levels. The MOS helps to account for the variability associated with these conditions.
Seasonal Variation
Use of these water bodies for aquatic recreation potentially occurs from April through October, which includes all or portions of the spring, summer, and fall seasons. E. coli loading varies with the flow regime and season. Spring is associated with large flows from snowmelt, the summer is associated with the growing season as well as periodic storm events and receding stream flows, and the fall brings increasing precipitation and rapidly changing agricultural landscapes.
Critical conditions and seasonal variation are addressed in this TMDL through several mechanisms. The E. coli standard applies during the recreational period, and data were collected throughout this period. The water quality analysis conducted on these data evaluated variability in flow using five flow regimes: from high flows, such as flood events, to low flows, such as base flow. Through the use of LDCs and monthly summary figures, E. coli loading was evaluated at actual flow conditions at the time of sampling (and by month), and monthly E. coli concentrations were evaluated against precipitation and stream flow.

Bois de Sioux River Watershed TMDL • DRAFT 2018 Minnesota Pollution Control Agency
98
TMDL Summary
Bois de Sioux River (09020101-501) E. coli TMDL
Figure 46. Bois de Sioux River (09020101-501) E. coli Load Duration Curve
The LDC is the E. coli standard load at 126 org./100 ml. Plotted sample loads are based on monitored E. coli concentrations from station S000-553 collected between 2001 and 2006.

Bois de Sioux River Watershed TMDL • DRAFT 2018 Minnesota Pollution Control Agency
99
Table 59. Bois de Sioux River (09020101-501) E. coli TMDL and allocations
Bois de Sioux River 09020101-501
Load Component
Flow Regime
Very High High Mid Low Very Low
E. coli (billion organisms per day)
Existing Load NA 5,700.7 1,004.1 58.5 0.3
Wasteload Allocations
NPDES Permitted Facilities 0 0 0 0 0
Total WLA 0 0 0 0 0
Load Allocations
Rabbit River (-502)* 2,191.3 272.8 93.4 34.2 1.3
Doran Slough (-510)** 100.7 18.5 6.3 3.2 0.5
Watershed Runoff 3,824.8 1,597.6 261.5 2.6 1.4
Total LA 6,116.8 1,888.9 361.2 40.0 3.2
10% MOS 679.6 209.9 40.1 3.9 0.4
Total Loading Capacity 6,796.4 2,098.8 401.3 43.9 3.6
Estimated Load Reduction NA 3,602 603 15 NA
NA 63% 60% 25% NA * The LA for the Rabbit River (-502) is based on the sum of the WLA and LA from the Rabbit River (-502) E. coli TMDL (see Table 60) ** The LA for the Doran Slough (-510) is based on the sum of the WLA and LA from the Doran Slough (-510) E. coli TMDL (see Table 61)

Bois de Sioux River Watershed TMDL • DRAFT 2018 Minnesota Pollution Control Agency
100
Rabbit River (09020101-502) E. coli TMDL
Figure 47. Rabbit River (09020101-502) E. coli Load Duration Curve
The LDC is the E. coli standard load at 126 org./100 ml. Plotted sample loads are based on monitored E. coli concentrations from station S001-029 collected between 2001 and 2006.

Bois de Sioux River Watershed TMDL • DRAFT 2018 Minnesota Pollution Control Agency
101
Table 60. Rabbit River (09020101-502) E. coli TMDL and allocations
Rabbit River 09020101-502
Load Component
Flow Regime
Very High High Mid Low Very Low
E. coli (billion organisms per day)
Existing Load 16,013 428 78 40 12
Wasteload Allocations
Campbell WWTF (MN0020915) 1.4 1.4 1.4 1.4 *
NPDES Permitted Feedlots 0 0 0 0 0
Total WLA 1.4 1.4 1.4 1.4 *
Load Allocations
Watershed Runoff 2,189.9 271.4 92.0 32.8 *
Total LA 2,189.9 271.4 92.0 32.8 *
10% MOS 243.5 30.3 10.4 3.8 0.1
Total Loading Capacity 2,434.8 303.1 103.8 38.0 1.4
Estimated Load Reduction 13,578 125 NA 2 11
85% 29% NA 4% 88% *The WLA for treatment facilities requiring NPDES permits is based on the design flow. The WLA exceeded Very Low flow regime TMDL allocation to the Rabbit River. The WLA and LA allocations are determined instead by the formula: E. coli Allocation = (flow volume contribution from a given source) x (126 org./100 ml E. coli)

Bois de Sioux River Watershed TMDL • DRAFT 2018 Minnesota Pollution Control Agency
102
Doran Slough (09020101-510) E. coli TMDL
Figure 48. Doran Slough (09020101-510) E. coli Load Duration Curve
The LDC is the E. coli standard load at 126 org./100 ml. Plotted sample loads are based on monitored E. coli concentrations from station S005-144 collected between 2001 and 2006.

Bois de Sioux River Watershed TMDL • DRAFT 2018 Minnesota Pollution Control Agency
103
Table 61. Doran Slough (09020101-510) E. coli TMDL and allocations
Doran Slough 09020101-510
Load Component
Flow Regime
Very High High Mid Low Very Low
Billion organisms per day
Existing Load NA 1.0 1.3 0.5 0.4
Wasteload Allocations
NPDES Permitted Facilities 0 0 0 0 0
Total WLA 0 0 0 0 0
Load Allocations
Watershed Runoff 100.7 18.5 6.3 3.2 0.5
Total LA 100.7 18.5 6.3 3.2 0.5
10% MOS 11.2 2.1 0.7 0.4 0.1
Total Loading Capacity 111.9 20.6 7.0 3.6 0.6
Estimated Load Reduction* NA NA NA NA NA
NA NA NA NA NA * A limited amount of E. coli monitoring data was collected during the time period of the HSPF modeled flows (2001-2006). Therefore, while no load reductions were estimated based on these monitoring data, later monitoring data suggests much higher E. coli concentrations and reductions needed. The geometric average E. coli concentrations in July and August ranged from 198 to 426 org/100mL in this reach (see Table 19 in Section 3.5.5.3 – or reductions of 36% to 70% to achieve monthly geometric averages less than 126 org/100 mL.
TMDL Baseline The stream E. coli TMDLs are based on modeling results for the period 2001 through 2006 (see HSPF modeling). Any activities implemented during or after 2006 that lead to a reduction in loads or an improvement in an impaired stream water quality may be considered as progress towards meeting a WLA or LA.
Impairments not addressed by TMDLs DO and macroinvertebrate/fish bioassessment impairments can sometimes be linked back to a mass pollutant, but those links were not able to be made for four impaired reaches in the BdSRW. A list of the aquatic life use impairments not addressed by TMDL calculations in this study are provided in Table 62. These impairments will be addressed through restoration strategies identified in the WRAPS report and through the One Watershed One Plan process. The Bois de Sioux River WRAPS Report will be publically available on the MPCA’s BdSRW website:
https://www.pca.state.mn.us/water/watersheds/bois-de-sioux-river

Bois de Sioux River Watershed TMDL • DRAFT 2018 Minnesota Pollution Control Agency
104
Table 62. Bois de Sioux River Watershed aquatic life use impairments not addressed by TMDLs AUID Waterbody Name Listed Pollutant or Stressor Reason
09020101-535 Unnamed Creek (Unnamed Cr to Lk Traverse) Fish Bioassessments
Connectivity and hydrological alteration (leading to channel instability and probably low base flow volumes) are the main stressors to aquatic life. Without fixing the connectivity issue at Hwy 27, it is unlikely that addressing other stressors will be very beneficial to the stream fish community. There is probably very limited overwintering habitat in this small stream system, and so the stream would need connection to the lake and lowest reaches of the stream so that fish overwintering in those locations could repopulate the stream above Hwy 27.
09020101-540 County Ditch 52 (Unnamed Cr to Unnamed Cr) Fish Bioassessments
Altered hydrology and fish barriers are the main stressors to aquatic life. The watershed area drained by JD-52 has been enlarged to include land that is in the Mustinka River Watershed. This means that added runoff is sent into JD-52, which is causing serious channel instability problems. Excess sediment from bank erosion is damaging stream habitat. There are also three fish migration barriers (State Hwy 27, Twp. Rd. 18, and CR-66).
09020101-510 Unnamed Creek (Doran Slough) Dissolved Oxygen
Flashiness and lack of flow is the main stressor to aquatic life. Low/no flow periods are problematic in this stream. No field measurements were collected in 2010, 2013, and 2015 due to lack of flow, and an HSPF model run predicted dry periods at numerous points in 2001-2006. Small, very tolerant fish species may be able to survive these periods in pools that retain some water; however, this scenario would not support a diverse fish community and sensitive species would not persist.
09020101-515 Unnamed Creek (Headwaters to Rabbit River) Dissolved Oxygen & Turbidity
MPCA visited this reach in July in 2013, 2014, and 2015 in an attempt to deploy sonde instrumentation for measurement of daily DO fluxes and to collect TP water quality data to link the low DO and turbidity impairments to stream eutrophication. The MPCA observed stagnant or very low flow conditions that are inadequate for sonde deployment and collection of water quality samples during each visit. Given the flow conditions at this site from 2013-2015, intermittent flow and/or altered hydrology -- and resulting high water temperatures -- are likely the most important factors for low DO. As well, decreased stream flow and water movement may result in lower levels of DO due to lower rates of diffusion from the air. Because the cause of low DO in this reach could not be linked to a mass-based pollutant (e.g., phosphorus), a TMDL was not completed for this impairment.

Bois de Sioux River Watershed TMDL • DRAFT 2018 Minnesota Pollution Control Agency
105
5 Future Growth/Reserve Capacity The top economic activity in the BdSRW is agriculture, with 78% of the land in cultivated cropland. Land use is not expected to change much in the future, as it has not changed much in the recent past.
Based on information obtained from the United States Census Bureau, four of the counties in the BdSRW have experienced declining populations from 1990 to 2010 (Grant, Minnesota -3.6% , Traverse, Minnesota -20.3%, Wilkin, Minnesota -12.5%, and Richland, Minnesota -10.0%) and two counties have experienced increasing populations (Ottertail, Minnesota +12.9%and Roberts, South Dakota +2.8%).
How changing sources of pollutants may or may not impact TMDL allocations are discussed below, in the event that population and land use in the BdSRW do change over time.
New or Expanding Permitted MS4 WLA Transfer Process While there are currently no MS4s in the BdSRW, in general, future transfer of watershed runoff loads in a TMDL study may be necessary if any of the following scenarios occur within the project watershed boundaries.
1. New development occurs within a regulated MS4. Newly developed areas that are not already included in the WLA must be transferred from the LA to the WLA to account for the growth.
2. One regulated MS4 acquires land from another regulated MS4. Examples include annexation or highway expansions. In these cases, the transfer is WLA to WLA.
3. One or more non-regulated MS4s become regulated. If this has not been accounted for in the WLA, then a transfer must occur from the LA.
4. Expansion of a U.S. Census Bureau Urban Area encompasses new regulated areas for existing permittees. An example is existing state highways that were outside an Urban Area at the time the TMDL study was completed, but are now inside a newly expanded Urban Area. This will require either a WLA to WLA transfer or a LA to WLA transfer.
5. A new MS4 or other stormwater-related point source is identified and is covered under a NPDES permit. In this situation, a transfer must occur from the LA.
Load transfers will be based on methods consistent with those used in setting the allocations in this TMDL (see Section 4.2.3). One transfer rate was defined for each impaired stream as the total WLA (in kg/day or billion org./day) divided by the watershed area downstream of any upstream impaired waterbody (acres). In the case of a load transfer, the amount transferred from LA to WLA will be based on the area (acres) of land coming under permit coverage multiplied by the transfer rate (in kg/ac-day or billion org./ac-day). The MPCA will make these allocation shifts. In cases where WLA is transferred from or to a regulated MS4, the permittees will be notified of the transfer and have an opportunity to comment.
New or Expanding Wastewater The MPCA, in coordination with the EPA Region 5, has developed a streamlined process for setting or revising WLAs for new or expanding wastewater discharges to waterbodies with an EPA approved TMDL

Bois de Sioux River Watershed TMDL • DRAFT 2018 Minnesota Pollution Control Agency
106
(MPCA 2012). This procedure will be used to update WLAs in approved TMDLs for new or expanding wastewater dischargers whose permitted effluent limits are at or below the in-stream target, and will ensure that the effluent concentrations will not exceed applicable water quality standards or surrogate measures. The process for modifying any and all WLAs will be handled by the MPCA, with input and involvement by the EPA, once a permit request or reissuance is submitted. The overall process will use the permitting public notice process to allow for the public and EPA to comment on the permit changes based on the proposed WLA modification(s). Once any comments or concerns are addressed, and the MPCA determines that the new or expanded wastewater discharge is consistent with the applicable water quality standards, the permit will be issued and any updates to the TMDL WLA(s) will be made.
For more information on the overall process, visit the MPCA’s TMDL Policy and Guidance webpage.

Bois de Sioux River Watershed TMDL • DRAFT 2018 Minnesota Pollution Control Agency
107
6 Reasonable Assurance Non-regulatory
Large in-lake and watershed nonpoint source load reductions were identified for all of the impaired lakes and streams addressed in this TMDL study. In-lake load reductions will be achieved through management of a clear water state. This has been most successful in southwest Minnesota via whole lake drawdowns, which consolidate sediments, reestablish plant communities, and kill the fish community (which is usually dominated by panfish that overgraze zooplankton). The BdSRW WRAPS report addresses how to achieve the significant watershed load reductions needed in this watershed. As part of the WRAPS report, an agricultural conservation planning framework was used to identify nutrient reduction strategies at multiple scales (nutrient management, source control, in-field controls, edge of field controls, and in-stream controls).
At the local level, the Bois de Sioux Watershed District (BdSWD) and the Grant, Otter Tail, Stevens, and Traverse County Soil and Water Conservation Districts (SWCD) currently implement programs that target improving water quality and have been actively involved in projects to improve water quality in the past. Willing landowners within this watershed have implemented many practices in the past including: conservation tillage, cover crops, buffer strips, gully stabilizations, and impoundments. It is assumed that these activities will continue. Information about grants received and projects completed or in progress can be found on the BdSWD Website: http://www.bdswd.com/.
Potential state funding of restoration and protection projects include Clean Water Fund grants. At the federal level, funding can be provided through Section 319 grants that provide cost-share dollars to implement activities in the watershed. Various other funding and cost-share sources exist, which will be listed in the BdSRW WRAPS Report. The implementation strategies described in this plan have been demonstrated to be effective in reducing nutrient loading to lakes and streams. There are programs in place within the watershed to continue implementing the recommended activities. The One Watershed One Plan effort for this watershed is getting underway, and will use the strategies from the WRAPS in developing the plan for prioritized and targeted implementation actions. Monitoring will continue and adaptive management will be in place to evaluate the progress made towards achieving water quality goals.
Regulatory
Regulated Construction Stormwater
State implementation of the TMDL study will be through action on NPDES permits for regulated construction stormwater. To meet the WLA for construction stormwater, construction stormwater activities are required to meet the conditions of the Construction General Permit under the NPDES program and properly select, install, and maintain all BMP required under the permit, including any applicable additional BMP required in Appendix A of the Construction General Permit for discharges to impaired waters, or meet local construction stormwater requirements if they are more restrictive than requirements of the State General Permit.

Bois de Sioux River Watershed TMDL • DRAFT 2018 Minnesota Pollution Control Agency
108
Regulated Industrial Stormwater
To meet the WLA for industrial stormwater, industrial stormwater activities are required to meet the conditions of the industrial stormwater general permit or Nonmetallic Mining & Associated Activities general permit (MNG49) under the NPDES program and properly select, install and maintain all BMP required under the permit.
Wastewater & State Disposal System (SDS) Permits
The MPCA issues permits for WWTFs that discharge into waters of the state. The permits have site specific limits on bacteria that are based on water quality standards. Permits regulate discharges with the goals of: (1) protecting public health and aquatic life, and (2) assuring that every facility treats wastewater. In addition, SDS permits set limits and establish controls for land application of sewage.
Subsurface Sewage Treatment Systems Program (SSTS)
SSTSs, commonly known as septic systems, are regulated by Minn. Stat. §§ 115.55 and 115.56.
These regulations detail:
· Minimum technical standards for individual and mid-size SSTS;
· A framework for local administration of SSTS programs; and
· Statewide licensing and certification of SSTS professionals, SSTS product review and registration, and establishment of the SSTS Advisory Committee.
Feedlot Rules
The MPCA regulates the collection, transportation, storage, processing, and disposal of animal manure and other livestock operation wastes. The MPCA Feedlot Program implements rules governing these activities, and provides assistance to counties and the livestock industry. The feedlot rules apply to most aspects of livestock waste management including the location, design, construction, operation, and management of feedlots and manure handling facilities.
There are two primary concerns about feedlots in protecting water:
· Ensuring that manure on a feedlot or manure storage area does not run into water; and
· Ensuring that manure is applied to cropland at a rate, time, and method that prevents bacteria and other possible contaminants from entering streams, lakes, and ground water.
Nonpoint Source Existing nonpoint source statutes/rules:
· 50-foot buffer required for the shore impact zone of streams classified as protected waters (Minn. Stat. § 103F.201) for agricultural land uses. November 1, 2017 is the deadline for compliance. Currently, 64 of Minnesota’s 87 counties are 60% to 100% in compliance with the buffer law.
· 16.5-foot minimum width buffer required on public drainage ditches (Minn. Stat. § 103E.021). November 1, 2018 is the deadline for compliance.

Bois de Sioux River Watershed TMDL • DRAFT 2018 Minnesota Pollution Control Agency
109
· Protecting highly erodible land within the 300-foot shoreland district (Minn. Stat. § 103F.201).
· Excessive soil loss statute (Minn. Stat. § 103F.415)
· Nuisance nonpoint source pollution (Minn. R. 7050.0210, subp. 2)

Bois de Sioux River Watershed TMDL • DRAFT 2018 Minnesota Pollution Control Agency
110
7 Monitoring Plan Lake and Stream Monitoring
Volunteers throughout the watershed conduct stream and lake condition monitoring through the MPCA Volunteer Monitoring Program. As part of the MPCA Intensive Watershed Monitoring strategy, eight stream sites are monitored for biology (fish and macroinvertebrates) and water chemistry, and a representative set of lakes across a range of conditions and lake type (size and depth) are monitored for water chemistry. Details about the MPCA IWM strategy can be found in the BdSRW Monitoring and Assessment Report: https://www.pca.state.mn.us/sites/default/files/wq-ws3-09020101b.pdf. In addition, the River Watch Program, coordinated by the Bois de Sioux Watershed District, monitors stream temperature, conductivity, DO, and pH at 30 designated sites once a month from April through October.
The DNR conducts lake and stream surveys to collect information about game fish populations, which are then used to evaluate abundance, relative abundance size (length and weight), condition, age and growth, natural reproduction/recruitment, and effects of management actions (stocking and regulations). Other information collected for lake population assessments include basic water quality information (temperature, DO profile, Secchi, pH, and alkalinity), water level and for fish disease and parasites. Additional information collected for lake surveys include lab water chemistry (TP, alkalinity, TDS, Chl-a, Conductivity, pH), watershed characteristics, shoreline characteristics, development, substrates, and aquatic vegetation. In the last few years, the DNR has begun near-shore sampling to develop fish IBIs at lakes in watersheds that have ongoing assessments. The frequency of sampling depends on importance/use. The most important/heavily used lakes are sampled about every five years. Less important/heavily used lakes are sampled every 7, 10, 12, or 15 years. If there is a management action (regulation or stocking) that needs to be evaluated more quickly, sampling could occur every other year. Full surveys are often only done about every 20 years.
BMP Monitoring On-site monitoring of implementation practices should also take place in order to better assess BMP effectiveness. A variety of criteria such as land use, soil type, and other watershed characteristics, as well as monitoring feasibility, will be used to determine which BMPs to monitor. Under these criteria, monitoring of a specific type of implementation practice can be accomplished at one site but can be applied to similar practices under similar criteria and scenarios. Effectiveness of other BMPs can be extrapolated based on monitoring results.

Bois de Sioux River Watershed TMDL • DRAFT 2018 Minnesota Pollution Control Agency
111
8 Implementation Strategy Summary The TMDL study’s results aided in the selection of implementation strategies during the BdSRW WRAPS process. The purpose of the WRAPS process is to support local working groups in developing scientifically supported restoration and protection strategies for subsequent implementation planning. The Bois de Sioux River WRAPS Report will be publically available on the MPCA BdSRW website: https://www.pca.state.mn.us/water/watersheds/bois-de-sioux-river.
Permitted Sources
Construction Stormwater
The WLA for stormwater discharges from sites where there is construction activity reflects the number of construction sites greater than one acre in size, that are expected to be active in the watershed at any one time, and the BMPs and other stormwater control measures that should be implemented at the sites to limit the discharge of pollutants of concern. The BMPs and other stormwater control measures that should be implemented at construction sites are defined in the State's NPDES/SDS General Stormwater Permit for Construction Activity (MNR100001). If a construction site owner/operator obtains coverage under the NPDES/SDS General Stormwater Permit and properly selects, installs and maintains all BMPs required under the permit, including those related to impaired waters discharges and any applicable additional requirements found in Appendix A of the Construction General Permit, the stormwater discharges would be expected to be consistent with the WLA in this TMDL study. All local construction stormwater requirements must also be met.
Industrial Stormwater
The WLA for stormwater discharges from sites where there is industrial activity reflects the number of sites in the watershed for which NPDES Industrial Stormwater Permit coverage is required, and the BMPs and other stormwater control measures that should be implemented at the sites to limit the discharge of pollutants of concern. The BMPs and other stormwater control measures that should be implemented at the industrial sites are defined in the State's NPDES/SDS Industrial Stormwater Multi- Sector General Permit (MNR050000) or NPDES/SDS General Permit for Construction Sand & Gravel, Rock Quarrying and Hot Mix Asphalt Production facilities (MNG490000). If a facility owner/operator obtains stormwater coverage under the appropriate NPDES/SDS Permit and properly selects, installs, and maintains all BMPs required under the permit, the stormwater discharges would be expected to be consistent with the WLA in this TMDL study. All local stormwater management requirements must also be met.
Wastewater
The MPCA issues permits for WWTFs that discharge into waters of the state. The permits have site-specific limits that are based on water quality standards. Permits regulate discharges with the goals of: (1) protecting public health and aquatic life, and (2) assuring that every facility treats wastewater. In addition, SDS permits set limits and establish controls for land application of sewage.

Bois de Sioux River Watershed TMDL • DRAFT 2018 Minnesota Pollution Control Agency
112
Phosphorus
This TMDL includes a new discharge requirements for the city of Campbell WWTF and Minn-dak Hawes Piling Ground. To meet the Rabbit River (-502) P loading capacity, a provision will be included in the city of Campbell WWTF NPDES Permit to prohibit discharge during the months of June and September, due to insufficient stream assimilative capacity to receive their discharge. Past discharge monitoring records for the city of Campbell indicate that this facility does not usually discharge in June nor September due to surplus capacity ponds (designed to hold 215 days’ worth of hydraulic capacity). No restrictions on discharge are needed for the non-growing season (October through May). To meet the Rabbit River P loading capacity, a provision may be included in the Hawes Piling Ground NPDES permit to allow discharge in the months of June through September at a TP effluent concentration assumption of 0.15 mg/L (the stream TP target) when the stream flow at the Rabbit River USGS gage 05051000 is less than 12 cfs, or at a TP effluent concentration assumption of 1.0 mg/L when the stream flow at the Rabbit River USGS gage 05051000 is equal to or greater than 12 cfs.
Non-Permitted Sources
Best Management Practices
A variety of potential BMPs to restore and protect the lakes and streams within the BdSRW have been outlined and prioritized in the WRAPS report. This information from the WRAPS report will inform the One Watershed One Plan process.
Education and Outreach
A crucial part in the success of the restoration and protection efforts that will be designed to clean up the impaired lakes and streams and protect the non-impaired water bodies will be participation from local citizens. In order to gain support from these citizens, education and civic engagement opportunities will be necessary. A variety of educational avenues will be used throughout the BdSRW. These include (but are not limited to): press releases, meetings, workshops, focus groups, trainings, websites, etc. Local staff (conservation district, watershed, county, etc.) and board members work to educate the residents of the watersheds about ways to clean up their lakes and streams on a regular basis. Education will continue throughout the BdSRW.
Technical Assistance
The BdSRWD, counties, and SWCDs within the watershed provide assistance to landowners for a variety of projects that benefit water quality. Assistance provided to landowners varies from agricultural and rural BMPs, to urban and lakeshore BMPs. This technical assistance includes education and one-on-one training. Many opportunities for technical assistance are a result of educational workshops or trainings. It is important that these outreach opportunities for watershed residents continue. Marketing is necessary to motivate landowners to participate in voluntary cost-share assistance programs.
Programs such as state cost share, Clean Water Legacy funding, Environmental Quality Incentives Program (EQIP), and Conservation Reserve Program (CRP) are available to help implement the best conservation practices that each parcel of land is eligible for, and to target the best conservation practices per site. Conservation practices may include, but are not limited to: stormwater bioretention, septic system upgrades, feedlot improvements, invasive species control, wastewater treatment

Bois de Sioux River Watershed TMDL • DRAFT 2018 Minnesota Pollution Control Agency
113
practices, agricultural and rural BMPs, and internal loading reduction. More information about types of practices and implementation of BMPs are discussed in the BdSRW WRAPS Report.
Partnerships
Partnerships with counties, cities, townships, citizens, businesses, watersheds, and lake associations are one mechanism through which the BdSRWD and the Grant, Otter Tail, Traverse, and Wilkins County SWCDs will protect and improve water quality. Strong partnerships with state and local government to protect and improve water resources and to bring waters within the BdSRW into compliance with state standards will continue. A partnership with local government units (LGUs) and regulatory agencies such as cities, townships, and counties may be formed to develop and update ordinances to protect the area’s water resources.
Cost The Clean Water Legacy Act requires that a TMDL study include an overall approximation of the cost to implement the TMDL study (Minn. Stat. 2007, §114D.25).
Phosphorus
An analysis of the cost to implement the P TMDLs was completed as part of the WRAPS process. The total cost to achieve a 54% reduction in P loads watershed-wide was approximately $15.2 million (see Section 3.2, Table 12 and 13 of the Bois de Sioux River WRAPS Report).
TSS
The Clean Water Legacy Act requires that a TMDL study include an overall approximation of the cost to implement the TMDL study (Minn. Stat. 2007, § 114D.25). A detailed analysis of the cost to implement the TSS TMDLs was not conducted. The Group of 16 (G16), an interagency work group (Board of Water Resources, United States Department of Agriculture (USDA), MPCA, Minnesota Association of SWCDs, Minnesota Association of Watershed Districts, Natural Resources and Conservation Service) assessed restoration costs for several TMDL studies with an average cost estimate of $117,000 per square mile for a watershed-based treatment approach. Multiplied by the total area of the TSS-impaired stream watersheds (1,099 square miles) results in a total cost of $129 million.
Bacteria
The cost estimate for bacteria load reduction is based on unit costs for the two major sources of bacteria: livestock and imminent threat to public health septic systems. The unit cost for bringing AUs under manure management plans and feedlot lot runoff controls is $350 per AU. This value is based on USDA EQIP payment history and includes buffers, livestock access control, manure management plans, waste storage structures, and clean water diversions. Repair or replacement of imminent threat to public health septic systems (ITPHSS) was estimated at $7,500/system (EPA 2011). Multiplying those unit costs by an estimated 4 ITPHSS and 373 AU in the impaired reach subwatersheds provides a total cost of approximately $0.16 million.

Bois de Sioux River Watershed TMDL • DRAFT 2018 Minnesota Pollution Control Agency
114
Adaptive Management This list of implementation strategies in the companion WRAPS report prepared alongside this TMDL study was produced with adaptive management (Figure 49) in mind. Continued monitoring and “course corrections” responding to monitoring results are the most appropriate strategy for attaining the water quality goals established in this TMDL study, the WRAPS, and subsequent One Watershed One Plan efforts. Management activities will be changed or refined over time to efficiently meet the TMDLs and lay the groundwork for de-listing the impaired water bodies.
Figure 49. Adaptive Management

Bois de Sioux River Watershed TMDL • DRAFT 2018 Minnesota Pollution Control Agency
115
9 Public Participation
Technical Committee Meetings The BdSRW is made up of numerous local partners who have been involved at various levels throughout the project. The technical committee is made up of members representing the BdSRWD, MPCA, DNR, Counties, and SWCDs within the watershed. Table 63 outlines the meetings that occurred regarding the BdSRW monitoring, TMDL study development, and WRAPS report development. Additional information about technical committee members and meeting agendas can be requested from the MPCA Project Manager listed on the BdSRW webpage: https://www.pca.state.mn.us/water/watersheds/bois-de-sioux-river.
Table 63. Bois de Sioux River Watershed TMDL Technical Committee Meetings Date Location Meeting Focus
March 7, 2013
Bois de Sioux Watershed District Office, Wheaton, MN
Civic Engagement Campaign Update, Stream Geomorphology Methodology, HSPF Modeling Update
January 23, 2014 Impairments, Data Summary, Stressor ID Update
March 8, 2016 TMDL Results and WRAPS Kick-off
Civic Engagement The MPCA along with the local partners and agencies in the BdSRW recognize the importance of public involvement in the watershed process. Table 64 outlines the opportunities used to engage the public and targeted stakeholders in the watershed. Additional information about civic engagement can be requested from the MPCA Project Manager listed on the BdSRW webpage: https://www.pca.state.mn.us/water/watersheds/bois-de-sioux-river.
Table 64. Bois de Sioux River Watershed TMDL Civic Engagement Meetings Date Location Focus
October 2011 Press Release and Radio Spot on KFGO AM Radio’s “Ripple Effects”
Project Kick-off and Stream Stability Assessment Field Work
April 2012 Poster Mailing Health of the Valley Campaign
October 2012 Press Release and Radio Spot on KFGO AM Radio’s “Ripple Effects”
Stream Health and Channel Stability
February 2013 Watershed Restoration and Soil Health
February 27, 2014 City of Campbell Community Center TMDL and WRAPS Open House
Ongoing Project Website: www.healthofthevalley.com
TMDL and WRAPS Process, Events and Documentation
Public Notice
An opportunity for public comment on the draft TMDL report was provided via a public notice in the State Register from April 2, 2018, through May 2, 2018. There were xxxx comment letters received and responded to as a result of the public comment period.
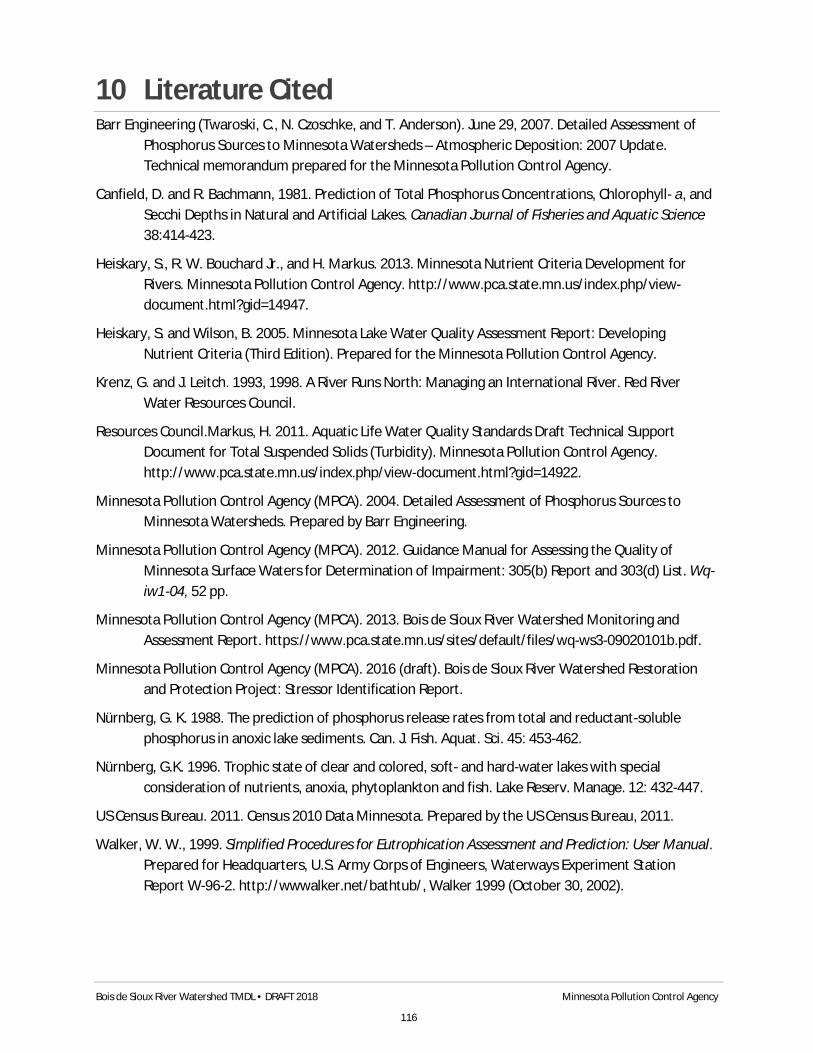
Bois de Sioux River Watershed TMDL • DRAFT 2018 Minnesota Pollution Control Agency
116
10 Literature Cited Barr Engineering (Twaroski, C., N. Czoschke, and T. Anderson). June 29, 2007. Detailed Assessment of
Phosphorus Sources to Minnesota Watersheds – Atmospheric Deposition: 2007 Update. Technical memorandum prepared for the Minnesota Pollution Control Agency.
Canfield, D. and R. Bachmann, 1981. Prediction of Total Phosphorus Concentrations, Chlorophyll- a, and Secchi Depths in Natural and Artificial Lakes. Canadian Journal of Fisheries and Aquatic Science 38:414-423.
Heiskary, S., R. W. Bouchard Jr., and H. Markus. 2013. Minnesota Nutrient Criteria Development for Rivers. Minnesota Pollution Control Agency. http://www.pca.state.mn.us/index.php/view-document.html?gid=14947.
Heiskary, S. and Wilson, B. 2005. Minnesota Lake Water Quality Assessment Report: Developing Nutrient Criteria (Third Edition). Prepared for the Minnesota Pollution Control Agency.
Krenz, G. and J. Leitch. 1993, 1998. A River Runs North: Managing an International River. Red River Water Resources Council.
Resources Council.Markus, H. 2011. Aquatic Life Water Quality Standards Draft Technical Support Document for Total Suspended Solids (Turbidity). Minnesota Pollution Control Agency. http://www.pca.state.mn.us/index.php/view-document.html?gid=14922.
Minnesota Pollution Control Agency (MPCA). 2004. Detailed Assessment of Phosphorus Sources to Minnesota Watersheds. Prepared by Barr Engineering.
Minnesota Pollution Control Agency (MPCA). 2012. Guidance Manual for Assessing the Quality of Minnesota Surface Waters for Determination of Impairment: 305(b) Report and 303(d) List. Wq-iw1-04, 52 pp.
Minnesota Pollution Control Agency (MPCA). 2013. Bois de Sioux River Watershed Monitoring and Assessment Report. https://www.pca.state.mn.us/sites/default/files/wq-ws3-09020101b.pdf.
Minnesota Pollution Control Agency (MPCA). 2016 (draft). Bois de Sioux River Watershed Restoration and Protection Project: Stressor Identification Report.
Nürnberg, G. K. 1988. The prediction of phosphorus release rates from total and reductant-soluble phosphorus in anoxic lake sediments. Can. J. Fish. Aquat. Sci. 45: 453-462.
Nürnberg, G.K. 1996. Trophic state of clear and colored, soft- and hard-water lakes with special consideration of nutrients, anoxia, phytoplankton and fish. Lake Reserv. Manage. 12: 432-447.
US Census Bureau. 2011. Census 2010 Data Minnesota. Prepared by the US Census Bureau, 2011.
Walker, W. W., 1999. Simplified Procedures for Eutrophication Assessment and Prediction: User Manual. Prepared for Headquarters, U.S. Army Corps of Engineers, Waterways Experiment Station Report W-96-2. http://wwwalker.net/bathtub/, Walker 1999 (October 30, 2002).

Bois de Sioux River Watershed TMDL • DRAFT 2018 Minnesota Pollution Control Agency
117
11 Appendix A: BATHTUB Supporting Information Table 65. Ash Lake Calibrated Model Predicted & Observed Values
Table 66. Ash Lake Calibrated Model Water and Phosphorus Balances
Ash LakeFile: X:\Clients_WD\01031_Bois_de_Sioux\0003_BdS_River_WRAP\07_Modeling\BATHTUB\Ash_calibrated.btb
Predicted & Observed Values Ranked Against CE Model Development Dataset
Segment: 1 Ash Lake Predicted Values---> Observed Values--->
Variable Mean CV Rank Mean CV RankTOTAL P MG/M3 146.2 0.27 89.2% 146.2 0.10 89.2%
Ash LakeFile: X:\Clients_WD\01031_Bois_de_Sioux\0003_BdS_River_WRAP\07_Modeling\BATHTUB\Ash_calibrated.btb
Overall Water & Nutrient Balances
Overall Water Balance Averaging Period = 1.00 yearsArea Flow Variance CV Runoff
Trb Type Seg Name km2 hm3/yr (hm3/yr)2 - m/yr1 1 1 Direct Drainage 25.5 1.9 1.43E-01 0.20 0.07
PRECIPITATION 0.7 0.5 2.51E-03 0.10 0.72TRIBUTARY INFLOW 25.5 1.9 1.43E-01 0.20 0.07***TOTAL INFLOW 26.2 2.4 1.46E-01 0.16 0.09ADVECTIVE OUTFLOW 26.2 2.0 1.47E-01 0.19 0.08***TOTAL OUTFLOW 26.2 2.0 1.47E-01 0.19 0.08***EVAPORATION 0.4 1.31E-03 0.10
Overall Mass Balance Based Upon Predicted Outflow & Reservoir ConcentrationsComponent: TOTAL P
Load Load Variance Conc ExportTrb Type Seg Name kg/yr %Total (kg/yr)2 %Total CV mg/m3 kg/km2/yr
1 1 1 Direct Drainage 573.4 96.9% 2.63E+04 99.7% 0.28 303.1 22.5PRECIPITATION 18.1 3.1% 8.18E+01 0.3% 0.50 36.1 26.1TRIBUTARY INFLOW 573.4 96.9% 2.63E+04 99.7% 0.28 303.1 22.5***TOTAL INFLOW 591.5 100.0% 2.64E+04 100.0% 0.27 247.2 22.6ADVECTIVE OUTFLOW 296.9 50.2% 1.15E+04 0.36 146.2 11.4***TOTAL OUTFLOW 296.9 50.2% 1.15E+04 0.36 146.2 11.4***RETENTION 294.6 49.8% 1.11E+04 0.36
Overflow Rate (m/yr) 2.9 Nutrient Resid. Time (yrs) 0.0634Hydraulic Resid. Time (yrs) 0.1262 Turnover Ratio 15.8Reservoir Conc (mg/m3) 146 Retention Coef. 0.498

Bois de Sioux River Watershed TMDL • DRAFT 2018 Minnesota Pollution Control Agency
118
Table 67. Ash Lake TMDL Goal Scenario Model Predicted & Observed Values
Table 68. Ash Lake TMDL Goal Scenario Model Water and Phosphorus Balances
Ash LakeFile: X:\Clients_WD\01031_Bois_de_Sioux\0003_BdS_River_WRAP\07_Modeling\BATHTUB\Ash_goal.btb
Predicted & Observed Values Ranked Against CE Model Development Dataset
Segment: 1 Ash Lake Predicted Values---> Observed Values--->
Variable Mean CV Rank Mean CV RankTOTAL P MG/M3 90.0 0.25 75.8% 146.2 0.09 89.2%
Ash LakeFile: X:\Clients_WD\01031_Bois_de_Sioux\0003_BdS_River_WRAP\07_Modeling\BATHTUB\Ash_goal.btb
Overall Water & Nutrient Balances
Overall Water Balance Averaging Period = 1.00 yearsArea Flow Variance CV Runoff
Trb Type Seg Name km2 hm3/yr (hm3/yr)2 - m/yr1 1 1 Direct Drainage 25.5 1.9 1.43E-01 0.20 0.07
PRECIPITATION 0.7 0.5 2.51E-03 0.10 0.72TRIBUTARY INFLOW 25.5 1.9 1.43E-01 0.20 0.07***TOTAL INFLOW 26.2 2.4 1.46E-01 0.16 0.09ADVECTIVE OUTFLOW 26.2 2.0 1.47E-01 0.19 0.08***TOTAL OUTFLOW 26.2 2.0 1.47E-01 0.19 0.08***EVAPORATION 0.4 1.31E-03 0.10
Overall Mass Balance Based Upon Predicted Outflow & Reservoir ConcentrationsComponent: TOTAL P
Load Load Variance Conc ExportTrb Type Seg Name kg/yr %Total (kg/yr)2 %Total CV mg/m3 kg/km2/yr
1 1 1 Direct Drainage 301.5 94.3% 7.27E+03 98.9% 0.28 159.4 11.8PRECIPITATION 18.1 5.7% 8.18E+01 1.1% 0.50 36.1 26.1TRIBUTARY INFLOW 301.5 94.3% 7.27E+03 98.9% 0.28 159.4 11.8***TOTAL INFLOW 319.6 100.0% 7.36E+03 100.0% 0.27 133.6 12.2ADVECTIVE OUTFLOW 182.8 57.2% 3.79E+03 0.34 90.0 7.0***TOTAL OUTFLOW 182.8 57.2% 3.79E+03 0.34 90.0 7.0***RETENTION 136.8 42.8% 2.63E+03 0.37
Overflow Rate (m/yr) 2.9 Nutrient Resid. Time (yrs) 0.0722Hydraulic Resid. Time (yrs) 0.1262 Turnover Ratio 13.8Reservoir Conc (mg/m3) 90 Retention Coef. 0.428

Bois de Sioux River Watershed TMDL • DRAFT 2018 Minnesota Pollution Control Agency
119
Table 69. Mud Lake Calibrated Model Predicted & Observed Values
Table 70. Mud Lake Calibrated Model Water and Phosphorus Balances
Mud LakeFile: X:\Clients_WD\01031_Bois_de_Sioux\0003_BdS_River_WRAP\07_Modeling\BATHTUB\Mud_wMR_calibrated.btb
Predicted & Observed Values Ranked Against CE Model Development Dataset
Segment: 1 Mud Lake Predicted Values---> Observed Values--->
Variable Mean CV Rank Mean CV RankTOTAL P MG/M3 442.0 0.12 99.3% 442.0 0.22 99.3%
Mud LakeFile: X:\Clients_WD\01031_Bois_de_Sioux\0003_BdS_River_WRAP\07_Modeling\BATHTUB\Mud_wMR_calibrated.btb
Overall Water & Nutrient Balances
Overall Water Balance Averaging Period = 1.00 yearsArea Flow Variance CV Runoff
Trb Type Seg Name km2 hm3/yr (hm3/yr)2 - m/yr1 1 1 Direct Drainage 184.3 8.2 6.64E-01 0.10 0.042 1 1 Lake Traverse 3196.0 53.4 2.85E+01 0.10 0.023 1 1 Mustinka River outflow 2243.7 168.3 2.83E+02 0.10 0.084 3 1 Mustinka River Watershed point sources 1.0 9.75E-03 0.10
PRECIPITATION 10.0 6.1 3.68E-01 0.10 0.61TRIBUTARY INFLOW 5623.9 229.9 3.13E+02 0.08 0.04POINT-SOURCE INFLOW 1.0 9.75E-03 0.10***TOTAL INFLOW 5633.9 236.9 3.13E+02 0.07 0.04ADVECTIVE OUTFLOW 5633.9 231.7 3.13E+02 0.08 0.04***TOTAL OUTFLOW 5633.9 231.7 3.13E+02 0.08 0.04***EVAPORATION 5.3 2.80E-01 0.10
Overall Mass Balance Based Upon Predicted Outflow & Reservoir ConcentrationsComponent: TOTAL P
Load Load Variance Conc ExportTrb Type Seg Name kg/yr %Total (kg/yr)2 %Total CV mg/m3 kg/km2/yr
1 1 1 Direct Drainage 4889.1 3.5% 4.78E+05 1.8% 0.14 599.9 26.52 1 1 Lake Traverse 11449.5 8.2% 2.62E+06 9.9% 0.14 214.4 3.63 1 1 Mustinka River outflow 34181.7 24.6% 2.34E+07 88.1% 0.14 203.0 15.24 3 1 Mustinka River Watershed point sources 1468.8 1.1% 4.31E+04 0.2% 0.14 1487.4
PRECIPITATION 260.0 0.2% 1.69E+04 0.1% 0.50 42.9 26.1INTERNAL LOAD 86751.7 62.4% 0.00E+00 0.00TRIBUTARY INFLOW 50520.3 36.3% 2.65E+07 99.8% 0.10 219.8 9.0POINT-SOURCE INFLOW 1468.8 1.1% 4.31E+04 0.2% 0.14 1487.4***TOTAL INFLOW 139000.8 100.0% 2.65E+07 100.0% 0.04 586.6 24.7ADVECTIVE OUTFLOW 102391.3 73.7% 1.70E+08 0.13 442.0 18.2***TOTAL OUTFLOW 102391.3 73.7% 1.70E+08 0.13 442.0 18.2***RETENTION 36609.5 26.3% 1.47E+08 0.33
Overflow Rate (m/yr) 23.3 Nutrient Resid. Time (yrs) 0.0143Hydraulic Resid. Time (yrs) 0.0194 Turnover Ratio 70.1Reservoir Conc (mg/m3) 442 Retention Coef. 0.263

Bois de Sioux River Watershed TMDL • DRAFT 2018 Minnesota Pollution Control Agency
120
Table 71. Mud Lake Suggested Goal Scenario Model Predicted & Observed Values
Table 72. Mud Lake Suggested Goal Scenario Model Water and Phosphorus Balances
Mud LakeFile: X:\Clients_WD\01031_Bois_de_Sioux\0003_BdS_River_WRAP\07_Modeling\BATHTUB\Mud_wMR_goal150.btb
Predicted & Observed Values Ranked Against CE Model Development Dataset
Segment: 1 Mud Lake Predicted Values---> Observed Values--->
Variable Mean CV Rank Mean CV RankTOTAL P MG/M3 150.0 0.10 89.8% 442.0 0.22 99.3%
Mud LakeFile: X:\Clients_WD\01031_Bois_de_Sioux\0003_BdS_River_WRAP\07_Modeling\BATHTUB\Mud_wMR_goal150.btb
Overall Water & Nutrient Balances
Overall Water Balance Averaging Period = 1.00 yearsArea Flow Variance CV Runoff
Trb Type Seg Name km2 hm3/yr (hm3/yr)2 - m/yr1 1 1 Direct Drainage 184.3 8.2 6.64E-01 0.10 0.042 1 1 Lake Traverse 3196.0 53.4 2.85E+01 0.10 0.023 1 1 Mustinka River outflow 2243.7 168.3 2.83E+02 0.10 0.084 3 1 Mustinka River Watershed point sources 1.0 9.75E-03 0.10
PRECIPITATION 10.0 6.1 3.68E-01 0.10 0.61TRIBUTARY INFLOW 5623.9 229.9 3.13E+02 0.08 0.04POINT-SOURCE INFLOW 1.0 9.75E-03 0.10***TOTAL INFLOW 5633.9 236.9 3.13E+02 0.07 0.04ADVECTIVE OUTFLOW 5633.9 231.7 3.13E+02 0.08 0.04***TOTAL OUTFLOW 5633.9 231.7 3.13E+02 0.08 0.04***EVAPORATION 5.3 2.80E-01 0.10
Overall Mass Balance Based Upon Predicted Outflow & Reservoir ConcentrationsComponent: TOTAL P
Load Load Variance Conc ExportTrb Type Seg Name kg/yr %Total (kg/yr)2 %Total CV mg/m3 kg/km2/yr
1 1 1 Direct Drainage 1222.5 2.9% 2.99E+04 0.2% 0.14 150.0 6.62 1 1 Lake Traverse 11449.5 27.3% 2.62E+06 17.0% 0.14 214.4 3.63 1 1 Mustinka River outflow 25252.5 60.3% 1.28E+07 82.5% 0.14 150.0 11.34 3 1 Mustinka River Watershed point sources 1468.8 3.5% 4.31E+04 0.3% 0.14 1487.4
PRECIPITATION 260.0 0.6% 1.69E+04 0.1% 0.50 42.9 26.1INTERNAL LOAD 2256.1 5.4% 0.00E+00 0.00TRIBUTARY INFLOW 37924.5 90.5% 1.54E+07 99.6% 0.10 165.0 6.7POINT-SOURCE INFLOW 1468.8 3.5% 4.31E+04 0.3% 0.14 1487.4***TOTAL INFLOW 41909.4 100.0% 1.55E+07 100.0% 0.09 176.9 7.4ADVECTIVE OUTFLOW 34737.4 82.9% 1.82E+07 0.12 150.0 6.2***TOTAL OUTFLOW 34737.4 82.9% 1.82E+07 0.12 150.0 6.2***RETENTION 7172.1 17.1% 7.56E+06 0.38
Overflow Rate (m/yr) 23.3 Nutrient Resid. Time (yrs) 0.0160Hydraulic Resid. Time (yrs) 0.0194 Turnover Ratio 62.3Reservoir Conc (mg/m3) 150 Retention Coef. 0.171

Bois de Sioux River Watershed TMDL • DRAFT 2018 Minnesota Pollution Control Agency
121
Table 73. Lake Traverse Calibrated Model Predicted & Observed Values
Table 74. Lake Traverse Calibrated Model Water and Phosphorus Balances
Lake TraverseFile: X:\Clients_WD\01031_Bois_de_Sioux\0003_BdS_River_WRAP\07_Modeling\BATHTUB\Traverse_noMR_calibrated
Predicted & Observed Values Ranked Against CE Model Development Dataset
Segment: 1 Lake Traverse Predicted Values---> Observed Values--->
Variable Mean CV Rank Mean CV RankTOTAL P MG/M3 214.4 0.39 95.2% 214.4 0.06 95.2%
Lake TraverseFile: X:\Clients_WD\01031_Bois_de_Sioux\0003_BdS_River_WRAP\07_Modeling\BATHTUB\Traverse_noMR_calibrated.btb
Overall Water & Nutrient Balances
Overall Water Balance Averaging Period = 1.00 yearsArea Flow Variance CV Runoff
Trb Type Seg Name km2 hm3/yr (hm3/yr)2 - m/yr1 1 1 Direct Drainage 907.7 48.8 9.52E+01 0.20 0.05
PRECIPITATION 44.7 29.7 8.83E+00 0.10 0.67TRIBUTARY INFLOW 907.7 48.8 9.52E+01 0.20 0.05***TOTAL INFLOW 952.4 78.5 1.04E+02 0.13 0.08ADVECTIVE OUTFLOW 952.4 53.4 1.10E+02 0.20 0.06***TOTAL OUTFLOW 952.4 53.4 1.10E+02 0.20 0.06***EVAPORATION 25.1 6.30E+00 0.10
Overall Mass Balance Based Upon Predicted Outflow & Reservoir ConcentrationsComponent: TOTAL P
Load Load Variance Conc ExportTrb Type Seg Name kg/yr %Total (kg/yr)2 %Total CV mg/m3 kg/km2/yr
1 1 1 Direct Drainage 30703.3 33.0% 7.54E+07 99.6% 0.28 629.3 33.8PRECIPITATION 1166.0 1.3% 3.40E+05 0.4% 0.50 39.2 26.1INTERNAL LOAD 61205.5 65.8% 0.00E+00 0.00TRIBUTARY INFLOW 30703.3 33.0% 7.54E+07 99.6% 0.28 629.3 33.8***TOTAL INFLOW 93074.8 100.0% 7.58E+07 100.0% 0.09 1185.6 97.7ADVECTIVE OUTFLOW 11446.0 12.3% 2.54E+07 0.44 214.4 12.0***TOTAL OUTFLOW 11446.0 12.3% 2.54E+07 0.44 214.4 12.0***RETENTION 81628.7 87.7% 6.74E+07 0.10
Overflow Rate (m/yr) 1.2 Nutrient Resid. Time (yrs) 0.2418Hydraulic Resid. Time (yrs) 1.9662 Turnover Ratio 4.1Reservoir Conc (mg/m3) 214 Retention Coef. 0.877

Bois de Sioux River Watershed TMDL • DRAFT 2018 Minnesota Pollution Control Agency
122
Table 75. Lake Traverse Suggested Goal Scenario Model Predicted & Observed Values
Table 76. Lake Traverse Suggested Goal Scenario Model Water and Phosphorus Balances
Lake TraverseFile: X:\Clients_WD\01031_Bois_de_Sioux\0003_BdS_River_WRAP\07_Modeling\BATHTUB\Traverse_noMR_goal.btb
Predicted & Observed Values Ranked Against CE Model Development Dataset
Segment: 1 Lake Traverse Predicted Values---> Observed Values--->
Variable Mean CV Rank Mean CV RankTOTAL P MG/M3 90.0 0.35 75.8% 214.4 0.06 95.2%
Lake TraverseFile: X:\Clients_WD\01031_Bois_de_Sioux\0003_BdS_River_WRAP\07_Modeling\BATHTUB\Traverse_noMR_goal.btb
Overall Water & Nutrient Balances
Overall Water Balance Averaging Period = 1.00 yearsArea Flow Variance CV Runoff
Trb Type Seg Name km2 hm3/yr (hm3/yr)2 - m/yr1 1 1 Direct Drainage 907.7 48.8 9.52E+01 0.20 0.05
PRECIPITATION 44.7 29.7 8.83E+00 0.10 0.67TRIBUTARY INFLOW 907.7 48.8 9.52E+01 0.20 0.05***TOTAL INFLOW 952.4 78.5 1.04E+02 0.13 0.08ADVECTIVE OUTFLOW 952.4 53.4 1.10E+02 0.20 0.06***TOTAL OUTFLOW 952.4 53.4 1.10E+02 0.20 0.06***EVAPORATION 25.1 6.30E+00 0.10
Overall Mass Balance Based Upon Predicted Outflow & Reservoir ConcentrationsComponent: TOTAL P
Load Load Variance Conc ExportTrb Type Seg Name kg/yr %Total (kg/yr)2 %Total CV mg/m3 kg/km2/yr
1 1 1 Direct Drainage 7319.0 32.1% 4.29E+06 92.7% 0.28 150.0 8.1PRECIPITATION 1166.0 5.1% 3.40E+05 7.3% 0.50 39.2 26.1INTERNAL LOAD 14310.1 62.8% 0.00E+00 0.00TRIBUTARY INFLOW 7319.0 32.1% 4.29E+06 92.7% 0.28 150.0 8.1***TOTAL INFLOW 22795.1 100.0% 4.63E+06 100.0% 0.09 290.4 23.9ADVECTIVE OUTFLOW 4804.9 21.1% 3.69E+06 0.40 90.0 5.0***TOTAL OUTFLOW 4804.9 21.1% 3.69E+06 0.40 90.0 5.0***RETENTION 17990.2 78.9% 5.04E+06 0.12
Overflow Rate (m/yr) 1.2 Nutrient Resid. Time (yrs) 0.4144Hydraulic Resid. Time (yrs) 1.9662 Turnover Ratio 2.4Reservoir Conc (mg/m3) 90 Retention Coef. 0.789

Bois de Sioux River Watershed TMDL • DRAFT 2018 Minnesota Pollution Control Agency
123
Table 77. Upper Lightning Lake Calibrated Model Predicted & Observed Values
Table 78. Upper Lightning Lake Calibrated Model Water and Phosphorus Balances
Upper Lightning LakeFile: X:\Clients_WD\01031_Bois_de_Sioux\0003_BdS_River_WRAP\07_Modeling\BATHTUB\Upper Lightning_calibrated.btb
Predicted & Observed Values Ranked Against CE Model Development Dataset
Segment: 1 Upper Lightning Lake Predicted Values---> Observed Values--->
Variable Mean CV Rank Mean CV RankTOTAL P MG/M3 100.5 0.34 79.5% 100.5 0.10 79.5%
Upper Lightning LakeFile: X:\Clients_WD\01031_Bois_de_Sioux\0003_BdS_River_WRAP\07_Modeling\BATHTUB\Upper Lightning_calibrated.btb
Overall Water & Nutrient Balances
Overall Water Balance Averaging Period = 1.00 yearsArea Flow Variance CV Runoff
Trb Type Seg Name km2 hm3/yr (hm3/yr)2 - m/yr1 1 1 Direct Drainage 29.0 1.8 3.30E-02 0.10 0.06
PRECIPITATION 2.8 2.0 4.13E-02 0.10 0.72TRIBUTARY INFLOW 29.0 1.8 3.30E-02 0.10 0.06***TOTAL INFLOW 31.8 3.8 7.43E-02 0.07 0.12ADVECTIVE OUTFLOW 31.8 2.4 9.59E-02 0.13 0.07***TOTAL OUTFLOW 31.8 2.4 9.59E-02 0.13 0.07***EVAPORATION 1.5 2.15E-02 0.10
Overall Mass Balance Based Upon Predicted Outflow & Reservoir ConcentrationsComponent: TOTAL P
Load Load Variance Conc ExportTrb Type Seg Name kg/yr %Total (kg/yr)2 %Total CV mg/m3 kg/km2/yr
1 1 1 Direct Drainage 742.3 78.5% 1.10E+04 89.1% 0.14 408.7 25.6PRECIPITATION 73.4 7.8% 1.35E+03 10.9% 0.50 36.1 26.1INTERNAL LOAD 129.4 13.7% 0.00E+00 0.00TRIBUTARY INFLOW 742.3 78.5% 1.10E+04 89.1% 0.14 408.7 25.6***TOTAL INFLOW 945.2 100.0% 1.24E+04 100.0% 0.12 245.5 29.7ADVECTIVE OUTFLOW 239.3 25.3% 7.41E+03 0.36 100.5 7.5***TOTAL OUTFLOW 239.3 25.3% 7.41E+03 0.36 100.5 7.5***RETENTION 705.8 74.7% 1.36E+04 0.17
Overflow Rate (m/yr) 0.8 Nutrient Resid. Time (yrs) 0.3409Hydraulic Resid. Time (yrs) 1.3461 Turnover Ratio 2.9Reservoir Conc (mg/m3) 101 Retention Coef. 0.747

Bois de Sioux River Watershed TMDL • DRAFT 2018 Minnesota Pollution Control Agency
124
Table 79. Upper Lightning Lake TMDL Goal Scenario Model Predicted & Observed Values
Table 80. Upper Lightning Lake TMDL Goal Scenario Model Water and Phosphorus Balances
Upper Lightning LakeFile: X:\Clients_WD\01031_Bois_de_Sioux\0003_BdS_River_WRAP\07_Modeling\BATHTUB\Upper Lightning_goal.btb
Predicted & Observed Values Ranked Against CE Model Development Dataset
Segment: 1 Upper Lightning Lake Predicted Values---> Observed Values--->
Variable Mean CV Rank Mean CV RankTOTAL P MG/M3 90.0 0.33 75.8% 100.5 0.10 79.5%
Upper Lightning LakeFile: X:\Clients_WD\01031_Bois_de_Sioux\0003_BdS_River_WRAP\07_Modeling\BATHTUB\Upper Lightning_goal.btb
Overall Water & Nutrient Balances
Overall Water Balance Averaging Period = 1.00 yearsArea Flow Variance CV Runoff
Trb Type Seg Name km2 hm3/yr (hm3/yr)2 - m/yr1 1 1 Direct Drainage 29.0 1.8 3.30E-02 0.10 0.06
PRECIPITATION 2.8 2.0 4.13E-02 0.10 0.72TRIBUTARY INFLOW 29.0 1.8 3.30E-02 0.10 0.06***TOTAL INFLOW 31.8 3.8 7.43E-02 0.07 0.12ADVECTIVE OUTFLOW 31.8 2.4 9.59E-02 0.13 0.07***TOTAL OUTFLOW 31.8 2.4 9.59E-02 0.13 0.07***EVAPORATION 1.5 2.15E-02 0.10
Overall Mass Balance Based Upon Predicted Outflow & Reservoir ConcentrationsComponent: TOTAL P
Load Load Variance Conc ExportTrb Type Seg Name kg/yr %Total (kg/yr)2 %Total CV mg/m3 kg/km2/yr
1 1 1 Direct Drainage 597.6 74.7% 7.14E+03 84.1% 0.14 329.0 20.6PRECIPITATION 73.4 9.2% 1.35E+03 15.9% 0.50 36.1 26.1INTERNAL LOAD 129.4 16.2% 0.00E+00 0.00TRIBUTARY INFLOW 597.6 74.7% 7.14E+03 84.1% 0.14 329.0 20.6***TOTAL INFLOW 800.4 100.0% 8.49E+03 100.0% 0.12 207.9 25.1ADVECTIVE OUTFLOW 214.4 26.8% 5.72E+03 0.35 90.0 6.7***TOTAL OUTFLOW 214.4 26.8% 5.72E+03 0.35 90.0 6.7***RETENTION 586.0 73.2% 9.75E+03 0.17
Overflow Rate (m/yr) 0.8 Nutrient Resid. Time (yrs) 0.3606Hydraulic Resid. Time (yrs) 1.3461 Turnover Ratio 2.8Reservoir Conc (mg/m3) 90 Retention Coef. 0.732

Bois de Sioux River Watershed TMDL • DRAFT 2018 Minnesota Pollution Control Agency
125
12 Appendix B: Lake Summaries
Ash Lake As part of the DNR Shallow Lakes Program, several recent Wildlife Lake Habitat Survey Reports were completed for Ash Lake in 2006, 2009, and 2010 that summarize the aquatic plant and fish community. Ash Lake has an outlet structure with 3 four-foot wide stoplog bays (12 feet of weir) normally at elevation 1072 (1929 datum). A permanent pump station was constructed in spring of 2010 to facilitate drawdowns and enhance water level management on Ash Lake. Vegetation species and their percent occurrence at plots are summarized for 2005, 2008, and 2011 in Table 81. Growing season mean values of TP, Chl-a, and Secchi depth transparency by year are summarized for Ash Lake in Figure 50 through Figure 52.
2006 Survey Field Notes:
Plants distributed across the basin, density low due to poor water clarity. Coontail and sago were the dominant species. A narrow band of cattail surrounded most of the shoreline. Minnow traps present along west side of lake – no marking on the one checked. Small number of fathead minnows in trap. Bait dealer leaves boat/motor on west side of lake. A few Hyalella observed. Chironomid larvae present in much of the lake – they were brought up on tines of plant hook. The far north area was clear, plants more abundant. Very distinct demarcation between clear and turbid parts of the lake. Differences likely due to wind and fetch. The north bay is small and shallow.
2009 Survey Field Notes:
Several species of submerged plants were observed throughout the basin; however, densities were generally low due to poor water clarity. Coontail and sago pondweed were the dominate species. Northern milfoil was more common in the southern end of the lake. The northern bay of the lake had greater water clarity, higher density of plants, and surface mats of filamentous algae. Emergent vegetation was limited to a narrow fringe of narrowleaf cattail around much of the shoreline. Approximately 15 to 20 minnow traps were set in the middle of the lake at the time of the survey. Fathead minnows and a few sticklebacks were the only fish captured with trap nets during an assessment of the fish community. Chironomids were present on the plant rake at many sample points.
2010 Survey Field Notes:
Ash Lake is surrounded by grassland on the south and east sides of the lake, and agricultural land on the north and west sides. The perimeter of the basin is dominated by narrowleaf cattails. Several patches of bulrush are present throughout the basin. There was an abundance of star duckweed observed, the majority of which was submerged. Four trap nets were set-up on May 18 and a fish survey was conducted on May 19. The four ¼” nets contained a combined total of 15,600 fathead minnows.
2014 Survey Field Notes:
This lake was surrounded by an agricultural landscape, and had a hardwood tree buffer around ~50% of the lake. There was a large population of cattail and bulrush; much more than there was during the last survey. The emergent vegetation made many points inaccessible. The water was dirty and brown, with algae throughout the entire water body. Sago pondweed was thick through most of the lake, making

Bois de Sioux River Watershed TMDL • DRAFT 2018 Minnesota Pollution Control Agency
126
navigation difficult. Lenna species were thick in parts of the lake, especially both the north and south edges. One dead stickleback was seen by the survey crew. A trap-net fish survey was done on the lake at the time of the survey. Four trap-nets were set on the lake overnight. From all four nets, 113 stickleback minnows, ~430 fathead minnows, and 2 black bullheads were caught. One of the nets had no fish in it. All four nets had mud puppies in them, and some had crayfish.
Table 81. Vegetation summary for Ash Lake (DNR)
Vegetation Species
Occurrence at plots (%)
6/6/2006 6/11/2009 6/9/2010 2014
Ceratophyllum demersum or coontail 80% 29% 33% 9%
Stuckenia pectinata or sago pondweed 79% 62% 87% 94%
Lenna trisulca or duckweed 21%
Potamogeton NL spp. or narrowleaf pondweed 8% 19%
Zannichellia palustris or horned pondweed 4%
Typha augustifolia/glauca or narrowleaf cattail 1% 4% 3% 21%
Myriophyllum sibiricum or northern water milfoil 14% 29%
Chara spp. or muskgrass 6% 10% 16%
Elodea canadensis or Canada waterweed 1%
Scirpus spp. or bulrush 6%
No vegetation found 3% 20% 1%
Figure 50. Growing Season Means ± SE of Total Phosphorus for Ash Lake by Year
The dashed line represents the water quality standard for TP (90 µg/L)
2003 2009 2010 2011
Year
0.00
0.05
0.10
0.15
0.20
0.25
0.30
TP (m
g/L)
Mean Mean±SE
TP = 0.09 mg/L

Bois de Sioux River Watershed TMDL • DRAFT 2018 Minnesota Pollution Control Agency
127
Figure 51. Growing Season Means ± SE of Chlorophyll-a for Ash Lake by Year
The dashed line represents the water quality standard for Chl-a (30 µg/L)
Figure 52. Growing Season Means ± SE of Secchi transparency for Ash Lake by Year
The dashed line represents the water quality standard for transparency (0.7 m)
2009 2010 2011
Year
0
20
40
60
80
100
120C
hl-a
(µg/
L) Mean Mean±SE
Chl-a = 30 µg/L
2003 2009 2010 2011
Year
0.0
0.1
0.2
0.3
0.4
0.5
0.6
0.7
0.8
Sec
chi (
m)
Mean Mean±SE
Secchi = 0.7 m
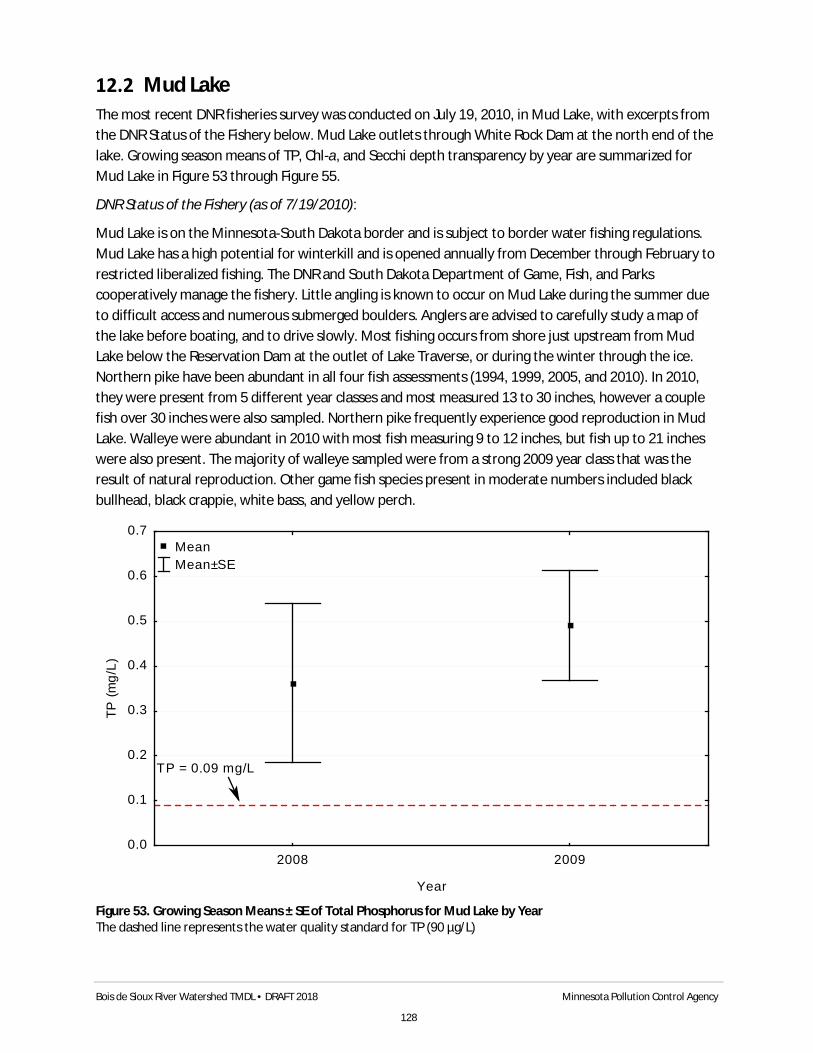
Bois de Sioux River Watershed TMDL • DRAFT 2018 Minnesota Pollution Control Agency
128
Mud Lake The most recent DNR fisheries survey was conducted on July 19, 2010, in Mud Lake, with excerpts from the DNR Status of the Fishery below. Mud Lake outlets through White Rock Dam at the north end of the lake. Growing season means of TP, Chl-a, and Secchi depth transparency by year are summarized for Mud Lake in Figure 53 through Figure 55.
DNR Status of the Fishery (as of 7/19/2010):
Mud Lake is on the Minnesota-South Dakota border and is subject to border water fishing regulations. Mud Lake has a high potential for winterkill and is opened annually from December through February to restricted liberalized fishing. The DNR and South Dakota Department of Game, Fish, and Parks cooperatively manage the fishery. Little angling is known to occur on Mud Lake during the summer due to difficult access and numerous submerged boulders. Anglers are advised to carefully study a map of the lake before boating, and to drive slowly. Most fishing occurs from shore just upstream from Mud Lake below the Reservation Dam at the outlet of Lake Traverse, or during the winter through the ice. Northern pike have been abundant in all four fish assessments (1994, 1999, 2005, and 2010). In 2010, they were present from 5 different year classes and most measured 13 to 30 inches, however a couple fish over 30 inches were also sampled. Northern pike frequently experience good reproduction in Mud Lake. Walleye were abundant in 2010 with most fish measuring 9 to 12 inches, but fish up to 21 inches were also present. The majority of walleye sampled were from a strong 2009 year class that was the result of natural reproduction. Other game fish species present in moderate numbers included black bullhead, black crappie, white bass, and yellow perch.
Figure 53. Growing Season Means ± SE of Total Phosphorus for Mud Lake by Year The dashed line represents the water quality standard for TP (90 µg/L)
2008 2009
Year
0.0
0.1
0.2
0.3
0.4
0.5
0.6
0.7
TP (m
g/L)
Mean Mean±SE
TP = 0.09 mg/L

Bois de Sioux River Watershed TMDL • DRAFT 2018 Minnesota Pollution Control Agency
129
Figure 54. Growing Season Means ± SE of Chlorophyll-a for Mud Lake by Year The dashed line represents the water quality standard for Chl-a (30 µg/L)
Figure 55. Growing Season Means ± SE of Secchi transparency for Mud Lake by Year
The dashed line represents the water quality standard for transparency (0.7 m)
2008 2009
Year
0
10
20
30
40
50
60
Chl
-a (µ
g/L)
Mean Mean±SE
Chl-a = 30 µg/L
2008 2009
Year
0.0
0.1
0.2
0.3
0.4
0.5
0.6
0.7
0.8
Sec
chi (
m)
Mean Mean±SE
Secchi = 0.7 m

Bois de Sioux River Watershed TMDL • DRAFT 2018 Minnesota Pollution Control Agency
130
Lake Traverse The most recent DNR fisheries survey was conducted on May 21, 2014, in Lake Traverse, with excerpts from the DNR Status of the Fishery below. Lake Traverse outlets through the Reservation Highway Dam at the north end of the lake. Growing season means of TP, Chl-a, and Secchi depth transparency by year are summarized for Lake Traverse in Figure 56 through Figure 58.
DNR Status of the Fishery (as of 5/21/2014):
Lake Traverse is located in western Minnesota just north of Browns Valley. It is a narrow lake that measures 16 miles long and up to 2 miles wide. Lake Traverse has a surface area of 11,528 acres and a maximum depth of 12 feet. It is a highly productive lake and a popular recreational destination in west-central Minnesota. Anglers should study the lake's contour map before boating as shallow reef areas exist, especially near the islands and in the northwest portion of the lake. Lake Traverse is a Minnesota-South Dakota border water and is subject to border water fishing regulations. The DNR and South Dakota Department of Game, Fish, and Parks cooperatively manage the fishery.
Lake Traverse has typically provided a high quality walleye fishery. Walleye from a wide range of sizes were abundant during 2014, especially from 1 to 18 inches. Good numbers of trophy-sized walleye have frequently been reported by anglers for many years. The walleye population has been maintained by natural reproduction and supplemental fry stocking. Walleye fry are normally stocked during alternate years, but the schedule is adjusted as needed based on walleye abundance, condition, and available forage. Fry stocking maintained the walleye population from 2003 to 2005, whereas natural reproduction has produced the vast majority of the walleye since 2006.
Pike were moderately abundant in 2014. The majority of them were 18 to 22 inches, but fish up to 35 inches were present. Pike growth has been fast, but they die young and fish older than age four have rarely been sampled. Pike naturally reproduce in Lake Traverse and its tributaries. They can also migrate into Lake Traverse from Mud Lake during high flows.
A moderate bluegill population was present. Anglers have reported catching bluegills in excess of 10 inches during recent years.
Yellow bullheads can commonly be caught at the Bois de Sioux Bridge near the northeast corner of Lake Traverse. Yellow bullheads have a round tail and white barbells on their lower jaw. Bullheads measuring up to 14 inches were present. Channel catfish have been abundant during recent years, including fish up to 30 inches.

Bois de Sioux River Watershed TMDL • DRAFT 2018 Minnesota Pollution Control Agency
131
Figure 56. Growing Season Means ± SE of Total Phosphorus for Lake Traverse by Year
The dashed line represents the water quality standard for TP (90 µg/L)
Figure 57. Growing Season Means ± SE of Chlorophyll-a for Lake Traverse by Year
The dashed line represents the water quality standard for Chl-a (30 µg/L)
2008 2010
Year
0.00
0.05
0.10
0.15
0.20
0.25
0.30
TP (m
g/L)
Mean Mean±SE
TP = 0.09 mg/L
2008 2010
Year
0
5
10
15
20
25
30
35
40
Chl
-a (µ
g/L)
Mean Mean±SE Chl-a = 30 µg/L

Bois de Sioux River Watershed TMDL • DRAFT 2018 Minnesota Pollution Control Agency
132
Figure 58. Growing Season Means ± SE of Secchi transparency for Lake Traverse by Year
The dashed line represents the water quality standard for transparency (0.7 m)
Upper Lightning Lake As part of the DNR Shallow Lakes Program, several recent Wildlife Lake Habitat Survey Reports were completed for Upper Lightning Lake in 2002, 2005, 2008, and 2011 that summarize the aquatic plant and fish community. Submerged aquatic plants occurred at 11% of sample sites in 2002, 17% in 2005, 45% in 2008, and 17% in 2011. Submerged aquatic plant diversity ranged from three to seven species in those four surveys. The highest percent occurrence and species richness was found in 2008, following a suspected partial winterkill of the fish community. Vegetation species and their percent occurrence at plots are summarized for 2005, 2008, and 2011 in Table 82. Upper Lightning Lake outlets through a 24 inch CMP under C.R. 26; the runout control is the channel bottom upstream of the culvert at 1083.5 (1929 datum). Growing season means of TP, Chl-a, and Secchi depth transparency by year are summarized for Upper Lightning Lake in Figure 59 through Figure 61.
2005 Survey Field Notes:
Most of the sample points on the lake had no vegetation. Only five species of submergent vegetation were found. No emergent species were found at any of the points, but some cattail was observed along shore, and a narrow band of bulrush was present on the lake. Water quality was poor to fair, with a secchi reading of two-feet across most of the lake. One chironomid was observed. There is extensive vertical erosion occurring at various locations along the shoreline, due to the water level being much higher than in the past.
2003 2004 2005 2006 2007 2008 2009 2010 2011
Year
0.0
0.5
1.0
1.5
2.0S
ecch
i (m
) Mean Mean±SE
Secchi = 0.7 m

Bois de Sioux River Watershed TMDL • DRAFT 2018 Minnesota Pollution Control Agency
133
2008 Survey Field Notes:
Habitat conditions were much improved since the last survey in 2005. Secchi disk was visible to the bottom (up to 9.0 feet) in most locations. Submerged plants were found at 45% of sample points, compared to only 17% in 2005. Coontail, chara, and sago pondweed were the predominate species found. There was also a fringe of cattail and hardstem bulrush along parts of the shoreline. The improvement in water clarity suggests a winterkill event; however, the survey crew observed live sunfish and bullheads. The survey crew also noted severe erosion along the shoreline that was causing trees to fall into the water.
2011 Survey Field Notes:
Secchi disk readings ranged from 1.0 to1.25 feet throughout the basin. Hardstem bulrush and cattail fringed the shoreline. Very little vegetation was observed at sample locations, except for small traces of coontail, narrowleaf pondweed species, and sago pondweed.
Table 82. Vegetation summary for Upper Lightning Lake (DNR)
Vegetation Species
Occurrence at plots (%)
8/29/2005 7/9/2008 8/10/2011
Ceratophyllum demersum or coontail 1% 30% 11%
Stuckenia pectinata or sago pondweed 12% 10% 4%
Lenna trisulca or duckweed 3%
Potamogeton NL spp. or narrowleaf pondweed 2% 8%
Potamogeton zosteriformes or flat-stem pondweed 3%
Myriophyllum sibiricum or northern water milfoil 2%
Chara spp. or muskgrass 1% 15%
Utricularia vulgaris or greater bladderwort 4%
Najas marina or spiny naiad 1%
No vegetation found 83% 55% 82%

Bois de Sioux River Watershed TMDL • DRAFT 2018 Minnesota Pollution Control Agency
134
Figure 59. Growing Season Means ± SE of Total Phosphorus for Upper Lightning Lake by Year
The dashed line represents the water quality standard for TP (90 µg/L)
Figure 60. Growing Season Means ± SE of Chlorophyll-a for Upper Lightning Lake by Year
The dashed line represents the water quality standard for Chl-a (30 µg/L)
2002 2005 2008 2009 2010
Year
0.00
0.02
0.04
0.06
0.08
0.10
0.12
0.14
0.16
TP (m
g/L)
Mean Mean±SE
TP = 0.09 mg/L
2008 2009 2010
Year
0
10
20
30
40
50
60
70
Chl
-a (µ
g/L)
Mean Mean±SE
Chl-a = 30 µg/L

Bois de Sioux River Watershed TMDL • DRAFT 2018 Minnesota Pollution Control Agency
135
Figure 61. Growing Season Means ± SE of Secchi transparency for Lake Traverse by Year
The dashed line represents the water quality standard for transparency (0.7 m)
2005 2008 2009 2010
Year
0.0
0.5
1.0
1.5
2.0
2.5
Sec
chi (
m)
Mean Mean±SE
Secchi = 0.7 m


![Cars New & Used | Cars Sioux Falls, Iowa City | Billion ... · New Buick Sioux Falls New Buick Dealer Sioux Falls New Car Prices Sioux Falls | Billion Automotive 4:41:45 PM]](https://img.dokumen.tips/doc/110x75/6044db1693d84f78c4248ca7/cars-new-used-cars-sioux-falls-iowa-city-billion-new-buick-sioux.jpg)