Embed Size (px)
Citation preview

DR Resources for Energy and Ancillary Services in the West EUCI: Western Energy Imbalance Market Demand Side and Transmission Solutions Marissa Hummon, NREL (National Renewable Energy Laboratory) Sila Kiliccote, LBNL (Lawrence Berkeley National Laboratory) August 13, 2013 NREL/PR-6A20-60165

Outline
• Assessing the capabilities of DR • Potential of DR to provide reserves
– Correlation of DR, reserve requirement, and reserve price
• Modeling DR in Production Cost Model – What did we model? – Value of DR in Test System – Revenue Streams for DR

Demand response and energy storage integration study Potential for flexible response from end-use appliances, equipment, and systems across the commercial, industrial, and residential sectors
Operational values for flexible response and energy storage providing bulk power system services under different system conditions
Energy transactions (e.g. use lower cost off-peak power to serve on-peak load) Provision of ancillary services (including frequency regulation, load following reserve, and contingency reserve) Reduction of generator unit starts, cycling, and ramping costs
Change in values (increase or decrease) with increased penetration of variable renewable generation like wind and solar power
Implementation barriers to the utilization of flexible response and storage

Project Team Lawrence Berkeley National Laboratory Sila Kiliccote, Nance Matson, Daniel Olsen, Cody Rose, Michael Sohn, Sasank Goli, and June Dudley Peter Cappers and Jason MacDonald
National Renewable Energy Laboratory Paul Denholm, Marissa Hummon, Jennie Jorgenson, and David Palchak
Oak Ridge National Laboratory Michael Starke, Nasr Alkadi, and Ron Dizy (ENBALA)
Sandia National Laboratories Dhruv Bhatnagar, Aileen Beth Currier, and Ray Byrne
Advisors Brendan Kirby (consultant to NREL) and Mark O’Malley (UCD)

End-Uses Selected for Participation
• Commercial • Space Cooling, Space Heating, Lighting, Ventilation
• Residential • Space Cooling, Space Heating, Water Heating
• Municipal • Freshwater Pumping, Highway Lighting, Wastewater
Pumping
• Industrial • Agricultural Irrigation Pumping, Data Centers,
Refrigerated Warehouses

DR Services provided by End-Uses Product Purpose Response Characteristics
Regulation Response to random unscheduled deviations in scheduled net load
Called continuously, must begin response w/in 30 seconds, energy neutral over 15 minutes
Flexibility Additional load following reserve for large un-forecasted wind/solar ramps
Called continuously, must begin response w/in 5 minutes
Contingency Rapid and immediate response to a loss in supply (≤ 30 minutes)
Called once per day or less, must begin response w/in 1 minute
Energy Shed or shift energy consumption over time (≥ 1 hour)
Called 1-2 times per day, 4-8 hours advance notification
Capacity Ability to serve as an alternative to generation
Must be available top 20 hours in each area

Quantifying Responding Load
7
Total balancing authority load
Load from selected end-uses
Portion of end-use loads which can be shed/shifted in typical DR Strategies (“sheddable” load)
Portion of sheddable load willing and able to participate (Load is controllable, sheds/shifts are acceptable to end-users)
Portion of sheddable, controllable, acceptable load provisioned by PLEXOS
Flexibility Filters

Summary of Results
8
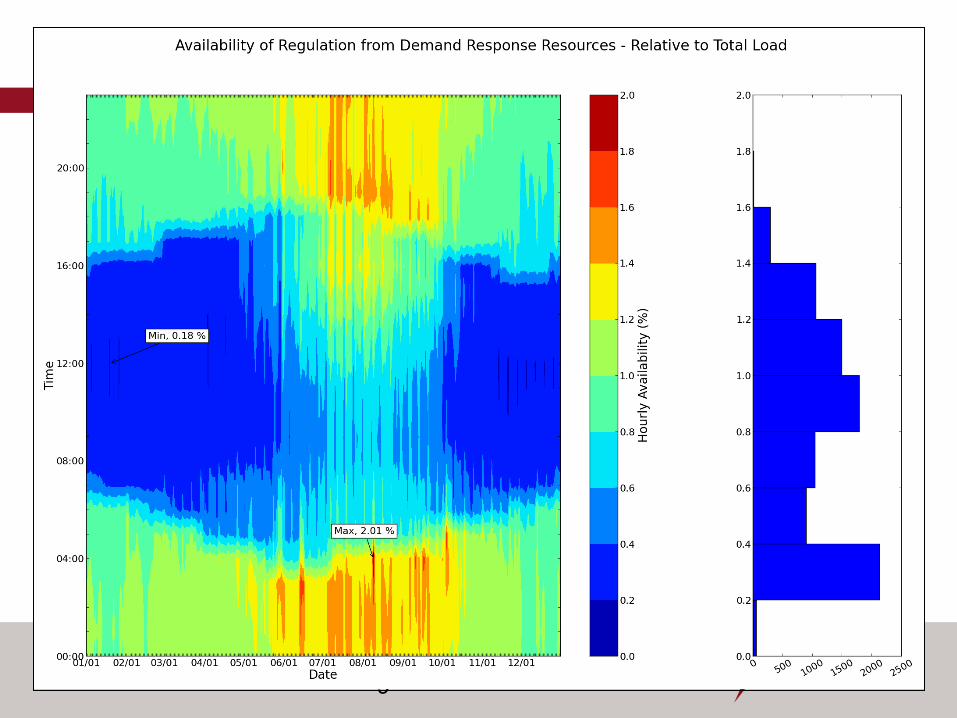
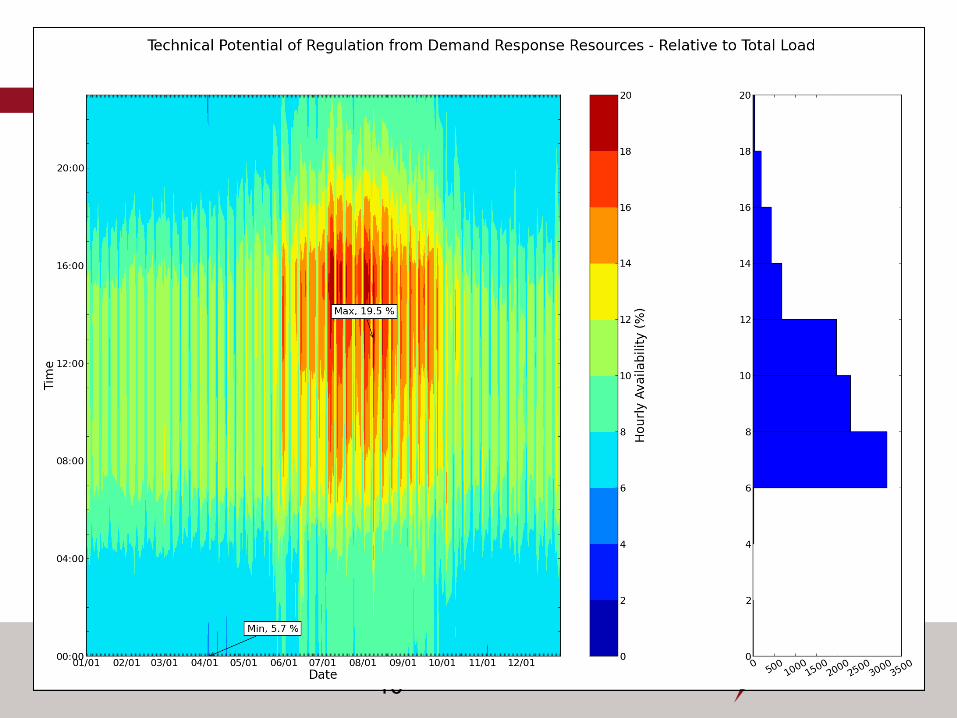
Product Estimated Availability (% relative to total load)
Technical Potential* (% relative to total load)
Regulation 153-1,822 MW (0.2-2.0%) 3,954-23,906 MW (6-20%) Flexibility 339-2,162 MW (0.4-2.3%) 3,954-23,906 MW (6-20%) Contingency 445-2,990 MW (0.5-2.8%) 5,156-26,712 MW (7-22%) Energy Shift 194-2,846 MW (0.2-2.3%) 2,185-25,592 MW (2-21%) Capacity 679-4,233 MW (0.8-3.5%) 5,390-32,353 MW (7-27%)
*Technical Potential is sheddable load, with 100% controllability and acceptability
Footer 9
Footer 10

11

12

13

Footer 14

Footer 15

POTENTIAL OF DR TO PROVIDE RESERVES
Correlation of DR and Ancillary Service Requirements: Surplus Ramp Capacity from Existing Generators Marginal Price of Reserves Additional Capacity from DR
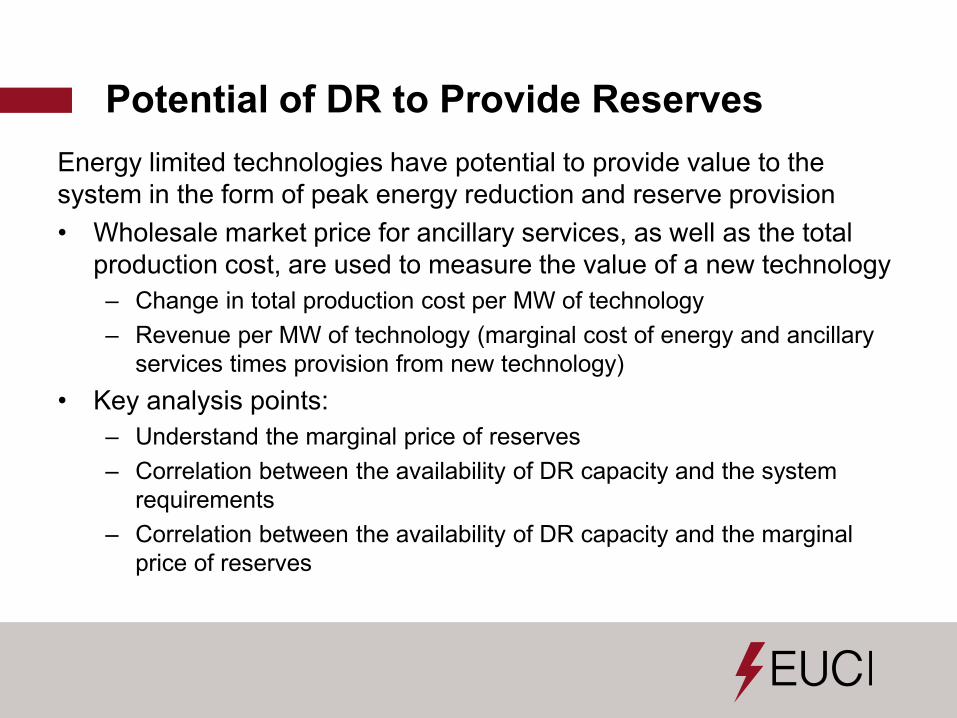
Potential of DR to Provide Reserves Energy limited technologies have potential to provide value to the system in the form of peak energy reduction and reserve provision • Wholesale market price for ancillary services, as well as the total
production cost, are used to measure the value of a new technology – Change in total production cost per MW of technology – Revenue per MW of technology (marginal cost of energy and ancillary
services times provision from new technology) • Key analysis points:
– Understand the marginal price of reserves – Correlation between the availability of DR capacity and the system
requirements – Correlation between the availability of DR capacity and the marginal
price of reserves

Economic Potential for DR Depends on the correlation of the reserve requirement and the availability of DR

Economic Potential for DR Depends on the correlation of the reserve requirement and the availability of DR
Average Percent of Reserve Requirement Met by DR (Western Interconnect: 25% Wind, 8% Solar)
Region Regulation Contingency Flexibility Arizona 72% 40% 184% California - North 95% 58% 499% California - South 100% 62% 324% Colorado 24% 30% 23% Idaho 49% 55% 94% Montana 9% 22% 7% Nevada - North 19% 42% 21% Nevada - South 68% 37% 188% New Mexico 30% 49% 29% Northwest 43% 27% 86% Utah 50% 29% 125% Wyoming 14% 23% 12%
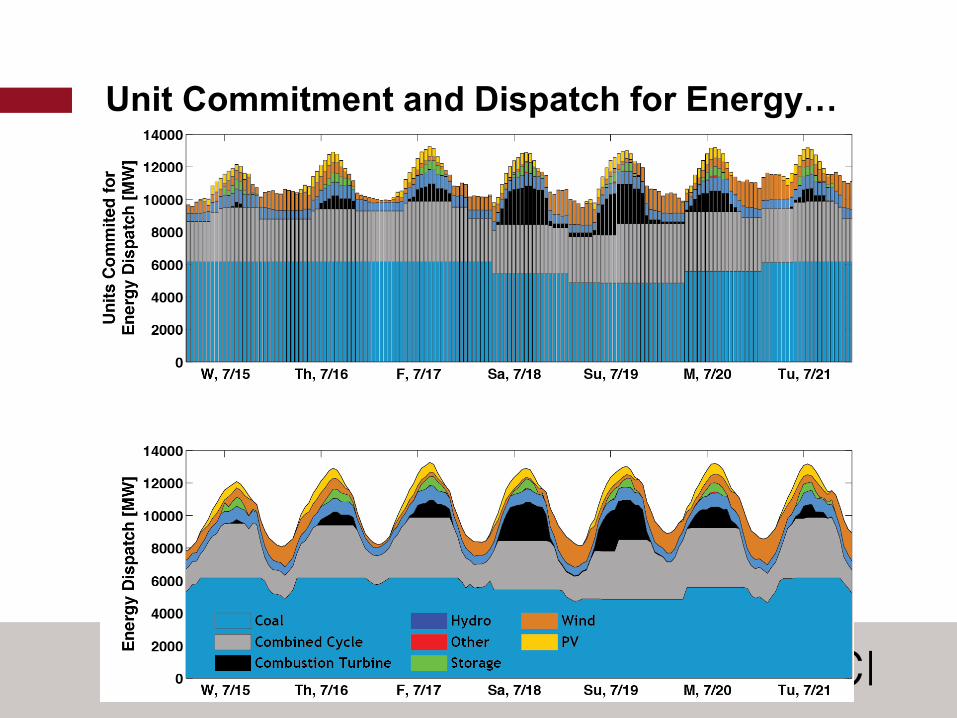
Unit Commitment and Dispatch for Energy…

… has surplus ramp capacity

Modeling Reserve Provision and Cost
Regulation bids include a “wear & tear” cost:

Surplus Ramp Capacity by Ancillary Service

Change in Dispatch Marginal Cost for Reserves

Con
tinge
ncy
Res
erve
Fr
eque
ncy
Reg
ulat
ion
Colorado test system model Modeled Reserve Prices

Reserves in S. California

Reserves in Northwest

MODELING DR IN PRODUCTION COST MODEL
What did we model? Value of DR in Test System Revenue Streams for DR

Motivation Demand Response is Different
Co-optimization: demand-side capacity could be used for energy or ancillary services - time-varying capacity - response-time varies by enabling technology/service provided
Energy shifting: reducing load at time t has consequences at t+1 - time-varying capacity - energy limited - central scheduler for load reduction and recovery*
* Not all loads require recovery

Assumptions for Production Cost Models
• Centralized scheduling and economic dispatch from a “day-ahead” perspective
• Treated demand-side load reduction as supply-side virtual generation; kept electricity demand as a fixed input
• DR energy operation did not incur operating costs; but did have soft constraints on some operations including starts per day and hours per day
• DR as capacity for reserves, did not incur any costs to the system

From the perspective of load…

DR Modeling Parameters

Co-optimization of DR for Energy and AS
• Time-varying rate of response for DR – Fast response for contingency reserve and regulation reserve – Slow response for energy and flexibility reserve
• Sum of capacity providing energy and reserves cannot
exceed the maximum capacity of an one service, during each time interval

Example: Commercial Cooling Capacity

Test System (Colorado) • Rocky Mountain Power Pool (RMPP):
Colorado and parts of adjacent states • Peak load: ~14 GW • Base Case: 58% Coal, 20% Gas, 5% Hydro, 1%
Pumped Hydro, 2% PV, 14% Wind (by generation)

Agricultural Pumping - Colorado

Agricultural Pumping - Colorado

DR Energy Shifting in Test System DR energy shifting reduces peak load hours; shifting that load to early morning and overnight.

Value of DR in the Test System
Production Cost [M$] Base Case Base Case with DR
Decrease in Cost with DR
Fuel Cost 1215.0 1208.0 -7 / -0.6%
Variable O&M Cost 151.8 152.2 0.4 / 0.3%
Start & Shutdown Cost 58.4 58.7 0.4 / 0.6%
Regulation Reserve Bid Price 4.5 2.9 -1.7 / -36.8%
Total Generation Cost 1429.7 1421.8 -7.9 / -0.6%
Dividing $7.9M in production cost savings by the total DR capacity enabled, 293 MW, yields a value of $26.91/kW-yr of DR capacity.
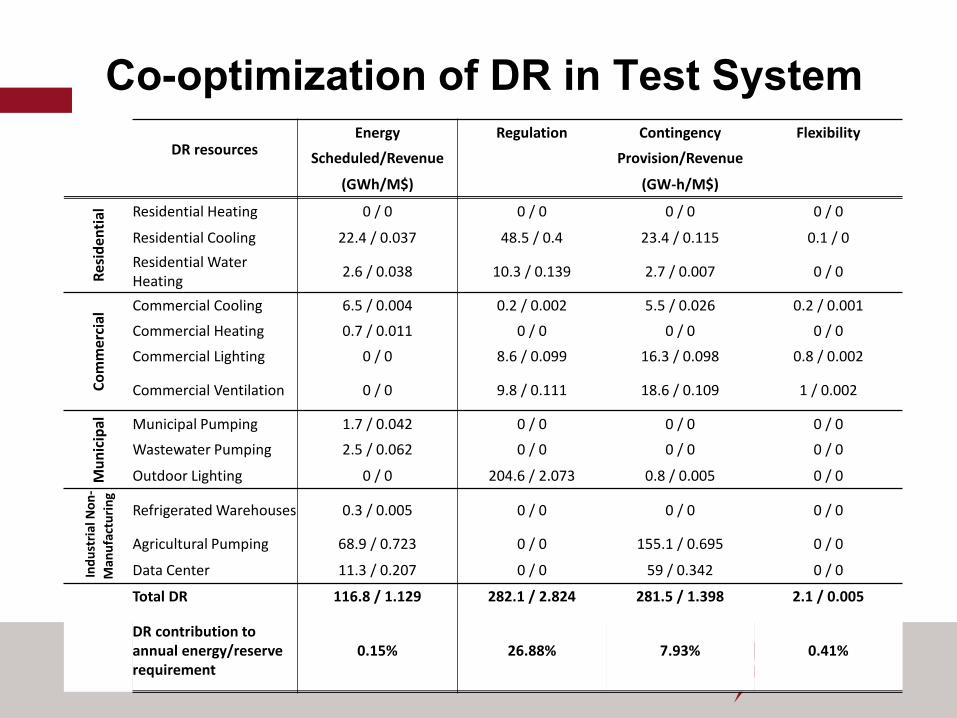
Co-optimization of DR in Test System DR resources
Energy Regulation Contingency Flexibility
Scheduled/Revenue Provision/Revenue
(GWh/M$) (GW-h/M$)
Resi
dent
ial Residential Heating 0 / 0 0 / 0 0 / 0 0 / 0
Residential Cooling 22.4 / 0.037 48.5 / 0.4 23.4 / 0.115 0.1 / 0 Residential Water Heating 2.6 / 0.038 10.3 / 0.139 2.7 / 0.007 0 / 0
Com
mer
cial
Commercial Cooling 6.5 / 0.004 0.2 / 0.002 5.5 / 0.026 0.2 / 0.001
Commercial Heating 0.7 / 0.011 0 / 0 0 / 0 0 / 0
Commercial Lighting 0 / 0 8.6 / 0.099 16.3 / 0.098 0.8 / 0.002
Commercial Ventilation 0 / 0 9.8 / 0.111 18.6 / 0.109 1 / 0.002
Mun
icip
al
Municipal Pumping 1.7 / 0.042 0 / 0 0 / 0 0 / 0
Wastewater Pumping 2.5 / 0.062 0 / 0 0 / 0 0 / 0
Outdoor Lighting 0 / 0 204.6 / 2.073 0.8 / 0.005 0 / 0
In
dust
rial N
on-
Man
ufac
turin
g
Refrigerated Warehouses 0.3 / 0.005 0 / 0 0 / 0 0 / 0
Agricultural Pumping 68.9 / 0.723 0 / 0 155.1 / 0.695 0 / 0
Data Center 11.3 / 0.207 0 / 0 59 / 0.342 0 / 0
Total DR 116.8 / 1.129 282.1 / 2.824 281.5 / 1.398 2.1 / 0.005
DR contribution to annual energy/reserve requirement
0.15% 26.88% 7.93% 0.41%

Operational Revenue for DR in Test System

Publications See: https://www1.eere.energy.gov/analysis/response_storage_study.html • O. Ma, N. Alkadi, P. Cappers, P. Denholm, J. Dudley, S. Goli, M. Hummon, S. Kiliccote,
J. MacDonald, N. Matson, D. Olsen, C. Rose, M. D. Sohn, M. Starke, B. Kirby, and M. O'Malley, "Demand Response for Ancillary Services," IEEE Transactions on Smart Grid Special Issue on Real Time Demand Response, [accepted for publication], 2013.
• Olsen, D. J.; Kiliccote, S.; Matson, N.; Sohn, M.; Rose, C.; Dudley, J.; Goli, S.; Hummon, M.; Palchak, D.; Denholm, P.; Jorgenson, J.; Ma, O. (2013). Grid Integration of Aggregated Demand Response, Part 1: Load Availability Profiles and Constraints for the Western Interconnection. 92 pp.; Lawrence Berkeley National Laboratory; Demand Response Research Center Report No. LBNL-6417E
• Hummon, M.; Palchak, D.; Denholm, P.; Jorgenson, J.; Olsen, D. J.; Kiliccote, S.; Matson, N.; Sohn, M.; Rose, C.; Dudley, J.; Goli, S.; Ma, O. (2013). Grid Integration of Aggregated Demand Response, Part 2: Modeling Demand Response in a Production Cost Model. 72 pp.; NREL Report No. TP-6A20-58492.
• P. Denholm, J. Jorgenson, M. Hummon, D. Palchak, T. Jenkin, B. Kirby, O. Ma, and M. O’Malley. (2013). Value of Energy Storage for Grid Applications. Technical report TP-6A20-58465. National Renewable Energy Laboratory.
• M. Hummon, P. Denholm, D. Palchak, J. Jorgenson, B. Kirby, and O. Ma (2013). Fundamental Drivers of Operating Reserve Cost in Electric Power Systems. Technical report TP-6A20-58491. National Renewable Energy Laboratory.