Embed Size (px)
Citation preview
Doug Pegg Vice President, Packaging Coatings
Williamsburg, Virginia June 18, 2013
Information current as of June 18, 2013

Statements contained herein relating to matters that are not historical facts are forward-looking statements reflecting PPG’s current view with respect to future events and financial performance. These matters within the meaning of Section 27A of the Securities Act of 1933, as amended, and Section 21E of the Securities Exchange Act of 1934, as amended, involve risks and uncertainties that may affect PPG’s operations, as discussed in PPG’s filings with the Securities and Exchange Commission pursuant to Sections 13(a), 13(c) or 15(d) of the Exchange Act, and the rules and regulations promulgated thereunder. Accordingly, many factors could cause actual results to differ materially from the forward-looking statements contained herein. Such factors include global economic conditions, increasing price and product competition by foreign and domestic competitors, fluctuations in cost and availability of raw materials, the ability to maintain favorable supplier relationships and arrangements, the realization of anticipated cost savings from restructuring initiatives, difficulties in integrating acquired businesses and achieving expected synergies therefrom, economic and political conditions in international markets, the ability to penetrate existing, developing and emerging foreign and domestic markets, foreign exchange rates and fluctuations in such rates, fluctuations in tax rates, the impact of future legislation, the impact of environmental regulations, unexpected business disruptions, and the unpredictability of existing and possible future litigation, including litigation that could result if the asbestos settlement discussed in PPG’s filings with the Securities and Exchange Commission does not become effective. However, it is not possible to predict or identify all such factors. Consequently, while the list of factors presented here and in PPG’s Form 10-K for the year ended December 31, 2012 are considered representative, no such list should be considered to be a complete statement of all potential risks and uncertainties. Unlisted factors may present significant additional obstacles to the realization of forward-looking statements. Consequences of material differences in results compared with those anticipated in the forward-looking statements could include, among other things, business disruption, operational problems, financial loss, legal liability to third parties and similar risks, any of which could have a material adverse effect on PPG’s consolidated financial condition, results of operations or liquidity. All information in this presentation speaks only as of June 18, 2013, and any distribution of this presentation after that date is not intended and will not be construed as updating or confirming such information. PPG undertakes no obligation to update any forward-looking statement, except as otherwise required by applicable law.
Forward-Looking Statements Forward Looking Statements
2

Welcome
3
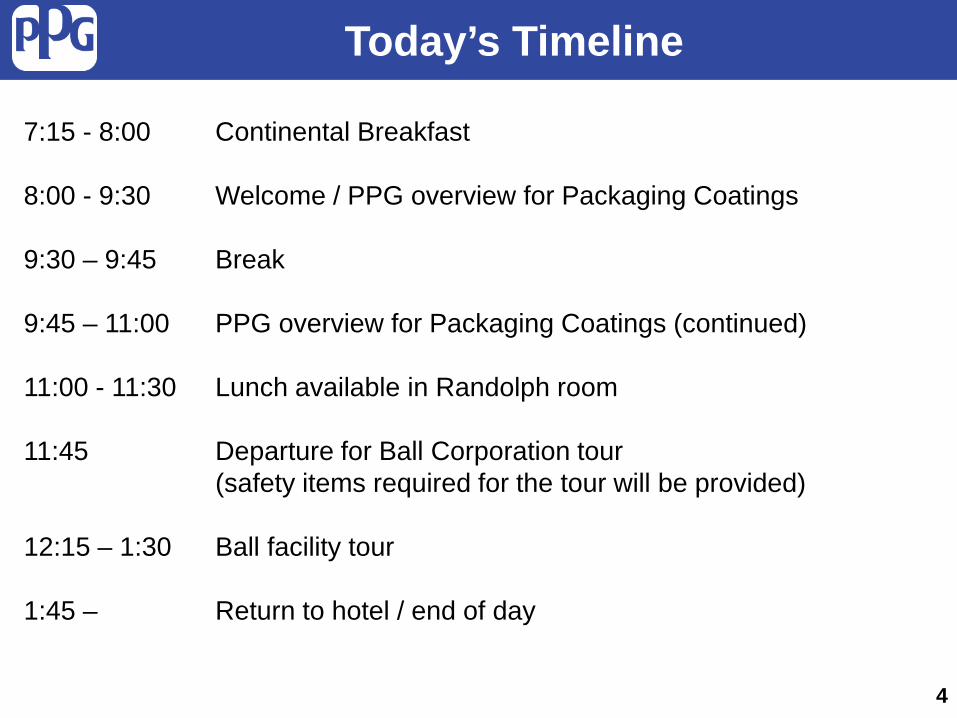
Today’s Timeline
4
7:15 - 8:00 Continental Breakfast 8:00 - 9:30 Welcome / PPG overview for Packaging Coatings 9:30 – 9:45 Break 9:45 – 11:00 PPG overview for Packaging Coatings (continued) 11:00 - 11:30 Lunch available in Randolph room 11:45 Departure for Ball Corporation tour (safety items required for the tour will be provided) 12:15 – 1:30 Ball facility tour 1:45 – Return to hotel / end of day

PPG “Deep Dive” Program
5
Meeting objective – Provide a deeper understanding of the various PPG
businesses and coatings industry sub-segments in which we operate
Typical day:
o End-use segment / industry (i.e., packaging coatings) details
o Customers
o Products / complexities
o Competitive landscape
o Geographic differences
o PPG’s participation in the segment(s)
o PPG’s growth opportunities
o Site visit to visually see PPG products “at work” for our customers

PPG “Deep Dive” Program
6
PPG Deep Dive is NOT:
o Not a PPG investor day
o Not an update on the quarter or current business trends
o Not a discussion on other PPG businesses
o Not a strategic update
Education is the focus; Strong Q&A / participation desired

Year Topic(s) Location Details
2006 Transitions Transitions HQ Tampa, FL Overview of PPG’s Transitions Optical joint venture
2007 PPG Aerospace PPG aerospace facility Huntsville, AL
Discussed PPG’s participation in the Aerospace coatings, sealants and transparency market
2008 SigmaKalon Acquisition Overview
Offsite Reviewed details (markets, customers, regional
coverage, etc.) of PPG’s largest acquisition which closed in January, 2008
2010 PPG Asia and PPG
Auto OEM Coatings
BMW facility Greenville, SC
Provided details of PPG’s Asian operations and rapid growth history/prospects. Overview of PPG’s
automotive OEM coatings business and auto OEM end-market dynamics.
2011 PPG Automotive Refinish
Penske Racing facility Charlotte, NC
Detailed review of global coatings auto collision repair market, including distribution processes and key customer requirements. Review of PPG’s new
technologies addressing market needs.
2012 PPG Industrial Coatings
Harley Davidson facility York, PA
Overview of the broad, consolidating general industrial coatings market with various product
segmentation around end-use, application methodology and substrate.
2013 PPG Packaging Coatings
Ball Container facility Williamsburg, VA
Discuss packaging coatings industry, current market and product trends and growth opportunities.
PPG “Deep Dive” Program
7

Packaging Coatings Industry Industry End-Market Mix by Dollar
Value of Sales (~$100B)
Protective & Marine
13%
Aerospace 2%
Packaging 3%
Architectural 43%
Industrial 26%
Refinish 7%
Auto OEM 6%
Source: Coatings World, Company Annual Reports, PPG estimates 8
Global Market Position Packaging Coatings
(~$3B)
PPG #2 Position
AkzoNobel #3 Position
Sherwin Williams
No meaningful presence
Axalta (formerly Dupont)
No meaningful presence
Valspar #1 Position
Global Coatings Companies – Packaging Coatings Positions
Packaging a key special purpose coating segment PPG has #2 global position

Packaging Coatings
9
Presentation Agenda
10
►Packaging Industry Overview
►Packaging Coatings Overview
►Metal Packaging Types
►PPG’s Packaging Coatings Business
►Industry Trends / Growth Opportunities
►Ball Container and Plant Tour

Packaging Coatings
Definitions and Acronyms: 2 PIECE CAN (2Pc): A metal can that has two parts; a stamped and drawn body and a
can end. Two piece cans are either Drawn and Wall Ironed (DWI or D&I) or Draw-Redraw (DRD), and are made from steel or aluminum
3 PIECE CAN (3Pc): A metal can, usually made of tinplate, whose body is welded at the side seam and has two ends.
B&B: Beer and beverage BPA: Bisphenol A, a major component of epoxy resins used in can coatings BPA-NI: BPA Non-Intent – reflects products with BPA not intentionally added COMPOUND: Also called seaming compound; a sealing material consisting of a water or
solvent emulsion of latex or synthetic rubber. Seaming compound is placed in the curl of the can end for an air tight (hermetic) seal
CSD: Carbonated soft drink DRD (D.R.D. CAN): Draw-redraw can - a can produced by forming a cup and subjecting
the cup to one or more re-drawing processes. Each re-drawing operation reduces the diameter and increases the height of the finished can
DWI (D.W.I. CAN): A drawn and wall ironed can - a two piece can made of aluminum or tinplated steel that is produced by forming a cup and then drawing and ironing the sidewall of the cup into a finished can
11

Packaging Coatings (continued)
Definitions and Acronyms: EOE (EASY OPEN END): A can end typically made of steel or aluminum that has a self-
contained fixture for opening the can and permitting removal of the contents of the container
FAEOE (FULL APERTURE EASY OPEN END): The full end of the can is opened by the use of a pull ring
FAGL: Food, Aerosol and General Line G1: PPG’s solvent-based easy open end coating used in Beer & Beverage GENERAL LINE & AEROSOLS: Cans for uses other than food and beverage LAMINATES: A thermoplastic polymer system e.g. PET, polyolefins, nylon, etc., bonded
to the coil fed metal substrate (steel or aluminum) MAT: Monobloc, aerosols and tubes RETORT: When foods are sterilized in the can using superheated steam under pressure.
Conditions are usually specified by the customer (i.e.: 90' @ 250°F) UV RIMCOAT: A coating used to coat the bottom rim on a two piece beer and beverage
can. This coating, while giving protection to the metal substrate, is intended primarily to improve the movement (mobility) of the can through the can filling line
W1: PPG’s waterborne easy open end coating for Beer & Beverage
12

Global Packaging Mix
Sources: Can Manufacturers Institute (CMI), Ernst & Young
Metal 10.9%
Rigid plastic 22.4%
Glass 10.4%
Liquid cartons
4.9%
Paper-based
containers 11.3%
Flexible packaging
39.9%
Other packaging
0.2%
Metal food can 2.3%
Metal beverage
can 7.6%
Metal aerosol
can 0.2% Metal tins
0.3%
Aluminum trays 0.1%
Collapsible metal tubes 0.1% Other
metal 0.2%
13
Today’s presentation focus is on metal packaging
All packaging types ~$400B

Global Packaging Industry
Source: CocaCola, Freedonia 14
Rigid Flexible / Plastic
Metal Glass Rigid Plastic Pouch Aseptic
Carton
Growth 2-3% 1-2% 2-4% 2-3% 4-5%
Cost vs. can 1x 2x 1.5x 0.8x 1x
Market Advantages
• Recyclability • Long shelf life • Portability • Product content
flexibility
• Recyclability • Food
protection
• Cost • Design
flexibility
• Easy to use • Brand
customization
• Resealable • Pack
perishables
Market Drawbacks
• Container not resealable
• Slower filling • Freight costs • Energy
intensity
• Shelf life • Recycling
• Shelf life • Retort
capability
• Recycling • Shelf-life
Coating Importance Key Enabler N/A N/A Decorative if any Decorative if any

Cans, 41% Plastic, 35%
Glass, 16% Paper, 6%
Box/Pouch, 2%
~240 billion units
U.S. Beverage Packaging Market
Unit Volume by Substrate
15 Source: Euromonitor, PPG estimates
Cans are the main package in a developed market like U.S. beverage
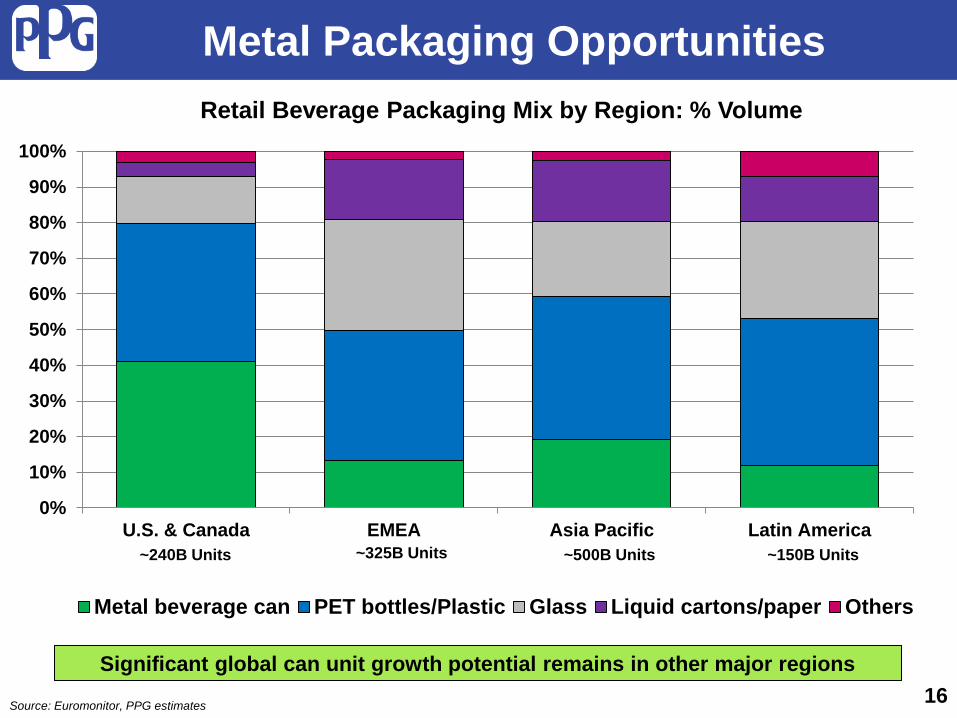
Metal Packaging Opportunities
0%
10%
20%
30%
40%
50%
60%
70%
80%
90%
100%
U.S. & Canada EMEA Asia Pacific Latin America
Retail Beverage Packaging Mix by Region: % Volume
Metal beverage can PET bottles/Plastic Glass Liquid cartons/paper Others
~500B Units ~325B Units ~240B Units ~150B Units
Significant global can unit growth potential remains in other major regions
Source: Euromonitor, PPG estimates 16
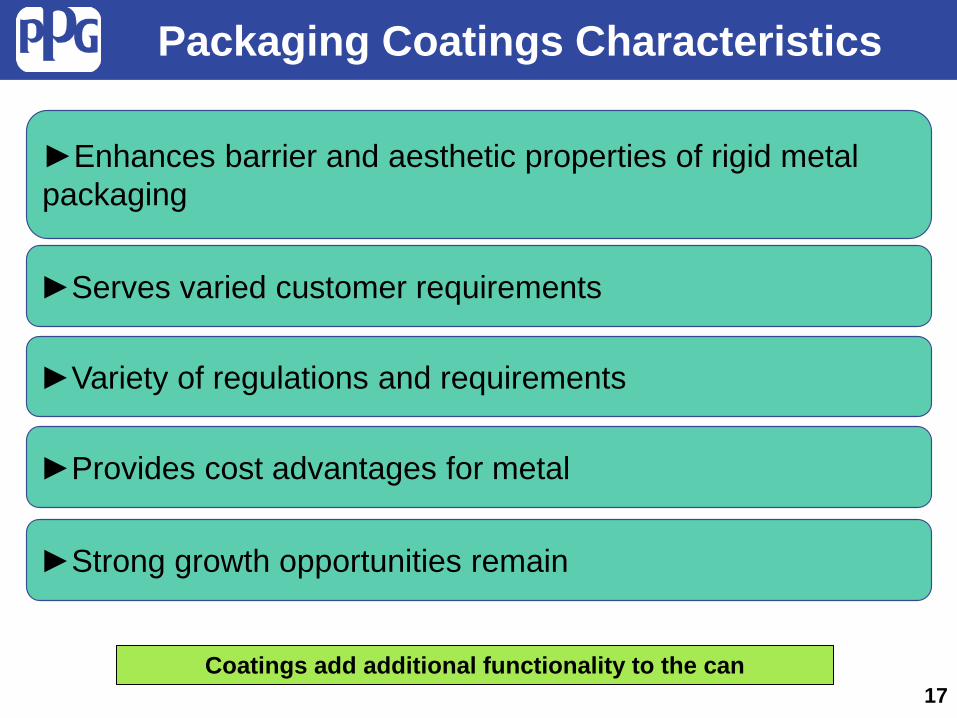
Packaging Coatings Characteristics
17
►Enhances barrier and aesthetic properties of rigid metal packaging
►Serves varied customer requirements
►Variety of regulations and requirements
►Provides cost advantages for metal
►Strong growth opportunities remain
Coatings add additional functionality to the can

Feature Description Implication Chemical Resistance Coatings must withstand a
wide variety of food types from very acidic peppers to
mild products such as beans
Coatings can keeps food safe for several years. A
failure could lead to corrosion and ultimately food
spoilage Flexibility
Coatings must be able to withstand the forming of the can or end after application
Flexible - allows for unique can designs that enable
metal reduction. Corrosion could result if the coating is
not flexible enough Application
Coatings must applied at high speed levels
Higher application speeds result in increased
productivity for the customer
Process-ability Coatings must be able to
withstand heat and pressure for cooking or retort
Retorting sterilizes the packed food ensuring food
safety
Coatings Characteristics - Metal Packaging
18

Resiliency of the Can
PET Container
1800 1900 1950 1960 1970 1980 1990 2000
Food Can
Aerosol Can
Beer Can
Tetra Pack
Al Bev Can 2pc
DWI Food Metal Tube
FAEOE Bottle Cans
• Long history of growth for metal
packaging • Sustainability, performance and
cost drive metal can growth despite availability of alternative packaging
• Innovation/design capabilities are key for customers
Packaging Can History
0
100
200
300
400
Can
s (b
illio
ns)
Global Beverage Cans Produced
Source: Canmaker Institute, EuroMonitor 19

Can Provides Unique Packaging Attributes
Sustains pasteurization & sterilization
Easily transportable around the globe
Long shelf life for consumer convenience
Nutritional value retained

Tuna Can Demonstrates Global Functionality
Thailand
Where tuna is caught
Pacific
Southern Ocean
Indian
Atlantic & Med
Where tuna is canned (Top 4 regions)
Spain, France
66%
20%
9%
5%
Where canned tuna is consumed
Philippines
Ecuador
UK 9%
25%
Japan 9%
Mexico 7%
Spain 9%

Can Remains Critical Packaging Material
Can’s functional attributes remain key factor to longevity 22
The steel food can is one of the safest types of food packaging. It is tamper resistant, provides an airtight seal, is thermally sterilized and shelf stable. – Food & Drug Administration The canning process locks in nutrients at the peak of freshness, and due to lack of oxygen during storage, canned fruits and vegetables remain stable giving them longer shelf life. – Canned Food Alliance
Source: Canned Food Alliance
Cans provide important nutrients often at a lower cost per nutrient than fresh, frozen or dried forms.
Canned foods do not necessarily need preservatives. The heating process used after the can is filled and sealed ensures the food’s quality.

Packaging Growth Continues
Metal packaging remains one of the most utilized materials in growing industry
0
200
400
600
800
1000
1200
1400
1600
2004 2009 2013
Bill
ions
of U
nits
Other
Flexible plastic
Liquid cartons
Glass
PET bottles
Metal beveragecan
CAGR
4%
5% 7%
2%
6%
3%
Source: Euromonitor 23

Metal Packaging Coatings Market Segmentation
Others Beverage
Food, Aerosol and General Line (FAGL)
Source: PPG Estimates
Market Segmentation
Beverage Bodies = interior & exterior coatings
Beverage EOE = end coatings
Food = interior, exterior & end coatings
General Line & Aerosols = interior & exterior coatings
Caps & closures = interior & exterior coatings Monobloc, Aerosols & Tubes = interior & exterior coatings
Other = inks, pretreatment, compounds 24

Packaging Coatings End-Use Markets
Estimated Market $3B 20-25% 10-15% 5-10% 25-30% 5-10% 5-10% 15-20%
Top 3 Share % 65-70% 90-95% 95-100% 45-50% 70-75% 45-50% 55-60% 25-30%
Market Growth 3% 4% 5% 2% 2% 2% 4% 2%
PPG Position Top 3 Top 3 Top 3 Top 3 Top 3 Top 3 Top 3 Top 3
# of Customers tens tens hundreds hundreds hundreds hundreds hundreds
Macro Drivers
Metal packaging serves a variety of different segments
Total Packaging
•Standard of Living
•Glass Bottle Restriction in Asia
•“Green”
•Standard of Living
•Glass Bottle Restriction in Asia
•“Green”
•Changing Consumer Tastes
• Industrial Production
•Residential Construct-ion
•Standard of Living
•Changing Consumer Tastes
•Dietary Trends
•Global GDP Growth
•Standard of Living
•Birth Rates
•Personal Care Habits
•Growing Middle Class
Caps &
Closures
Bodies
Source: IRFAB, KNG, Orr & Boss and PPG Estimates
Other
•Brand Owner Design Capability
Food
Ends
Aerosol & General Line
Food, Aerosol & General Line
Beer & Beverage Monobloc &
Tubes
25

Metal Packaging Segment Examples
Food, Aerosol, General Line (FAGL)
Beer & Beverage
Food 25-30%
Caps and Closures
5-10%
3Pc Aerosol & General Line
5-10%
Monobloc Aerosol & Tubes
5-10%
2Pc DWI
FAEOE
3Pc Food
Draw-ReDraw (DRD)
Beverage Closures
Food Closures
3Pc Aerosol
General Line / Drums
Monobloc Aerosol
Aluminum Tubes
2Pc & 3Pc Bodies 20-25%
Easy Open Ends
10-15%
Source: PPG Estimates
Other
Other 15-20%
26
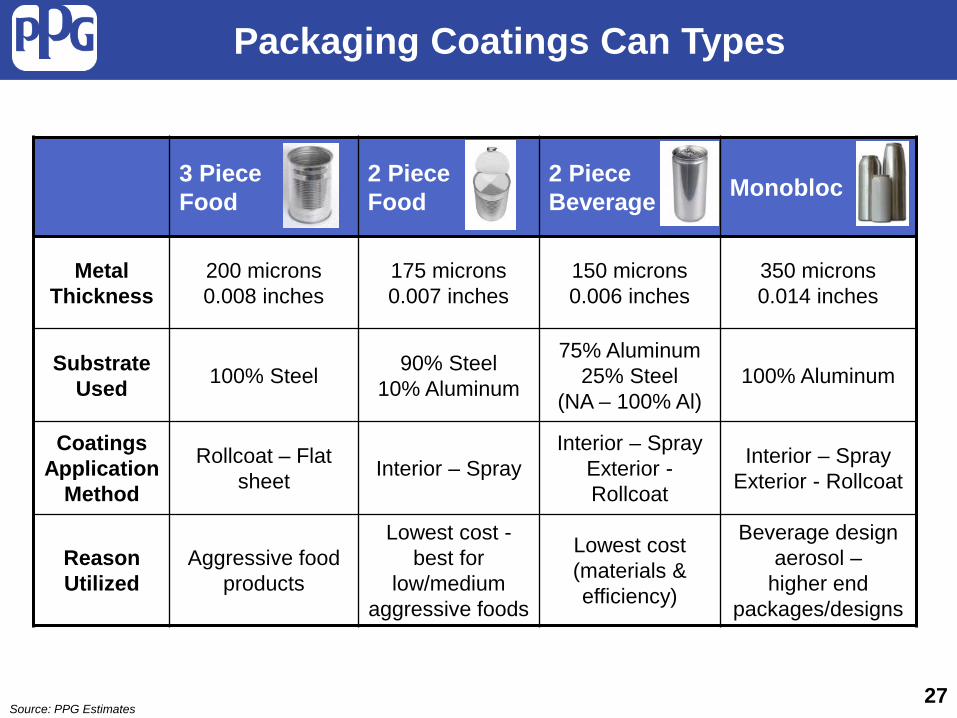
3 Piece Food
2 Piece Food
2 Piece Beverage Monobloc
Metal Thickness
200 microns 0.008 inches
175 microns 0.007 inches
150 microns 0.006 inches
350 microns 0.014 inches
Substrate Used 100% Steel 90% Steel
10% Aluminum
75% Aluminum 25% Steel
(NA – 100% Al) 100% Aluminum
Coatings Application
Method
Rollcoat – Flat sheet Interior – Spray
Interior – Spray Exterior - Rollcoat
Interior – Spray Exterior - Rollcoat
Reason Utilized
Aggressive food products
Lowest cost -best for
low/medium aggressive foods
Lowest cost (materials & efficiency)
Beverage design aerosol –
higher end packages/designs
Packaging Coatings Can Types
27 Source: PPG Estimates

Market Percent Application Method Viable For:
15-20%
Primary Purpose: For application of interior coatings of preformed cans
Advantages: Can coat non-planar surfaces
Application Challenges:
Maintain high transfer efficiency (75%), film thickness/coverage uniformity, increasing line speeds
Major Segments Used:
2Pc bev, 2Pc food, MAT
Types of Coating Application Spray Coating
28
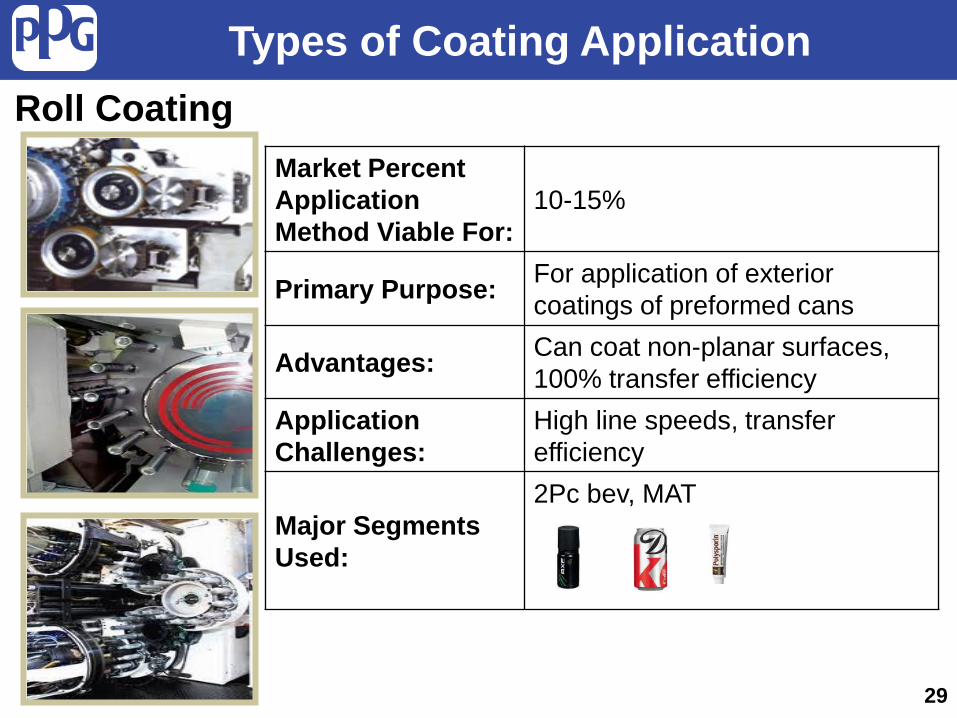
Market Percent Application Method Viable For:
10-15%
Primary Purpose: For application of exterior coatings of preformed cans
Advantages: Can coat non-planar surfaces, 100% transfer efficiency
Application Challenges:
High line speeds, transfer efficiency
Major Segments Used:
2Pc bev, MAT
Types of Coating Application Roll Coating
29

Market Percent Application Method Viable For:
60-65%
Primary Purpose: For application of interior and exterior coatings for steel/aluminum coils and sheets
Advantages: 100% transfer efficiency, low maintenance
Application Challenges:
Planar surfaces only, may require multiple layers, can formed after coating applied
Major Segments Used:
3Pc bev, 3Pc food, DRD, FAEOE, Caps and Closures, General line, 3Pc Aerosol, Bev EOE
Types of Coating Application: Coil and Sheet Coatings
30

Typical Metal Can Coatings: 3 Pc Food
3 Piece Food
Side Seam Stripe (SSS) –
Coating applied after the can is fabricated to protect the welded seam from corrosion
Ext. Clear - Protects metal from corrosion & assists in can mobility during processing
Interior Gold - Protects metal from corrosion
31
Note: Many food cans are heated after filled/sealed to sterilize contents. Coating must be
flexible due to can expansion/contraction

Typical Metal Can Coatings: 2 Pc Food DWI
2 Piece Food Drawn & Wall Ironed (DWI) Full Aperture Easy Open End (FAEOE)
Inside Spray
Washcoat
Post Repair Spray (PRS)
FAEOE Interior FAEOE Ext.
32

Typical Metal Can Coatings: 2 Pc Beverage
Over Varnish (OV) – protects the ink, allows movement in the filling can line, prevents scuffing during transportation
Inside Spray (IS) – prevents corrosion from packed product
Rim Coat - prevents corrosion of bottom of cans and allows for movement in the filling equipment
Easy Open End (EOE) Coating – prevents corrosion and assists in stamping of the end (Interior and Exterior)
2 Piece Beverage
Inks – provides decoration
33

Metal Can Coatings: General Line & Aerosol
General Line Aerosol
Interior coating: Protects metal from corrosion
Side Seam Stripe (SSS): Coating applied after the can is fabricated to protect the welded seam from corrosion
External coating: Protects metal from corrosion & assists in can mobility during processing
Inks and basecoats: Provides color and decoration
34

Typical Metal Can Coatings: Monobloc & Tubes
Monobloc Tubes
Over Varnish (OV) – protects the ink, allows movement in the filling can line, prevents scuffing during transportation
Inks and basecoats provides color and decoration
Inside Spray (IS) – prevents corrosion from packed product
Over Varnish (OV) – protects the ink, and provides various gloss effects
35
PPG Position
36
1999
1940 1950 1960 1970 1980 1990 2000 2010
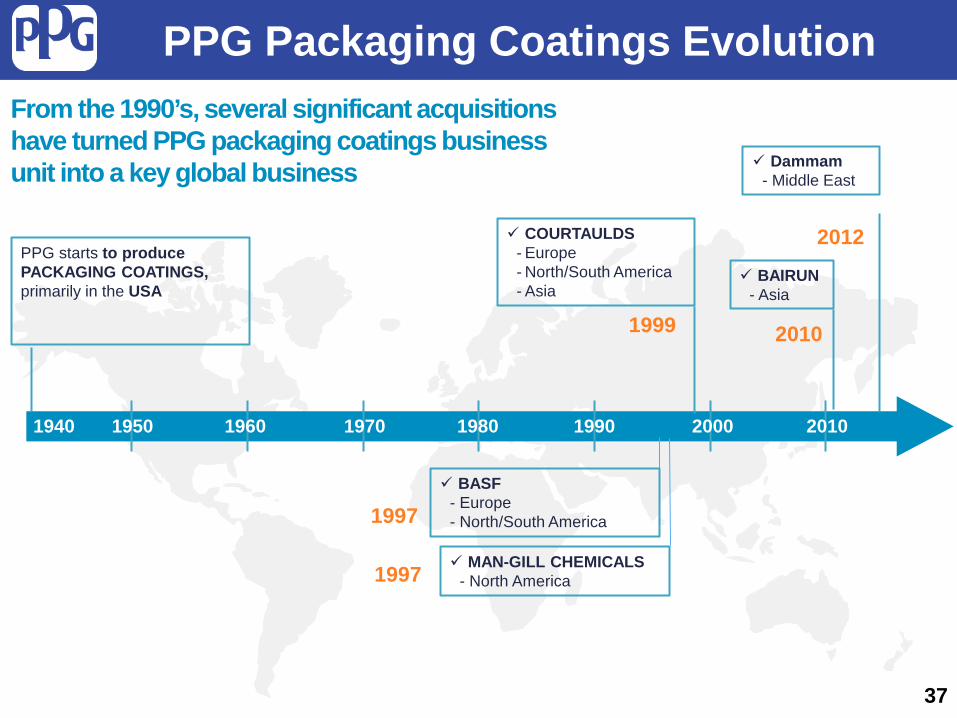
From the 1990’s, several significant acquisitions have turned PPG packaging coatings business unit into a key global business
PPG starts to produce PACKAGING COATINGS, primarily in the USA
1997 MAN-GILL CHEMICALS - North America
COURTAULDS - Europe - North/South America - Asia
1999
BAIRUN - Asia
2010
PPG Packaging Coatings Evolution
Dammam - Middle East
2012
BASF - Europe - North/South America 1997
37
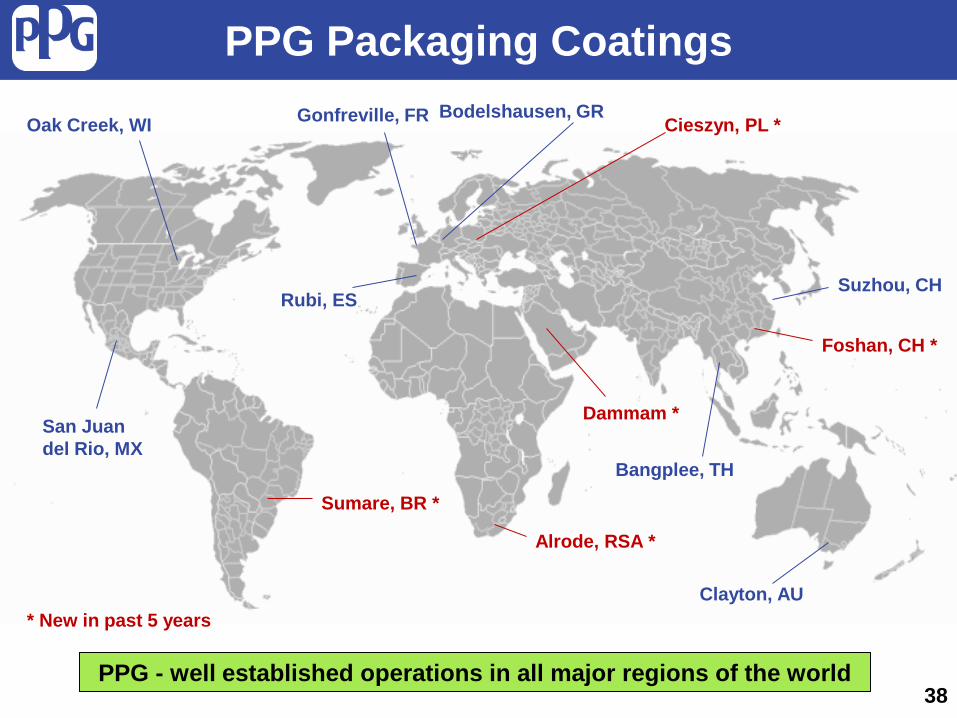
PPG Packaging Coatings
Oak Creek, WI
Sumare, BR *
Bodelshausen, GR Gonfreville, FR
Rubi, ES
Cieszyn, PL *
Alrode, RSA *
Dammam *
Suzhou, CH
Foshan, CH *
Clayton, AU
Bangplee, TH
San Juan del Rio, MX
38 PPG - well established operations in all major regions of the world
* New in past 5 years

PRODUCT RANGE
Beverage cans Food cans
Aerosols and tubes
Promotional packaging (General Line)
Complete systems ranging from pre-treatment,
coatings, compounds and
inks, for aluminium & steel cans and
ends.
Specialty packaging (General Line)
Industrial packaging
(General Line)
PPG Product Range
39
Caps & Closures

02/26/13
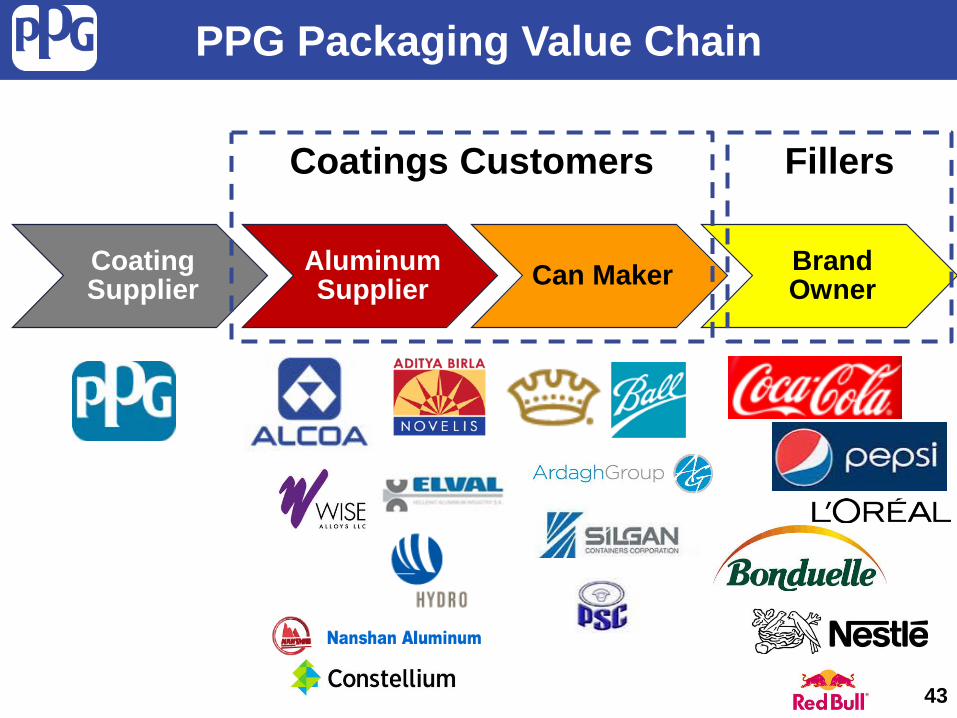
Value Chain
Coating Supplier
Aluminum Supplier Can Maker Brand
Owner
PPG Packaging Value Chain
40

02/26/13
Value Chain
Coating Supplier
Aluminum Supplier Can Maker Brand
Owner
PPG Packaging Value Chain
Coatings Customers
41

Packaging Coatings Can Makers
42 Can maker size ranges from large multi-national to local
02/26/13
Value Chain
Coating Supplier
Aluminum Supplier Can Maker Brand
Owner
PPG Packaging Value Chain
Coatings Customers Fillers
43

Packaging Coatings Fillers
44

EMEA > $1B
Customers Expected to Consolidate as Regions Mature
Others
Top 10 Customers Others
North America < $1B
Others
Asia Pacific > $0.5B
Top 10 Customers
Others
South America < $0.5B
Total Packaging Coatings Industry Customers Mix by Region
Top 10 Customers
Top 10 Customers
45 Source: PPG Estimates
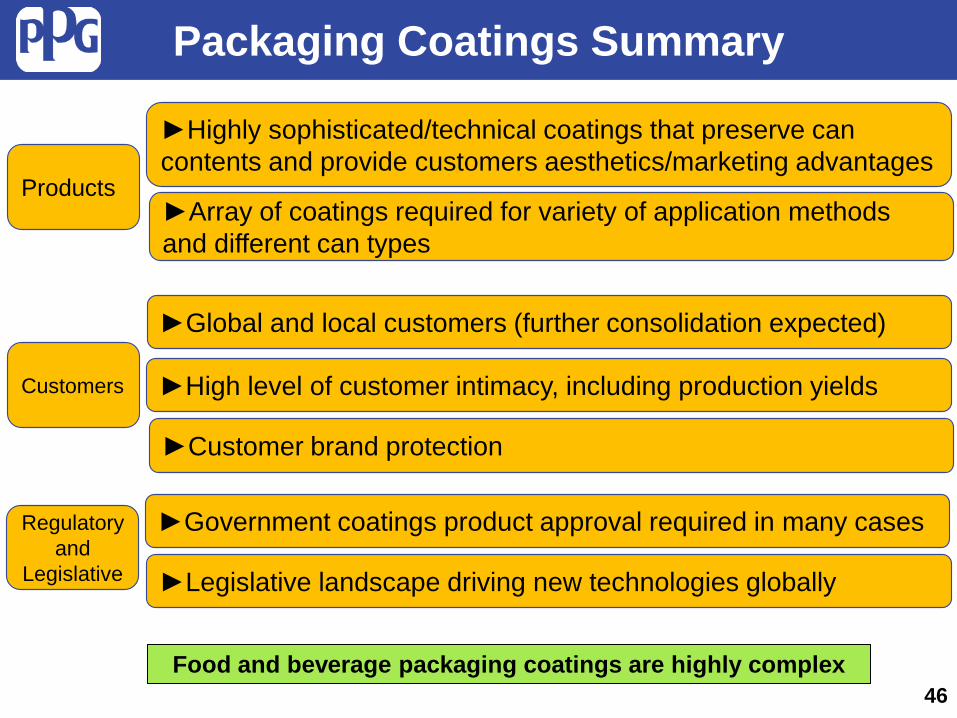
Packaging Coatings Summary
46
►Highly sophisticated/technical coatings that preserve can contents and provide customers aesthetics/marketing advantages
►Array of coatings required for variety of application methods and different can types
►Global and local customers (further consolidation expected)
►High level of customer intimacy, including production yields
►Customer brand protection
►Government coatings product approval required in many cases
Food and beverage packaging coatings are highly complex
Products
Customers
Regulatory and
Legislative ►Legislative landscape driving new technologies globally
Recent Industry Trends
47
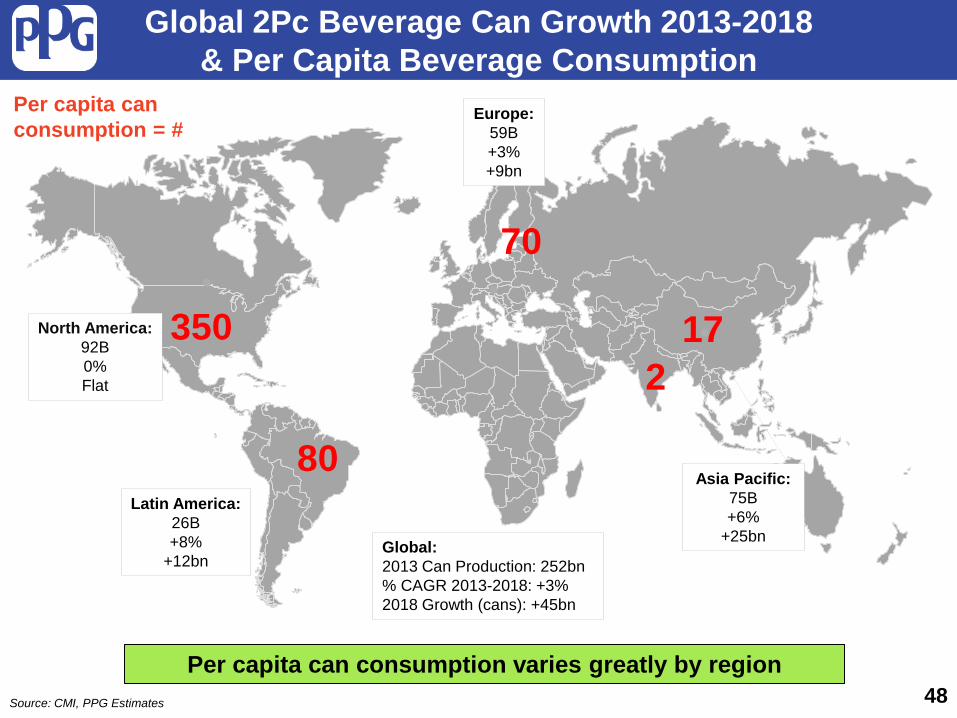
Asia Pacific: 75B +6%
+25bn
Europe: 59B +3% +9bn
Latin America: 26B +8%
+12bn
North America: 92B 0% Flat
Global 2Pc Beverage Can Growth 2013-2018 & Per Capita Beverage Consumption
Global: 2013 Can Production: 252bn % CAGR 2013-2018: +3% 2018 Growth (cans): +45bn
350 17
70
80
Per capita can consumption = #
48 Per capita can consumption varies greatly by region
Source: CMI, PPG Estimates
2
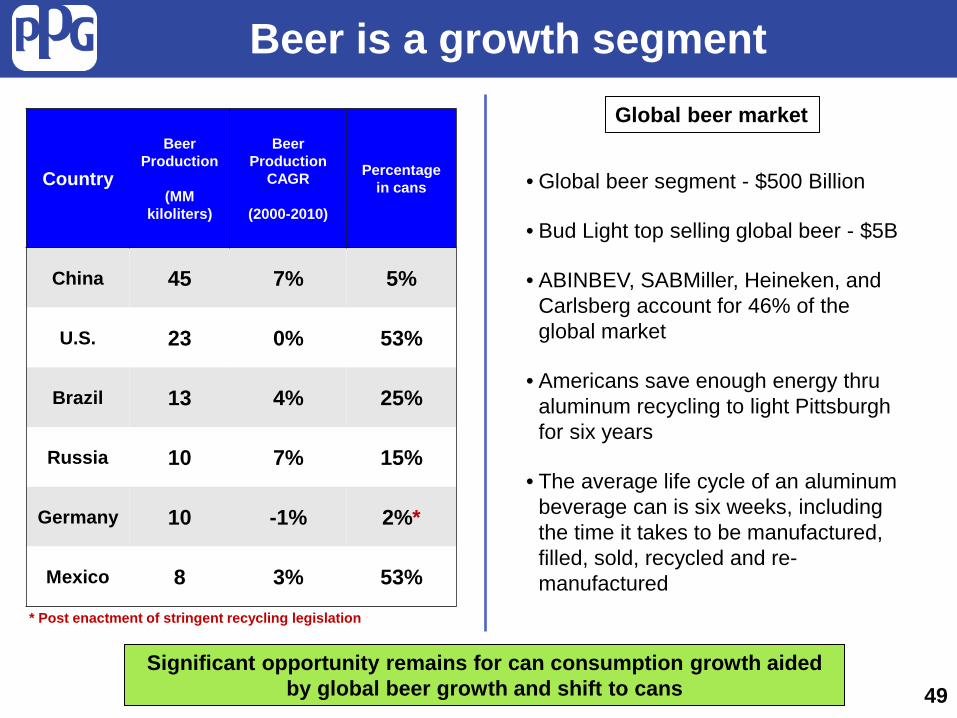
• Global beer segment - $500 Billion
• Bud Light top selling global beer - $5B
• ABINBEV, SABMiller, Heineken, and Carlsberg account for 46% of the global market
• Americans save enough energy thru aluminum recycling to light Pittsburgh for six years
• The average life cycle of an aluminum beverage can is six weeks, including the time it takes to be manufactured, filled, sold, recycled and re-manufactured
Country
Beer Production
(MM
kiloliters)
Beer Production
CAGR
(2000-2010)
Percentage in cans
China 45 7% 5%
U.S. 23 0% 53%
Brazil 13 4% 25%
Russia 10 7% 15%
Germany 10 -1% 2%*
Mexico 8 3% 53%
Beer is a growth segment
49 of 129 49
* Post enactment of stringent recycling legislation
Significant opportunity remains for can consumption growth aided by global beer growth and shift to cans
Global beer market
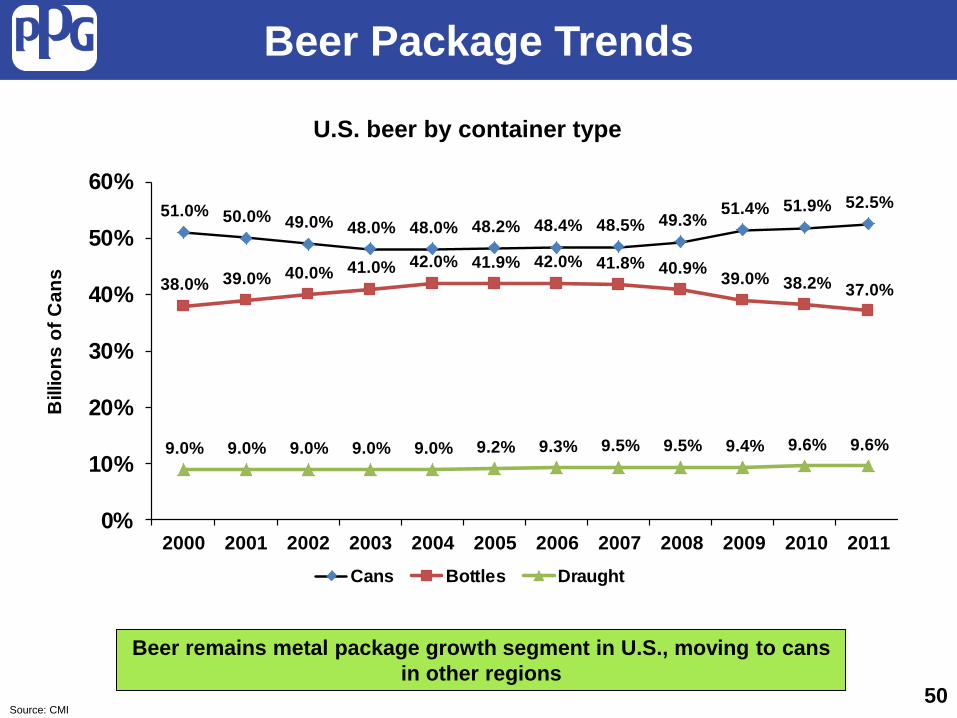
51.0% 50.0% 49.0% 48.0% 48.0% 48.2% 48.4% 48.5% 49.3% 51.4% 51.9% 52.5%
38.0% 39.0% 40.0% 41.0% 42.0% 41.9% 42.0% 41.8% 40.9% 39.0% 38.2% 37.0%
9.0% 9.0% 9.0% 9.0% 9.0% 9.2% 9.3% 9.5% 9.5% 9.4% 9.6% 9.6%
0%
10%
20%
30%
40%
50%
60%
2000 2001 2002 2003 2004 2005 2006 2007 2008 2009 2010 2011
Bill
ions
of C
ans
Cans Bottles Draught
Beer Package Trends
Source: CMI 50
Beer remains metal package growth segment in U.S., moving to cans in other regions
U.S. beer by container type

Packaging Innovation Concentrated around Consumption Cycle Stages
Source: CMI & Ball Corp
Green-Driven
Utility-Driven
Visual Appeal
Quality-Driven
• Creating environmentally friendly packaging
• Example: Ball’s ReAlTM metal technology
• Providing convenience and added value to consumers with features
• Example: aluminum re-sealable bottles & full aperture beverage end
• Providing features that enhance the quality of the product, perceived or actual
• Example: SmoothPour® end
• Spurring interest and intrigue with eye-catching iconic components of packaging
• Example: High-res photo quality ink printing & customizable laser-incised tabs
Post Consumption
Pre-Consumption
During Consumption
51

• Broader range of can sizes increase brand owner offering
Brand Owners Using Can to Rejuvenate Products
• 500MM bottle cans
• 3 new can manufacturing lines in U.S.
Bow-Tie Can
Slim Can
• Multiple shapes re-invigorate brands
• Can design intended to draw younger consumers to brand
• Slimmer shape targeting energy drinks and women
Bottle Can
Expanded Size
52
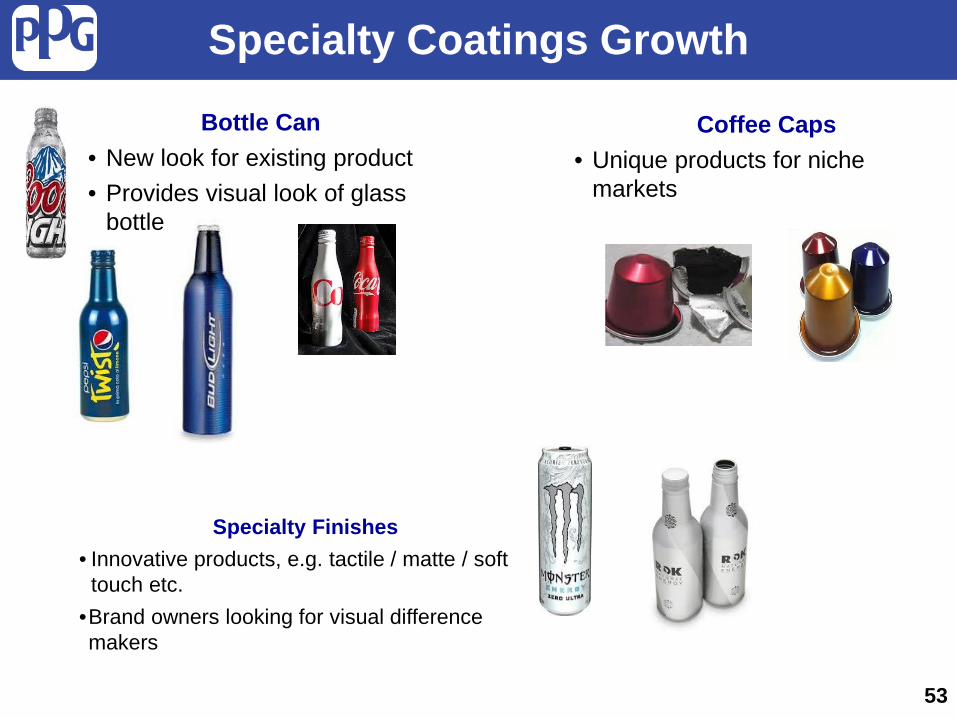
Specialty Coatings Growth
Specialty Finishes • Innovative products, e.g. tactile / matte / soft
touch etc. •Brand owners looking for visual difference makers
Bottle Can • New look for existing product • Provides visual look of glass
bottle
Coffee Caps • Unique products for niche
markets
53
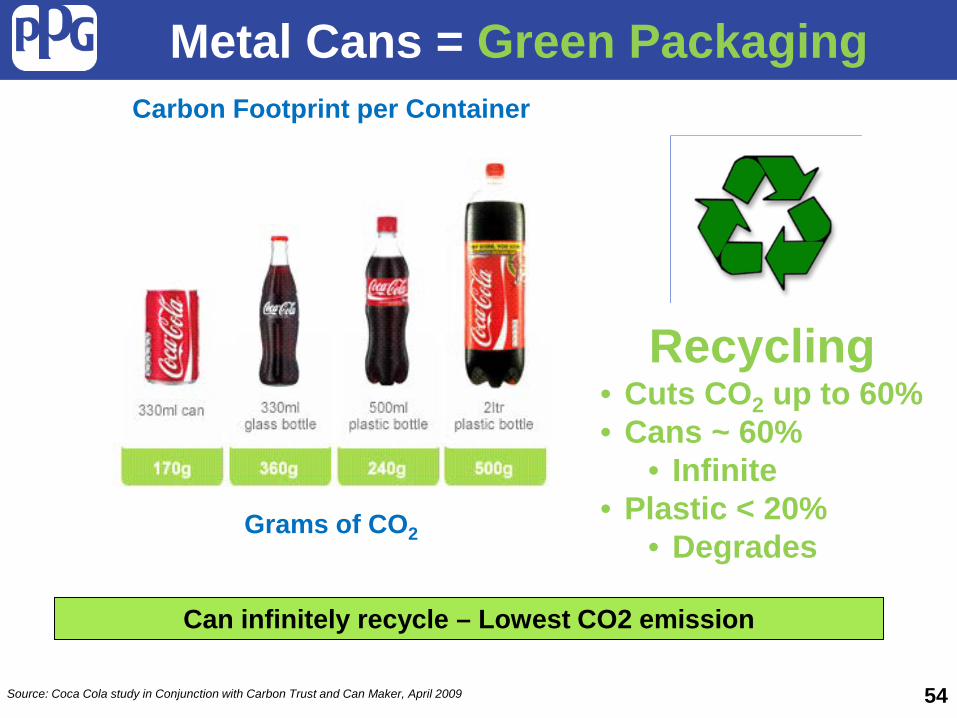
Metal Cans = Green Packaging
Can infinitely recycle – Lowest CO2 emission
Recycling • Cuts CO2 up to 60% • Cans ~ 60%
• Infinite • Plastic < 20%
• Degrades
Source: Coca Cola study in Conjunction with Carbon Trust and Can Maker, April 2009
Carbon Footprint per Container
Grams of CO2
54

U.S. Recycling Rates (%)
Aluminum Beverage Can Steel Containers
0
10
20
30
40
50
60
70
80
90
100
2003 2004 2005 2006 2007 2008 2009 2010 20110
10
20
30
40
50
60
70
80
90
100
2003 2004 2005 2006 2007 2008 2009 2010
55 Recycling rates on the rise
Source: CMI
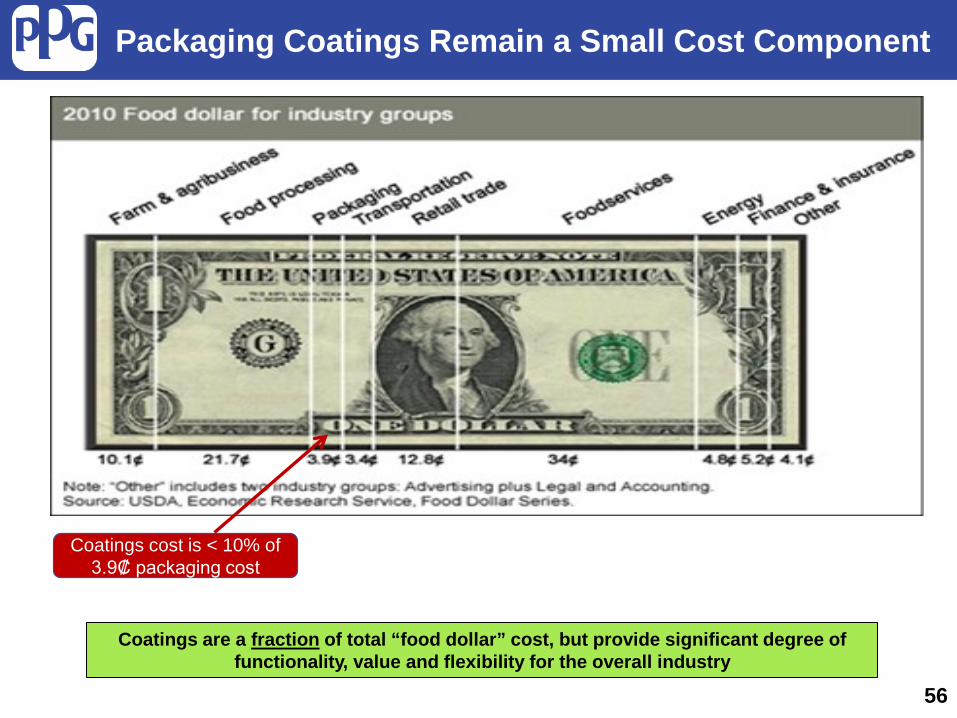
Packaging Coatings Remain a Small Cost Component
Coatings are a fraction of total “food dollar” cost, but provide significant degree of functionality, value and flexibility for the overall industry
56
Coatings cost is < 10% of 3.9₡ packaging cost
Key Industry Trends
57
• BPA-NI Development and Commercialization • Growth Opportunities in Emerging Regions
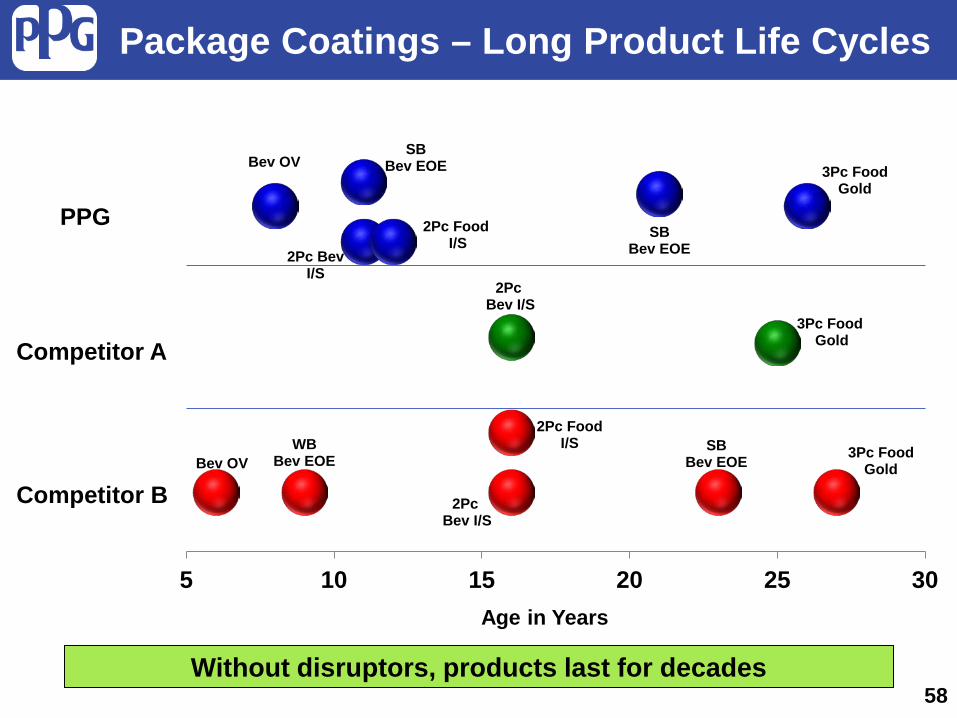
Package Coatings – Long Product Life Cycles
SB Bev EOE
WB Bev EOE
SB Bev EOE
SB Bev EOE
2Pc Bev I/S
2Pc Bev I/S
2Pc Bev I/S
3Pc Food Gold
3Pc Food Gold
3Pc Food Gold
2Pc Food I/S
2Pc Food I/S
Bev OV
Bev OV
5 10 15 20 25 30Age in Years
PPG
Competitor B
Competitor A
58 Without disruptors, products last for decades
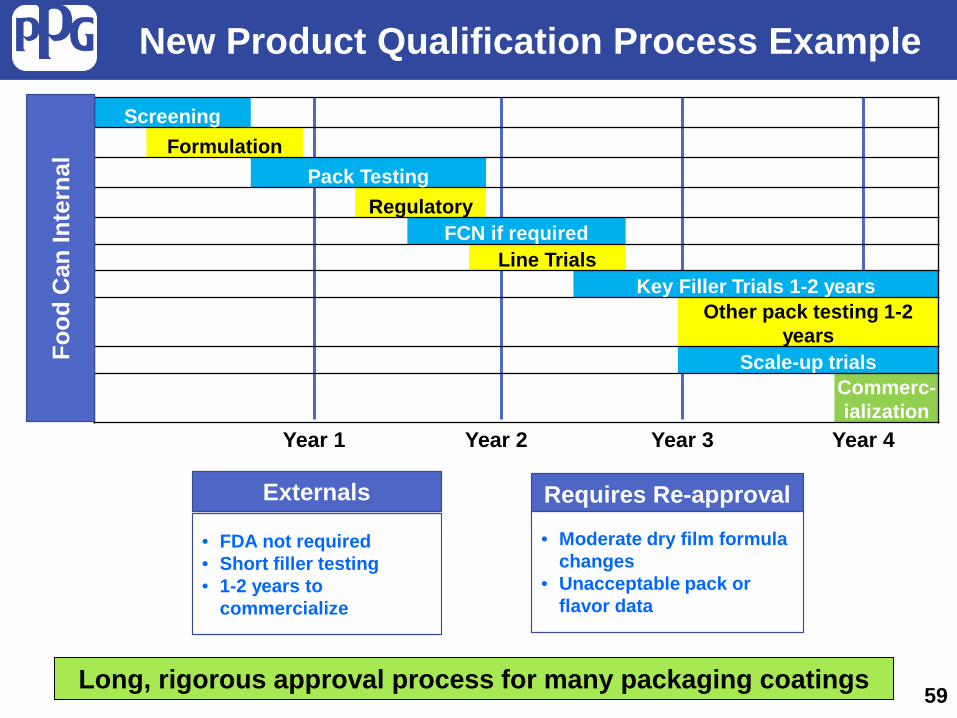
Screening Formulation
Pack Testing Regulatory
FCN if required Line Trials
Key Filler Trials 1-2 years Other pack testing 1-2
years Scale-up trials
Commerc-ialization
New Product Qualification Process Example Fo
od C
an In
tern
al
• FDA not required • Short filler testing • 1-2 years to
commercialize
Externals Requires Re-approval
• Moderate dry film formula changes
• Unacceptable pack or flavor data
Year 1 Year 2 Year 3 Year 4
59 Long, rigorous approval process for many packaging coatings
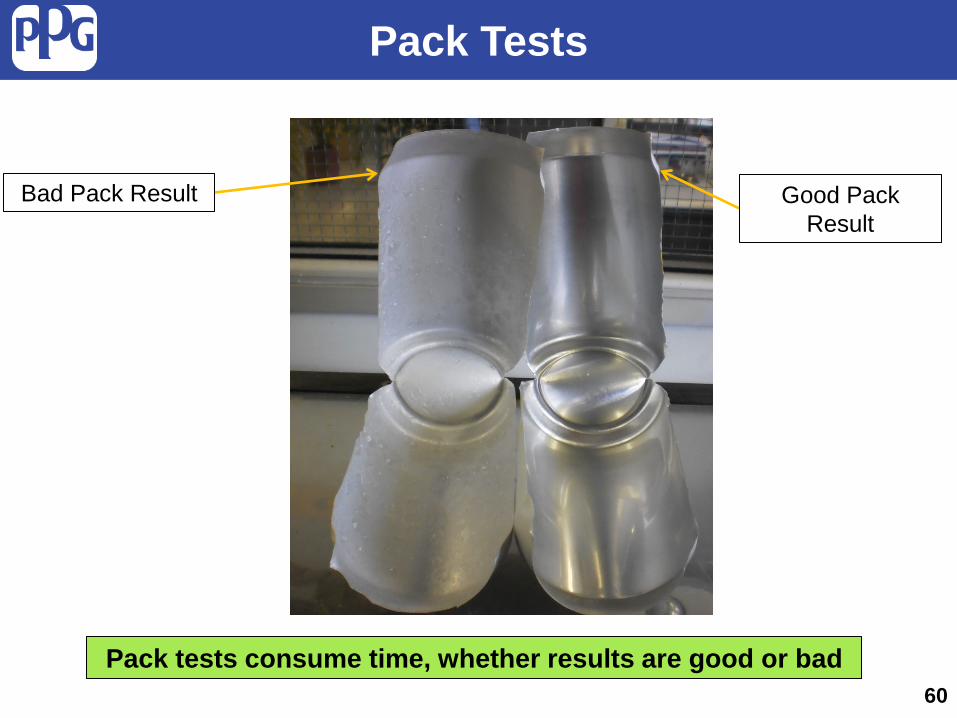
Pack Tests
Pack tests consume time, whether results are good or bad
Bad Pack Result Good Pack Result
60
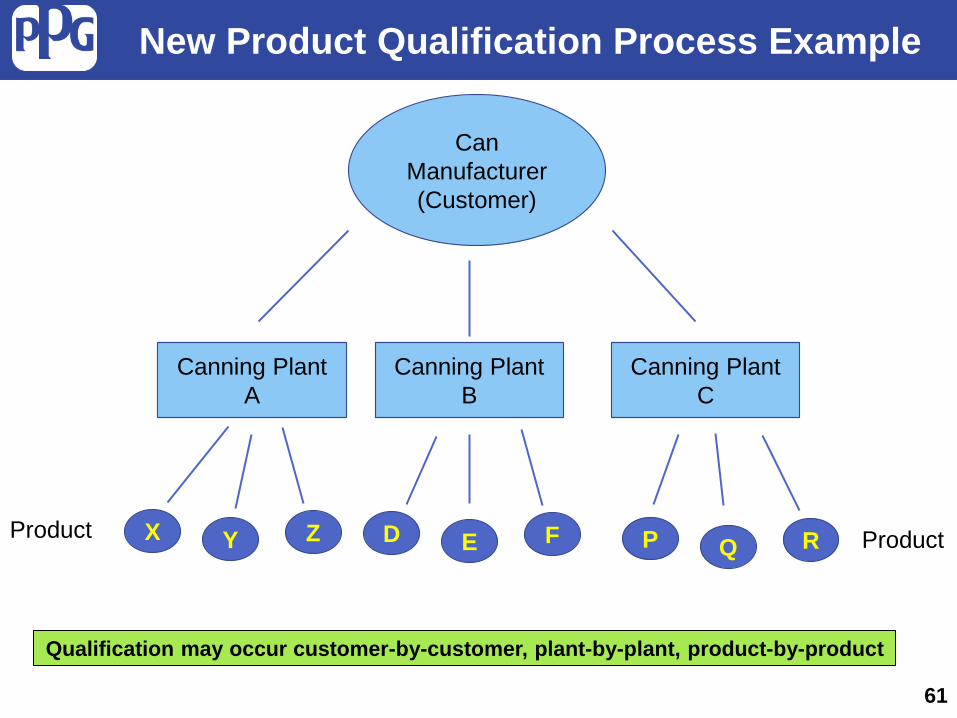
Product
61
Can Manufacturer (Customer)
Canning Plant A
Canning Plant B
Canning Plant C
Z Y X F E D R Q P Product
Qualification may occur customer-by-customer, plant-by-plant, product-by-product
New Product Qualification Process Example

Epoxy Coatings Attributes
• Excellent adhesion to various metals • Excellent corrosion resistance • Low impact on flavor • Long shelf life • Flexibility • Chemical/Pack resistance • Cost effective • Formulation and application latitude
62
New technologies need to replicate functional attributes of epoxy coatings
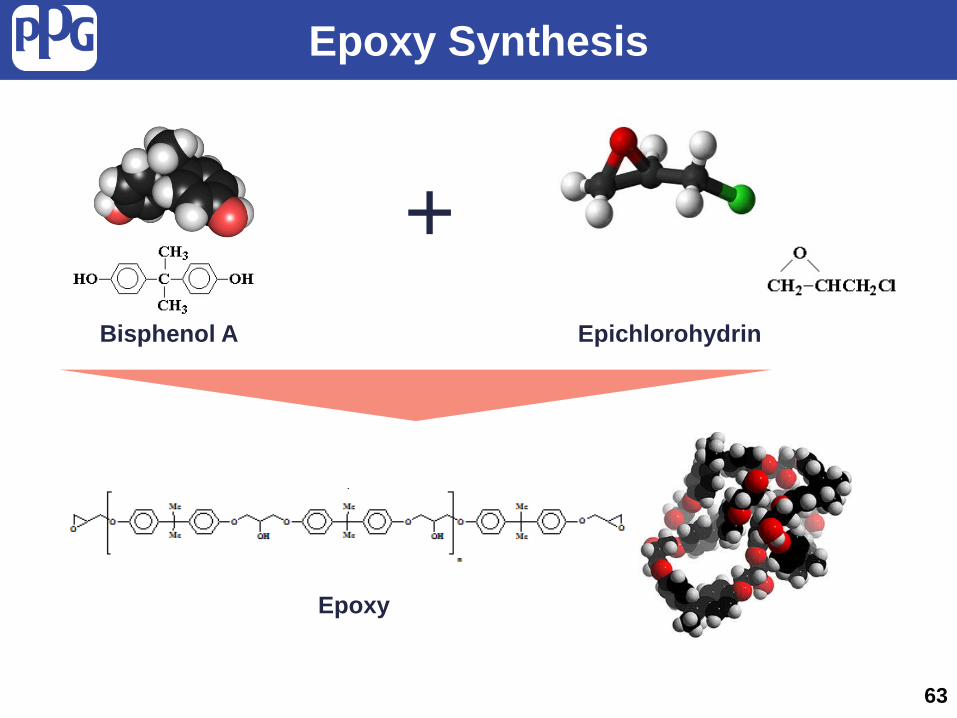
Epoxy Synthesis
+
Epoxy
Epichlorohydrin Bisphenol A
63
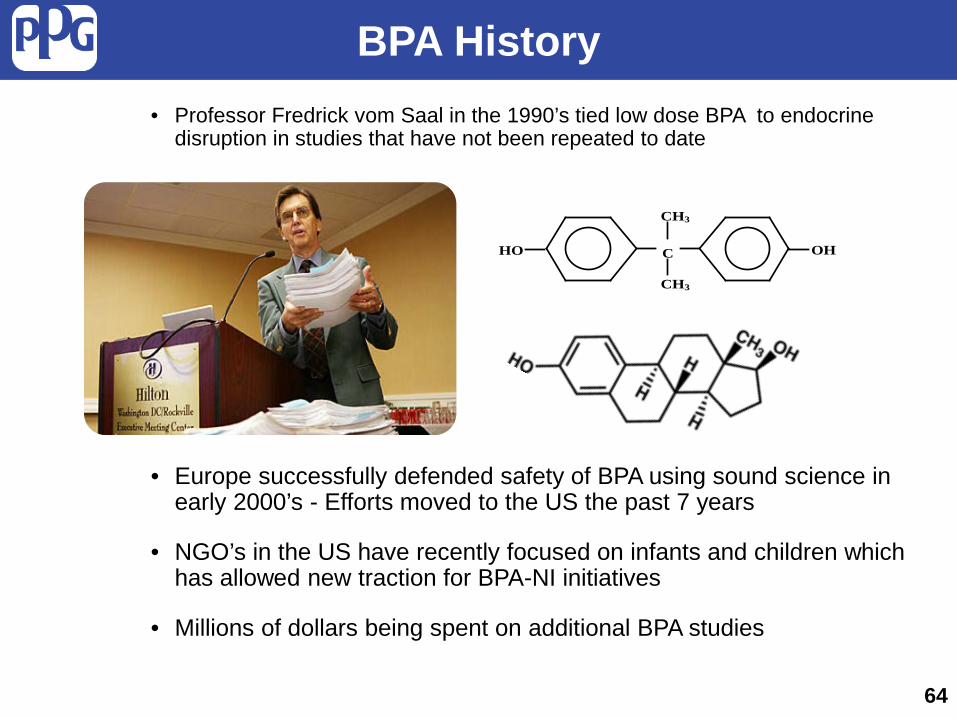
BPA History
• Professor Fredrick vom Saal in the 1990’s tied low dose BPA to endocrine disruption in studies that have not been repeated to date
• Europe successfully defended safety of BPA using sound science in early 2000’s - Efforts moved to the US the past 7 years
• NGO’s in the US have recently focused on infants and children which has allowed new traction for BPA-NI initiatives
• Millions of dollars being spent on additional BPA studies
CHO
CH3
CH3
OH
64
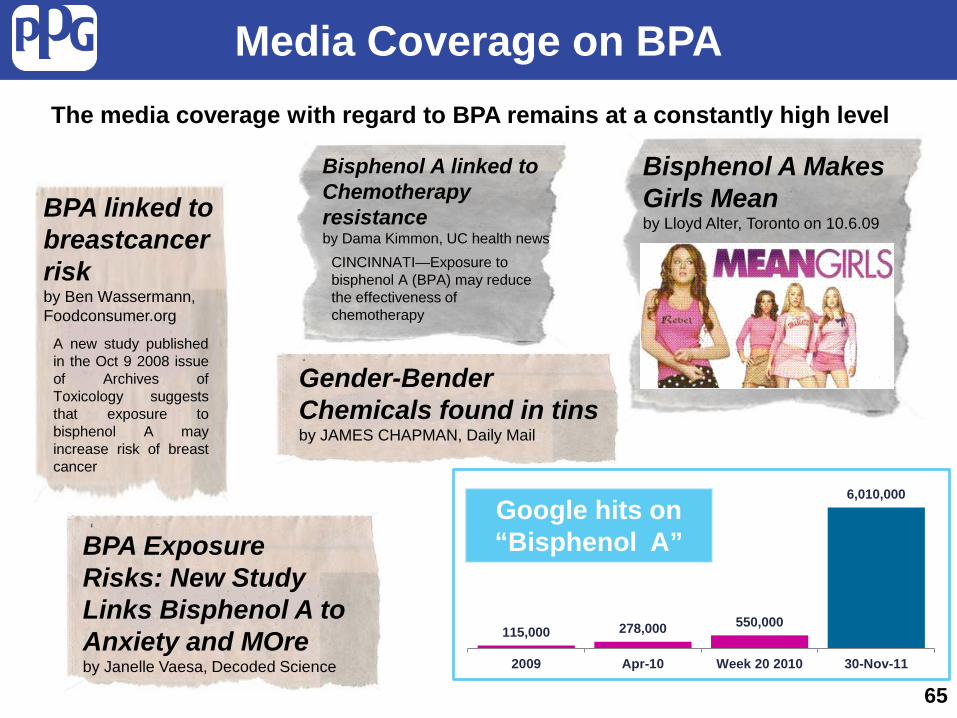
The media coverage with regard to BPA remains at a constantly high level
Media Coverage on BPA
Bisphenol A Makes Girls Mean by Lloyd Alter, Toronto on 10.6.09
BPA linked to breastcancer risk by Ben Wassermann, Foodconsumer.org
A new study published in the Oct 9 2008 issue of Archives of Toxicology suggests that exposure to bisphenol A may increase risk of breast cancer
Bisphenol A linked to Chemotherapy resistance by Dama Kimmon, UC health news
CINCINNATI—Exposure to bisphenol A (BPA) may reduce the effectiveness of chemotherapy
115,000 278,000 550,000
6,010,000
2009 Apr-10 Week 20 2010 30-Nov-11
Google hits on “Bisphenol A”
Gender-Bender Chemicals found in tins by JAMES CHAPMAN, Daily Mail
BPA Exposure Risks: New Study Links Bisphenol A to Anxiety and MOre by Janelle Vaesa, Decoded Science
65
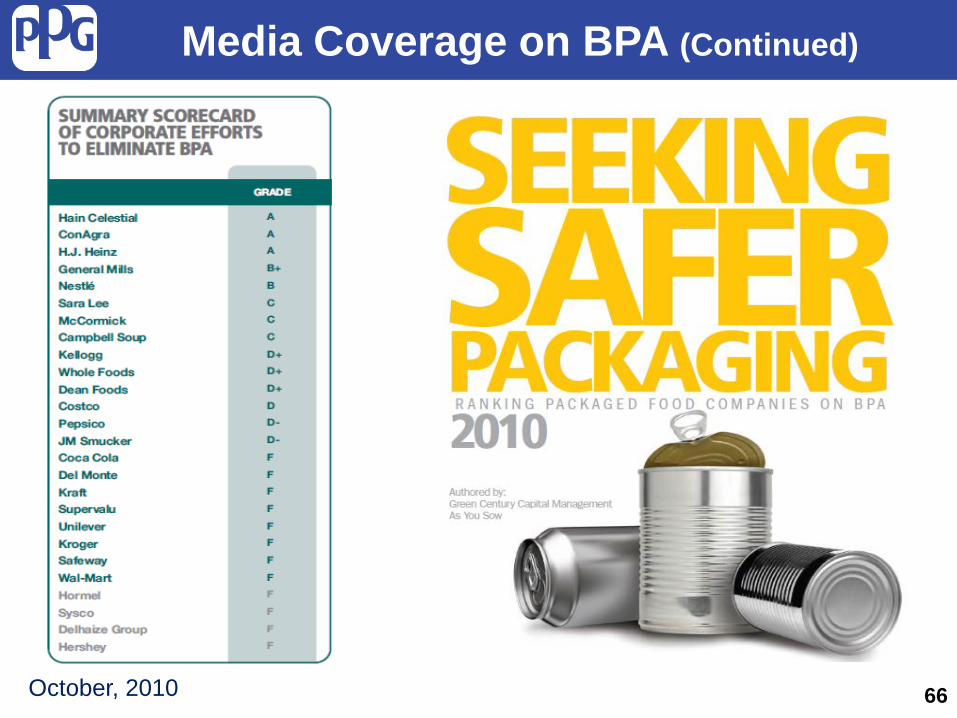
Media Coverage on BPA (Continued)
66 October, 2010

BPA is Almost Everywhere
Electrical boards, switches, lamps, parts for kitchen tools, hair dryers, razors
Glazing, corrosion protection, concrete reinforcement, flooring
Lenses, dialysis devices, blood sample reservoirs, medical equipment, dental fillings
Mobile phone housings, CD´s, DVD´s, computer circuit boards
Front & rear light covers, interior equipment parts, covers, automotive coatings
Sports helmets, safety glasses, visors, toys, racing boats, ski/golf/tennis equipments Architecture
Medical practice
Entertainment & Communication
Automotive
Leisure and safety
Food & beverage Household equipment
food and drink cans, bottles, cutlery, food storage containers, jar sealants
House hold equipments
67

BPA Activities Around The Globe
68
1998 2005 2006 2007 2008 2009 2010 2011 2012 2013 2014
Vom Saal publishes low-dose theory
Harvard Center Review
115 BPA studies globally
Canada bans BPA for baby bottles & infant formula cans
Minnesota bans BPA in baby bottles
FDA re-affirms BPA safety
Connecticut bans BPA use in infant formula cans
France proposes initial bill to ban BPA in food packaging
Sweden bans BPA in food packaging materials for children
France & Belgium ban BPA in packaging materials intended for children
France bans BPA in all food packaging
EFSA re-affirms BPA safety
Vom Saal Review Follow-up study
Nor
th A
mer
ica
Euro
pe
FDA re-affirms BPA safety

BPA Legislative Update North America EMEA
• All infant formula cans converted to BPA-NI (Connecticut law banning BPA in baby bottles, cups, and canned infant formula - October 2011)
• 30 BPA initiatives have been introduced in 13 states plus one in Puerto Rico during 2013
• Minnesota, Maine and Nevada have all recently passed BPA initiatives for 2014
• France is unmoved by EFSA report findings and proposes BPA ban for:
• January 1, 2013 – infant formula
• January 1, 2014 – all canned food products
• Belgium has proposed a law
banning BPA in food packaging material for children. Effective in January 2013
69
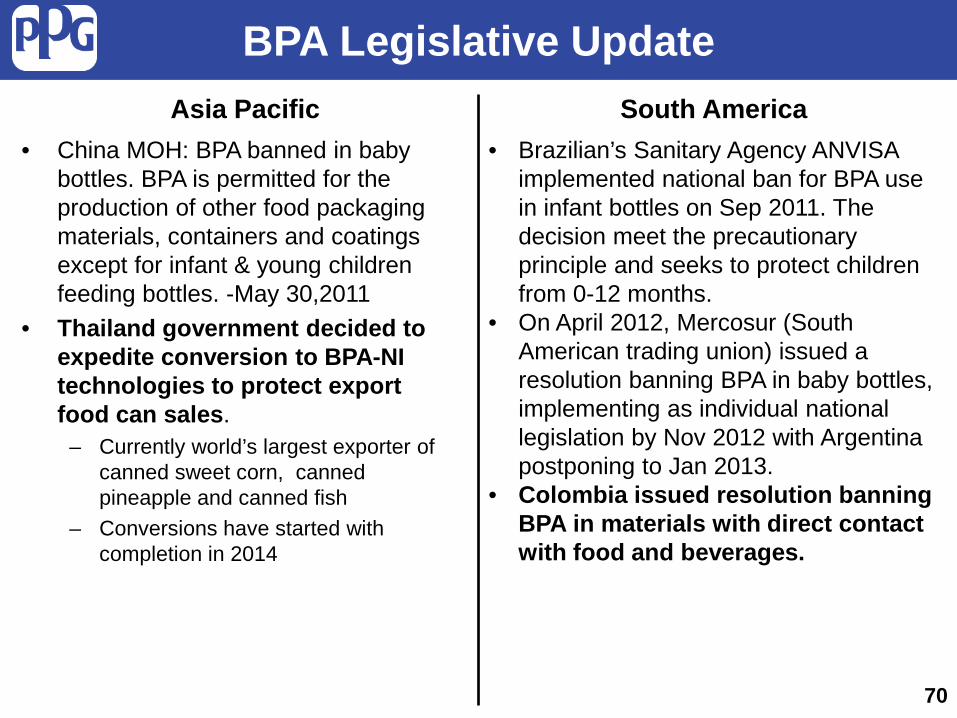
BPA Legislative Update South America Asia Pacific
• China MOH: BPA banned in baby bottles. BPA is permitted for the production of other food packaging materials, containers and coatings except for infant & young children feeding bottles. -May 30,2011
• Thailand government decided to expedite conversion to BPA-NI technologies to protect export food can sales.
– Currently world’s largest exporter of canned sweet corn, canned pineapple and canned fish
– Conversions have started with completion in 2014
• Brazilian’s Sanitary Agency ANVISA implemented national ban for BPA use in infant bottles on Sep 2011. The decision meet the precautionary principle and seeks to protect children from 0-12 months.
• On April 2012, Mercosur (South American trading union) issued a resolution banning BPA in baby bottles, implementing as individual national legislation by Nov 2012 with Argentina postponing to Jan 2013.
• Colombia issued resolution banning BPA in materials with direct contact with food and beverages.
70

Washington Post - February 23, 2010
"It doesn't matter what the FDA says. If consumers decide they don't want BPA, you don't want to be in a can that consumers don't want to buy," …said one source at a major U.S. food company who spoke on the condition of anonymity.
71
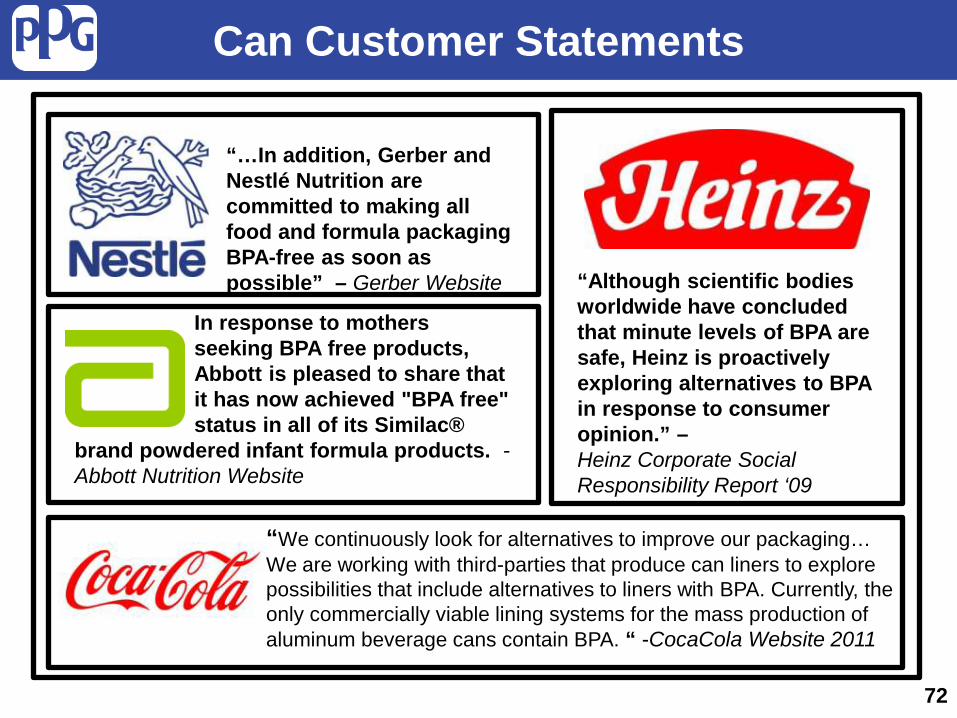
“…In addition, Gerber and Nestlé Nutrition are committed to making all food and formula packaging BPA-free as soon as possible” – Gerber Website “Although scientific bodies
worldwide have concluded that minute levels of BPA are safe, Heinz is proactively exploring alternatives to BPA in response to consumer opinion.” – Heinz Corporate Social Responsibility Report ‘09
In response to mothers seeking BPA free products, Abbott is pleased to share that it has now achieved "BPA free" status in all of its Similac®
brand powdered infant formula products. - Abbott Nutrition Website
“We continuously look for alternatives to improve our packaging… We are working with third-parties that produce can liners to explore possibilities that include alternatives to liners with BPA. Currently, the only commercially viable lining systems for the mass production of aluminum beverage cans contain BPA. “ -CocaCola Website 2011
Can Customer Statements
72

North America Customer Actions
• Infant liquid and powdered formula in cans converted 2011
• Smaller organic food companies (Amy’s Kitchen, Eden Foods) proactively converting to BPA-NI
• Campbell’s Soups announced desire (February 2012) to convert to BPA-NI - no specific timeline but conversions have started
73
EMEA Industry Actions
• Nestle announced global conversion in all segments to BPA-NI by end of 2014
• Bonduelle in France moving forward with BPA-NI food can coatings in advance of French legislation
• Major European fillers moving quickly to supply BPA-NI cans to avoid labeling requirements
74

Regional BPA Conversion Catalysts
75
Legislative Consumer Export Likely
regional conversion
catalyst
Conversion catalyst(s) will likely differ by region
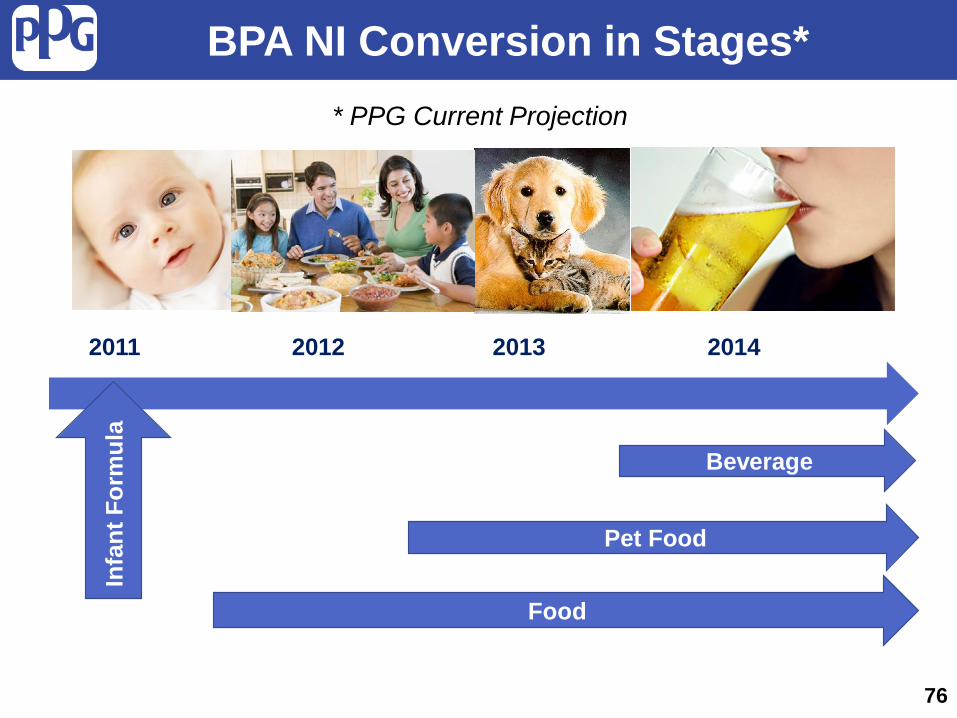
BPA NI Conversion in Stages*
2011 2012 2013 2014
Infa
nt F
orm
ula
Food
Pet Food
Beverage
* PPG Current Projection
76
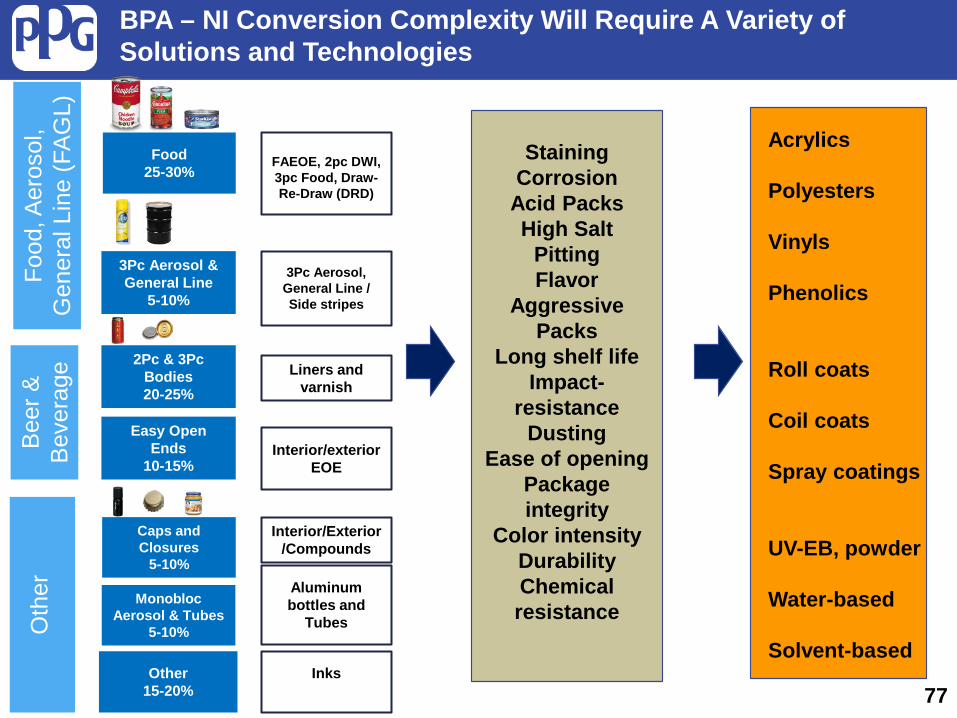
77
Food 25-30%
FAEOE, 2pc DWI, 3pc Food, Draw-Re-Draw (DRD)
3Pc Aerosol & General Line
5-10%
3Pc Aerosol, General Line / Side stripes
Food
, Aer
osol
, G
ener
al L
ine
(FA
GL)
B
eer &
B
ever
age
Oth
er
2Pc & 3Pc Bodies 20-25%
Easy Open Ends
10-15%
Caps and Closures
5-10%
Monobloc Aerosol & Tubes
5-10%
Other 15-20%
Liners and varnish
Interior/exterior EOE
Interior/Exterior/Compounds
Aluminum bottles and
Tubes
Inks
Staining Corrosion
Acid Packs High Salt
Pitting Flavor
Aggressive Packs
Long shelf life Impact-
resistance Dusting
Ease of opening Package integrity
Color intensity Durability Chemical resistance
Acrylics Polyesters Vinyls Phenolics Roll coats Coil coats Spray coatings UV-EB, powder Water-based Solvent-based
BPA – NI Conversion Complexity Will Require A Variety of Solutions and Technologies
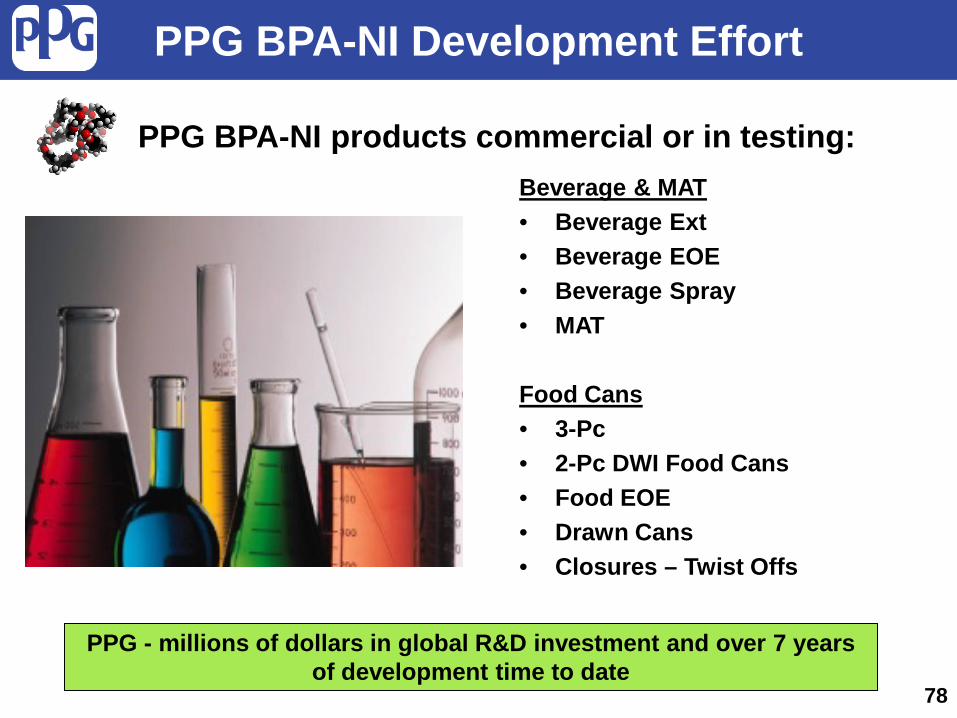
PPG BPA-NI Development Effort
PPG - millions of dollars in global R&D investment and over 7 years of development time to date
78
Beverage & MAT • Beverage Ext • Beverage EOE • Beverage Spray • MAT Food Cans • 3-Pc • 2-Pc DWI Food Cans • Food EOE • Drawn Cans • Closures – Twist Offs
PPG BPA-NI products commercial or in testing:
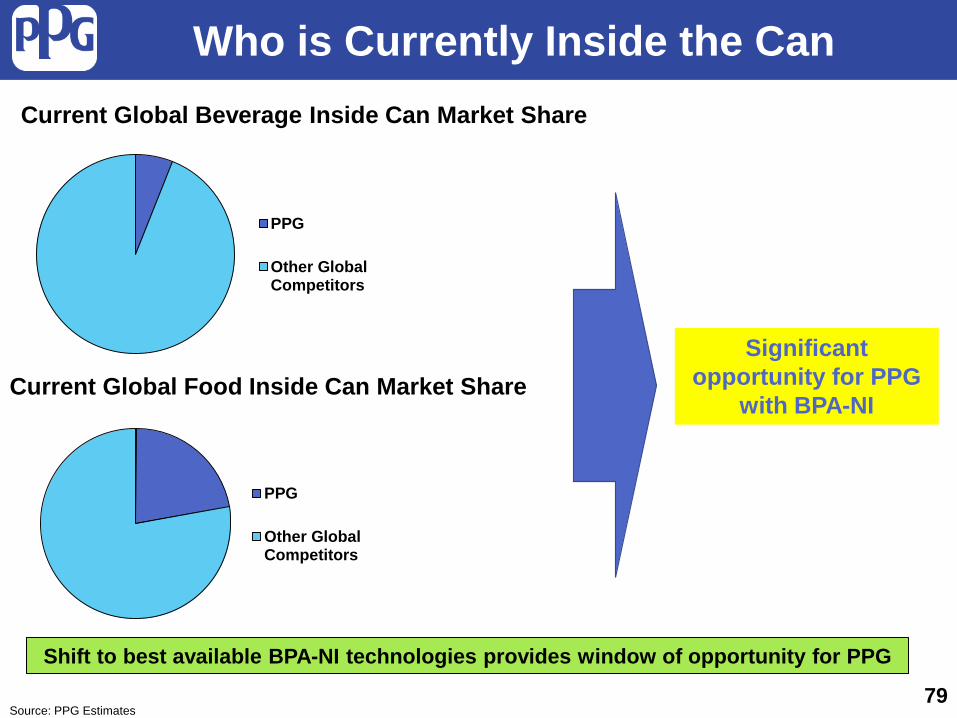
Who is Currently Inside the Can
PPG
Other GlobalCompetitors
PPG
Other GlobalCompetitors
Current Global Beverage Inside Can Market Share
Current Global Food Inside Can Market Share Significant
opportunity for PPG with BPA-NI
79
Shift to best available BPA-NI technologies provides window of opportunity for PPG
Source: PPG Estimates

Inside a Beverage Can – North America
PPG
Other GlobalCompetitors
N.A. Beverage Inside Can Market Share
80
Potential share gain opportunities for PPG in N.A. market
PPG’s history of no “inside the can” share provides market share upside as can makers
convert to best available technologies
Source: PPG Estimates
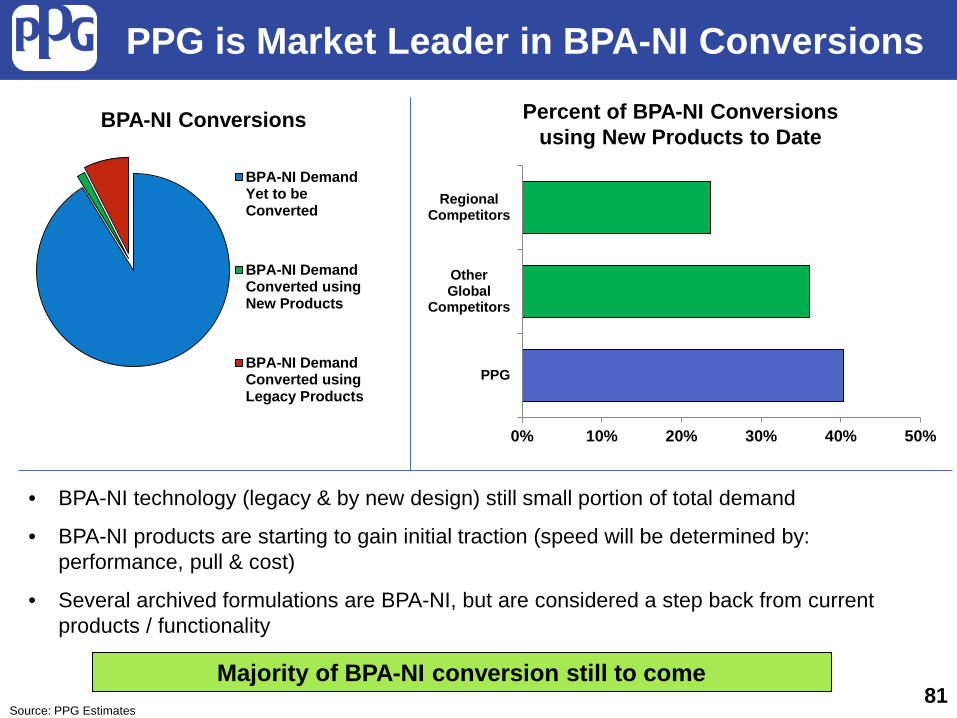
• BPA-NI technology (legacy & by new design) still small portion of total demand
• BPA-NI products are starting to gain initial traction (speed will be determined by: performance, pull & cost)
• Several archived formulations are BPA-NI, but are considered a step back from current products / functionality
BPA-NI Conversions
BPA-NI DemandYet to beConverted
BPA-NI DemandConverted usingNew Products
BPA-NI DemandConverted usingLegacy Products
0% 10% 20% 30% 40% 50%
PPG
OtherGlobal
Competitors
RegionalCompetitors
PPG is Market Leader in BPA-NI Conversions
Percent of BPA-NI Conversions using New Products to Date
81 Source: PPG Estimates
Majority of BPA-NI conversion still to come

BPA Status / Summary
• Media and NGO pressure, coupled with regional legislative action, will likely drive brand owners (fillers) to eliminate BPA from metal packaging coatings in the short-to-medium term
• New BPA-NI coating technologies are being introduced to the marketplace to replace epoxy systems
• Unique opportunity for PPG due to share position on the inside of the can
• PPG committed to developing new technologies that meet the customer’s requirements
82

Asia Pacific: 75B +6%
+25bn
Europe: 59B +3% +9bn
Latin America: 26B +8%
+12bn
North America: 92B 0% Flat
Global 2Pc Beverage Can Growth 2013-2018 & Per Capita Beverage Consumption
Global: 2013 Can Production: 252bn % CAGR 2013-2018: +3% 2018 Growth (cans): +45bn
350 17
70
80
Per capita can consumption = #
83 Emerging regions provide significant opportunity for can growth
Source: CMI, PPG Estimates
2

Packaging Production Growth
0.80
1.00
1.20
1.40
1.60
2009 2010 2011 2012 2013
Global Asia/Pacific
Metal Can Production
Source: IHS Global Insights; PPG Estimates
0.80
1.00
1.20
1.40
1.60
2009 2010 2011 2012 2013
China Metal Can ProductionChina GDP
China Metal Can Production Outpaces GDP
Asia driving recent and future growth in metal can production 84
Indexed to 2009
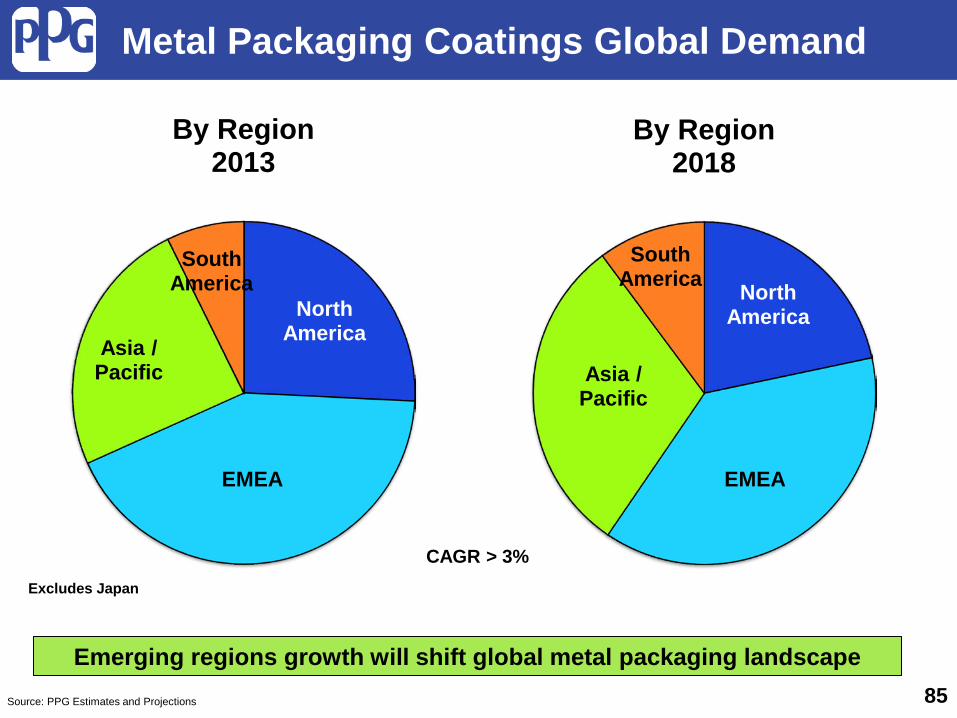
Metal Packaging Coatings Global Demand
Source: PPG Estimates and Projections
North America
EMEA
Asia / Pacific
South America
By Region 2013
Excludes Japan
North America
EMEA
Asia / Pacific
South America
By Region 2018
85
CAGR > 3%
Emerging regions growth will shift global metal packaging landscape

0
500
1000
1500
2000
Food Bev GL
Number of Global Can Lines
2012 2017
+90
= 100 Lines
740 480
275
210 115
140 155
40
+15
+75
# Lines
200
270 1,200
48
Food Lines Bev Lines GL Lines
Global Can Manufacturing Lines Increasing
Source: PPG Estimates 86

Packaging Coatings Competitive Landscape
Akzo, PPG,
Valspar
Others
Akzo, PPG,
Valspar
Others
Developed Regions Emerging Regions Top 3 = ~60% Top 3 = ~70%
Source: PPG Estimates
All values exclude Japan
87
Emerging regions less penetrated by multi-national coatings companies

Packaging Coatings Competitive Landscape
Top 5
Others
Top 5
Others
Top 5
Others
Top 5
Others
Concentration of Packaging Coatings Suppliers by Region
88
In addition to market growth, Asia remains the largest opportunity for share gains for multi-national coatings companies
Source: PPG Estimates

Korea
China
Thailand
India
Indonesia ANZ
PPG Packaging Coatings – Number 1 in Asia/Pacific
Philippines
Vietnam
Malaysia
89 PPG already well established in Asia-Pacific region
PPG share in Top 2
Source: PPG Estimates
PPG share in Top 3

PPG Supplying Global Customers in Asia
90

PPG Supplying Local Customers in China
91
太仓兴达制罐有限公司

Beer Market by Region / Can Concentration
USCA EMEA
Brazil China
China is fastest growing beer market and in early stages of can conversion aided by desire to eliminate inefficient energy usage on glass bottle production
10B liters
% in cans
92
Key: Country % share of global growth
Source: PPG Estimates
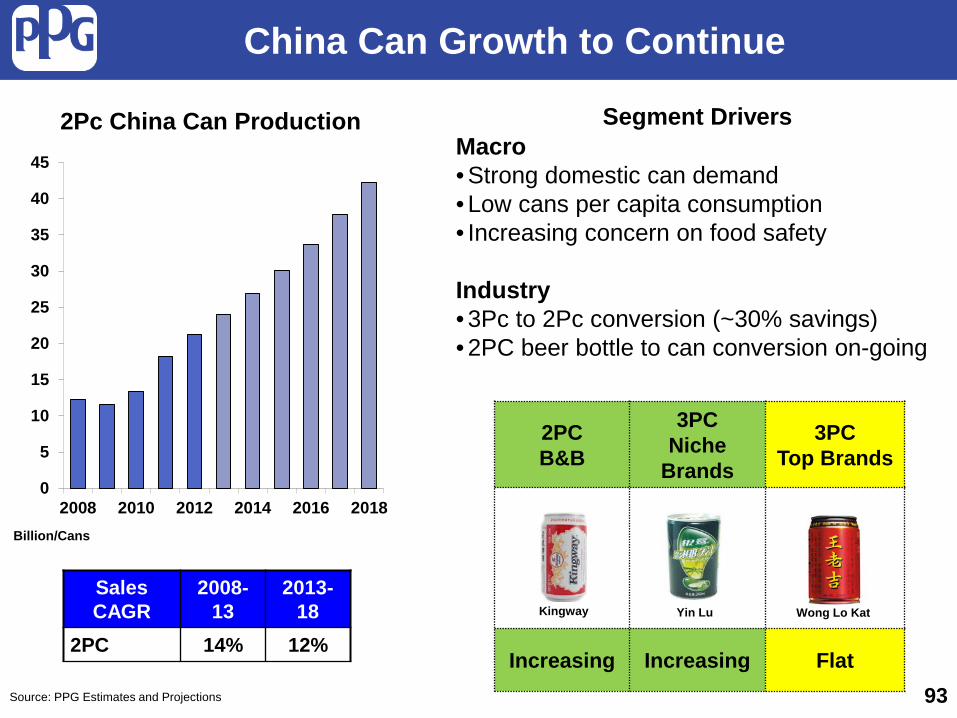
China Can Growth to Continue
2PC B&B
3PC Niche
Brands
3PC Top Brands
Increasing Increasing Flat
2Pc China Can Production
Yin Lu Wong Lo Kat Kingway Sales CAGR
2008-13
2013-18
2PC 14% 12%
Segment Drivers Macro • Strong domestic can demand • Low cans per capita consumption • Increasing concern on food safety Industry • 3Pc to 2Pc conversion (~30% savings) • 2PC beer bottle to can conversion on-going
Source: PPG Estimates and Projections 93
0
5
10
15
20
25
30
35
40
45
2008 2010 2012 2014 2016 2018Billion/Cans
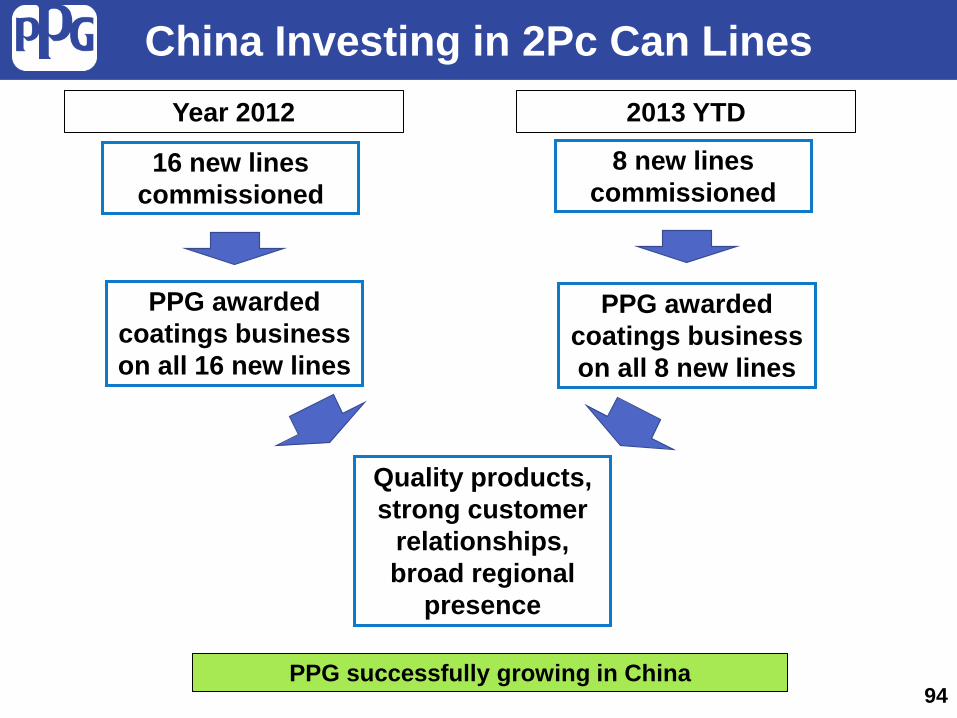
China Investing in 2Pc Can Lines
16 new lines commissioned
PPG awarded coatings business on all 16 new lines
Quality products, strong customer
relationships, broad regional
presence
94
Year 2012
PPG successfully growing in China
8 new lines commissioned
PPG awarded coatings business on all 8 new lines
2013 YTD

• Population growth • Higher disposable income • New investment in metal packaging industry • Increased sophistication of distribution and
retail channels • Beer glass bottle to beer can conversion • Seafood / crop yields (e.g. tuna, sardines, sweet
corn, pineapple etc.)
Asia Expected to Remain a Growth Region
95
Trends support continued packaging growth
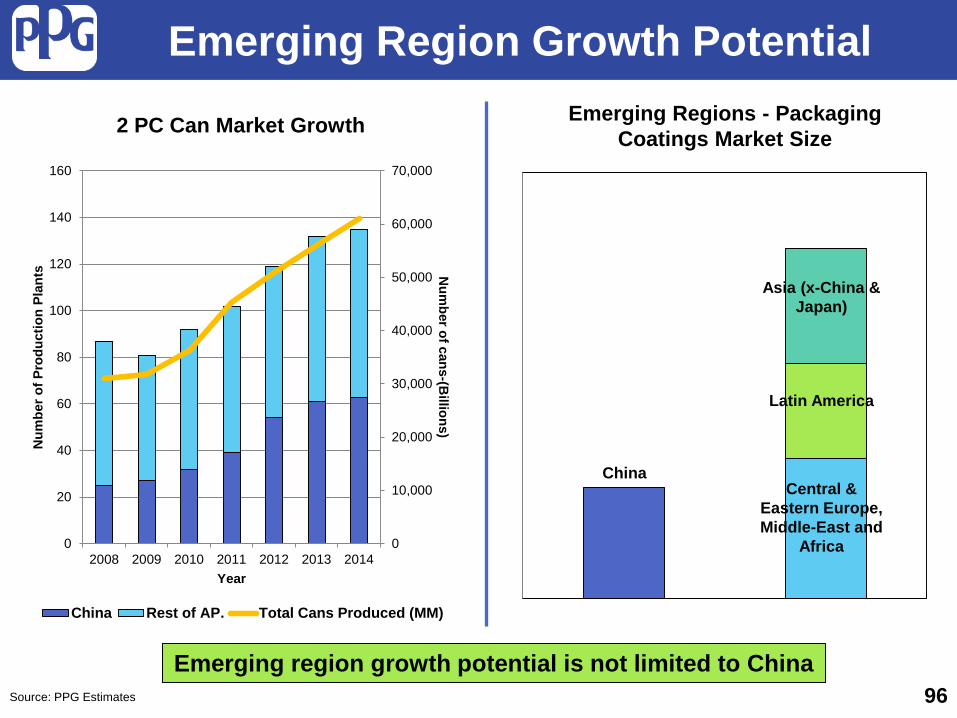
Emerging Region Growth Potential
Emerging region growth potential is not limited to China 96
Asia (x-China & Japan)
Latin America
Central & Eastern Europe, Middle-East and
Africa
China
Emerging Regions - Packaging Coatings Market Size
0
10,000
20,000
30,000
40,000
50,000
60,000
70,000
0
20
40
60
80
100
120
140
160
2008 2009 2010 2011 2012 2013 2014
Num
ber of cans-(Billions)
Num
ber o
f Pro
duct
ion
Plan
ts
Year
2 PC Can Market Growth
China Rest of AP. Total Cans Produced (MM)
Source: PPG Estimates

• Global reach • Long-term track record • Proven products with quality consistency • Diversified product portfolio • Strong customer relationship • Responsive technical service support • EHS compliance • Ethical culture
Value PPG Brings in Emerging Regions
97

PPG Presentation Summary
98
o The packaging industry, including metal cans, is a broad and growing global industry
o The metal can remains one of the most desired packaging materials due to wide functional capabilities and cost
o Packaging coatings are critical to functionality of the can o Current industry trends in packaging coatings include coatings
technology changes and emerging region growth
o PPG is a leading packaging coatings supplier serving both global and local customers in all major regions of the world
o PPG is well positioned to capitalize on these opportunities given our current market positions, global breadth and strong focus on development of new packaging coatings technologies

Ball Corporation
• Founded in 1880 by five Ball brothers • 2012 revenue of $8.7B – Fortune 300 • One of PPG’s largest packaging coatings
customers • PPG supplier to Ball for 50+ years • PPG supplies Ball globally
99
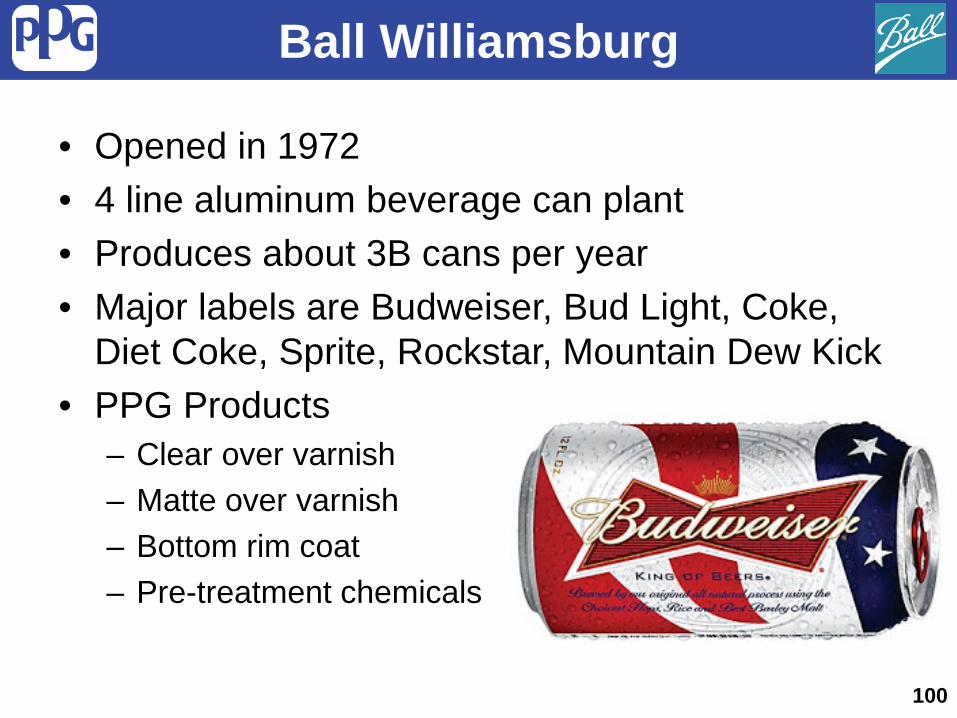
Ball Williamsburg
• Opened in 1972 • 4 line aluminum beverage can plant • Produces about 3B cans per year • Major labels are Budweiser, Bud Light, Coke,
Diet Coke, Sprite, Rockstar, Mountain Dew Kick • PPG Products
– Clear over varnish – Matte over varnish – Bottom rim coat – Pre-treatment chemicals
100
Appendix
101

PPG Executive Profiles
102
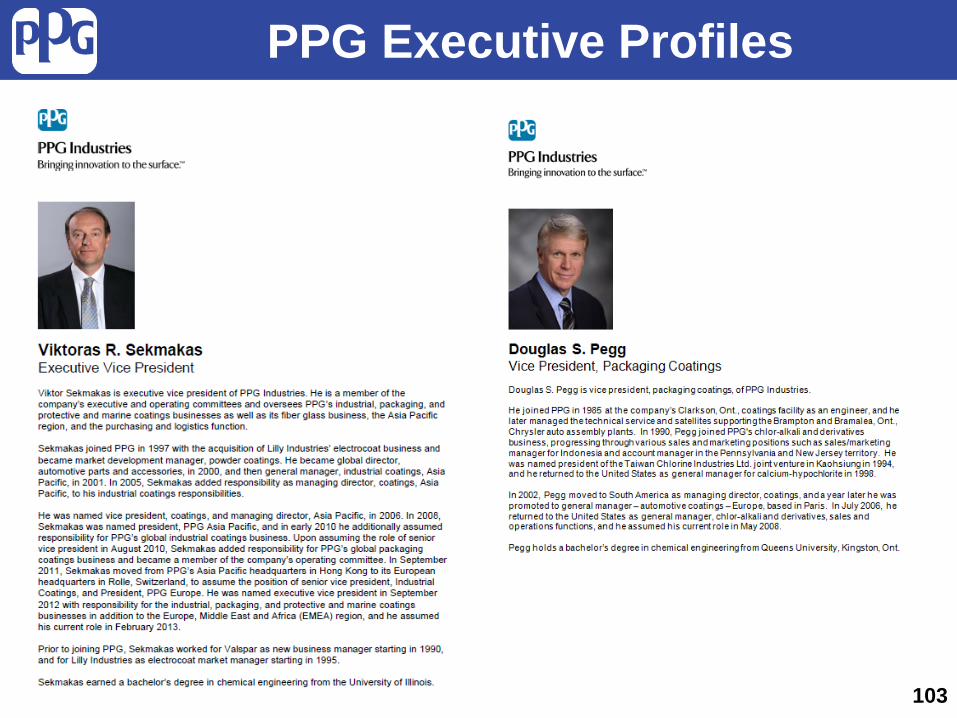
PPG Executive Profiles
103
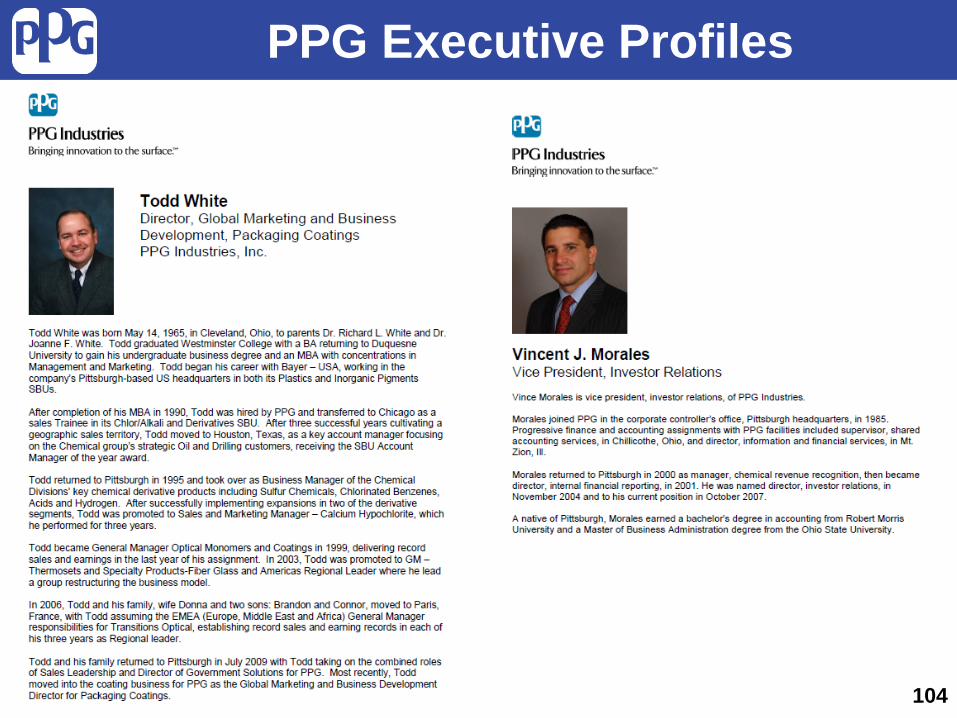
PPG Executive Profiles
104