Embed Size (px)
Citation preview

PPG Investor Overview

2
Notes
Forward looking statement
The Private Securities Litigation Reform Act of 1995 provides a safe harbor for forward-looking statements
made by or on behalf of the Company. This presentation contains forward-looking statements that reflect
the Company’s current views with respect to future events and financial performance. You can identify
forward-looking statements by the fact that they do not relate strictly to current or historic facts. Forward-
looking statements are identified by the use of the words “aim,” “believe,” “expect,” “anticipate,” “intend,”
“estimate,” “project,” “outlook,” “forecast” and other expressions that indicate future events and trends.
Any forward-looking statement speaks only as of the date on which such statement is made, and the
Company undertakes no obligation to update any forward looking statement, whether as a result of new
information, future events or otherwise. You are advised, however, to consult any further disclosures we
make on related subjects in our reports to the Securities and Exchange Commission. Also, note the
following cautionary statements. Many factors could cause actual results to differ materially from the
Company’s forward-looking statements. Such factors include global economic conditions, increasing price
and product competition by foreign and domestic competitors, fluctuations in cost and availability of raw
materials, the ability to maintain favorable supplier relationships and arrangements, the timing of and the
realization of anticipated cost savings from restructuring initiatives, difficulties in integrating acquired
businesses and achieving expected synergies therefrom, economic and political conditions in international
markets, the ability to penetrate existing, developing and emerging foreign and domestic markets, foreign
exchange rates and fluctuations in such rates, fluctuations in tax rates, the impact of future legislation, the
impact of environmental regulations, unexpected business disruptions, and the unpredictability of existing
and possible future litigation, including litigation that could result if the proposed asbestos settlement does
not become effective. However, it is not possible to predict or identify all such factors. Consequently, while
the list of factors presented here and under Item 1A of PPG’s 2015 Form 10-K is considered representative,
no such list should be considered to be a complete statement of all potential risks and uncertainties.
Unlisted factors may present significant additional obstacles to the realization of forward-looking
statements. Consequences of material differences in the results compared with those anticipated in the
forward-looking statements could include, among other things, lower sales or earnings, business
disruption, operational problems, financial loss, legal liability to third parties, other factors set forth in
Item 1A of PPG’s 2015 Form 10-K and similar risks, any of which could have a material adverse effect on the
Company’s consolidated financial condition, results of operations or liquidity.
3

We are a global leader in paints and coatings
4
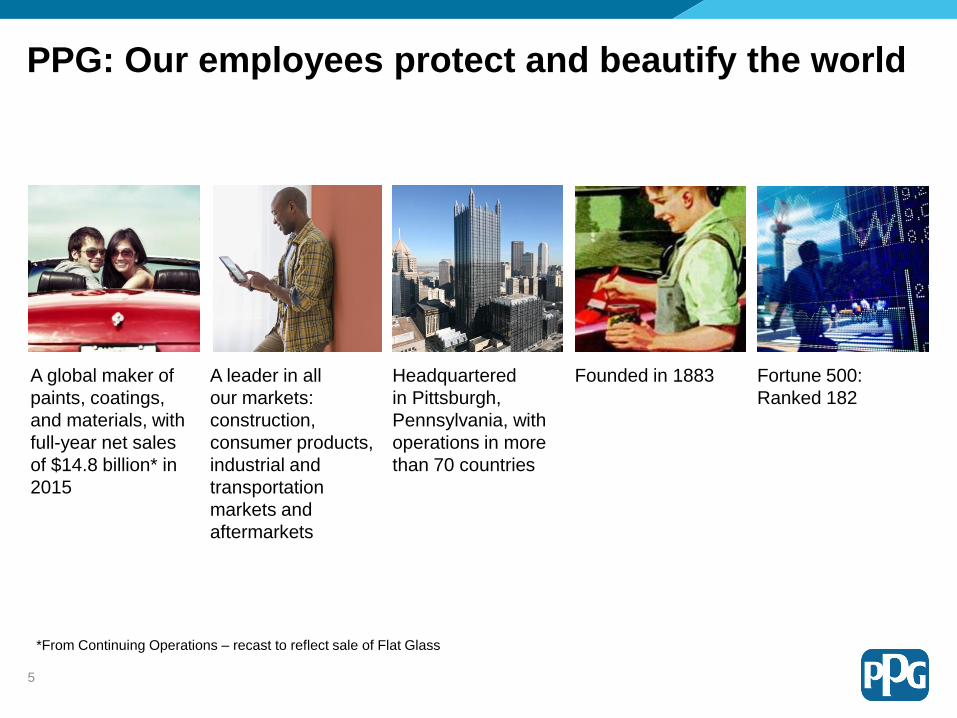
PPG: Our employees protect and beautify the world
A leader in all
our markets:
construction,
consumer products,
industrial and
transportation
markets and
aftermarkets
Headquartered
in Pittsburgh,
Pennsylvania, with
operations in more
than 70 countries
Founded in 1883 Fortune 500:
Ranked 182
A global maker of
paints, coatings,
and materials, with
full-year net sales
of $14.8 billion* in
2015
5
*From Continuing Operations – recast to reflect sale of Flat Glass
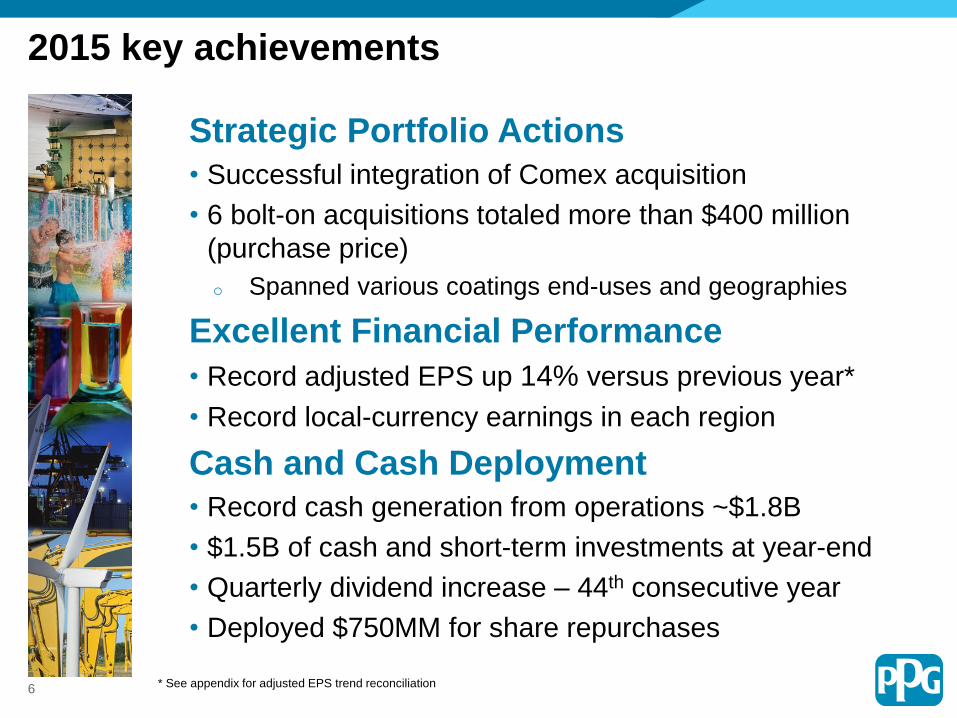
2015 key achievements
Strategic Portfolio Actions
• Successful integration of Comex acquisition
• 6 bolt-on acquisitions totaled more than $400 million
(purchase price)
o Spanned various coatings end-uses and geographies
Excellent Financial Performance
• Record adjusted EPS up 14% versus previous year*
• Record local-currency earnings in each region
Cash and Cash Deployment
• Record cash generation from operations ~$1.8B
• $1.5B of cash and short-term investments at year-end
• Quarterly dividend increase – 44th consecutive year
• Deployed $750MM for share repurchases
6 * See appendix for adjusted EPS trend reconciliation
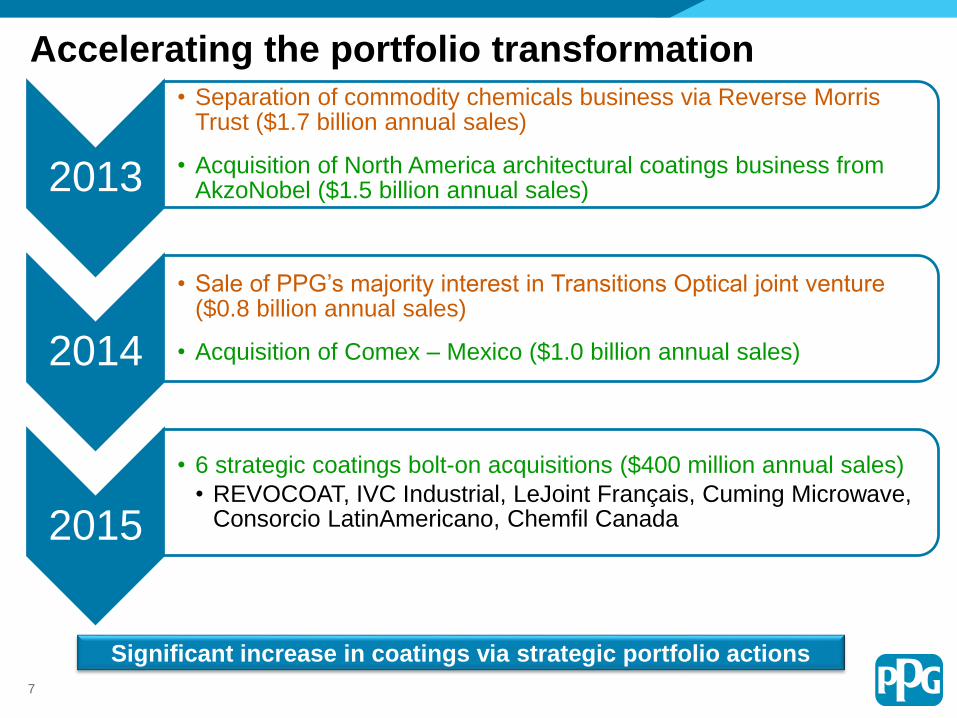
2013
• Separation of commodity chemicals business via Reverse Morris Trust ($1.7 billion annual sales)
• Acquisition of North America architectural coatings business from AkzoNobel ($1.5 billion annual sales)
2014
• Sale of PPG’s majority interest in Transitions Optical joint venture ($0.8 billion annual sales)
• Acquisition of Comex – Mexico ($1.0 billion annual sales)
2015
• 6 strategic coatings bolt-on acquisitions ($400 million annual sales)
• REVOCOAT, IVC Industrial, LeJoint Français, Cuming Microwave, Consorcio LatinAmericano, Chemfil Canada
Accelerating the portfolio transformation
Significant increase in coatings via strategic portfolio actions
7
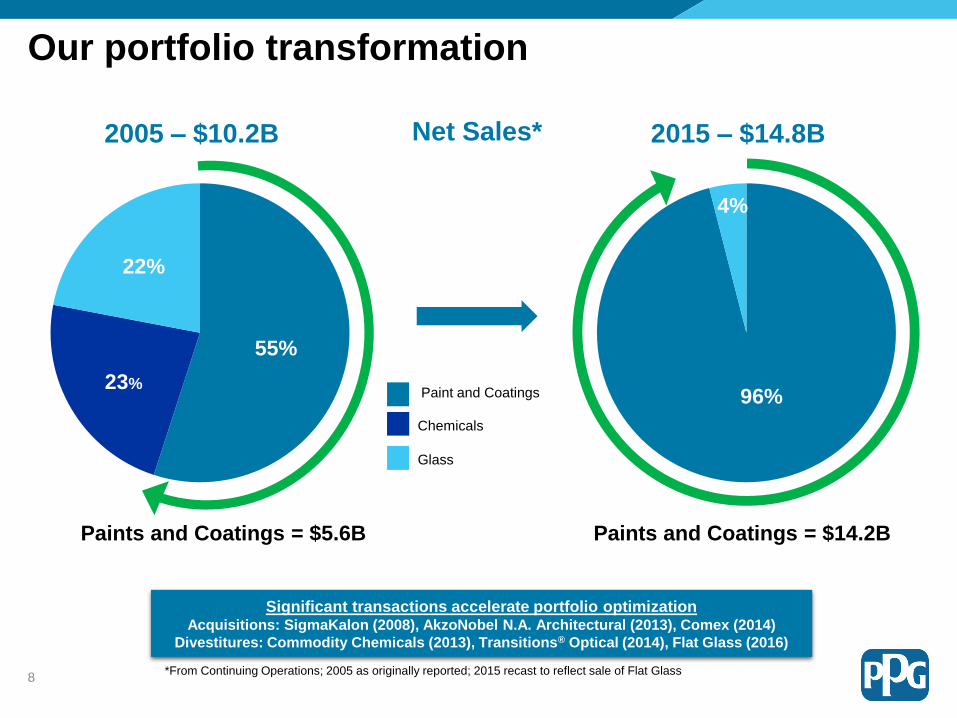
Our portfolio transformation
2005 – $10.2B 2015 – $14.8B
55%
23%
22%
96%
4%
Net Sales*
Paint and Coatings
Chemicals
Glass
*From Continuing Operations; 2005 as originally reported; 2015 recast to reflect sale of Flat Glass
Paints and Coatings = $14.2BPaints and Coatings = $5.6B
Significant transactions accelerate portfolio optimizationAcquisitions: SigmaKalon (2008), AkzoNobel N.A. Architectural (2013), Comex (2014)
Divestitures: Commodity Chemicals (2013), Transitions® Optical (2014), Flat Glass (2016)
8
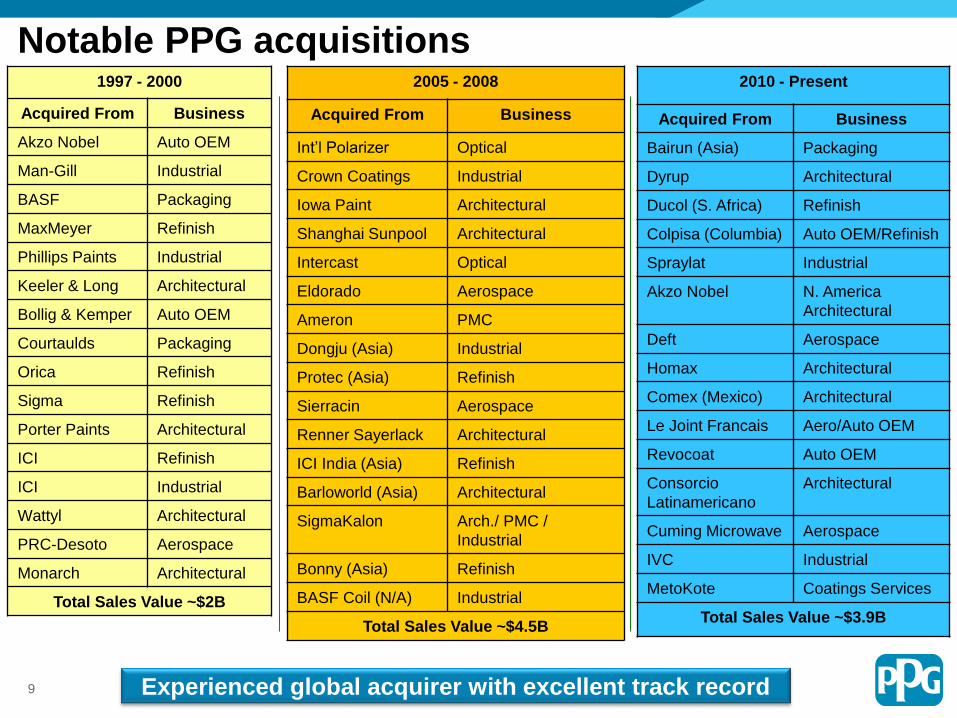
2005 - 2008
Acquired From Business
Int’l Polarizer Optical
Crown Coatings Industrial
Iowa Paint Architectural
Shanghai Sunpool Architectural
Intercast Optical
Eldorado Aerospace
Ameron PMC
Dongju (Asia) Industrial
Protec (Asia) Refinish
Sierracin Aerospace
Renner Sayerlack Architectural
ICI India (Asia) Refinish
Barloworld (Asia) Architectural
SigmaKalon Arch./ PMC /
Industrial
Bonny (Asia) Refinish
BASF Coil (N/A) Industrial
Total Sales Value ~$4.5B
Notable PPG acquisitions1997 - 2000
Acquired From Business
Akzo Nobel Auto OEM
Man-Gill Industrial
BASF Packaging
MaxMeyer Refinish
Phillips Paints Industrial
Keeler & Long Architectural
Bollig & Kemper Auto OEM
Courtaulds Packaging
Orica Refinish
Sigma Refinish
Porter Paints Architectural
ICI Refinish
ICI Industrial
Wattyl Architectural
PRC-Desoto Aerospace
Monarch Architectural
Total Sales Value ~$2B
2010 - Present
Acquired From Business
Bairun (Asia) Packaging
Dyrup Architectural
Ducol (S. Africa) Refinish
Colpisa (Columbia) Auto OEM/Refinish
Spraylat Industrial
Akzo Nobel N. America
Architectural
Deft Aerospace
Homax Architectural
Comex (Mexico) Architectural
Le Joint Francais Aero/Auto OEM
Revocoat Auto OEM
Consorcio
Latinamericano
Architectural
Cuming Microwave Aerospace
IVC Industrial
MetoKote Coatings Services
Total Sales Value ~$3.9B
Experienced global acquirer with excellent track record9
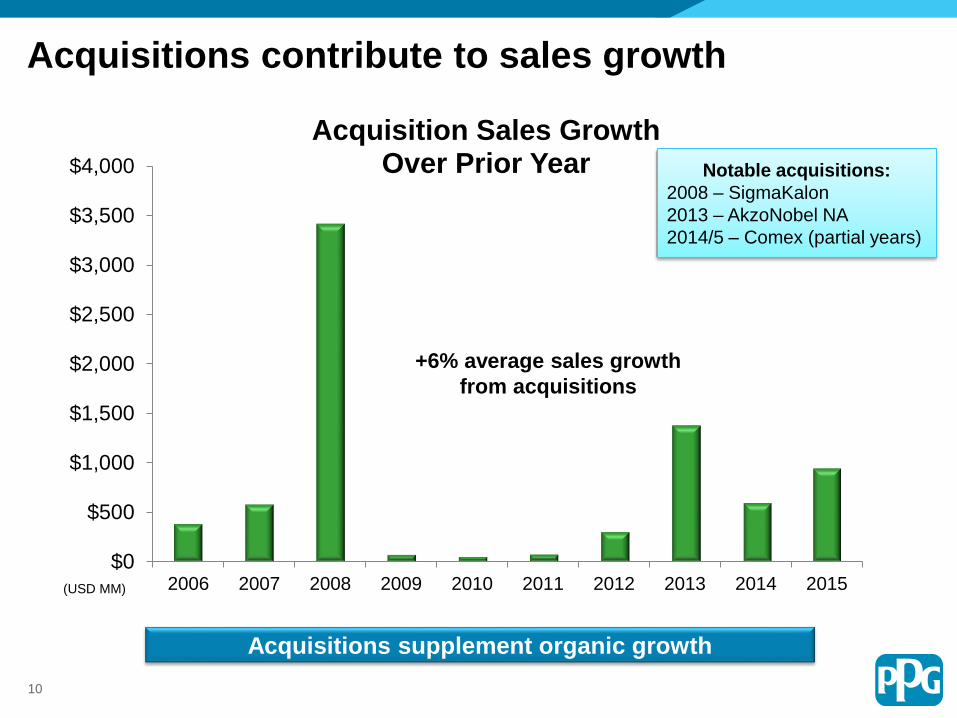
Acquisitions contribute to sales growth
$0
$500
$1,000
$1,500
$2,000
$2,500
$3,000
$3,500
$4,000
2006 2007 2008 2009 2010 2011 2012 2013 2014 2015
Acquisition Sales Growth Over Prior Year Notable acquisitions:
2008 – SigmaKalon
2013 – AkzoNobel NA
2014/5 – Comex (partial years)
+6% average sales growth
from acquisitions
(USD MM)
Acquisitions supplement organic growth
10
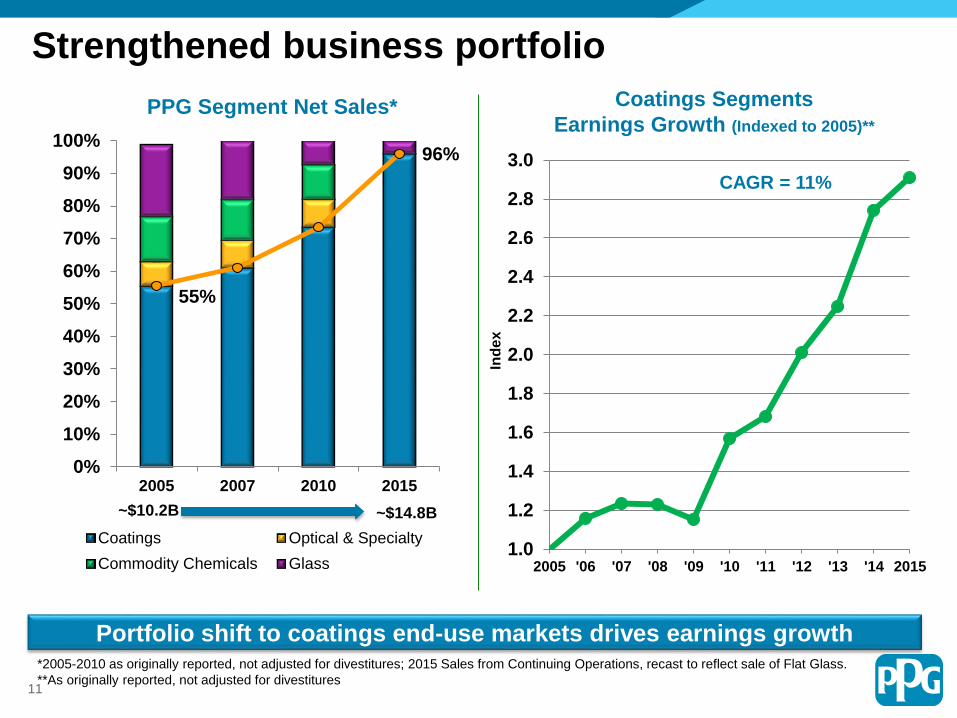
55%
96%
0%
10%
20%
30%
40%
50%
60%
70%
80%
90%
100%
2005 2007 2010 2015
Coatings Optical & Specialty
Commodity Chemicals Glass
PPG Segment Net Sales*
Portfolio shift to coatings end-use markets drives earnings growth
Coatings Segments
Earnings Growth (Indexed to 2005)**
CAGR = 11%
*2005-2010 as originally reported, not adjusted for divestitures; 2015 Sales from Continuing Operations, recast to reflect sale of Flat Glass.
**As originally reported, not adjusted for divestitures
~$10.2B ~$14.8B
Strengthened business portfolio
1.0
1.2
1.4
1.6
1.8
2.0
2.2
2.4
2.6
2.8
3.0
2005 '06 '07 '08 '09 '10 '11 '12 '13 '14 2015
Ind
ex
11
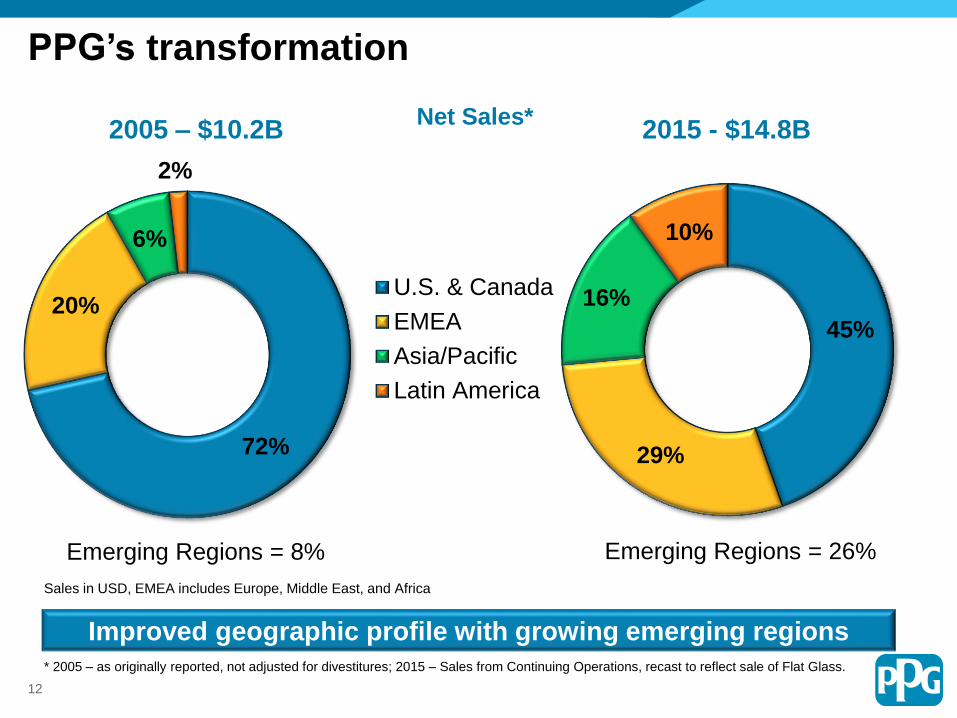
45%
29%
16%
10%
2015 - $14.8B
U.S. & Canada
EMEA
Asia/Pacific
Latin America
PPG’s transformation
Improved geographic profile with growing emerging regions
Sales in USD, EMEA includes Europe, Middle East, and Africa
72%
20%
6%
2%
2005 – $10.2BNet Sales*
Emerging Regions = 8% Emerging Regions = 26%
12
* 2005 – as originally reported, not adjusted for divestitures; 2015 – Sales from Continuing Operations, recast to reflect sale of Flat Glass.
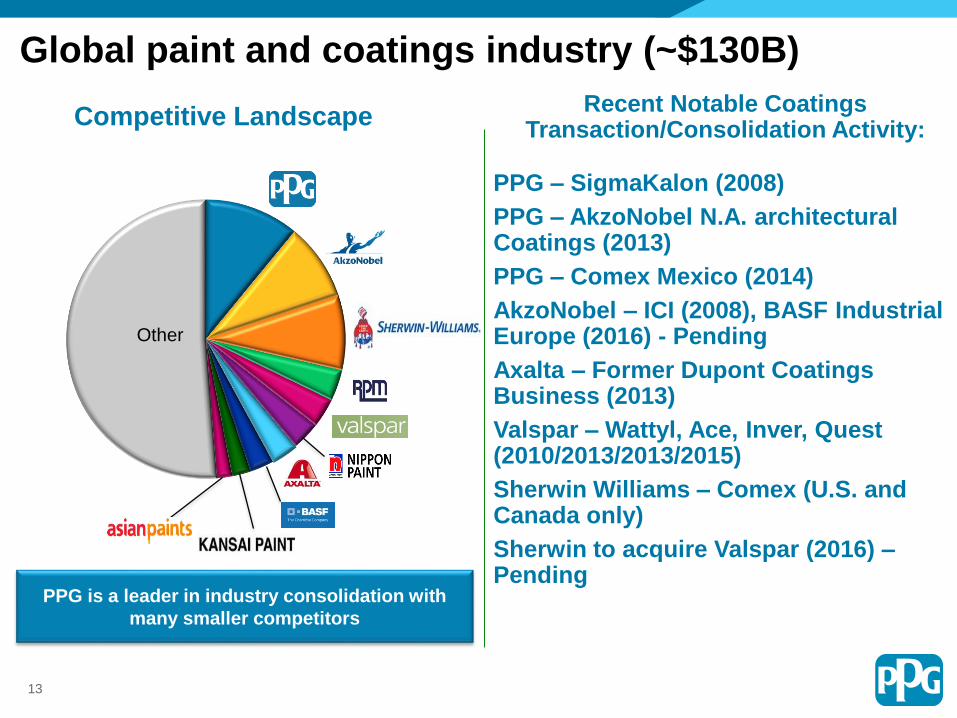
Global paint and coatings industry (~$130B)
Recent Notable Coatings Transaction/Consolidation Activity:
PPG – SigmaKalon (2008)
PPG – AkzoNobel N.A. architectural Coatings (2013)
PPG – Comex Mexico (2014)
AkzoNobel – ICI (2008), BASF Industrial Europe (2016) - Pending
Axalta – Former Dupont Coatings Business (2013)
Valspar – Wattyl, Ace, Inver, Quest (2010/2013/2013/2015)
Sherwin Williams – Comex (U.S. and Canada only)
Sherwin to acquire Valspar (2016) –Pending
Competitive Landscape
Source: Orr and Boss; Company Annual Reports; PPG estimates
PPG is a leader in industry consolidation with
many smaller competitors
13
Other
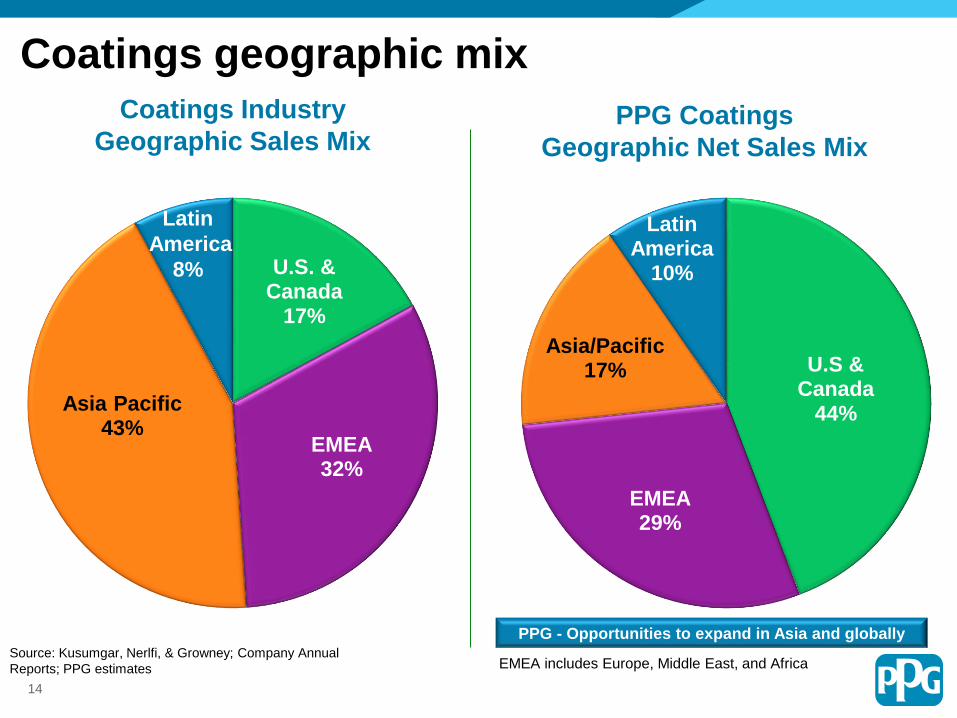
U.S & Canada
44%
EMEA29%
Asia/Pacific17%
Latin America
10%
Coatings geographic mix
Source: Kusumgar, Nerlfi, & Growney; Company Annual
Reports; PPG estimates
Coatings Industry
Geographic Sales Mix PPG Coatings
Geographic Net Sales Mix
PPG - Opportunities to expand in Asia and globally
U.S. & Canada
17%
EMEA32%
Asia Pacific43%
Latin
America
8%
14
EMEA includes Europe, Middle East, and Africa
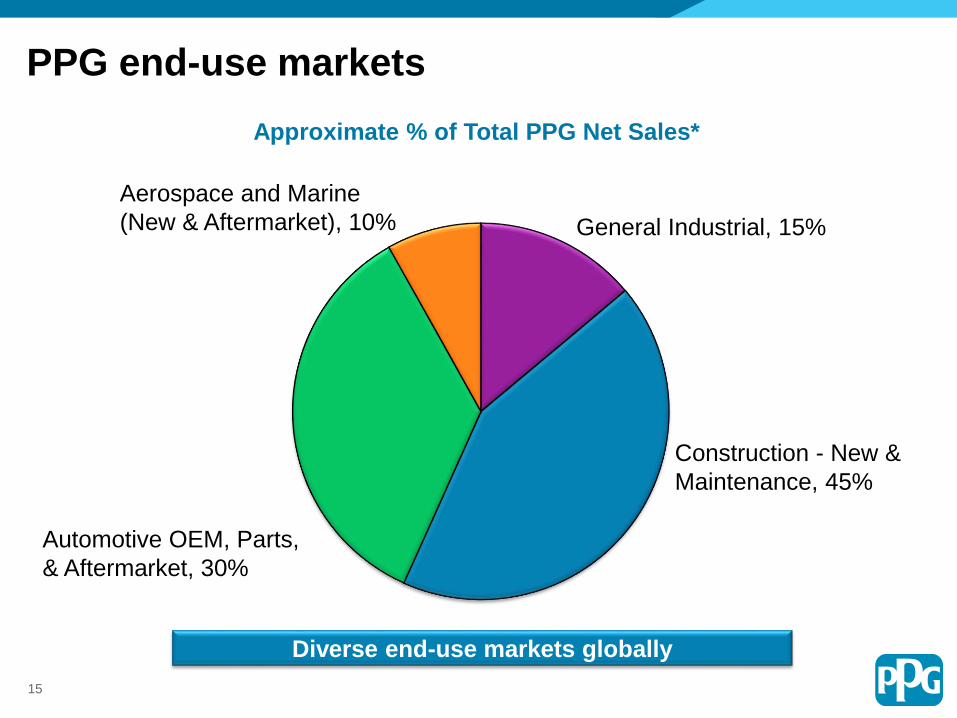
PPG end-use markets
Automotive OEM, Parts,
& Aftermarket, 30%
Construction - New &
Maintenance, 45%
General Industrial, 15%
Aerospace and Marine
(New & Aftermarket), 10%
Approximate % of Total PPG Net Sales*
Diverse end-use markets globally
15
0
500
1,000
1,500
2,000
2,500
2007 '08 '09 '10 '11 '12 '13 '14 2015
$5
$7
$9
$11
$13
$15
2004 '06 '08 '10 '12 2015
CAGR = 9%
PPG Coatings Net Sales (US$B) –Includes Acquisitions
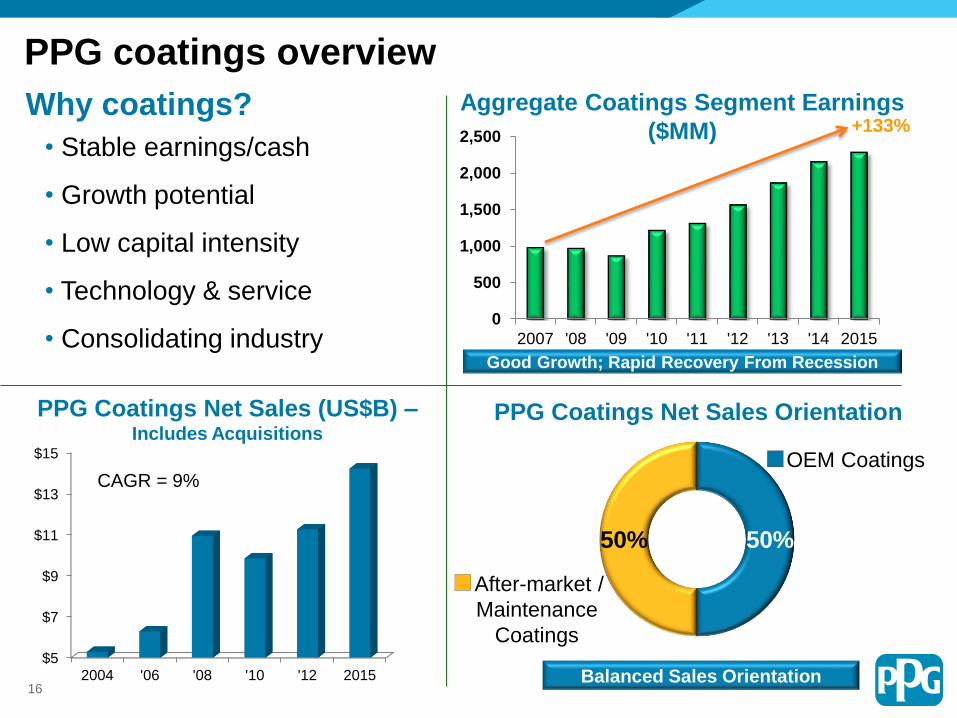
PPG coatings overview
• Stable earnings/cash
• Growth potential
• Low capital intensity
• Technology & service
• Consolidating industry
Balanced Sales Orientation
Aggregate Coatings Segment Earnings
($MM)
Good Growth; Rapid Recovery From Recession
+133%
50%50%
PPG Coatings Net Sales Orientation
OEM Coatings
After-market /
Maintenance
Coatings
Why coatings?
16
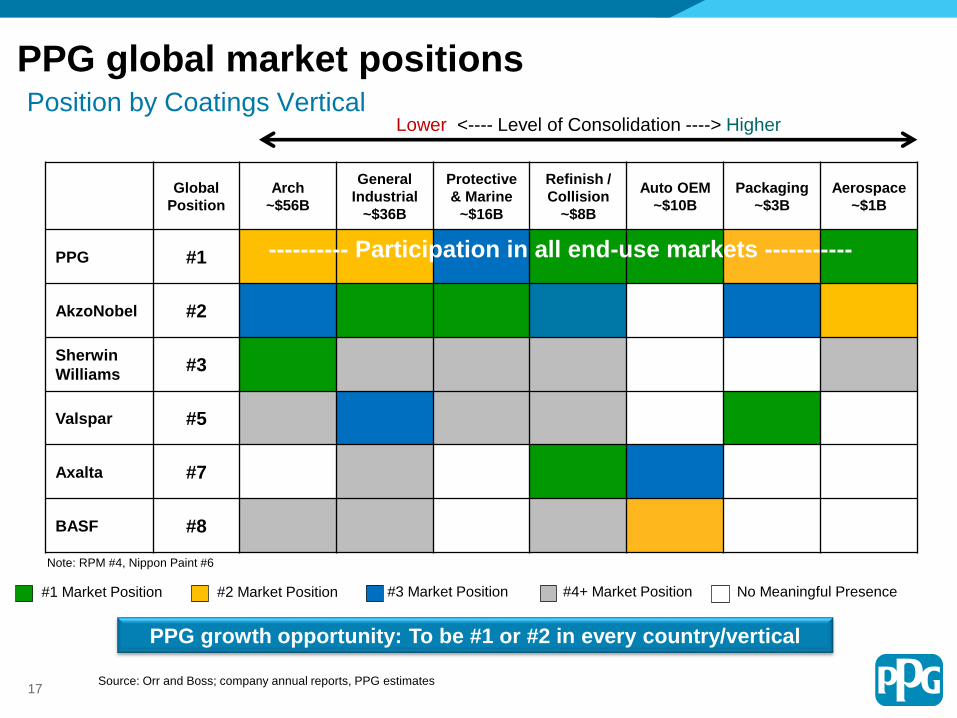
#1 Market Position #2 Market Position #3 Market Position #4+ Market Position No Meaningful Presence
PPG global market positions
Source: Orr and Boss; company annual reports, PPG estimates
Position by Coatings Vertical
PPG growth opportunity: To be #1 or #2 in every country/vertical
Source: Orr and Boss; Company Annual Reports; PPG estimates
Lower <---- Level of Consolidation ----> Higher
---------- Participation in all end-use markets -----------
Global
Position
Arch
~$56B
General
Industrial
~$36B
Protective
& Marine
~$16B
Refinish /
Collision
~$8B
Auto OEM
~$10B
Packaging
~$3B
Aerospace
~$1B
PPG #1
AkzoNobel #2
Sherwin
Williams#3
Valspar #5
Axalta #7
BASF #8
---------- Participation in all end-use markets -----------
17
Note: RPM #4, Nippon Paint #6
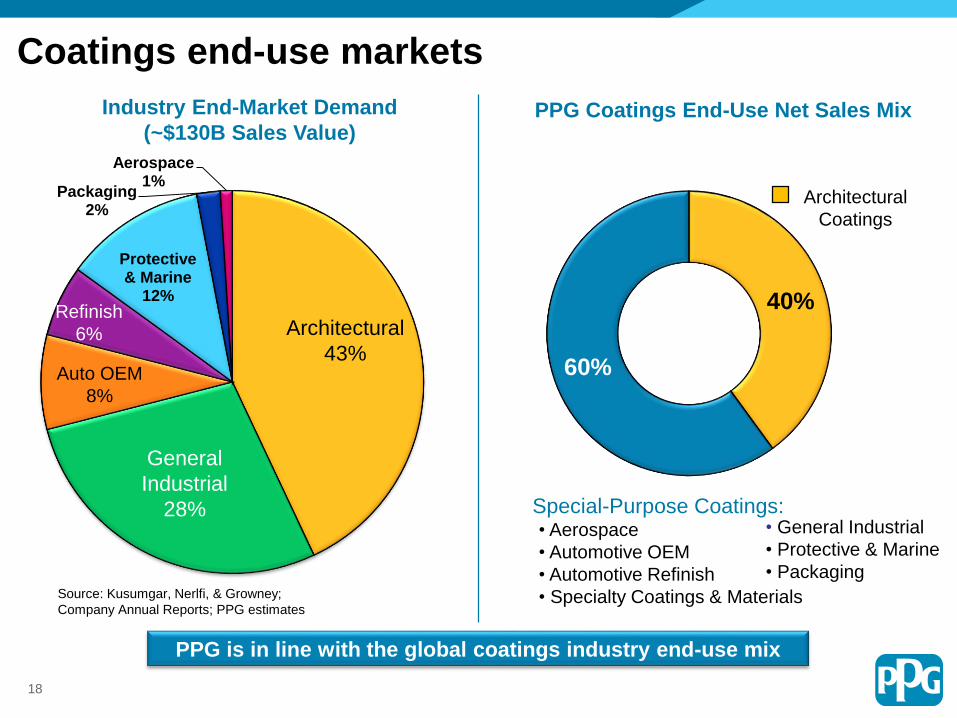
Coatings end-use markets
40%
60%
Special-Purpose Coatings:• Aerospace
• Automotive OEM
• Automotive Refinish
• Specialty Coatings & Materials
Protective & Marine
12%
Packaging2%
Aerospace1%
Architectural
43%
General
Industrial
28%
Refinish
6%
Auto OEM
8%
Industry End-Market Demand
(~$130B Sales Value)
Source: Kusumgar, Nerlfi, & Growney;
Company Annual Reports; PPG estimates
• General Industrial
• Protective & Marine
• Packaging
Architectural
Coatings
PPG Coatings End-Use Net Sales Mix
PPG is in line with the global coatings industry end-use mix
18
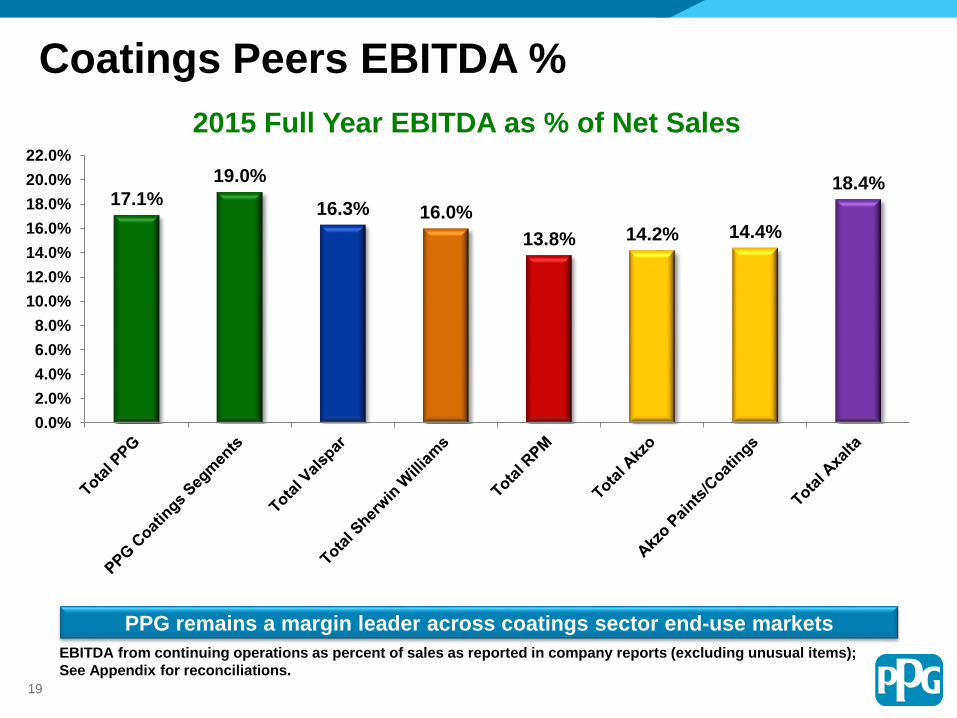
EBITDA from continuing operations as percent of sales as reported in company reports (excluding unusual items);
See Appendix for reconciliations.
PPG remains a margin leader across coatings sector end-use markets
17.1%
19.0%
16.3% 16.0%
13.8% 14.2% 14.4%
18.4%
0.0%
2.0%
4.0%
6.0%
8.0%
10.0%
12.0%
14.0%
16.0%
18.0%
20.0%
22.0%
2015 Full Year EBITDA as % of Net Sales
Coatings Peers EBITDA %
19
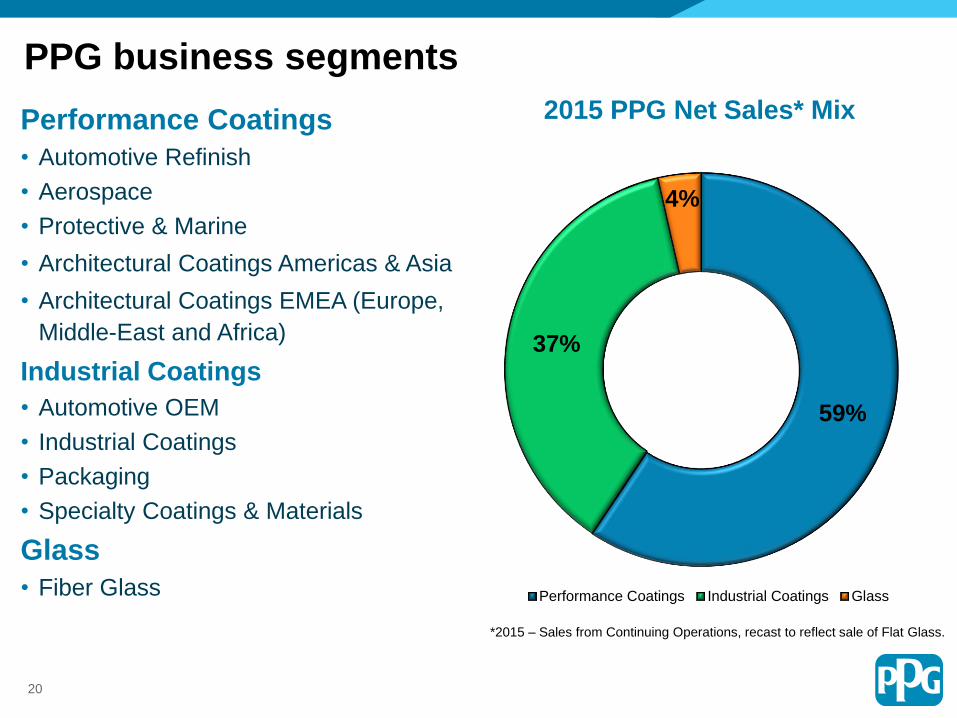
2015 PPG Net Sales* Mix
PPG business segments
Performance Coatings
• Automotive Refinish
• Aerospace
• Protective & Marine
• Architectural Coatings Americas & Asia
• Architectural Coatings EMEA (Europe,
Middle-East and Africa)
Industrial Coatings
• Automotive OEM
• Industrial Coatings
• Packaging
• Specialty Coatings & Materials
Glass
• Fiber Glass
59%
37%
4%
Performance Coatings Industrial Coatings Glass
20
*2015 – Sales from Continuing Operations, recast to reflect sale of Flat Glass.
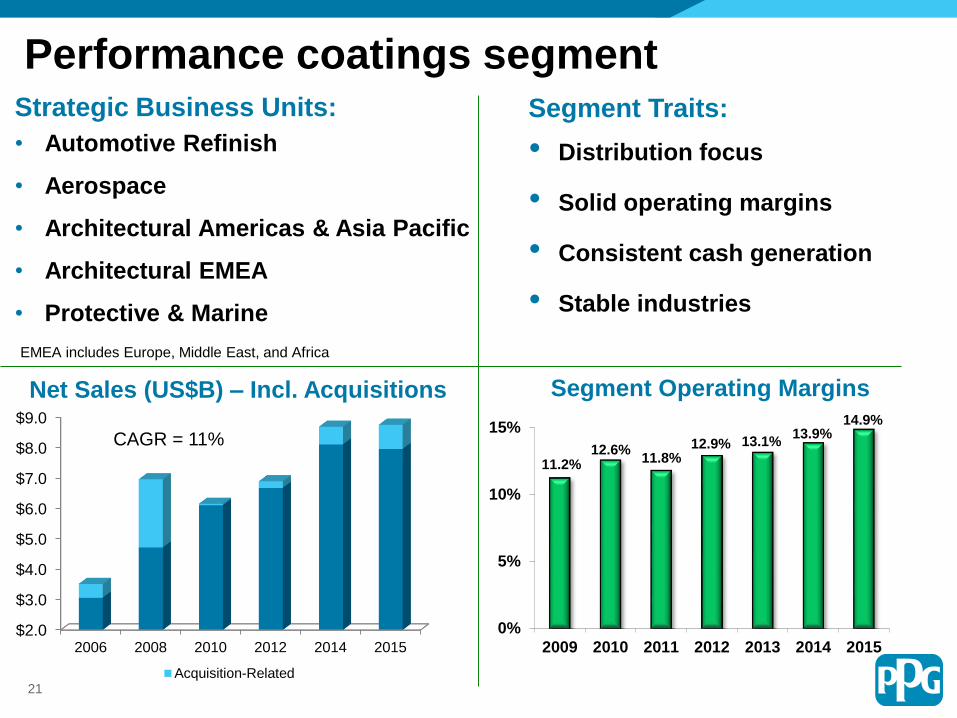
Performance coatings segmentStrategic Business Units:
• Automotive Refinish
• Aerospace
• Architectural Americas & Asia Pacific
• Architectural EMEA
• Protective & Marine
Net Sales (US$B) – Incl. Acquisitions
Segment Traits:
• Distribution focus
• Solid operating margins
• Consistent cash generation
• Stable industries
$2.0
$3.0
$4.0
$5.0
$6.0
$7.0
$8.0
$9.0
2006 2008 2010 2012 2014 2015
Acquisition-Related
11.2%12.6%
11.8%12.9% 13.1%
13.9%14.9%
0%
5%
10%
15%
2009 2010 2011 2012 2013 2014 2015
Segment Operating Margins
CAGR = 11%
21
EMEA includes Europe, Middle East, and Africa
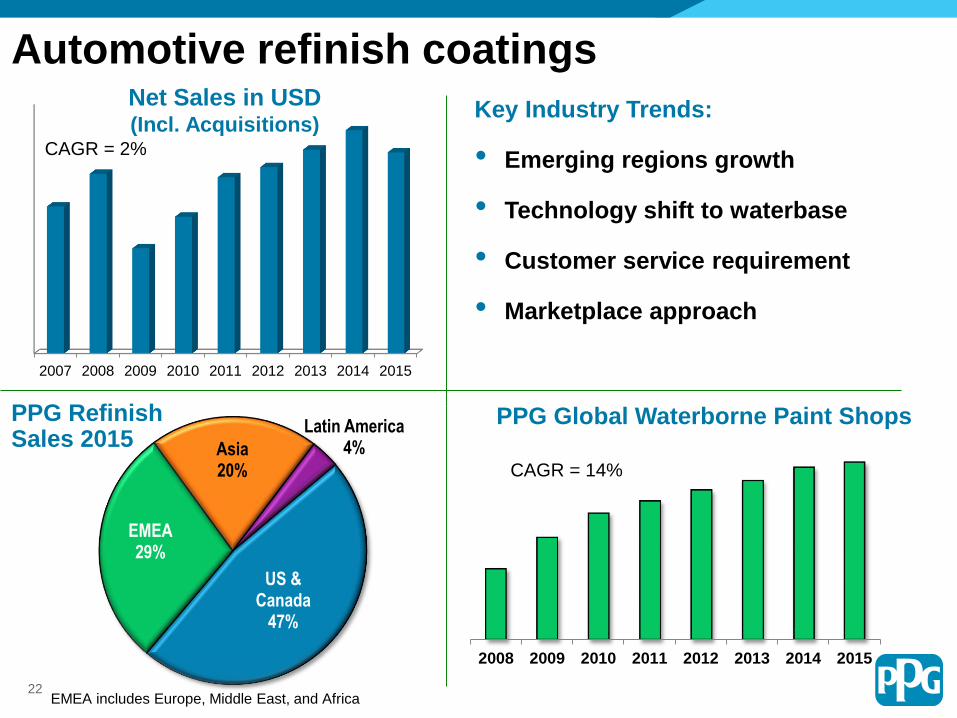
US & Canada
47%
EMEA29%
Asia20%
Latin America4%
2007 2008 2009 2010 2011 2012 2013 2014 2015
Net Sales in USD (Incl. Acquisitions)
PPG Refinish Sales 2015
2008 2009 2010 2011 2012 2013 2014 2015
PPG Global Waterborne Paint Shops
Automotive refinish coatings
Key Industry Trends:
• Emerging regions growth
• Technology shift to waterbase
• Customer service requirement
• Marketplace approach
CAGR = 2%
CAGR = 14%
22EMEA includes Europe, Middle East, and Africa
'07 '08 '09 '10 '11 '12 '13 '14 2015
Recent Acquisitions
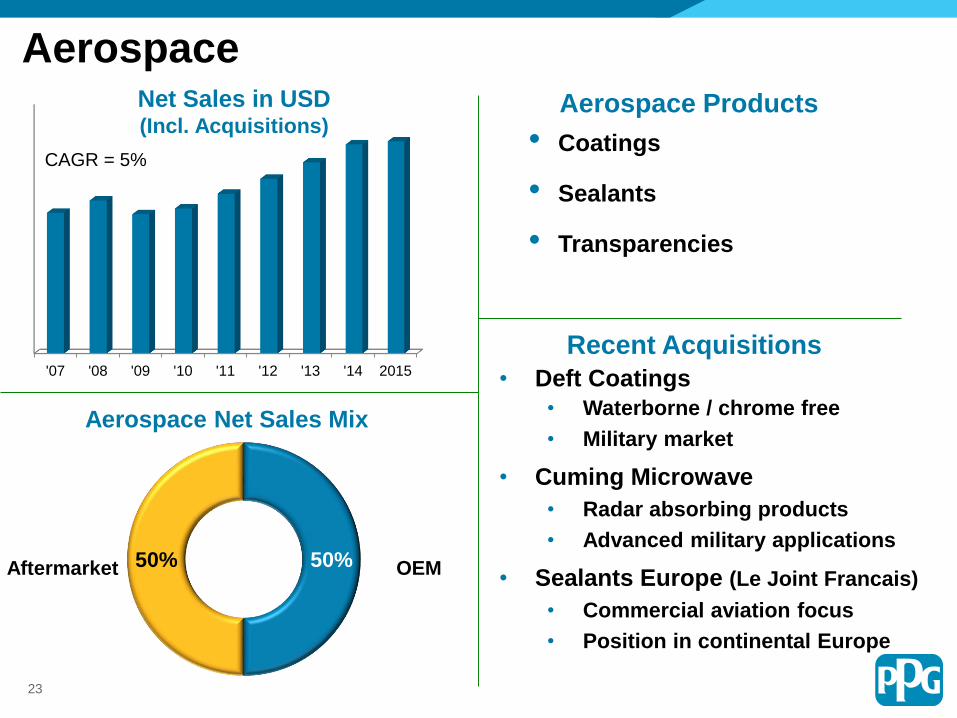
Aerospace
• Coatings
• Sealants
• Transparencies
CAGR = 5%
50%50%
Aerospace Net Sales Mix
Aftermarket OEM
Aerospace Products
• Deft Coatings
• Waterborne / chrome free
• Military market
• Cuming Microwave
• Radar absorbing products
• Advanced military applications
• Sealants Europe (Le Joint Francais)
• Commercial aviation focus
• Position in continental Europe
23
Net Sales in USD (Incl. Acquisitions)
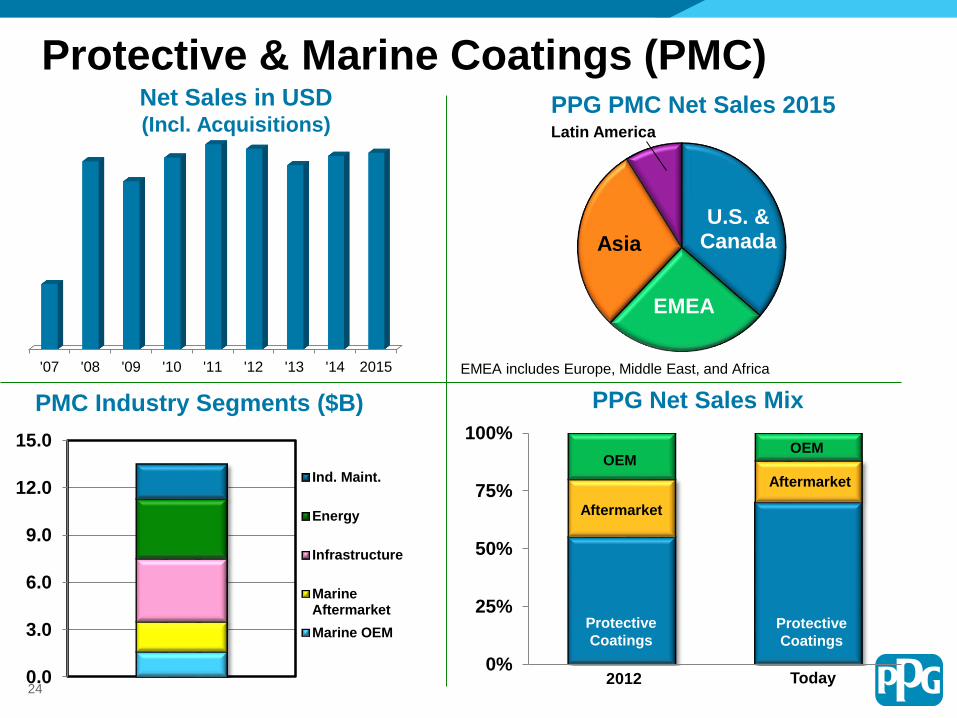
'07 '08 '09 '10 '11 '12 '13 '14 2015
U.S. & Canada
EMEA
Asia
EMEA includes Europe, Middle East, and Africa
PPG PMC Net Sales 2015
PMC Industry Segments ($B)
Protective & Marine Coatings (PMC)
0%
25%
50%
75%
100%
Protective
Coatings
OEM
Aftermarket
PPG Net Sales Mix
Latin America
0.0
3.0
6.0
9.0
12.0
15.0
Ind. Maint.
Energy
Infrastructure
MarineAftermarket
Marine OEM
24Today2012
Protective
Coatings
Aftermarket
OEM
Net Sales in USD (Incl. Acquisitions)
2006 2009 2012 2015
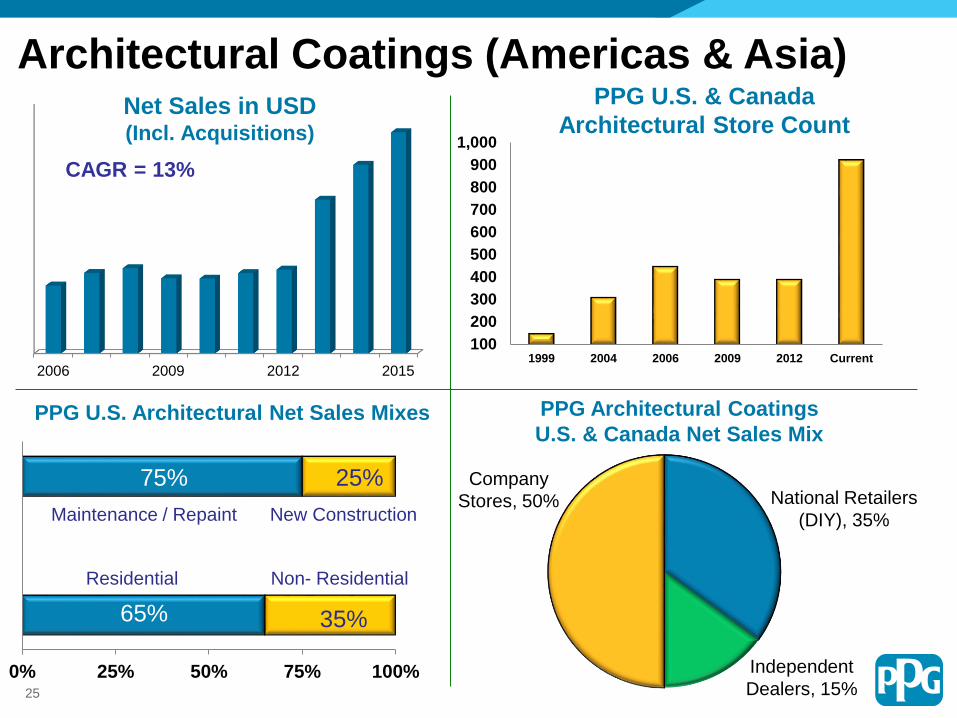
Architectural Coatings (Americas & Asia)
CAGR = 13%
National Retailers
(DIY), 35%
Company
Stores, 50%
Independent
Dealers, 15%
PPG Architectural Coatings
U.S. & Canada Net Sales Mix
0% 25% 50% 75% 100%
PPG U.S. Architectural Net Sales Mixes
Maintenance / Repaint
Non- ResidentialResidential
25%
65% 35%
New Construction
100
200
300
400
500
600
700
800
900
1,000
1999 2004 2006 2009 2012 Current
PPG U.S. & Canada
Architectural Store Count
75%
25
Net Sales in USD (Incl. Acquisitions)
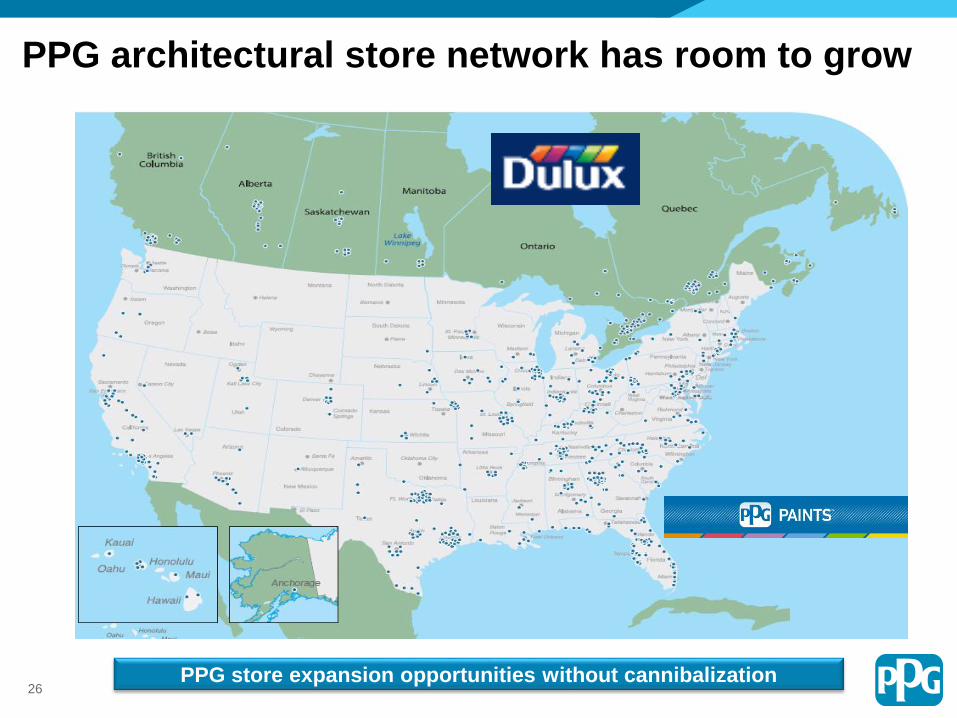
PPG architectural store network has room to grow
26PPG store expansion opportunities without cannibalization
Comex business overview
• Founded in 1952
• Architectural, Industrial and other
Specialty Coatings and Materials
• Latin American Based • Sales in Mexico and other Central American countries
• ~4,000 independently owned/operated concessionaires; regional retailers
• Leading architectural coatings position in Mexico; well-recognized regional brands
Network
New store openings
Develop low share
territories
Penetrate key
segments
Purchase
experience
Develop categories
and brand / channel
Concessionaire goal: 1 store per 20k people
Current density: 1 store per 30k people
Consistent and Strong GrowthComex Plant
Comex
Distribution
• 8 Manufacturing Plants
• 6 Distribution Centers
• 3,900 Employees
Concessionaire Network Operational Network
27
Comex financial targets
28
Comex acquisition is exceeding expectations and enabling growth
Cost/operational earnings
synergies exceeding
targets
(increased June 2015)
Incremental revenue
synergies from
PPG legacy products
(announced June 2015)
Central America regional
revenue synergy target (5
year) (announced June
2015)
Target
$45-50MM
$40-50MM
$60-70MM
Status
On-track
Glidden Stores
Home Center
Comes Stores
Belize06
Honduras12
Nicaragua10
Panama
18
186
Costa Rica
El Salvador
Guatemala
43
17
25
PPG’s Central American Architectural Network
Nearly 300 regional points of sale
Represents
points of sale
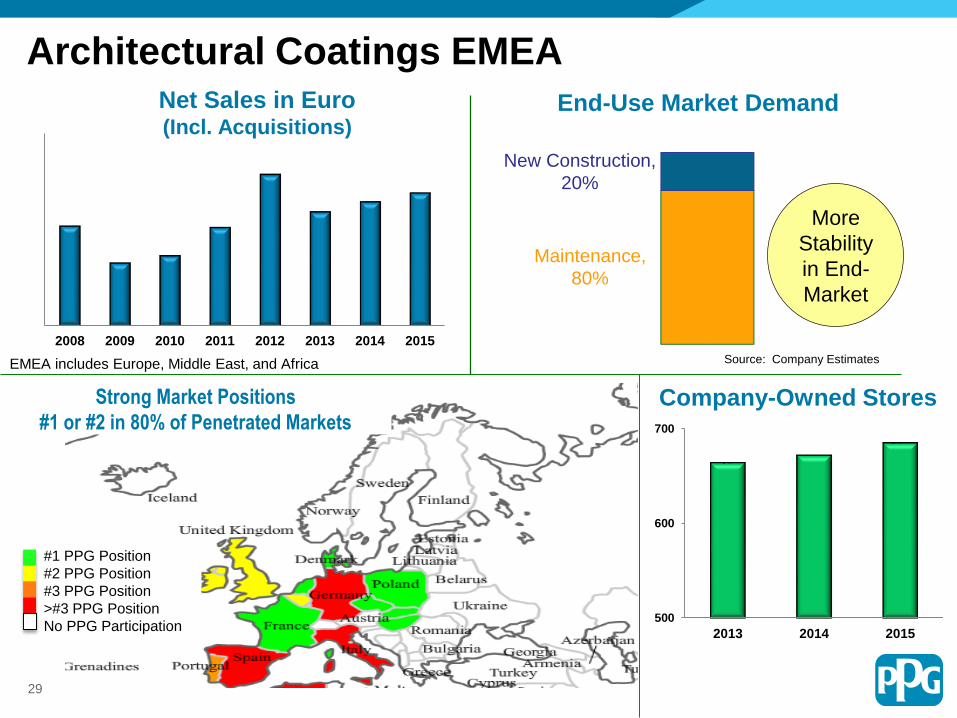
Architectural Coatings EMEA
Source: Company Estimates
More
Stability
in End-
Market
Maintenance,
80%
New Construction,
20%
End-Use Market Demand
500
600
700
2013 2014 2015
Strong Market Positions
#1 or #2 in 80% of Penetrated Markets
#1 PPG Position
#2 PPG Position
#3 PPG Position
>#3 PPG Position
No PPG Participation
2008 2009 2010 2011 2012 2013 2014 2015
Company-Owned Stores
29
EMEA includes Europe, Middle East, and Africa
Net Sales in Euro (Incl. Acquisitions)
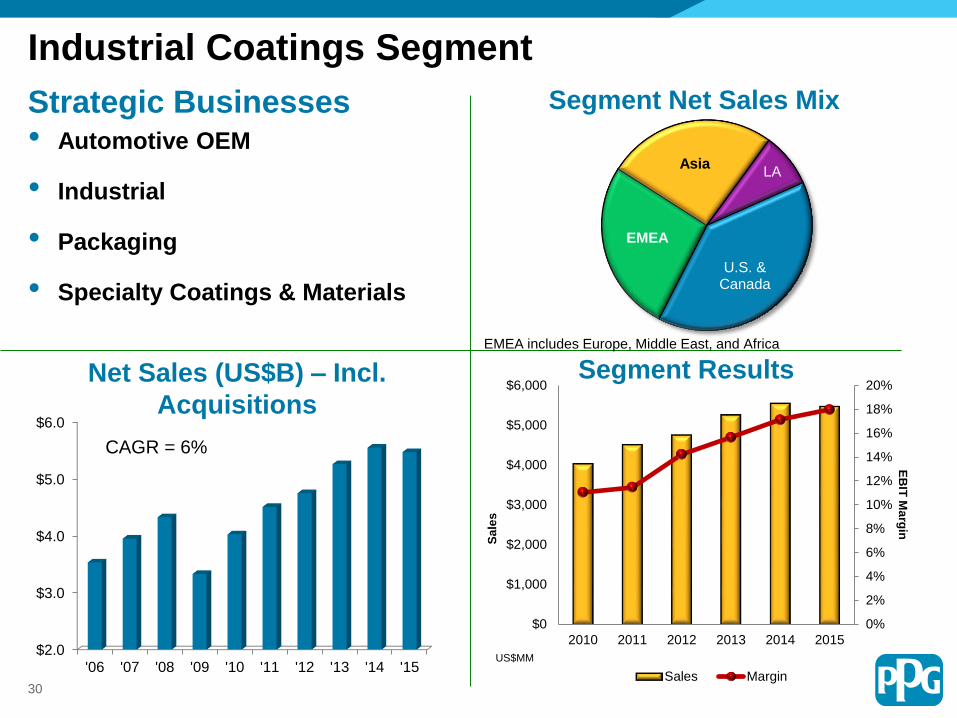
Industrial Coatings Segment
Strategic Businesses• Automotive OEM
• Industrial
• Packaging
• Specialty Coatings & Materials
$2.0
$3.0
$4.0
$5.0
$6.0
'06 '07 '08 '09 '10 '11 '12 '13 '14 '15
Net Sales (US$B) – Incl.
Acquisitions
U.S. & Canada
EMEA
AsiaLA
Segment Net Sales Mix
Segment Results
CAGR = 6%
US$MM
0%
2%
4%
6%
8%
10%
12%
14%
16%
18%
20%
$0
$1,000
$2,000
$3,000
$4,000
$5,000
$6,000
2010 2011 2012 2013 2014 2015
EB
IT M
arg
in
Sa
les
Sales Margin30
EMEA includes Europe, Middle East, and Africa
2006 '07 '08 '09 '10 '11 '12 '13 '14 2015
U.S. & Canada
EMEA
Asia
LA
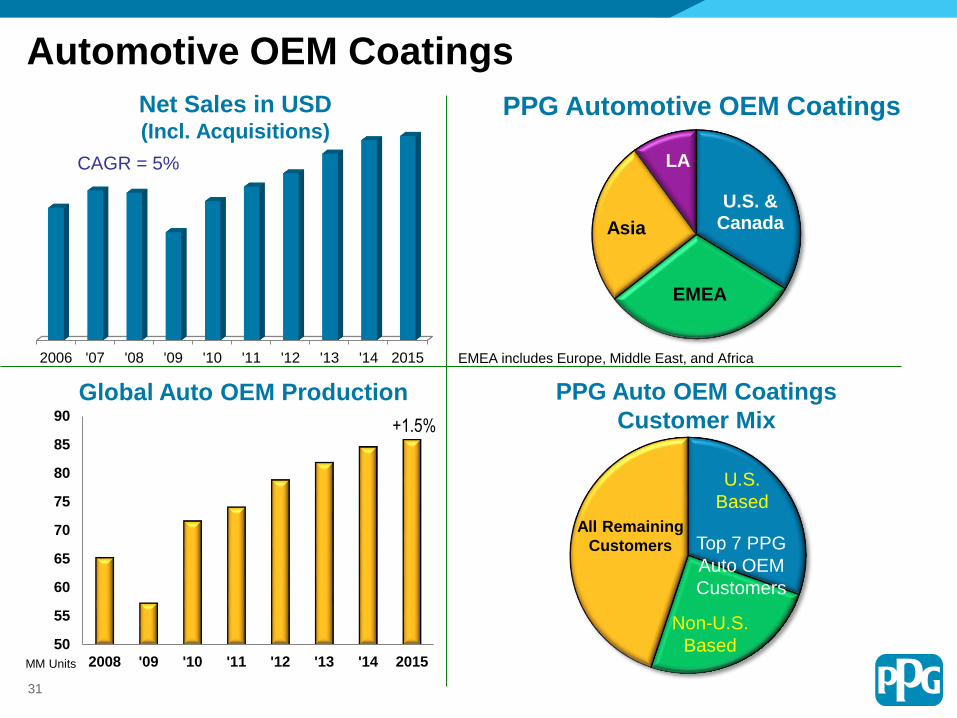
PPG Automotive OEM Coatings
Automotive OEM Coatings
CAGR = 5%
50
55
60
65
70
75
80
85
90
2008 '09 '10 '11 '12 '13 '14 2015
Global Auto OEM Production
MM Units
All Remaining
Customers
PPG Auto OEM Coatings
Customer Mix
Top 7 PPG
Auto OEM
Customers
U.S.
Based
Non-U.S.
Based
+1.5%
31
EMEA includes Europe, Middle East, and Africa
Net Sales in USD (Incl. Acquisitions)
U.S. & Canada
EMEA
Asia
LA
EMEA includes Europe, Middle East, and Africa
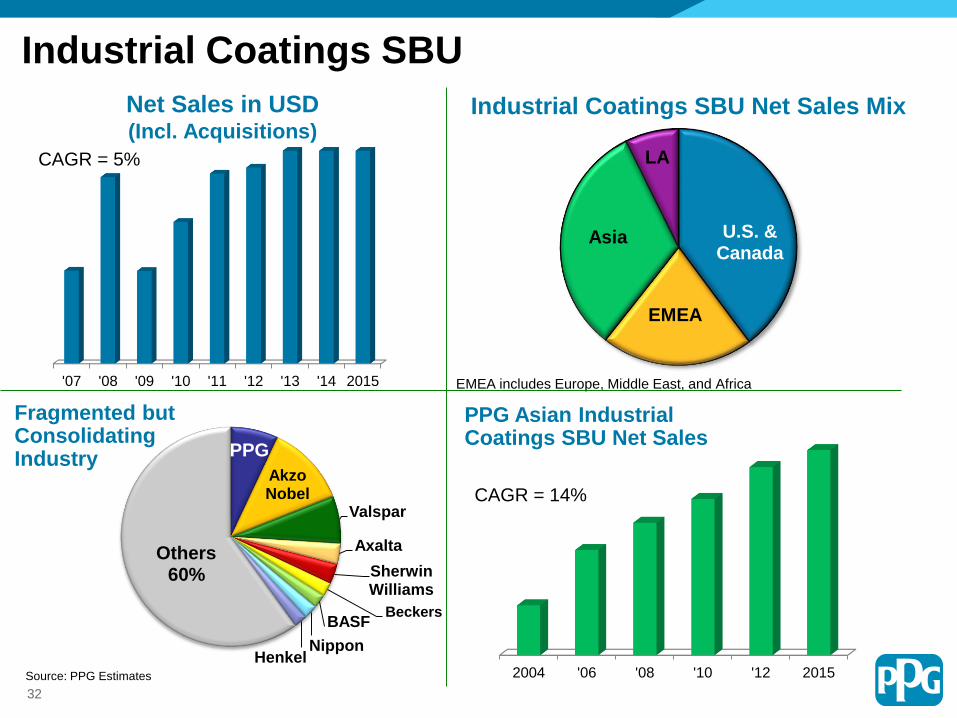
2004 '06 '08 '10 '12 2015
PPG Asian Industrial Coatings SBU Net Sales
'07 '08 '09 '10 '11 '12 '13 '14 2015
Industrial Coatings SBU Net Sales Mix
Source: PPG Estimates
Industrial Coatings SBU
CAGR = 5%
CAGR = 14%
PPG
Akzo Nobel
Valspar
Axalta
Sherwin Williams
BeckersBASF
NipponHenkel
Others60%
Fragmented but Consolidating Industry
32
Net Sales in USD (Incl. Acquisitions)
2006 '07 '08 '09 '10 '11 '12 '13 '14 2015
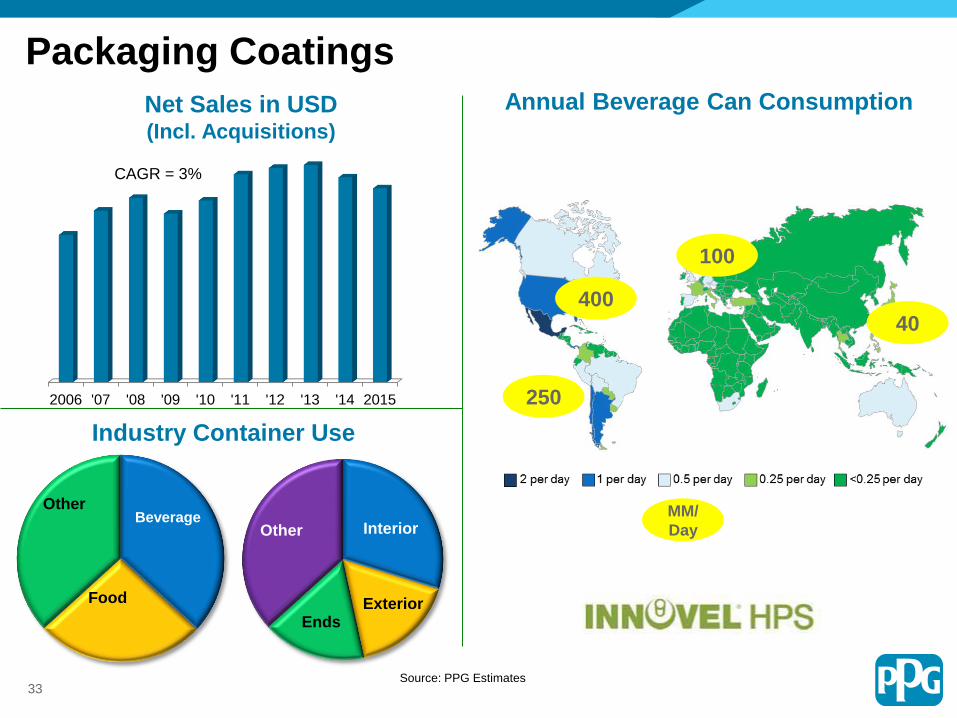
Annual Beverage Can Consumption
Packaging Coatings
CAGR = 3%
Beverage
Food
Other
Industry Container Use
Source: PPG Estimates
Interior
ExteriorEnds
Other
400
250
100
40
MM/
Day
33
Net Sales in USD (Incl. Acquisitions)
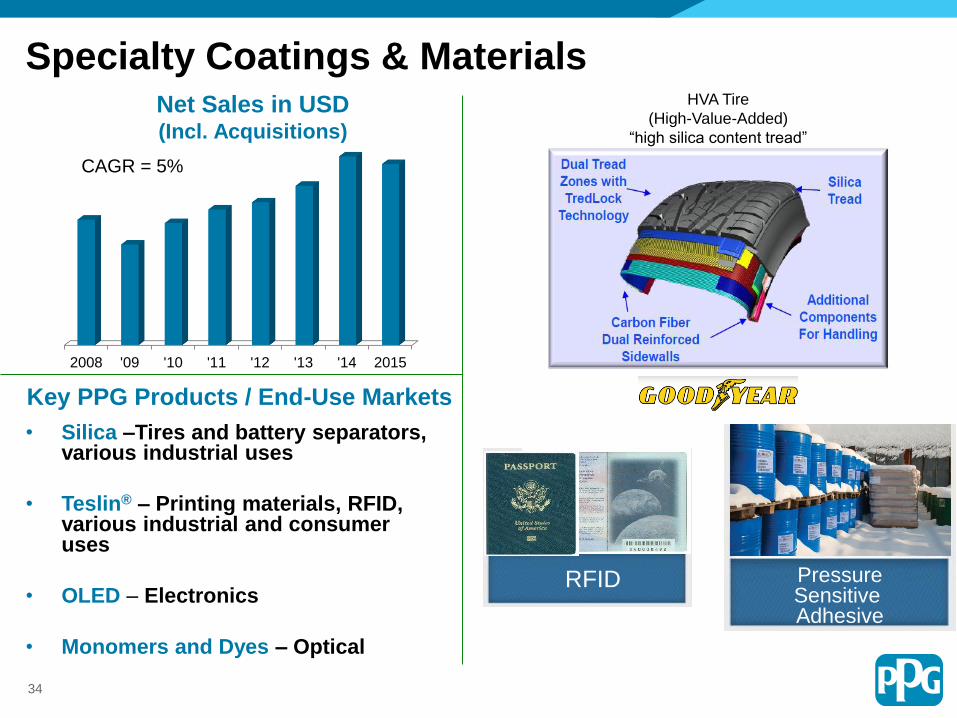
2008 '09 '10 '11 '12 '13 '14 2015
Specialty Coatings & Materials
CAGR = 5%
• Silica –Tires and battery separators, various industrial uses
• Teslin® – Printing materials, RFID, various industrial and consumer uses
• OLED – Electronics
• Monomers and Dyes – Optical
Key PPG Products / End-Use Markets
HVA Tire
(High-Value-Added)
“high silica content tread”
RFID PressureSensitive Adhesive
34
Net Sales in USD (Incl. Acquisitions)
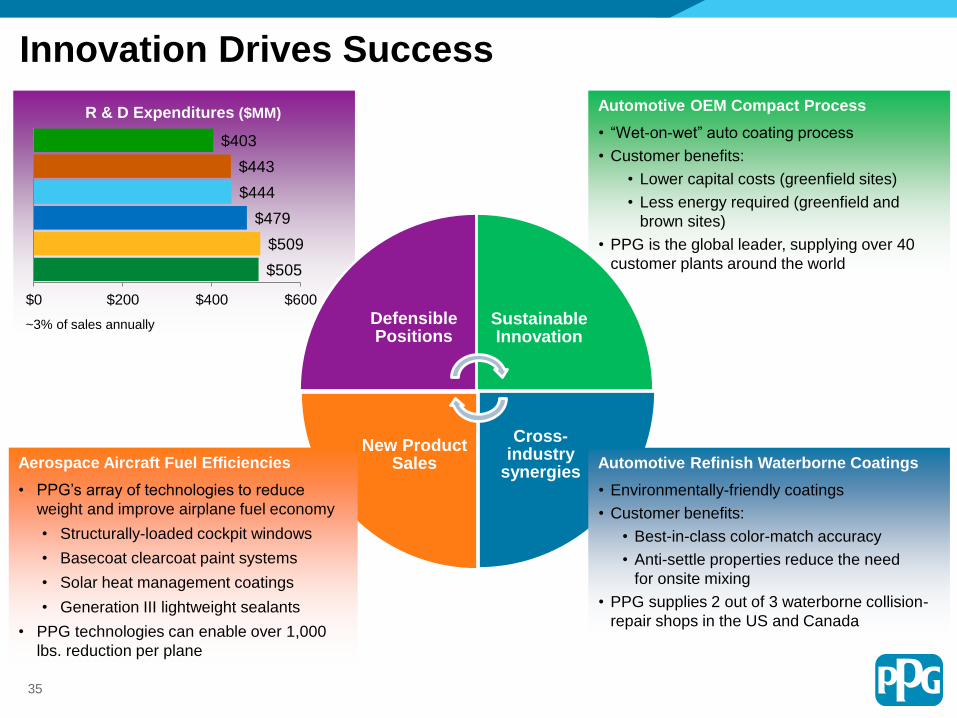
R & D Expenditures ($MM)
~3% of sales annually
2015
2014
2013
2012
2011
2010
$505
$509
$479
$444
$443
$403
$0 $200 $400 $600
35
Automotive OEM Compact Process
• “Wet-on-wet” auto coating process
• Customer benefits:
• Lower capital costs (greenfield sites)
• Less energy required (greenfield and
brown sites)
• PPG is the global leader, supplying over 40
customer plants around the world
Defensible Positions
Sustainable Innovation
Cross-industry
synergies
New Product Sales
Innovation Drives Success
Automotive Refinish Waterborne Coatings
• Environmentally-friendly coatings
• Customer benefits:
• Best-in-class color-match accuracy
• Anti-settle properties reduce the need
for onsite mixing
• PPG supplies 2 out of 3 waterborne collision-
repair shops in the US and Canada
Aerospace Aircraft Fuel Efficiencies
• PPG’s array of technologies to reduce
weight and improve airplane fuel economy
• Structurally-loaded cockpit windows
• Basecoat clearcoat paint systems
• Solar heat management coatings
• Generation III lightweight sealants
• PPG technologies can enable over 1,000
lbs. reduction per plane
36
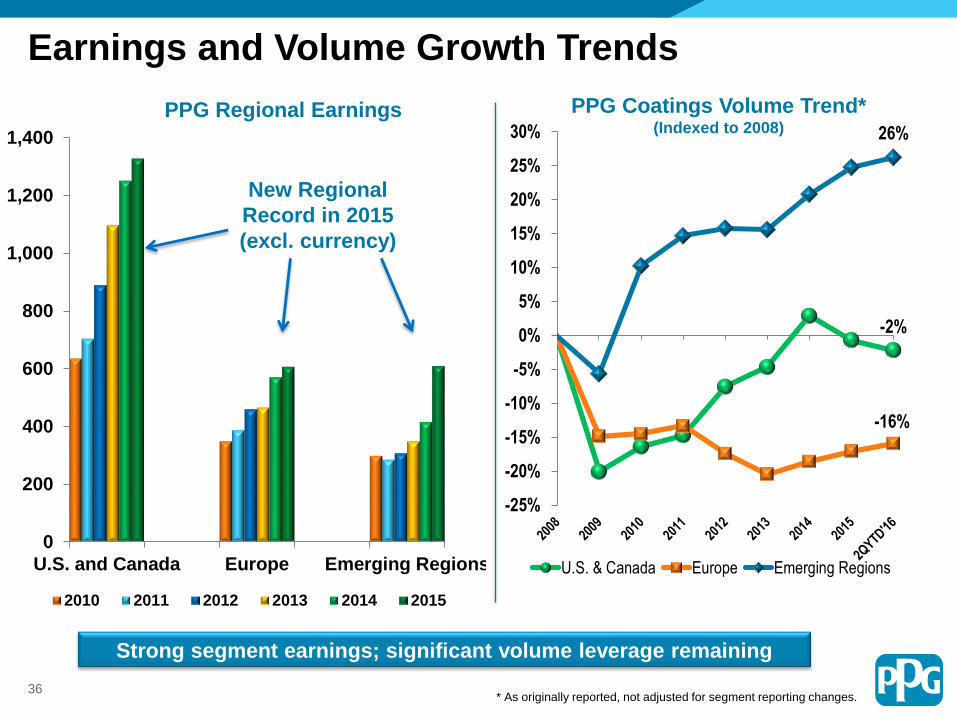
Earnings and Volume Growth Trends
PPG Regional Earnings PPG Coatings Volume Trend*(Indexed to 2008)
0
200
400
600
800
1,000
1,200
1,400
U.S. and Canada Europe Emerging Regions
2010 2011 2012 2013 2014 2015
-2%
-16%
26%
-25%
-20%
-15%
-10%
-5%
0%
5%
10%
15%
20%
25%
30%
U.S. & Canada Europe Emerging Regions
Strong segment earnings; significant volume leverage remaining
New Regional
Record in 2015
(excl. currency)
* As originally reported, not adjusted for segment reporting changes.
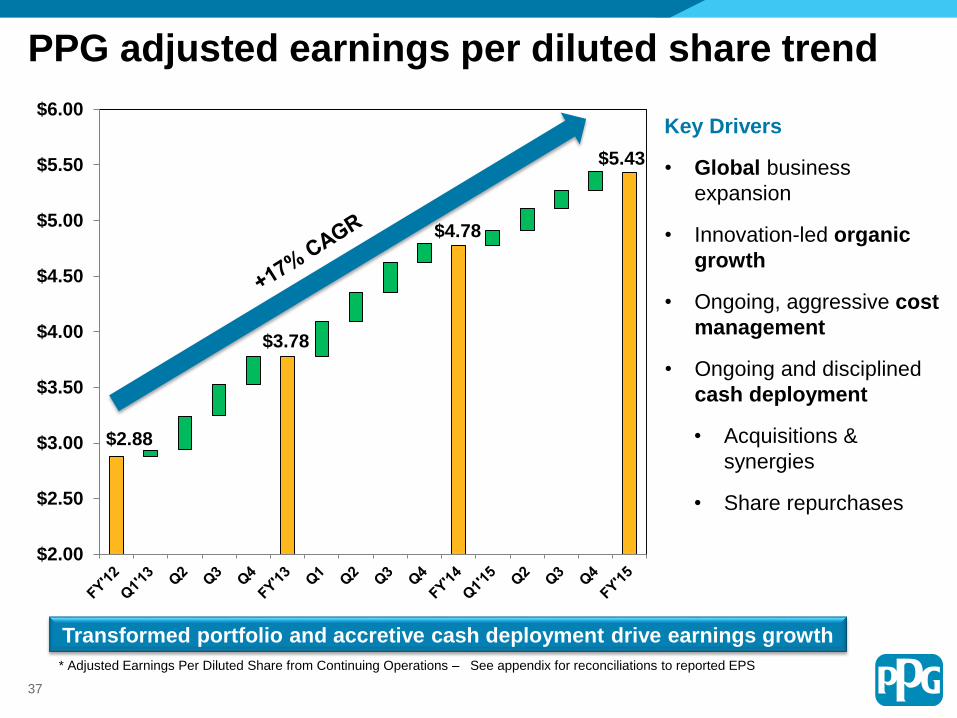
$2.88
$3.78
$4.78
$2.00
$2.50
$3.00
$3.50
$4.00
$4.50
$5.00
$5.50
$6.00
PPG adjusted earnings per diluted share trend
Key Drivers
• Global business
expansion
• Innovation-led organic
growth
• Ongoing, aggressive cost
management
• Ongoing and disciplined
cash deployment
• Acquisitions &
synergies
• Share repurchases
Transformed portfolio and accretive cash deployment drive earnings growth
* Adjusted Earnings Per Diluted Share from Continuing Operations – See appendix for reconciliations to reported EPS
$5.43
37
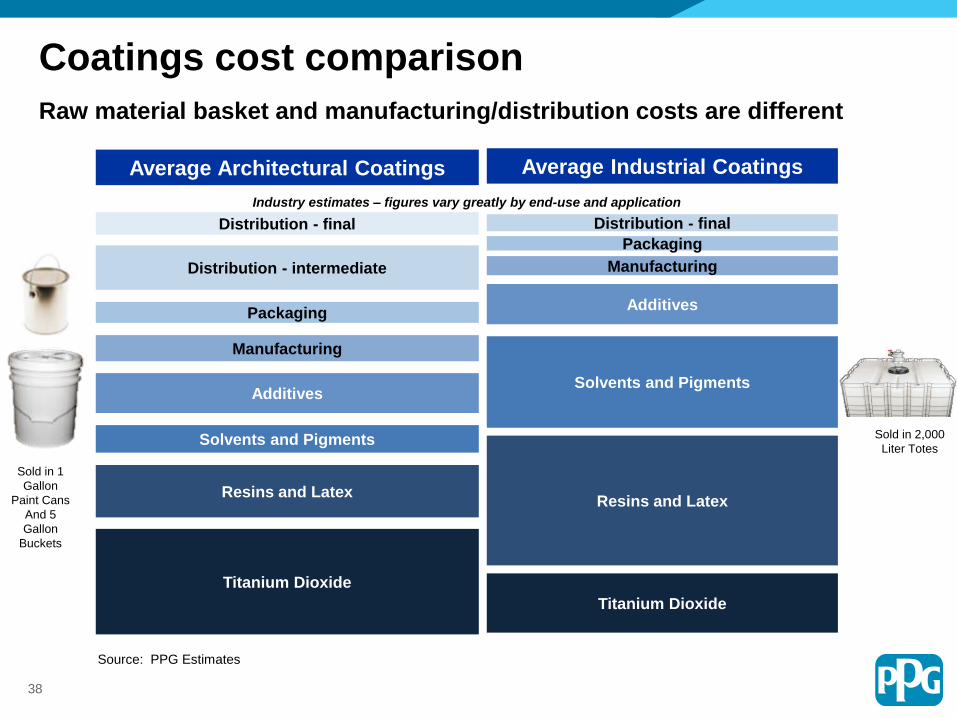
Coatings cost comparison
Sold in 2,000
Liter Totes
Sold in 1
Gallon
Paint Cans
And 5
Gallon
Buckets
Average Architectural Coatings
Industry estimates – figures vary greatly by end-use and application
Source: PPG Estimates
Average Industrial Coatings
Raw material basket and manufacturing/distribution costs are different
Resins and Latex
Titanium Dioxide
Solvents and Pigments
Additives
Manufacturing
Packaging
Distribution - intermediate
Distribution - final
Resins and Latex
Titanium Dioxide
Solvents and Pigments
Additives
Manufacturing
Packaging
Distribution - final
38
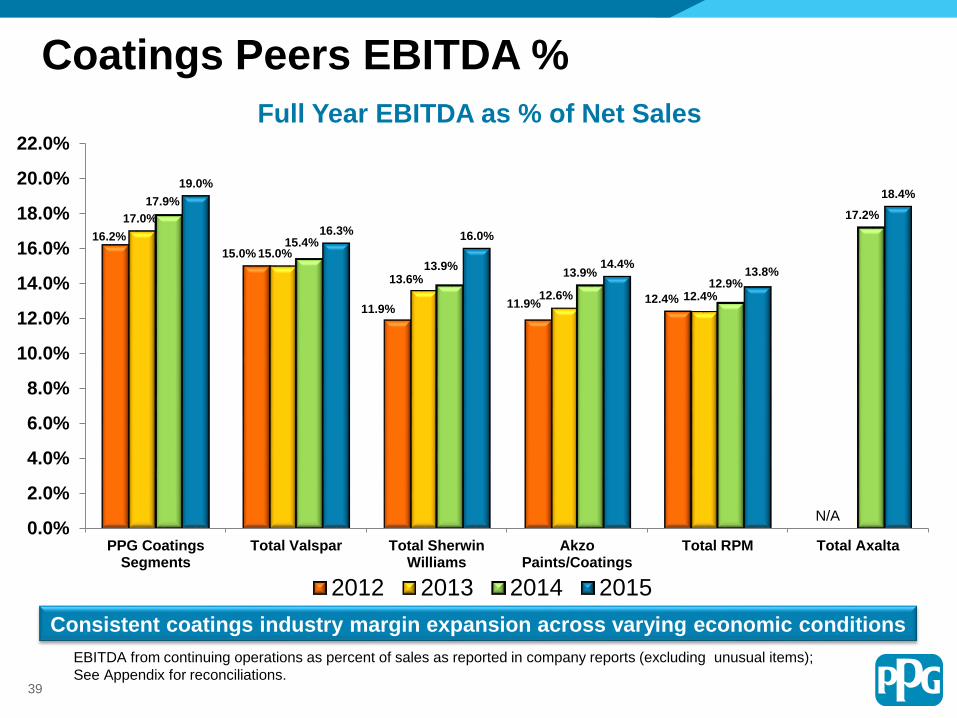
EBITDA from continuing operations as percent of sales as reported in company reports (excluding unusual items);
See Appendix for reconciliations.
16.2%
15.0%
11.9% 11.9% 12.4%
17.0%
15.0%
13.6%
12.6% 12.4%
17.9%
15.4%
13.9%13.9%
12.9%
17.2%
19.0%
16.3% 16.0%
14.4%13.8%
18.4%
0.0%
2.0%
4.0%
6.0%
8.0%
10.0%
12.0%
14.0%
16.0%
18.0%
20.0%
22.0%
PPG CoatingsSegments
Total Valspar Total SherwinWilliams
AkzoPaints/Coatings
Total RPM Total Axalta
Full Year EBITDA as % of Net Sales
2012 2013 2014 2015
N/A
Coatings Peers EBITDA %
Consistent coatings industry margin expansion across varying economic conditions
39
110%
114%
130%
140% 140%
113%
123%
131%
143%
146%
122%125%
127%
140% 136%
101%
111%
120%
128%
135%
100%
105%
110%
115%
120%
125%
130%
135%
140%
145%
150%
2010 2011 2012 2013 2014 2015
PPG Coatings Sherwin Valspar RPM
Coatings companies net sales growth
Net Sales CAGR 3-Year 5-Year
PPG Coatings 6.9% 6.9%
Sherwin-Williams 5.9% 7.8%
Valspar 3.0% 6.4%
RPM 6.8% 6.1%
40
106%
122%
145%
165%
175%
104%
122%
150%
167%
198%
111%
131%
133%
151%
165%
103%
116%
125%
144%
154%
100%
110%
120%
130%
140%
150%
160%
170%
180%
190%
200%
2010 2011 2012 2013 2014 2015
PPG Coatings Sherwin Valspar RPM
Coatings companies EBITDA growth
EBITDA CAGR 3-Year 5-Year
PPG Coatings 12.7% 11.8%
Sherwin-Williams 17.0% 14.3%
Valspar 5.8% 9.2%
RPM 10.4% 9.4%
41
EBITDA from continuing operations as percent of sales as reported in company reports (excluding unusual items);
See Appendix for reconciliations.
0.00%
1.00%
2.00%
3.00%
4.00%
5.00%
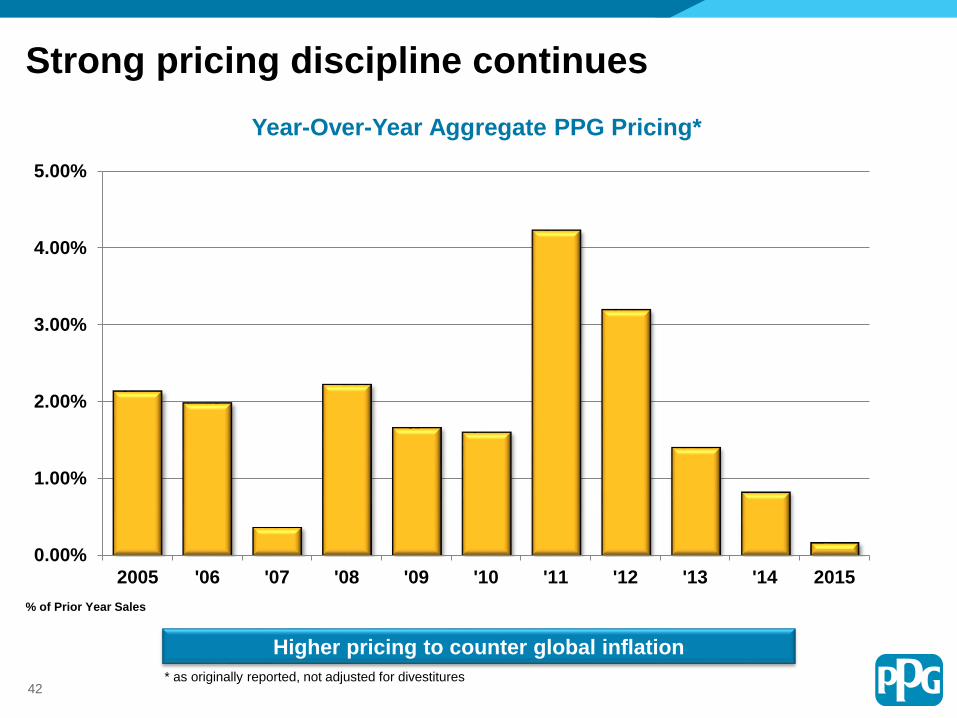
2005 '06 '07 '08 '09 '10 '11 '12 '13 '14 2015
% of Prior Year Sales
Year-Over-Year Aggregate PPG Pricing*
Strong pricing discipline continues
As originally reported, not adjusted for segment reporting changes
Higher pricing to counter global inflation
42* as originally reported, not adjusted for divestitures
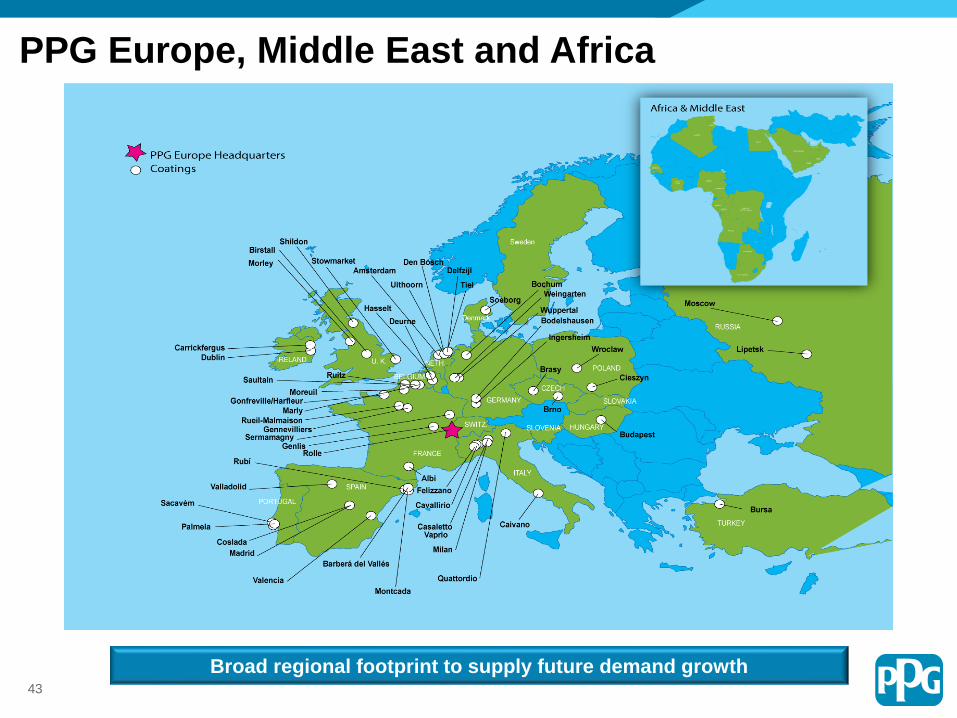
PPG Europe, Middle East and Africa
Broad regional footprint to supply future demand growth43
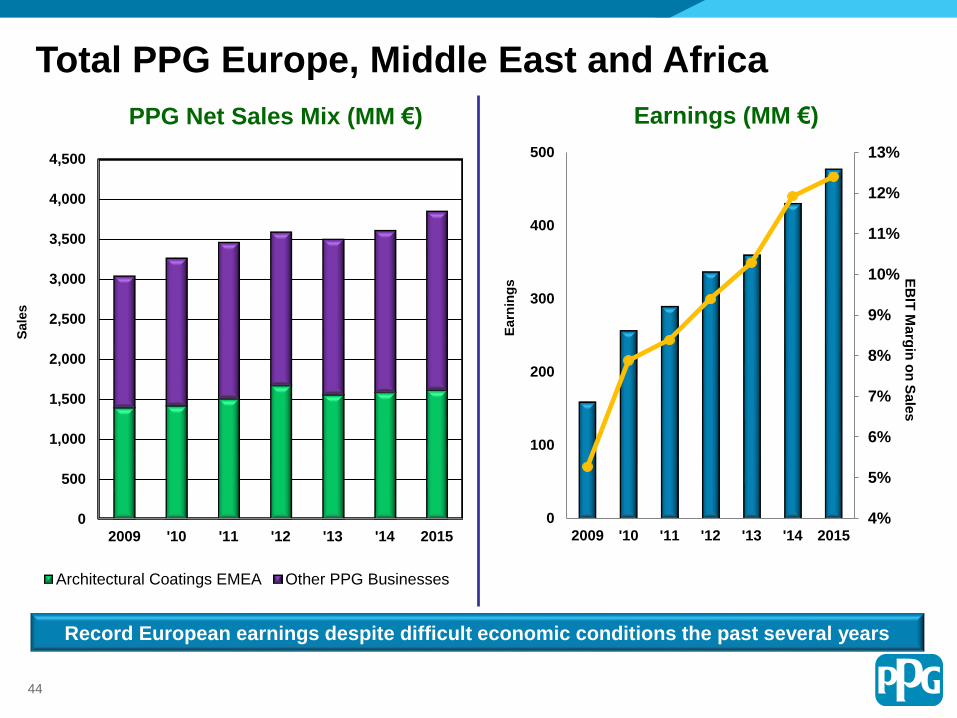
Total PPG Europe, Middle East and Africa
0
500
1,000
1,500
2,000
2,500
3,000
3,500
4,000
4,500
2009 '10 '11 '12 '13 '14 2015
Sale
s
Architectural Coatings EMEA Other PPG Businesses
PPG Net Sales Mix (MM €)
4%
5%
6%
7%
8%
9%
10%
11%
12%
13%
0
100
200
300
400
500
2009 '10 '11 '12 '13 '14 2015
EB
IT M
arg
in o
n S
ale
s
Earn
ing
s
Earnings (MM €)
Record European earnings despite difficult economic conditions the past several years
44
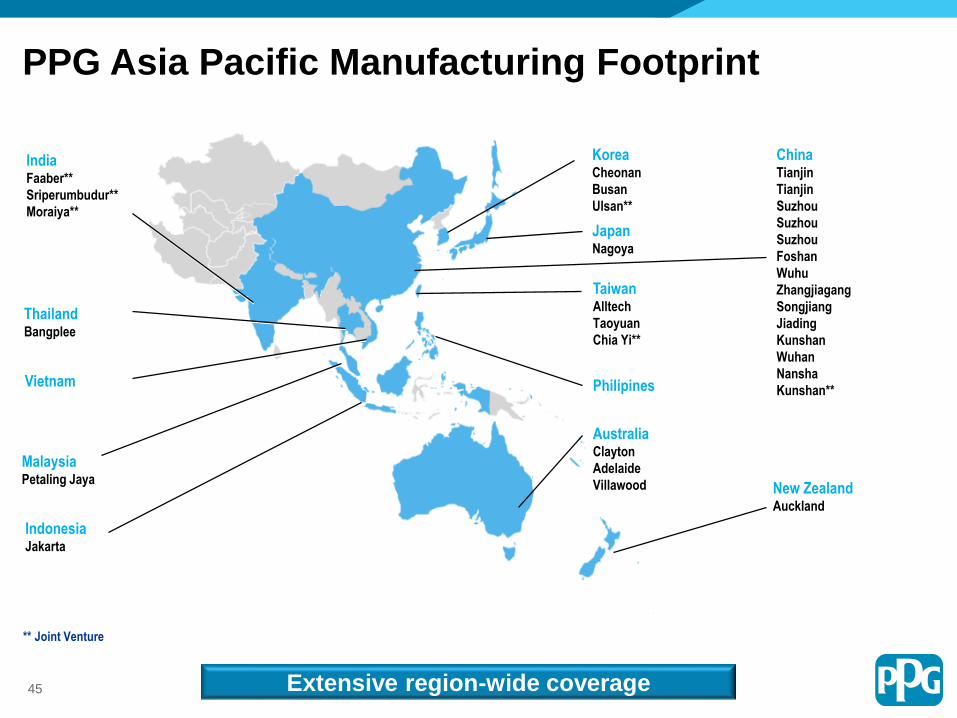
PPG Asia Pacific Manufacturing Footprint
ChinaTianjin
Tianjin
Suzhou
Suzhou
Suzhou
Foshan
Wuhu
Zhangjiagang
Songjiang
Jiading
Kunshan
Wuhan
Nansha
Kunshan**
ThailandBangplee
KoreaCheonan
Busan
Ulsan**
AustraliaClayton
Adelaide
Villawood
MalaysiaPetaling Jaya
New ZealandAuckland
TaiwanAlltech
Taoyuan
Chia Yi**
IndonesiaJakarta
JapanNagoya
Vietnam
IndiaFaaber**
Sriperumbudur**
Moraiya**
** Joint Venture
Philipines
Extensive region-wide coverage45
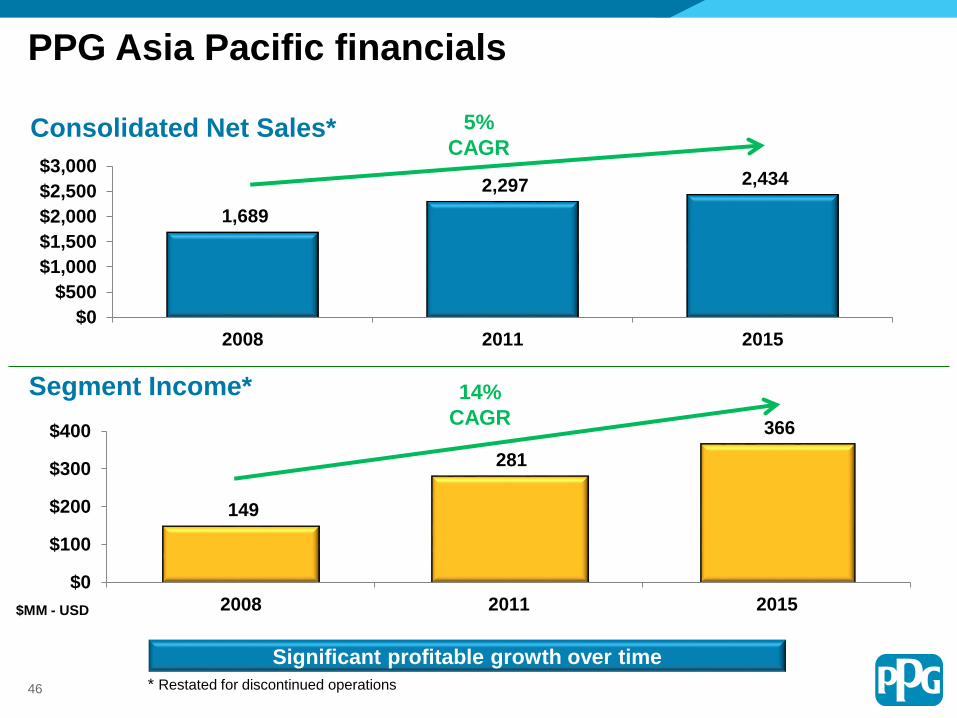
1,689
2,297 2,434
$0
$500
$1,000
$1,500
$2,000
$2,500
$3,000
2008 2011 2015
Consolidated Net Sales*
149
281
366
$0
$100
$200
$300
$400
2008 2011 2015
Segment Income* 14%
CAGR
Significant profitable growth over time
$MM - USD
5%
CAGR
* Restated for discontinued operations
PPG Asia Pacific financials
46
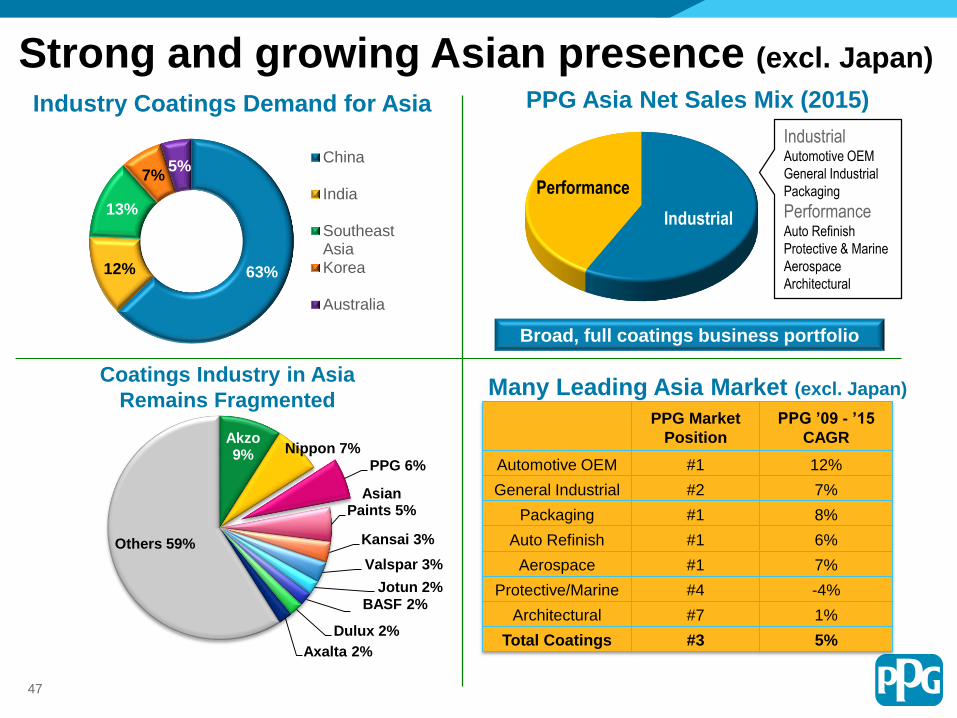
Strong and growing Asian presence (excl. Japan)
Many Leading Asia Market (excl. Japan)
Industrial Automotive OEM
General Industrial
Packaging
PerformanceAuto Refinish
Protective & Marine
Aerospace
Architectural
Performance
Industrial
Broad, full coatings business portfolio
PPG Asia Net Sales Mix (2015)Industry Coatings Demand for Asia
Coatings Industry in Asia
Remains Fragmented
Sources: PPG Internal estimates (excludes Japan includes ARCH)
PPG Market
Position
PPG ’09 - ’15
CAGR
Automotive OEM #1 12%
General Industrial #2 7%
Packaging #1 8%
Auto Refinish #1 6%
Aerospace #1 7%
Protective/Marine #4 -4%
Architectural #7 1%
Total Coatings #3 5%
Akzo9% Nippon 7%
PPG 6%
Asian Paints 5%
Kansai 3%
Valspar 3%
Jotun 2%BASF 2%
Dulux 2%
Axalta 2%
Others 59%
63%12%
13%
7%5%
China
India
SoutheastAsiaKorea
Australia
47
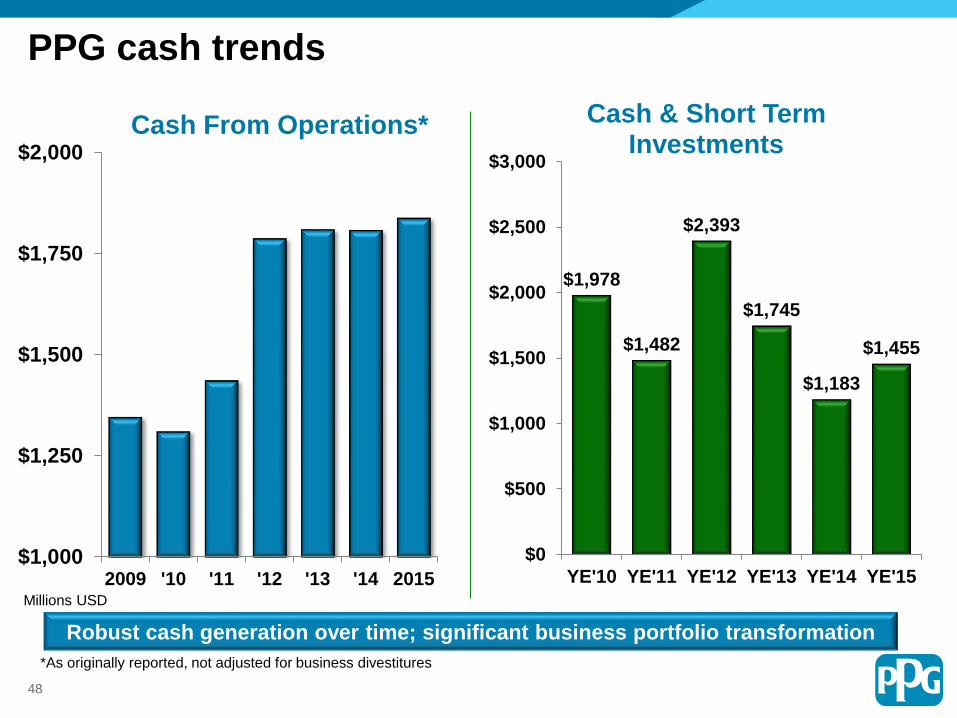
$1,000
$1,250
$1,500
$1,750
$2,000
2009 '10 '11 '12 '13 '14 2015
Cash From Operations*
Robust cash generation over time; significant business portfolio transformation
$1,978
$1,482
$2,393
$1,745
$1,183
$1,455
$0
$500
$1,000
$1,500
$2,000
$2,500
$3,000
YE'10 YE'11 YE'12 YE'13 YE'14 YE'15
Cash & Short Term Investments
*As originally reported, not adjusted for business divestitures
Millions USD
PPG cash trends
48
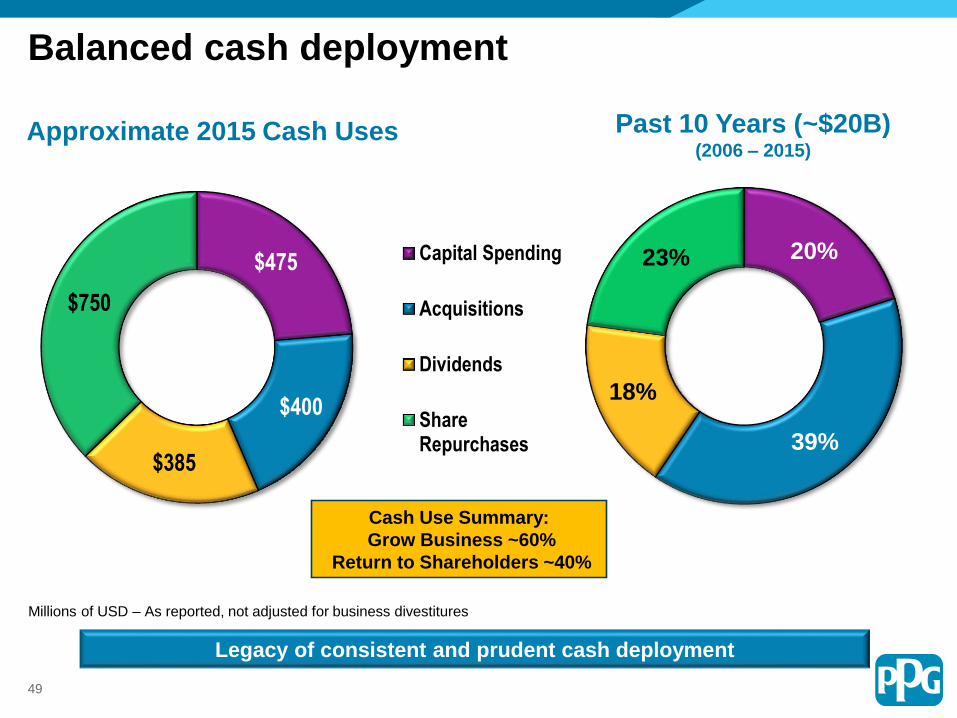
$475
$400
$385
$750
Capital Spending
Acquisitions
Dividends
ShareRepurchases
Cash Use Summary:
Grow Business ~60%
Return to Shareholders ~40%
20%
39%
18%
23%
Past 10 Years (~$20B)(2006 – 2015)
Approximate 2015 Cash Uses
Millions of USD – As reported, not adjusted for business divestitures
Legacy of consistent and prudent cash deployment
Balanced cash deployment
49
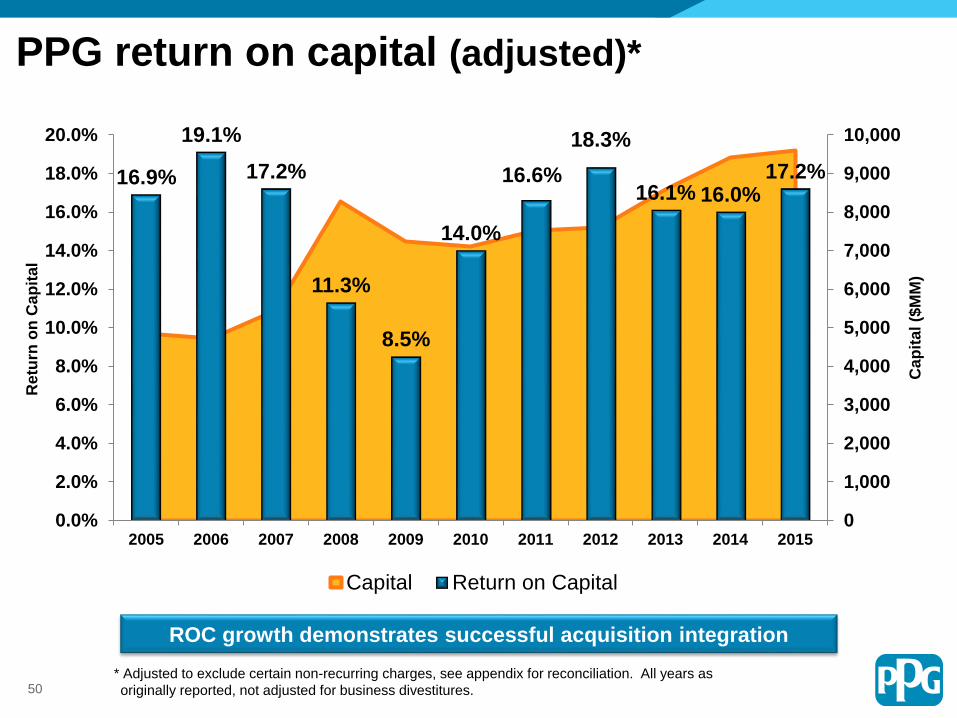
16.9%
19.1%
17.2%
11.3%
8.5%
14.0%
16.6%
18.3%
16.1% 16.0%17.2%
0
1,000
2,000
3,000
4,000
5,000
6,000
7,000
8,000
9,000
10,000
0.0%
2.0%
4.0%
6.0%
8.0%
10.0%
12.0%
14.0%
16.0%
18.0%
20.0%
2005 2006 2007 2008 2009 2010 2011 2012 2013 2014 2015
Cap
ital ($
MM
)
Re
turn
on
Cap
ital
Capital Return on Capital
* Adjusted to exclude certain non-recurring charges, see appendix for reconciliation. All years as
originally reported, not adjusted for business divestitures.
ROC growth demonstrates successful acquisition integration
PPG return on capital (adjusted)*
50
$0
$200
$400
$600
$800
$1,000
2005 '07 '09 '11 '13 2015
0
100
200
300
400
500
600
700
2016201720182019202020212022 20272029203820402044
USD Notes
EUR Notes
0.00
0.20
0.40
0.60
0.80
1.00
1.20
1.40
1.60
'78 '81 '84 '87 '90 '93 '96 '99 '02 '05 '08 '11 '14
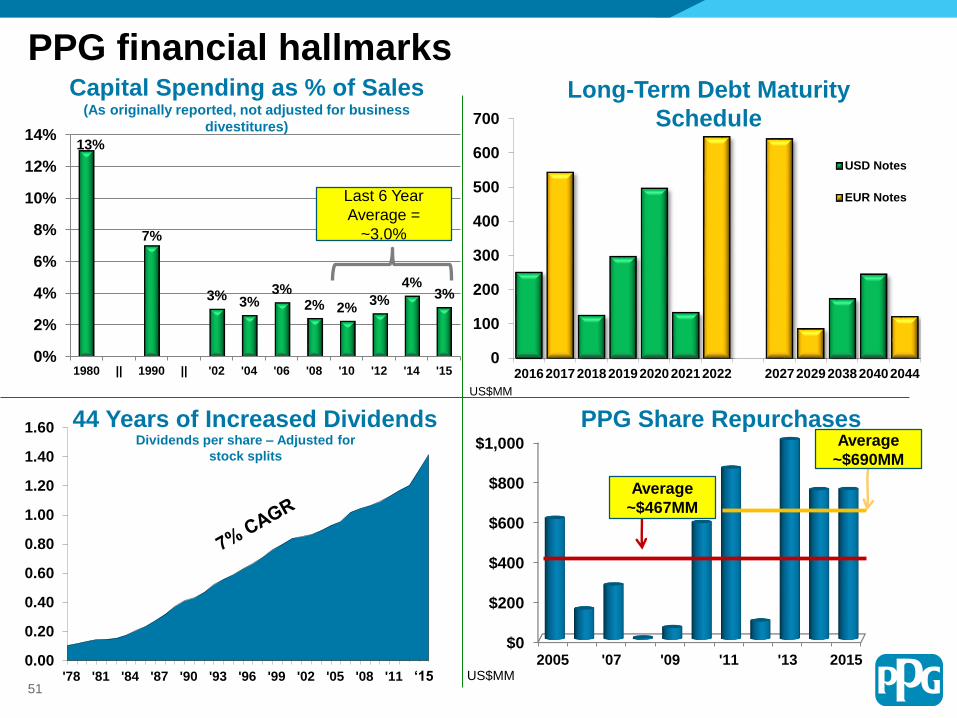
44 Years of Increased DividendsDividends per share – Adjusted for
stock splits
US$MM
Long-Term Debt Maturity
Schedule13%
7%
3% 3%3%
2% 2%3%
4%3%
0%
2%
4%
6%
8%
10%
12%
14%
1980 || 1990 || '02 '04 '06 '08 '10 '12 '14 '15
Capital Spending as % of Sales (As originally reported, not adjusted for business
divestitures)
Last 6 Year
Average =
~3.0%
PPG Share Repurchases
US$MM
Average
~$467MM
Average
~$690MM
PPG financial hallmarks
51‘15
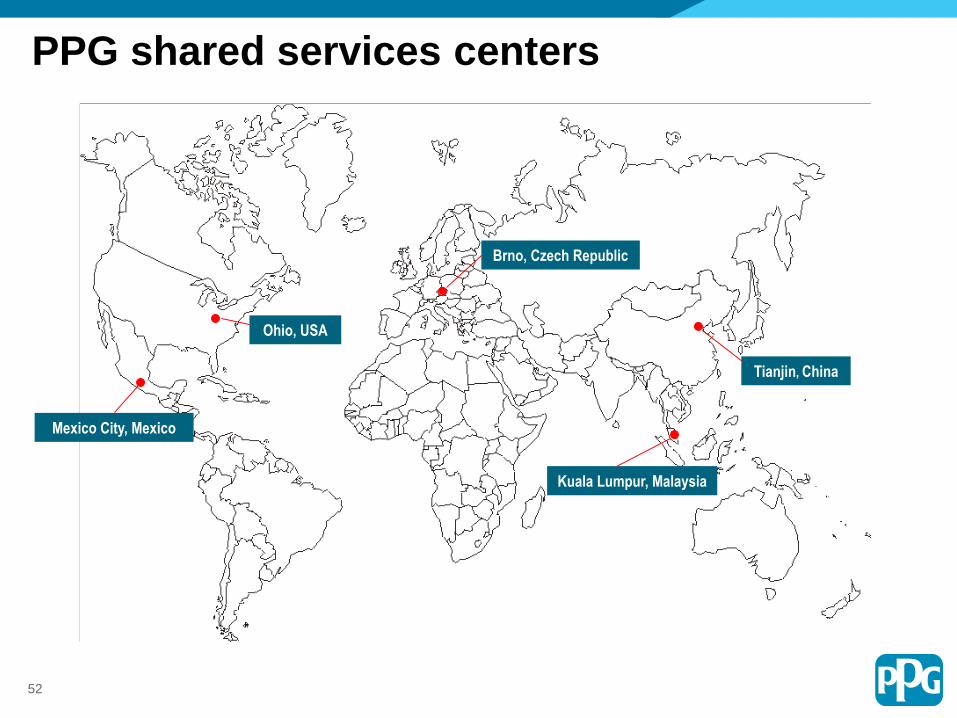
PPG shared services centers
Ohio, USA
Brno, Czech Republic
Kuala Lumpur, Malaysia
Tianjin, China
52
Mexico City, Mexico
www.ppg.com
Additional Materials
and Appendix
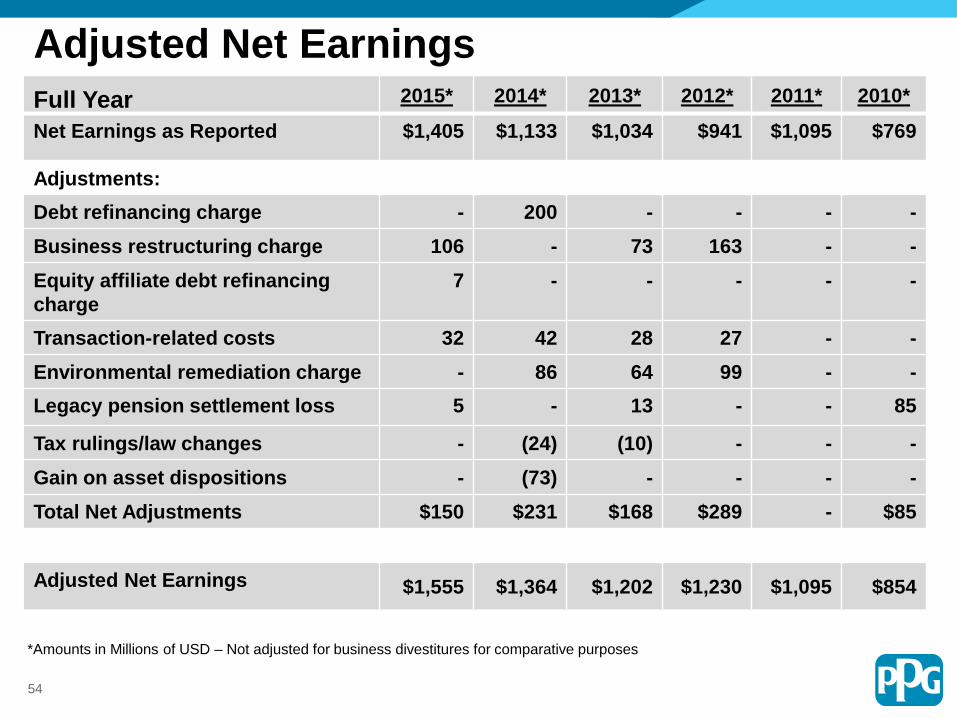
2015* 2014* 2013* 2012* 2011* 2010*
Net Earnings as Reported $1,405 $1,133 $1,034 $941 $1,095 $769
Adjustments:
Debt refinancing charge - 200 - - - -
Business restructuring charge 106 - 73 163 - -
Equity affiliate debt refinancing
charge
7 - - - - -
Transaction-related costs 32 42 28 27 - -
Environmental remediation charge - 86 64 99 - -
Legacy pension settlement loss 5 - 13 - - 85
Tax rulings/law changes - (24) (10) - - -
Gain on asset dispositions - (73) - - - -
Total Net Adjustments $150 $231 $168 $289 - $85
Adjusted Net Earnings $1,555 $1,364 $1,202 $1,230 $1,095 $854
Adjusted Net Earnings
*Amounts in Millions of USD – Not adjusted for business divestitures for comparative purposes
Full Year
54
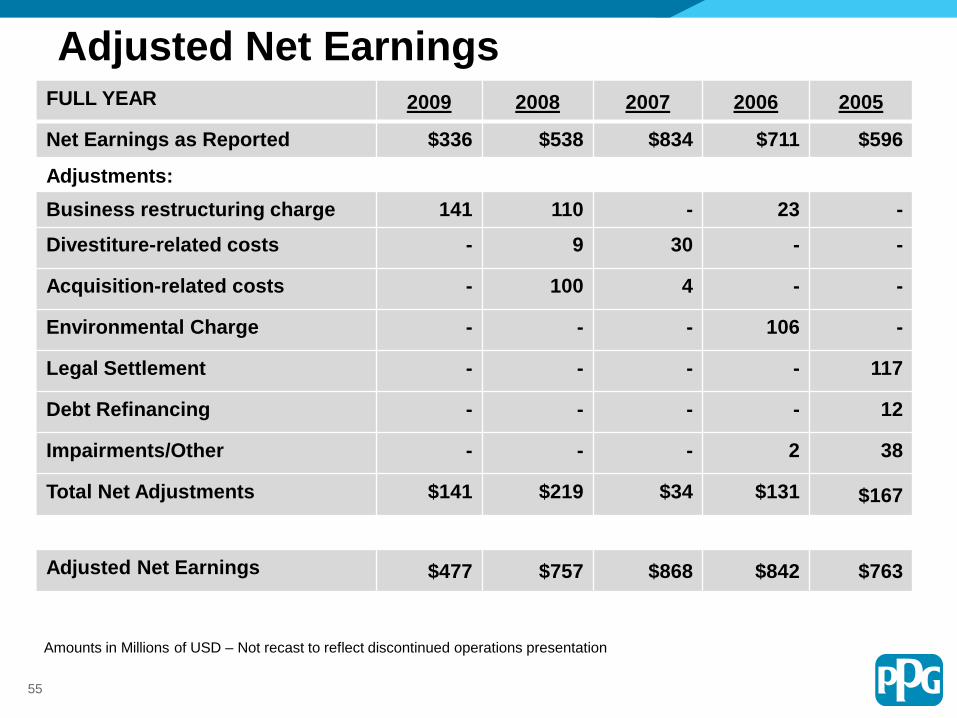
FULL YEAR 2009 2008 2007 2006 2005
Net Earnings as Reported $336 $538 $834 $711 $596
Adjustments:
Business restructuring charge 141 110 - 23 -
Divestiture-related costs - 9 30 - -
Acquisition-related costs - 100 4 - -
Environmental Charge - - - 106 -
Legal Settlement - - - - 117
Debt Refinancing - - - - 12
Impairments/Other - - - 2 38
Total Net Adjustments $141 $219 $34 $131 $167
Adjusted Net Earnings $477 $757 $868 $842 $763
Adjusted Net Earnings
Amounts in Millions of USD – Not recast to reflect discontinued operations presentation
55
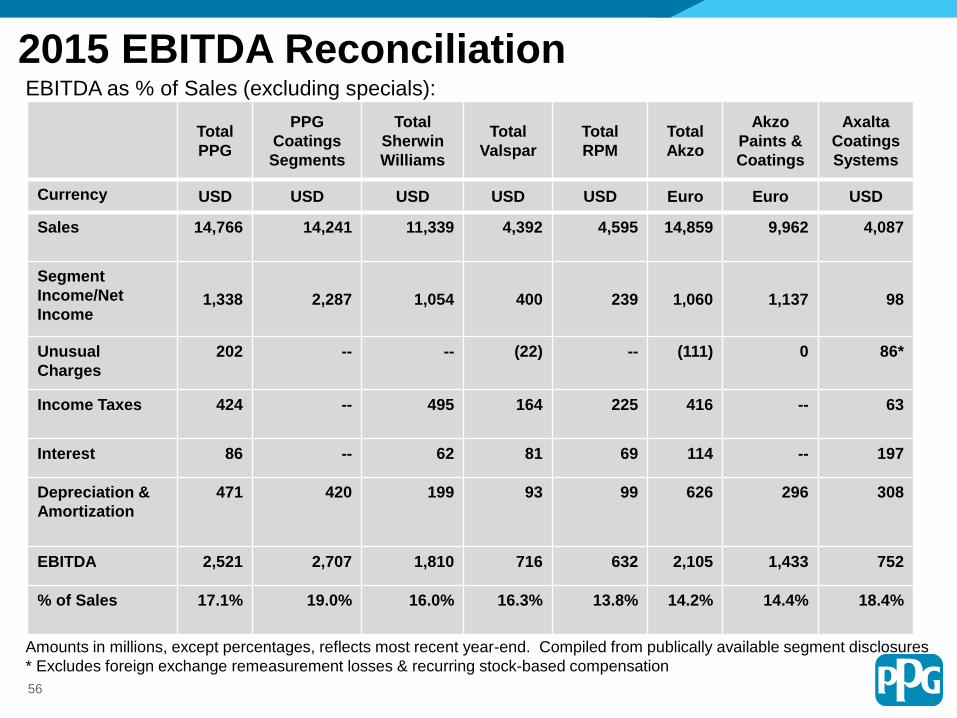
Total
PPG
PPG
Coatings
Segments
Total
Sherwin
Williams
Total
Valspar
Total
RPM
Total
Akzo
Akzo
Paints &
Coatings
Axalta
Coatings
Systems
Currency USD USD USD USD USD Euro Euro USD
Sales 14,766 14,241 11,339 4,392 4,595 14,859 9,962 4,087
Segment
Income/Net
Income 1,338 2,287 1,054 400 239 1,060 1,137 98
Unusual
Charges
202 -- -- (22) -- (111) 0 86*
Income Taxes 424 -- 495 164 225 416 -- 63
Interest 86 -- 62 81 69 114 -- 197
Depreciation &
Amortization
471 420 199 93 99 626 296 308
EBITDA 2,521 2,707 1,810 716 632 2,105 1,433 752
% of Sales 17.1% 19.0% 16.0% 16.3% 13.8% 14.2% 14.4% 18.4%
Amounts in millions, except percentages, reflects most recent year-end. Compiled from publically available segment disclosures
* Excludes foreign exchange remeasurement losses & recurring stock-based compensation
EBITDA as % of Sales (excluding specials):
2015 EBITDA Reconciliation
56
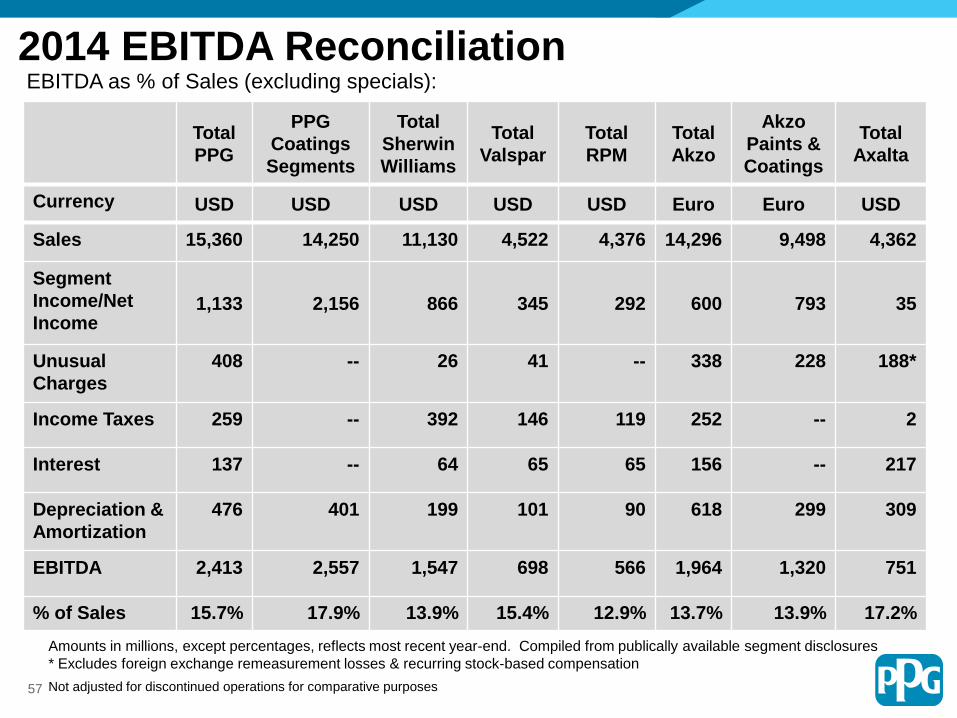
Total
PPG
PPG
Coatings
Segments
Total
Sherwin
Williams
Total
Valspar
Total
RPM
Total
Akzo
Akzo
Paints &
Coatings
Total
Axalta
Currency USD USD USD USD USD Euro Euro USD
Sales 15,360 14,250 11,130 4,522 4,376 14,296 9,498 4,362
Segment
Income/Net
Income1,133 2,156 866 345 292 600 793 35
Unusual
Charges
408 -- 26 41 -- 338 228 188*
Income Taxes 259 -- 392 146 119 252 -- 2
Interest 137 -- 64 65 65 156 -- 217
Depreciation &
Amortization
476 401 199 101 90 618 299 309
EBITDA 2,413 2,557 1,547 698 566 1,964 1,320 751
% of Sales 15.7% 17.9% 13.9% 15.4% 12.9% 13.7% 13.9% 17.2%
EBITDA as % of Sales (excluding specials):
2014 EBITDA Reconciliation
57
Amounts in millions, except percentages, reflects most recent year-end. Compiled from publically available segment disclosures
* Excludes foreign exchange remeasurement losses & recurring stock-based compensation
Not adjusted for discontinued operations for comparative purposes
Total
PPG
PPG
Coatings
Segments*
Total
Sherwin
Williams
Total
Valspar
Total
RPM
Total
Akzo *
Akzo
Paints &
Coatings
Currency USD USD USD USD USD Euro Euro
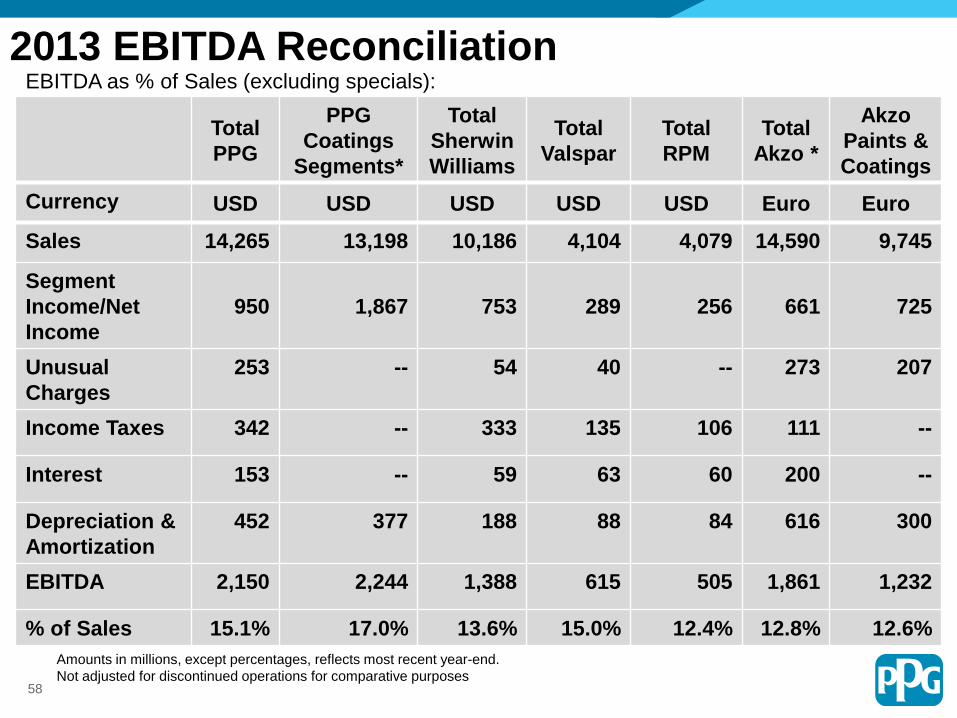
Sales 14,265 13,198 10,186 4,104 4,079 14,590 9,745
Segment
Income/Net
Income
950 1,867 753 289 256 661 725
Unusual
Charges
253 -- 54 40 -- 273 207
Income Taxes 342 -- 333 135 106 111 --
Interest 153 -- 59 63 60 200 --
Depreciation &
Amortization
452 377 188 88 84 616 300
EBITDA 2,150 2,244 1,388 615 505 1,861 1,232
% of Sales 15.1% 17.0% 13.6% 15.0% 12.4% 12.8% 12.6%
EBITDA as % of Sales (excluding specials):
2013 EBITDA Reconciliation
58
Amounts in millions, except percentages, reflects most recent year-end.
Not adjusted for discontinued operations for comparative purposes
Total
PPG
PPG
Coatings
Segments
Total
Sherwin
Williams
Total
Valspar
Total
RPM
Total
Akzo *
Akzo
Paints &
Coatings
Currency USD USD USD USD USD Euro Euro
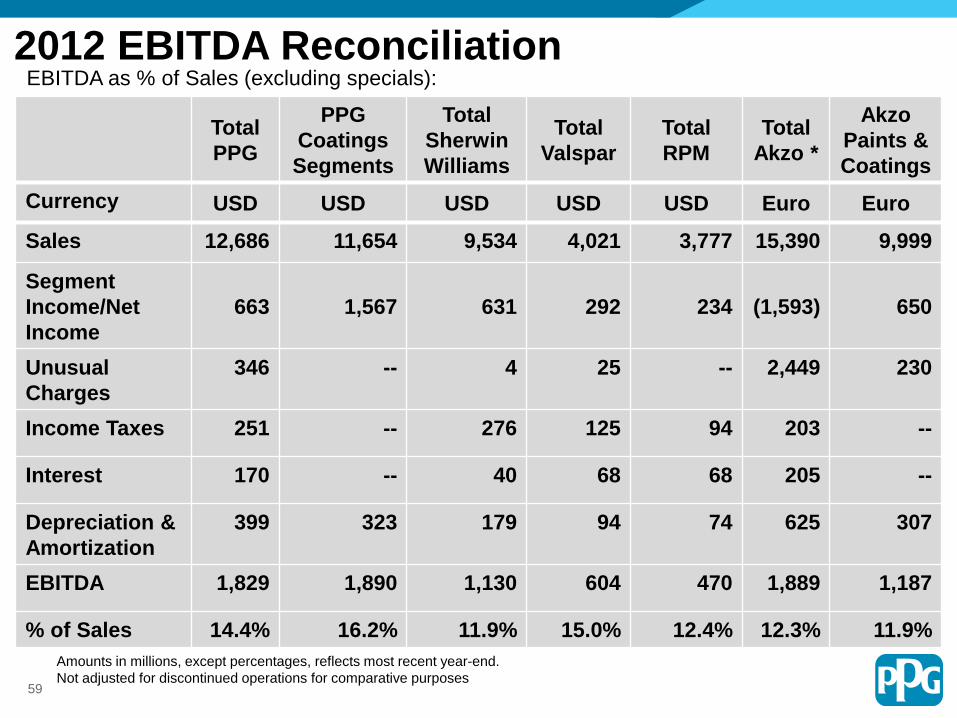
Sales 12,686 11,654 9,534 4,021 3,777 15,390 9,999
Segment
Income/Net
Income
663 1,567 631 292 234 (1,593) 650
Unusual
Charges
346 -- 4 25 -- 2,449 230
Income Taxes 251 -- 276 125 94 203 --
Interest 170 -- 40 68 68 205 --
Depreciation &
Amortization
399 323 179 94 74 625 307
EBITDA 1,829 1,890 1,130 604 470 1,889 1,187
% of Sales 14.4% 16.2% 11.9% 15.0% 12.4% 12.3% 11.9%
EBITDA as % of Sales (excluding specials):
2012 EBITDA Reconciliation
59
Amounts in millions, except percentages, reflects most recent year-end.
Not adjusted for discontinued operations for comparative purposes
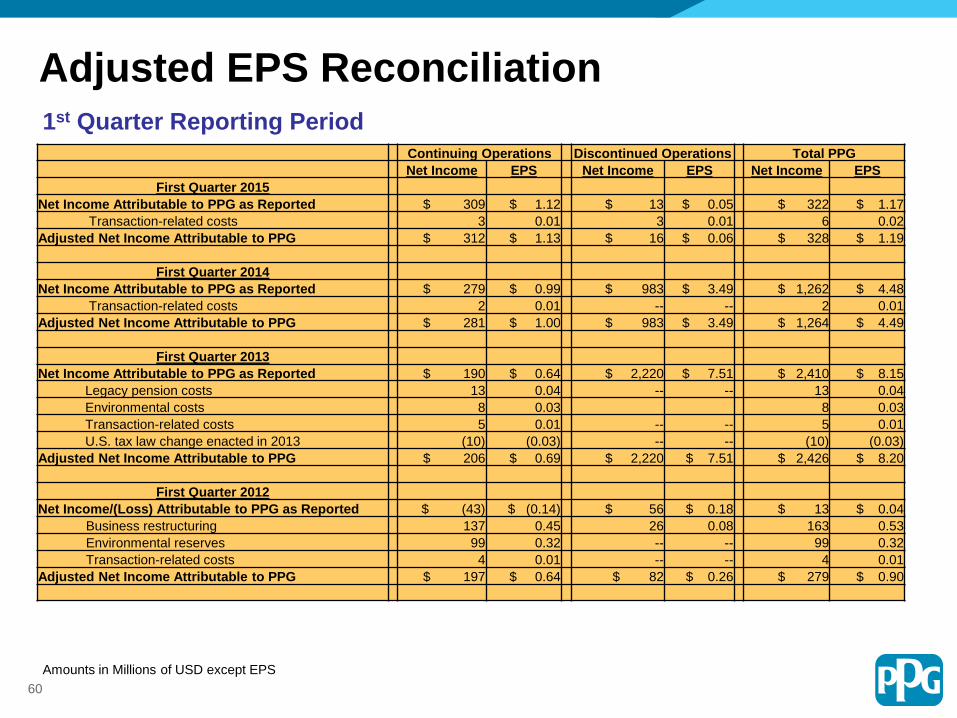
1st Quarter Reporting Period
Adjusted EPS Reconciliation
Amounts in Millions of USD except EPS
60
Continuing Operations Discontinued Operations Total PPG
Net Income EPS Net Income EPS Net Income EPS
First Quarter 2015
Net Income Attributable to PPG as Reported $ 309 $ 1.12 $ 13 $ 0.05 $ 322 $ 1.17
Transaction-related costs 3 0.01 3 0.01 6 0.02
Adjusted Net Income Attributable to PPG $ 312 $ 1.13 $ 16 $ 0.06 $ 328 $ 1.19
First Quarter 2014
Net Income Attributable to PPG as Reported $ 279 $ 0.99 $ 983 $ 3.49 $ 1,262 $ 4.48
Transaction-related costs 2 0.01 -- -- 2 0.01
Adjusted Net Income Attributable to PPG $ 281 $ 1.00 $ 983 $ 3.49 $ 1,264 $ 4.49
First Quarter 2013
Net Income Attributable to PPG as Reported $ 190 $ 0.64 $ 2,220 $ 7.51 $ 2,410 $ 8.15
Legacy pension costs 13 0.04 -- -- 13 0.04
Environmental costs 8 0.03 8 0.03
Transaction-related costs 5 0.01 -- -- 5 0.01
U.S. tax law change enacted in 2013 (10) (0.03) -- -- (10) (0.03)
Adjusted Net Income Attributable to PPG $ 206 $ 0.69 $ 2,220 $ 7.51 $ 2,426 $ 8.20
First Quarter 2012
Net Income/(Loss) Attributable to PPG as Reported $ (43) $ (0.14) $ 56 $ 0.18 $ 13 $ 0.04
Business restructuring 137 0.45 26 0.08 163 0.53
Environmental reserves 99 0.32 -- -- 99 0.32
Transaction-related costs 4 0.01 -- -- 4 0.01
Adjusted Net Income Attributable to PPG $ 197 $ 0.64 $ 82 $ 0.26 $ 279 $ 0.90
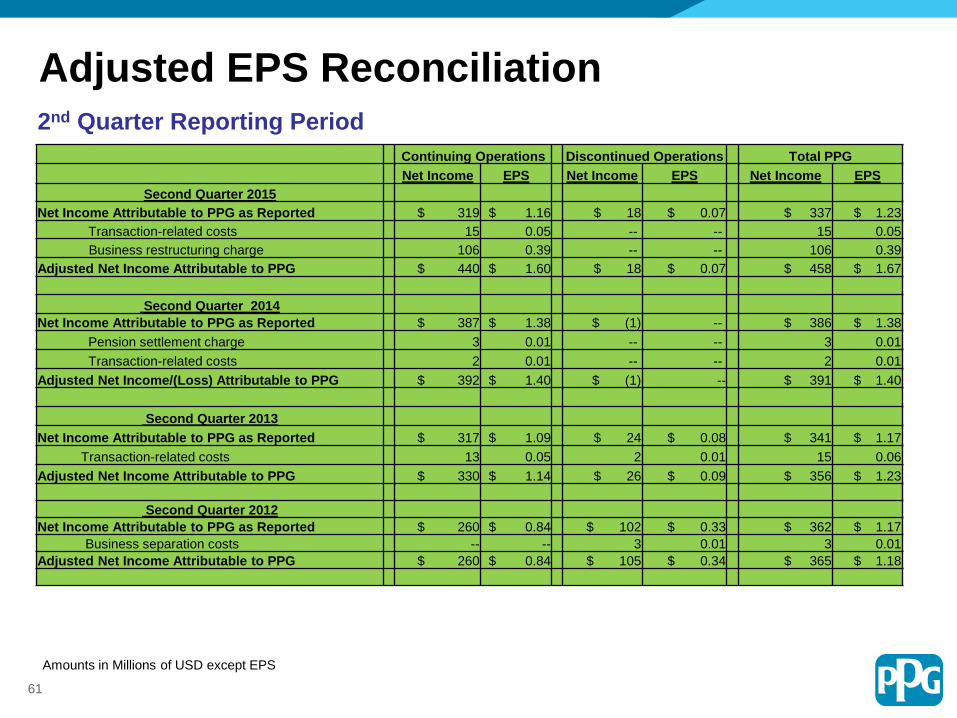
Continuing Operations Discontinued Operations Total PPG
Net Income EPS Net Income EPS Net Income EPS
Second Quarter 2015
Net Income Attributable to PPG as Reported $ 319 $ 1.16 $ 18 $ 0.07 $ 337 $ 1.23
Transaction-related costs 15 0.05 -- -- 15 0.05
Business restructuring charge 106 0.39 -- -- 106 0.39
Adjusted Net Income Attributable to PPG $ 440 $ 1.60 $ 18 $ 0.07 $ 458 $ 1.67
Second Quarter 2014
Net Income Attributable to PPG as Reported $ 387 $ 1.38 $ (1) -- $ 386 $ 1.38
Pension settlement charge 3 0.01 -- -- 3 0.01
Transaction-related costs 2 0.01 -- -- 2 0.01
Adjusted Net Income/(Loss) Attributable to PPG $ 392 $ 1.40 $ (1) -- $ 391 $ 1.40
Second Quarter 2013
Net Income Attributable to PPG as Reported $ 317 $ 1.09 $ 24 $ 0.08 $ 341 $ 1.17
Transaction-related costs 13 0.05 2 0.01 15 0.06
Adjusted Net Income Attributable to PPG $ 330 $ 1.14 $ 26 $ 0.09 $ 356 $ 1.23
Second Quarter 2012
Net Income Attributable to PPG as Reported $ 260 $ 0.84 $ 102 $ 0.33 $ 362 $ 1.17
Business separation costs -- -- 3 0.01 3 0.01
Adjusted Net Income Attributable to PPG $ 260 $ 0.84 $ 105 $ 0.34 $ 365 $ 1.18
2nd Quarter Reporting Period
Amounts in Millions of USD except EPS
Adjusted EPS Reconciliation
61
Amounts in Millions of USD except EPS
Continuing Operations Discontinued Operations Total PPG
Net Income EPS Net Income EPS Net Income EPS
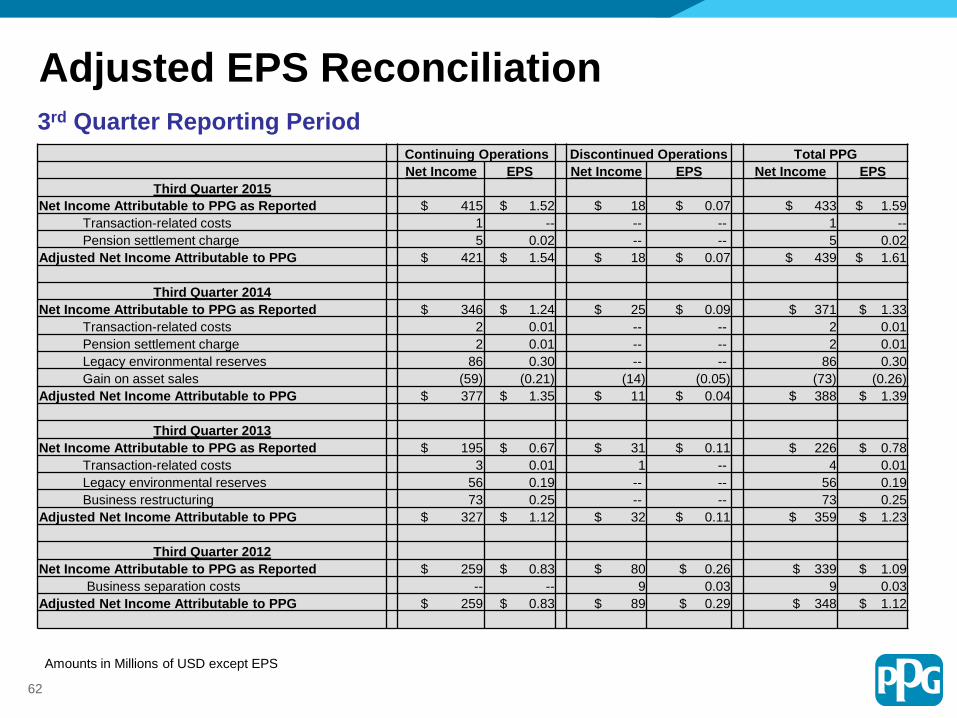
Third Quarter 2015
Net Income Attributable to PPG as Reported $ 415 $ 1.52 $ 18 $ 0.07 $ 433 $ 1.59
Transaction-related costs 1 -- -- -- 1 --
Pension settlement charge 5 0.02 -- -- 5 0.02
Adjusted Net Income Attributable to PPG $ 421 $ 1.54 $ 18 $ 0.07 $ 439 $ 1.61
Third Quarter 2014
Net Income Attributable to PPG as Reported $ 346 $ 1.24 $ 25 $ 0.09 $ 371 $ 1.33
Transaction-related costs 2 0.01 -- -- 2 0.01
Pension settlement charge 2 0.01 -- -- 2 0.01
Legacy environmental reserves 86 0.30 -- -- 86 0.30
Gain on asset sales (59) (0.21) (14) (0.05) (73) (0.26)
Adjusted Net Income Attributable to PPG $ 377 $ 1.35 $ 11 $ 0.04 $ 388 $ 1.39
Third Quarter 2013
Net Income Attributable to PPG as Reported $ 195 $ 0.67 $ 31 $ 0.11 $ 226 $ 0.78
Transaction-related costs 3 0.01 1 -- 4 0.01
Legacy environmental reserves 56 0.19 -- -- 56 0.19
Business restructuring 73 0.25 -- -- 73 0.25
Adjusted Net Income Attributable to PPG $ 327 $ 1.12 $ 32 $ 0.11 $ 359 $ 1.23
Third Quarter 2012
Net Income Attributable to PPG as Reported $ 259 $ 0.83 $ 80 $ 0.26 $ 339 $ 1.09
Business separation costs -- -- 9 0.03 9 0.03
Adjusted Net Income Attributable to PPG $ 259 $ 0.83 $ 89 $ 0.29 $ 348 $ 1.12
62
3rd Quarter Reporting Period
Adjusted EPS Reconciliation
63
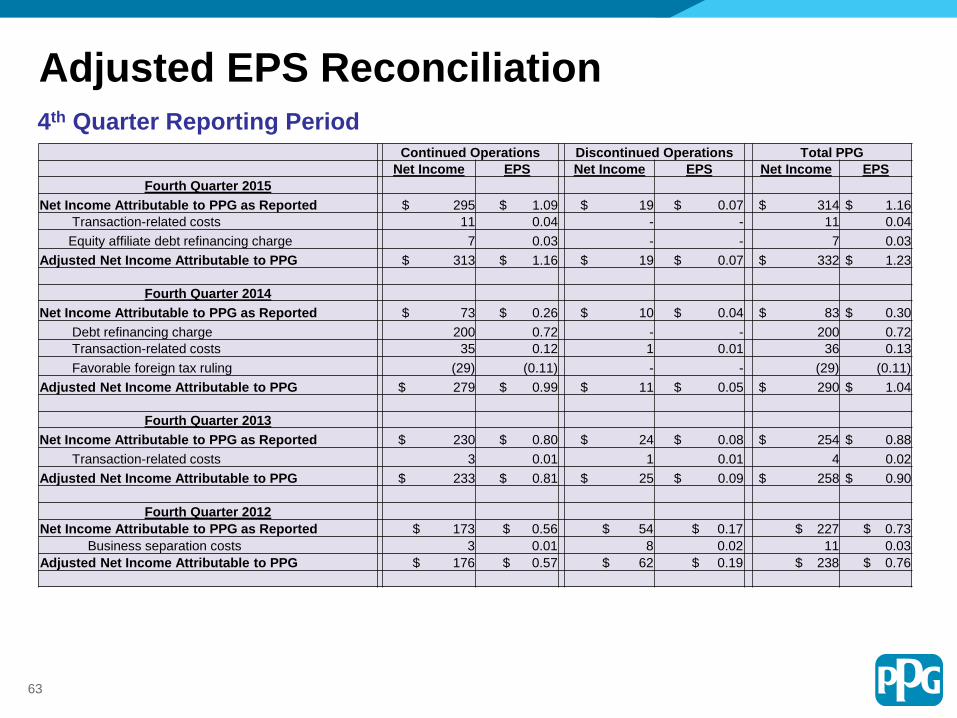
Continued Operations Discontinued Operations Total PPG
Net Income EPS Net Income EPS Net Income EPS
Fourth Quarter 2015
Net Income Attributable to PPG as Reported $ 295 $ 1.09 $ 19 $ 0.07 $ 314 $ 1.16
Transaction-related costs 11 0.04 - - 11 0.04
Equity affiliate debt refinancing charge 7 0.03 - - 7 0.03
Adjusted Net Income Attributable to PPG $ 313 $ 1.16 $ 19 $ 0.07 $ 332 $ 1.23
Fourth Quarter 2014
Net Income Attributable to PPG as Reported $ 73 $ 0.26 $ 10 $ 0.04 $ 83 $ 0.30
Debt refinancing charge 200 0.72 - - 200 0.72
Transaction-related costs 35 0.12 1 0.01 36 0.13
Favorable foreign tax ruling (29) (0.11) - - (29) (0.11)
Adjusted Net Income Attributable to PPG $ 279 $ 0.99 $ 11 $ 0.05 $ 290 $ 1.04
Fourth Quarter 2013
Net Income Attributable to PPG as Reported $ 230 $ 0.80 $ 24 $ 0.08 $ 254 $ 0.88
Transaction-related costs 3 0.01 1 0.01 4 0.02
Adjusted Net Income Attributable to PPG $ 233 $ 0.81 $ 25 $ 0.09 $ 258 $ 0.90
Fourth Quarter 2012
Net Income Attributable to PPG as Reported $ 173 $ 0.56 $ 54 $ 0.17 $ 227 $ 0.73
Business separation costs 3 0.01 8 0.02 11 0.03
Adjusted Net Income Attributable to PPG $ 176 $ 0.57 $ 62 $ 0.19 $ 238 $ 0.76
4th Quarter Reporting Period
Adjusted EPS Reconciliation
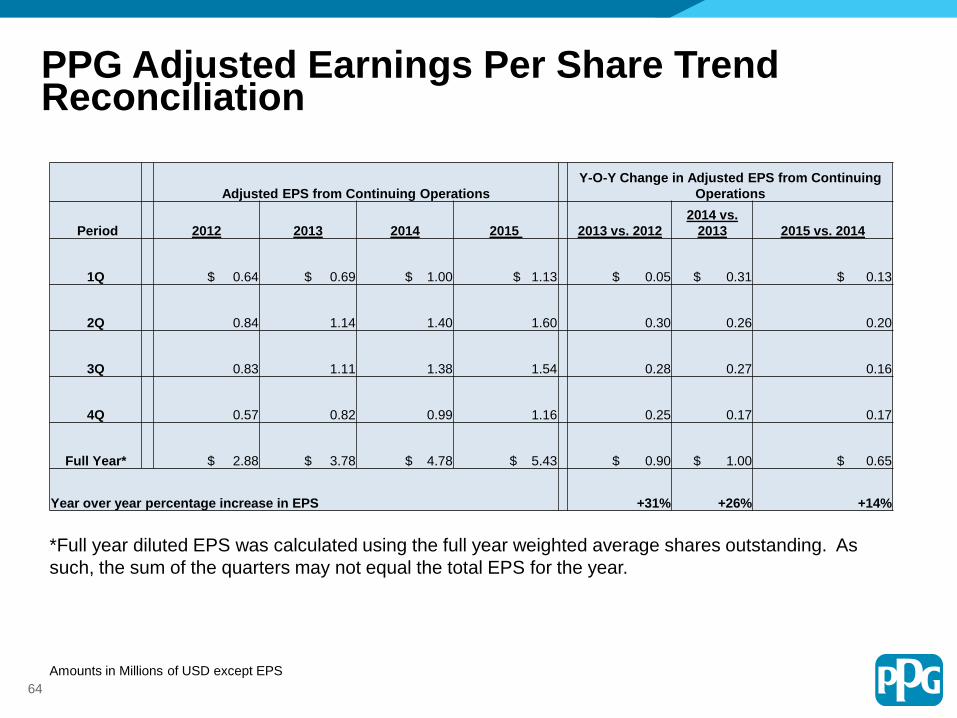
PPG Adjusted Earnings Per Share Trend Reconciliation
Amounts in Millions of USD except EPS
Adjusted EPS from Continuing Operations
Y-O-Y Change in Adjusted EPS from Continuing
Operations
Period 2012 2013 2014 2015 2013 vs. 2012
2014 vs.
2013 2015 vs. 2014
1Q $ 0.64 $ 0.69 $ 1.00 $ 1.13 $ 0.05 $ 0.31 $ 0.13
2Q 0.84 1.14 1.40 1.60 0.30 0.26 0.20
3Q 0.83 1.11 1.38 1.54 0.28 0.27 0.16
4Q 0.57 0.82 0.99 1.16 0.25 0.17 0.17
Full Year* $ 2.88 $ 3.78 $ 4.78 $ 5.43 $ 0.90 $ 1.00 $ 0.65
Year over year percentage increase in EPS +31% +26% +14%
*Full year diluted EPS was calculated using the full year weighted average shares outstanding. As
such, the sum of the quarters may not equal the total EPS for the year.
64
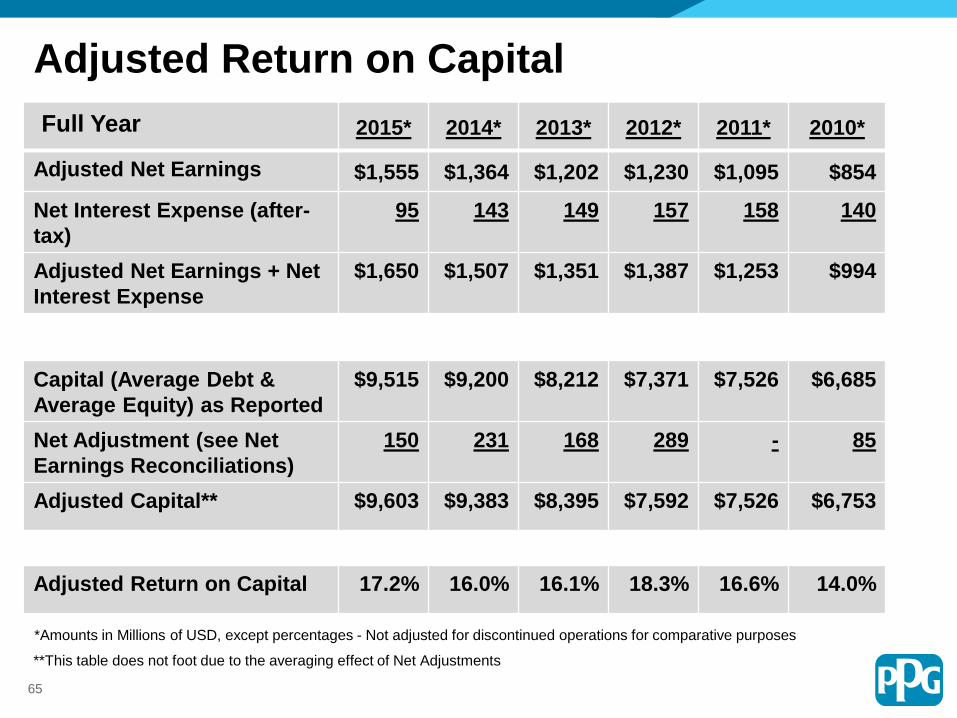
2015* 2014* 2013* 2012* 2011* 2010*
Adjusted Net Earnings $1,555 $1,364 $1,202 $1,230 $1,095 $854
Net Interest Expense (after-
tax)
95 143 149 157 158 140
Adjusted Net Earnings + Net
Interest Expense
$1,650 $1,507 $1,351 $1,387 $1,253 $994
Capital (Average Debt &
Average Equity) as Reported
$9,515 $9,200 $8,212 $7,371 $7,526 $6,685
Net Adjustment (see Net
Earnings Reconciliations)
150 231 168 289 - 85
Adjusted Capital** $9,603 $9,383 $8,395 $7,592 $7,526 $6,753
Adjusted Return on Capital 17.2% 16.0% 16.1% 18.3% 16.6% 14.0%
Adjusted Return on Capital
Full Year
**This table does not foot due to the averaging effect of Net Adjustments
65
*Amounts in Millions of USD, except percentages - Not adjusted for discontinued operations for comparative purposes
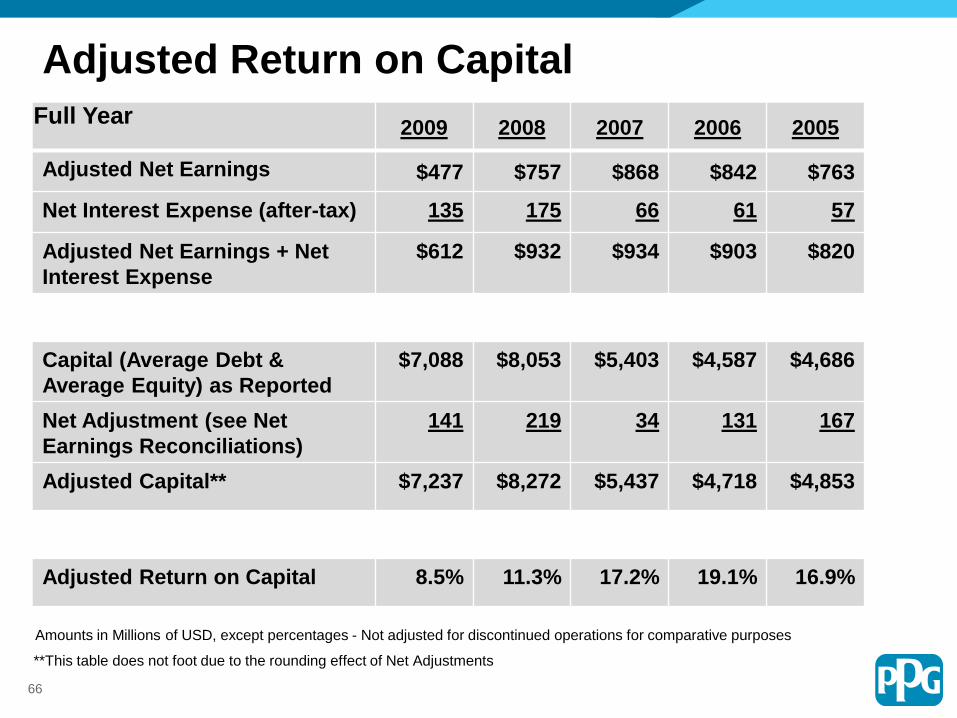
2009 2008 2007 2006 2005
Adjusted Net Earnings $477 $757 $868 $842 $763
Net Interest Expense (after-tax) 135 175 66 61 57
Adjusted Net Earnings + Net
Interest Expense
$612 $932 $934 $903 $820
Capital (Average Debt &
Average Equity) as Reported
$7,088 $8,053 $5,403 $4,587 $4,686
Net Adjustment (see Net
Earnings Reconciliations)
141 219 34 131 167
Adjusted Capital** $7,237 $8,272 $5,437 $4,718 $4,853
Adjusted Return on Capital 8.5% 11.3% 17.2% 19.1% 16.9%
Adjusted Return on Capital
Full Year
Amounts in Millions of USD, except percentages - Not adjusted for discontinued operations for comparative purposes
**This table does not foot due to the rounding effect of Net Adjustments
66
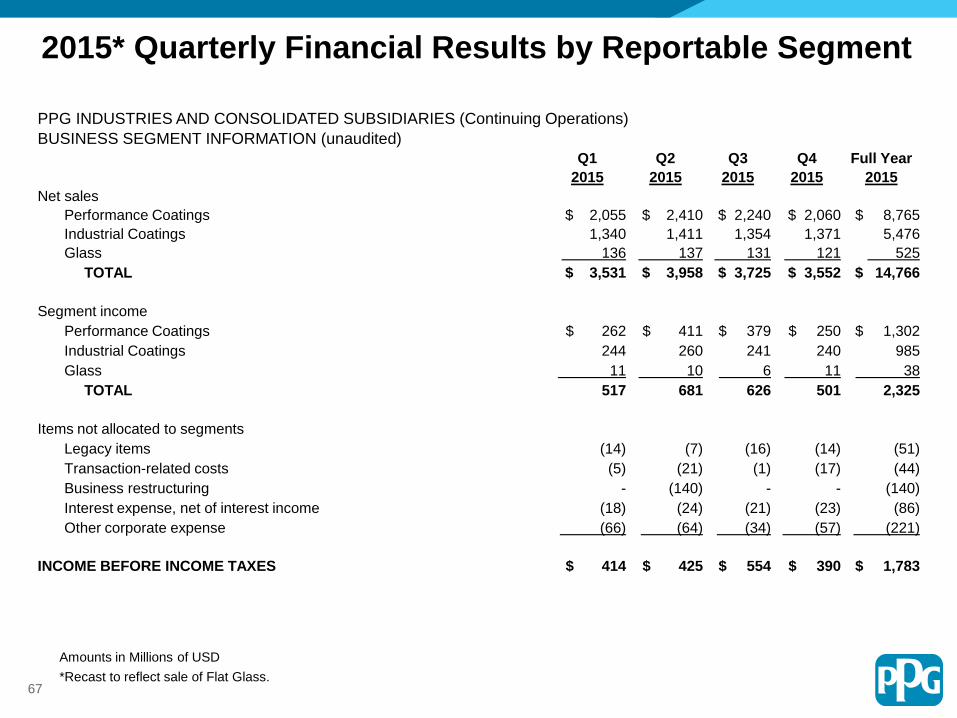
2015* Quarterly Financial Results by Reportable Segment
PPG INDUSTRIES AND CONSOLIDATED SUBSIDIARIES (Continuing Operations)
BUSINESS SEGMENT INFORMATION (unaudited)
Q1 Q2 Q3 Q4 Full Year
2015 2015 2015 2015 2015
Net sales
Performance Coatings $ 2,055 $ 2,410 $ 2,240 $ 2,060 $ 8,765
Industrial Coatings 1,340 1,411 1,354 1,371 5,476
Glass 136 137 131 121 525
TOTAL $ 3,531 $ 3,958 $ 3,725 $ 3,552 $ 14,766
Segment income
Performance Coatings $ 262 $ 411 $ 379 $ 250 $ 1,302
Industrial Coatings 244 260 241 240 985
Glass 11 10 6 11 38
TOTAL 517 681 626 501 2,325
Items not allocated to segments
Legacy items (14) (7) (16) (14) (51)
Transaction-related costs (5) (21) (1) (17) (44)
Business restructuring - (140) - - (140)
Interest expense, net of interest income (18) (24) (21) (23) (86)
Other corporate expense (66) (64) (34) (57) (221)
INCOME BEFORE INCOME TAXES $ 414 $ 425 $ 554 $ 390 $ 1,783
Amounts in Millions of USD
67*Recast to reflect sale of Flat Glass.
www.ppg.com
Thank you for your interest in PPG
Industries, Inc.
Contact Information:
Investors:
Scott Minder
(412) 434-3466
68

70
Notes

71
Notes