Embed Size (px)
Citation preview

APN031
Double Wall Ring Geometry to Measure Interfa-
cial Rheological Properties
1 APN031 V1
the interface, for example, the canal surface
and deep channel surface viscometers [2],
disk and bi-cone rheo-meters [3] and the
magnetic rod rheometer [4].
Recently several devices to study the in-
terfacial rheological properties to be used in
conjunction with rotational rheometers have
been suggested. The most common ones are
the bi-cone/disc [5] and the Du Noüy ring.
These devices are robust and relatively easy
to use, but they have their limitations. The
bi-cone and disc geometries can be used for
viscous and elastic interfaces, but the sensi-
tivity is limited because of the large area in
contact with the bulk fluid relative with the
perimeter in contact with the interface. The
Du Noüy ring, originally developed for sur-
face tension measurements does not fulfill
all the requirements for shear measure-
ments. Despite the sensitivity due to the re-
Aly Franck, TA Instruments, Germany
Keywords: Double Wall Ring DWR, interfacial Rheology, surfactants
INTRODUCTION
The interfacial shear rheology of thin lay-
ers at liquid-liquid or liquid-gas interfaces
has been a subject of increased interest for
many years. The research has been motivat-
ed by the need to understand the effect of
particles, surfactants or proteins at these
interfaces in a variety of industries such as
food, biomedical, enhanced oil recovery
and so forth. Interfacial shear rheometry
measures the mechanical strength or the
shear viscosity of an interfacial layer i.e. the
adsorbed monomolecular film at a liquid-
liquid or liquid-gas interface. Typical inter-
facial viscosities for insoluble monomolec-
ular films range from 10-5 to 10-2 Pa.s.m. A
number of methods have been developed to
investigate the surface and interfacial shear
properties [1]. Often, custom made devices
have been built to measure the properties of
ABSTRACT
The rheological characterization of thin liquid layers at interfaces is motivated by their intensive use in a variety of industries, ranging from enhanced oil recovery, food technology to biomedical applications. The most used devices for measuring interfacial properties that can be attached to a commercial rheometer are the Du Noüy ring, disc and bi-cone geometry. The Du Noüy ring is only suitable for purely viscous interfaces. The bi-cone and disc geometries can be used for viscous and viscoelastic interfaces, but the sensitivity is limited because these device intrinsically posses a large area in contact with the bulk fluids. A new double-wall ring geometry to be used with a standard rotational rheometer has been developed. It has the advantages of a good intrinsic sensitivity due to a small area in contact with the bulk phase and well defined flow fields that enable bulk and surface contributions to be separated. The double-wall ring geometry has a square edged cross-section and is used with a temperature controlled bottom circular channel arrangement to contain the fluid. Results on model interfaces show that the new geometry is able to measure viscous as well as visco-elastic interfaces in both continuous and oscillatory shear experiments.

2 APN0031 V1
duced geometry surface exposed to the sub
phase, does the Du Noüy ring have a num-
ber of issues. For example the small gap
assumption is not fulfilled and the contribu-
tion of the surface inside of the ring is not
taken into account. The round cross-section
of the ring is not ideal for pinning the inter-
face, the interface can easily slip over the
ring, avoiding coupling.
THE DOUBLE WALL RING (DWR)
The double wall ring (DWR) geometry
shown in figure 1 is a result of combining
the best features of both, the Du Noüy ring
and the bi-cone. The round shape has been
replaced with a square edged cross-section
to improve the ability to pin the interface.
The diameter of the ring has been enlarged
to increase the torque i.e. sensitivity. The
undefined torque contributions of the inter-
face inside of the ring have been eliminated
by adopting a 2D double wall configuration
[6]. This is accomplished by replacing the
bottom cup with a circular channel contain-
ing the fluid. The ring is made of Pt/Ir and
the circular channel of Delrin®, a material
similar to Teflon. A step in the vertical
walls of the channel, machined at the height
of the sub-phase fluid level allows pinning
of the interface – thus reducing the menis-
cus effect of the fluid at the wall.
Figure 1: Schematic representation of the DWR con-figuration
R1 R2 R3 R4 a b
mm mm mm mm mm mm
31.00 34.00 35.50 39.50 1.00 0.70
Table 1: Physical dimensions of the DWR geometry.
Figure 2: DWR setup on the rheometers from TA Instruments. a) DHR b) ARES-G2

3 APN0031 V1
The new DWR geometry can be mounted
onto CMT (combined motor transducer) as
well as on SMT (separate motor transducer)
rheometers from TA Instruments (Fig. 2).
On the CMT rheometer, the ring is rotating/
oscillating, on the SMT the outer cup is ro-
tating/oscillating whereas the ring is at-
tached to a separate torque transducer. The
trough with the circular channel is attached
to the Peltier plate for the DHR (Fig. 2a))
and to the APS for the ARES-G2 (Fig. 2b)).
Furthermore do all features and capabilities
of CMT and SMT rheometers apply to the
2D rheometry.
The ratio of outer and inner radius of the
DWR is δ=1.11. Under these conditions a
more or less uniform shear rate can be as-
sumed. The ISO standard for concentric
cylinder system (bulk rheology) state a ratio
δ=Ra/Ri of 1.0847. The equations for the
stress and strain constants are adopted from
the double wall cylinder geometry.
The dimensions of the DWR geometry,
given in Table 1 are chosen such that the
average shear rate of the inner and outer
shear sections are the same.
SUB-PHASE CORRECTION
Results from interfacial shear measure-
ments are always overestimated due to the
fact that the interfacial film drags the sub-
phase along. The relative contributions of
the surface stress and the stress arising from
the bulk are expressed by the Boussinesq
number:
Bo=ηs/(ηL)
ηs is the surface viscosity, η the bulk vis-
cosity and L is a length scale associated
with the measurement technique. For the
DWR, L is 0.7mm, which corresponds to
the side length of the square ring.
Because of the very small contact area
geometry/sub-phase of the DWR, the meas-
ured torque contributions of the sub-phase
are considerably reduced, such that correc-
tions for sub-phase are only necessary for
sensitive and fragile interfaces [7]. The sub-
phase drag correction is based on a finite
difference calculation. The velocity profiles
in the sub-phase can be determined using
the Navier Stokes equation. In cylindrical
coordinates (R,θ, z) they can expressed as
follows [7]:
νsp(r,z) is the unknown sub-phase velocity
( )
2 2
32
1 4
2 2
2 3
1 1
1 1
1
2
KRR
R R
KL R R
γ
τπ
= +
− −
=+
( )subphasev ring R wθ = ⋅
0
0 0
( )
subphase
i t
v ring
R i e
θ
ωθ ω ⋅ ⋅= ⋅ ⋅ ⋅ ⋅
(31, ) 0
(39.5, ) 0
( ,10) 0
subphase
subphase
subphase
v z
v z
v r
θ
θ
θ
=
=
=R4
R3
R2
R1
a d z
R
Figure 3: Layout of the DWR geometry and boundary conditions for the sub-phase velocities
( )( ) ( )
( )t
zrv
z
zrvzrrv
rrr
sp
sp
spsp
∂
∂=
∂
∂+
∂
∂
∂
∂
,
,,
12
2
ρ
η

4 APN0031 V1
in θ direction. For a continuous shear ex-
periment, the velocity is the product of the
parameter asp and the angular velocity, for
the oscillation shear experiment asp is multi-
plied with a sinusoidal oscillating velocity.
The boundary conditions for the sub-
phase velocities for the DWR setup at the
ring and at the wall/bottom of the circular
channel are shown in figure 3.
In order to solve the equations for the un-
known velocity, the momentum balance at
the interface needs to be established. This
momentum balance takes into account a
linear model for the surface stress tensor
according to Boussinesq [8]. The stress
condition at the interface reduces to [3]:
In the calculations only the interfacial
shear viscosity vs ( not the dilatational) is
taken into account. The interfacial viscosity
is a complex number ηi=η’-iη” in oscilla-
tion experiments. The determination of the
corrected interfacial viscosity is based on an
iterative approach. With the measured inter-
facial viscosity as starting value, the veloci-
ty field at the interface is calculated using
the finite difference approach. Based on the
velocity profile, the theoretical rheometer
torque, consisting of bulk and surface con-
tributions is evaluated. The theoretical
torque value is compared with the measured
torque value and a new interfacial viscosity
is estimated according to:
The iteration process continues until the
measured and the theoretical torque con-
verge. The algorithm stops after a certain
number of iterations or after a tolerance val-
ue has been obtained.
EXPERIMENTAL
Performance check
In order to check the sensitivity of the
DWR, the viscosities of ultrathin oil films,
spread on the water surface are measured
[7]. The oil is spread onto purified water by
gently depositing a drop of high viscosity
oil. The bulk viscosity of the oil used is 10
Pa.s. The theoretical interfacial viscosity for
the films is obtained by multiplying the
bulk viscosity with the film thickness. Tests
on film thicknesses of 9, 5.4 and 0.39 mi-
cron have been performed. The experi-
mental results were measured over a range
of shear rates from 0.1 to 10 1/s. In figure 4
the dashed lines represent the theoretical
values, the symbols the raw and corrected
data points. The lowest interfacial viscosity
that could be measured was of the order of
4x10⁻⁶ Pa.s.m (Bo=2.8), which corresponds
( ) ( )
1
,
measured
k k
calculated k
M
M
σ ση η+ = ⋅
Figure 4: Experimental verification of the DWR sensi-tivity using ultrathin oil films. Raw and sub-phase
Figure 5: Strain sweep for a TTAB/NaSal film at the interface between water and n-decane (c=0.0024M, T=20oC)
ti
oospsp
spsp
oeizrazrv
zrazrv
ωωθ −=
Ω=
),(),(
),(),(
( )
∂
∂
∂
∂=
∂
∂),(
1),(zrrv
rrrz
zrvs
b
ssp
η
η

5 APN0031 V1
to a torque of approx. 60nN.m at 1 1/s.
Materials and Test procedures
The performance of the DWR will be
demonstrated measuring the interfacial
shear properties of 2 series of surfactant
molecules TTAB (tetradecyltri-methyl-
ammonium bromide), CTAB (Cetyltrimetyl
-ammonimum bromide) and SPAN65®
(Sorbitan tristearate) at the water-air and
water-decane interface.
TTAB and CTAB are relatively short mol-
ecules and are soluble in water. A 0.01M
CTAB and 0.0024M TTAB/NaSal aqueous
solutions were used in this investigation.
SPAN is a much larger molecule and pro-
vides strong films with pronounced viscoe-
lastic behavior at the water-oil interface. A
0.5mM solution of Span65 in dodecane was
used to build the interfdace at the water-
dodecane interface. A 1mM Span solution
in chloroform was used to spread the SPAN
molecules at the water-air interface.
The water was obtained from a pure water
system (Milli-Q Integral 3). The trough
with the circular channel and the ring were
carefully rinsed with purified water before
each experiment. The ring was heated up
red hot with a torch to remove all organic
residues.
To load the sample the following general
procedure was followed:
1. First the dense phase, water with or
without the active ingredient is
filled into the bottom channel up to
the mark i.e. step in the wall.
2. If the ingredient has not been added
to the water phase, it can be spread
on the surface (with a solvent) for
water-gas interfaces
3. Next the DWR was set at the inter-
face
4. Last the oil phase was added for
testing at water-oil interfaces (with
the ingredient if not already added
to the water phase)
The Delrin® through is mounted on the
Peltier environmental system of the rheom-
eter. The temperature was held at 20oC dur-
ing all experiments.
RESULTS
TTAB and CTAB
The 0.0024M TTAB/NaSal solution was
filled into the trough, the ring set at the in-
terface and n-decane gently deposited on
top of the water phase. All experiments on
TTAB were performed on the AR-G2.
The first experiment performed in the se-
ries is a strain sweep at 1 rad/s to detect the
sensitivity limit and the extend of the linear
viscoelastic range (Fig.5).
TTAB builds an elastic interface with a
storage modulus ~ 40 times higher than the
loss modulus at a frequency of 1 rad/s. The
Figure 6: Frequency sweep for a TTAB/NaSal film at the interface between water and n-decane (c=0.0024M, T=20oC) a) G’s and torque b) G’. G” and raw phase

6 APN0031 V1
interfacial modulus G’ has a value of 2x10⁻⁴
N/m and could be accurately measured
down to 0.005 strain units. The correspond-
ing torque value at this strain is on the order
of 3 nN.m. The onset of non linear viscoe-
lastic behavior is found at 10% strain.
Figure 7: Polar representation of the torque vector for the frequency data in Figure 6.
The next experiment consists of 5 consec-
utive frequency sweeps between 1 and 10%
strain, performed on the same sample. The
first run (Fig.6) is completely dominated by
inertia, the torque changes with frequency
squared (~ω2). At low frequency the modu-
lus is approaching zero. The second run
gave the same response in the inertia domi-
nated region, however at frequencies below
1 rad/s a plateau value at 10-4 is obtained.
For the 3rd to the 5th run, a plateau estab-
lished at a level of 4x10⁻⁴ N/m. As time pro-
gresses the interface builds up slowly to
reach a equilibrium after the 3rd run. Note,
that the torque amplitude (magnitude) drops
significantly at a frequency of ~ 1rad/s. The
drop of the torque correlates with a step
change of the raw phase from 0o at low fre-
quency to 180o at high frequency (Fig. 6b)).
At a raw phase of 180o, the results are dom-
inated by the system inertia, only below a
frequency of ~ 1rad/s do the measured re-
sults describe the material response at the
interface.
With increasing strength of the interface,
the inertia dominated region moves to high-
er frequencies. For the actual setup the
maximum test frequency is between 1 and 2
rad/s.
Figure 8: Strain and frequency sweep for the CTAB film at the interface between water and n-decane (c=0.01M, T=20oC)
The torque minimum at the onset of the
inertia dominated region can easily be ex-
plained when representing the torque
(stress) magnitude as a function of the raw
phase in a polar plot (Fig.7). Since the inter-
face is predominately elastic at all frequen-
cies, the transition from the system inertia
dominated to the material elasticity domi-
nated regime, shows a straight line in the
polar representation. At a raw phase of 90o
Figure 9: Strain sweep for a film of SPAN65® at the interface between water and dodecane (c=0.5mM, T=20oC)

7 APN0031 V1
the magnitude of the torque vector is mini-
mum i.e. very close to zero; inertia and
elasticity contributions cancel out.
The same series of tests was performed on
a 0.01M solution of CTAB, however with-
out any addition of Sodium salicylate Na-
Sal. The strain sweep is similar to the one
for TTAB/NaSal. The ratio G”/G’ is small-
er whereas the interfacial storage modulus
in the linear region is approximately the
same (Fig.8). The storage modulus is inde-
pendent of frequency, the interface builds
instantaneously and no time effects could
be measured. The modulus value for
G’ (4x10⁻⁴ Pa.m) was obtained on the same
sample on five consecutive frequency
sweeps performed with a strain from 0.1 to
10%.
SPAN65® at the water/air and water/
dodecane interface
The second series of experiments was per-
formed with the surfactant, Span65®.
Span65® is a larger and more complex mol-
ecule and is not a linear chain. Experiments
at the water dodecane interface were per-
formed with the ARES-G2.
The strain sweep performed on a film of
SPAN 65® at the water/dodecane interface
exhibits a response, seen for many bulk ma-
terials (Fig.9). The onset of the non-linear
behavior is around 0.1% strain and the in-
terfacial loss modulus goes through a maxi-
mum before decreasing along with G’ in the
Figure 10: Frequency sweep for a film of SPAN65® at the interface between water and dodecane
non linear region. This behavior is typical
in bulk materials for gel-like materials. The
maximum in G” is attributed to dissipative
structure arrangements at the on-set of non-
linear behavior [9]. In addition to the funda-
mental response, the intensities of the odd
harmonic contributions have been meas-
ured. The 3rd relative harmonic intensity
emerges from the noise at the onset of non-
linear behavior. At large strain the harmon-
ic intensities I3/1, I5/1, I7/1 and I9/1 reach a
plateau value. This behavior is similar to
the bulk response seen for viscoelastic ma-
terials. The frequency sweep, performed in
the linear region at 0.1% strain shows a typ-
ical viscoelastic response with a cross over
point at 0.2 rad/s (Fig.10).
Steady state flow experiments have been
performed by ramping the shear rate loga-
Figure 11: Flow ramp (Up and down) after pre-shear and after 1 hour equilibrium. The green stars are stedy state values from stress growth experiments (Figure 12)
Figure 12: Stress growth experiments in the range of shear rates from 0.0001 to 10 1/s for a film of SPAN65® at the interface between water and dodec-ane (c=0.5mM, T=20oC)
8 APN0031 V1
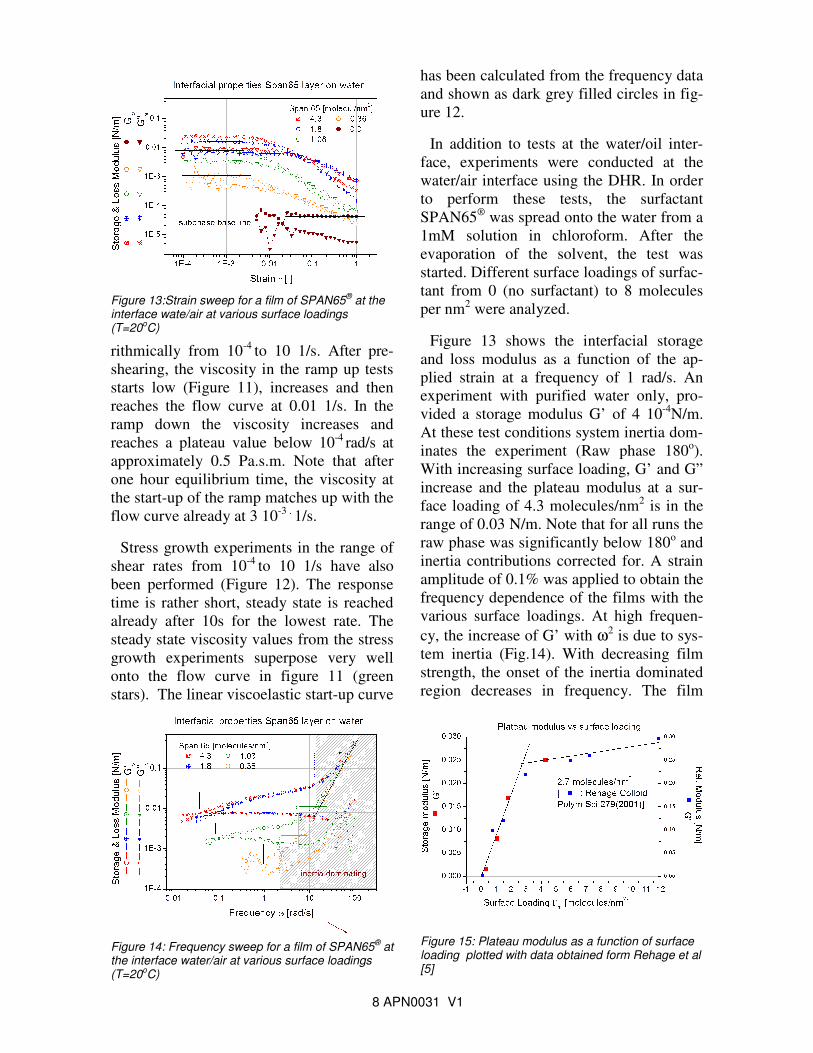
Figure 13:Strain sweep for a film of SPAN65® at the interface wate/air at various surface loadings (T=20oC)
Figure 14: Frequency sweep for a film of SPAN65® at the interface water/air at various surface loadings (T=20oC)
rithmically from 10-4 to 10 1/s. After pre-
shearing, the viscosity in the ramp up tests
starts low (Figure 11), increases and then
reaches the flow curve at 0.01 1/s. In the
ramp down the viscosity increases and
reaches a plateau value below 10-4 rad/s at
approximately 0.5 Pa.s.m. Note that after
one hour equilibrium time, the viscosity at
the start-up of the ramp matches up with the
flow curve already at 3 10-3 . 1/s.
Stress growth experiments in the range of
shear rates from 10-4 to 10 1/s have also
been performed (Figure 12). The response
time is rather short, steady state is reached
already after 10s for the lowest rate. The
steady state viscosity values from the stress
growth experiments superpose very well
onto the flow curve in figure 11 (green
stars). The linear viscoelastic start-up curve
Figure 15: Plateau modulus as a function of surface loading plotted with data obtained form Rehage et al [5]
has been calculated from the frequency data
and shown as dark grey filled circles in fig-
ure 12.
In addition to tests at the water/oil inter-
face, experiments were conducted at the
water/air interface using the DHR. In order
to perform these tests, the surfactant
SPAN65® was spread onto the water from a
1mM solution in chloroform. After the
evaporation of the solvent, the test was
started. Different surface loadings of surfac-
tant from 0 (no surfactant) to 8 molecules
per nm2 were analyzed.
Figure 13 shows the interfacial storage
and loss modulus as a function of the ap-
plied strain at a frequency of 1 rad/s. An
experiment with purified water only, pro-
vided a storage modulus G’ of 4 10-4N/m.
At these test conditions system inertia dom-
inates the experiment (Raw phase 180o).
With increasing surface loading, G’ and G”
increase and the plateau modulus at a sur-
face loading of 4.3 molecules/nm2 is in the
range of 0.03 N/m. Note that for all runs the
raw phase was significantly below 180o and
inertia contributions corrected for. A strain
amplitude of 0.1% was applied to obtain the
frequency dependence of the films with the
various surface loadings. At high frequen-
cy, the increase of G’ with ω2 is due to sys-
tem inertia (Fig.14). With decreasing film
strength, the onset of the inertia dominated
region decreases in frequency. The film

9 APN0031 V1
Figure 16: Continuous shear curves as a function of the shear rate for a film of SPAN65® at the interface
with the lowest surface loading of
SPAN65® has a modulus in the proximity
of 5x10⁻⁴ N/m. The measured torque in this
region is below 10 nNm. With increasing
surface loading G’ and G” increase, the
cross over point is shifting to lower fre-
quency.
The results of the storage modulus in the
plateau region are plotted versus the surface
loading and compared with results obtained
by Rehage et al.[15] (Fig. 13). Below a sur-
face loading of 2.7 molecules/nm2, a mono
layer film can be assumed. At higher load-
ing multilayer films are forming and the
elastic modulus is much less sensitive to the
loading in this region. Continuous shear
experiments were also conducted on the
SPAN65® films at various surface loadings.
The layers show significant shear thinning
as expected (Fig.16). Sub phase correction
becomes important below an interfacial vis-
cosity of 10-5 Pa.s.m.
CONCLUSIONS
A new attachment to commercial rheome-
ters for measuring the interfacial shear
properties at water-air and water-oil inter-
faces has been presented. The setup consists
of a double wall ring and incorporates the
advantages of both, Du Noüy ring and bi-
cone. Due to the reduced contact area be-
tween the bulk phase and the geometry, the
subphase torque contributions are signifi-
cantly reduced. Subphase corrections are
only necessary for very fragile interfaces
with interfacial viscosities below 10e-5
Pa.s.m.
Test results in oscillatory shear have been
presented for two surfactant materials,
CTAB and SPAN. Whereas CTAB builds
highly elastic interfaces at the water-n-
decane interface, do interfacial films of
SPAN give a typical viscoelastic response.
An important consideration when using the
new attachment on CMT (stress controlled
rheometers) with no separate torque meas-
urement is the system inertia, which can
mask the real material behavior at frequen-
cies above 1 rad/s, depending on the experi-
mental setup.
REFERENCES
[1] Warburton B. “Interfacial rheology” in
Collyer A.A and Clegg D.W. Rheological
measurements, Chapman and Hall (1998),
723-752
[2] Myers R.J. and Harkins W.D. J. Chem.
Phys. 5, (1937)601
[3] Oh S.G. and Slattery J.C.. Journal of
Colloid and Interface Science 67 (1978)
516-525
[4]. Brooks C.F., Fuller G.G., Frank C.W.
and Robertson C.R. Langmuir 15 (1999)
4367-4373
[5] Erni P. et al. Review of Scientific
Instruments 74 (2003) 4916-4924
[6] Franck A.; Vermant J.; Fuller G.G;
System and Method for Interfacial
Rheometry; US #7,926,326. (2011)
[7] Vandebril S. and Vermant J. Paper
presented at AERC 2009 in Cardiff
[8] Boussinesq, J., C.R. Hebd. Seances
Acad. Sci. 156, 983, 1035, 1124 (1913)
[9] H.G. Sim, K.H. Ahn, S.J. Lee. J. Rheol. 47
(4), 879-895 (2003)
[10] Rehage H. et al. Colloid Polym Sci 279
(2001) 597-606