Embed Size (px)
Citation preview
2033-8
Joint ICTP/IAEA Advanced School on Dosimetry in DiagnosticRadiology and its Clinical Implementation
Renato Padovani
11 - 15 May 2009
EFOMP
Dosimetry in Interventional Radiology
IAEAInternational Atomic Energy Agency
Dosimetry in interventional radiology
Renato PadovaniMedical Physics Department
University Hospital, Udine, Italy
Joint ICTP-IAEA Advanced school on Dosimetry in Diagnostic Radiology: And its Clinical Implementation
11 - 15 May 2009; Miramare, Trieste, Italy
IAEA 2
Introduction
• Introduction to interventional radiology• Dosimetry in IR
• Code of Practice• Skin dosimetry methods
IAEA 3
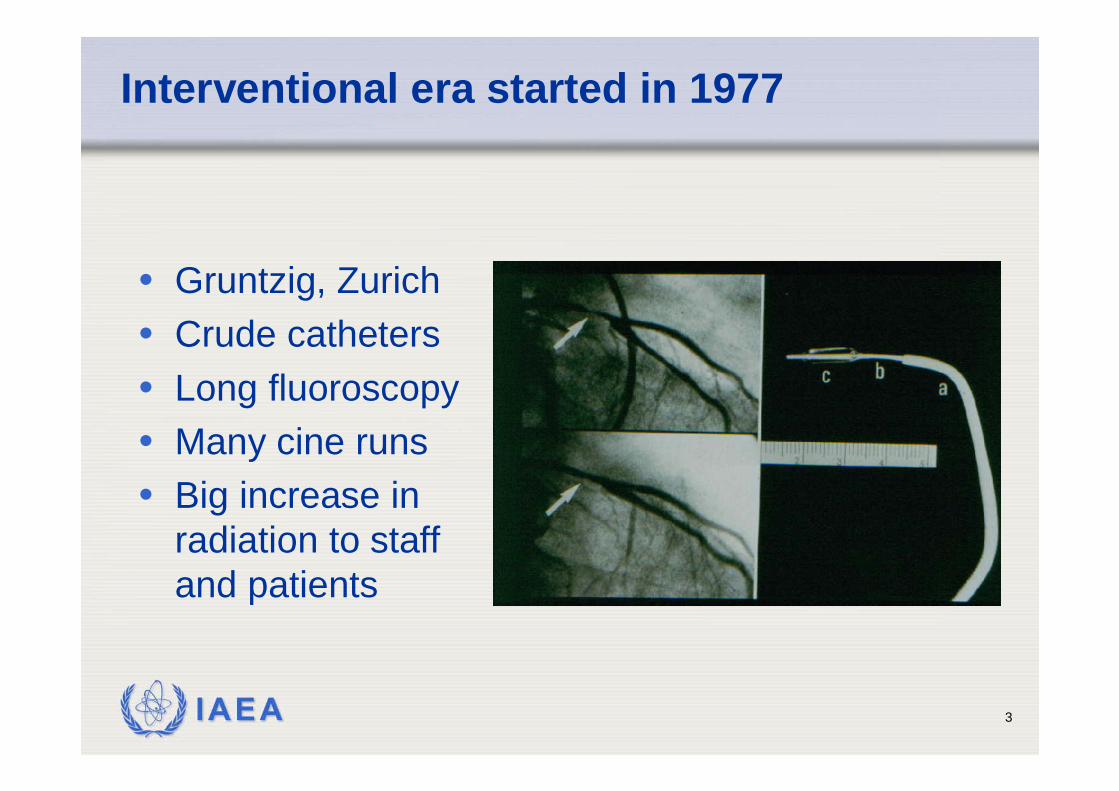
Interventional era started in 1977
• Gruntzig, Zurich• Crude catheters• Long fluoroscopy• Many cine runs• Big increase in
radiation to staff and patients
IAEA 4
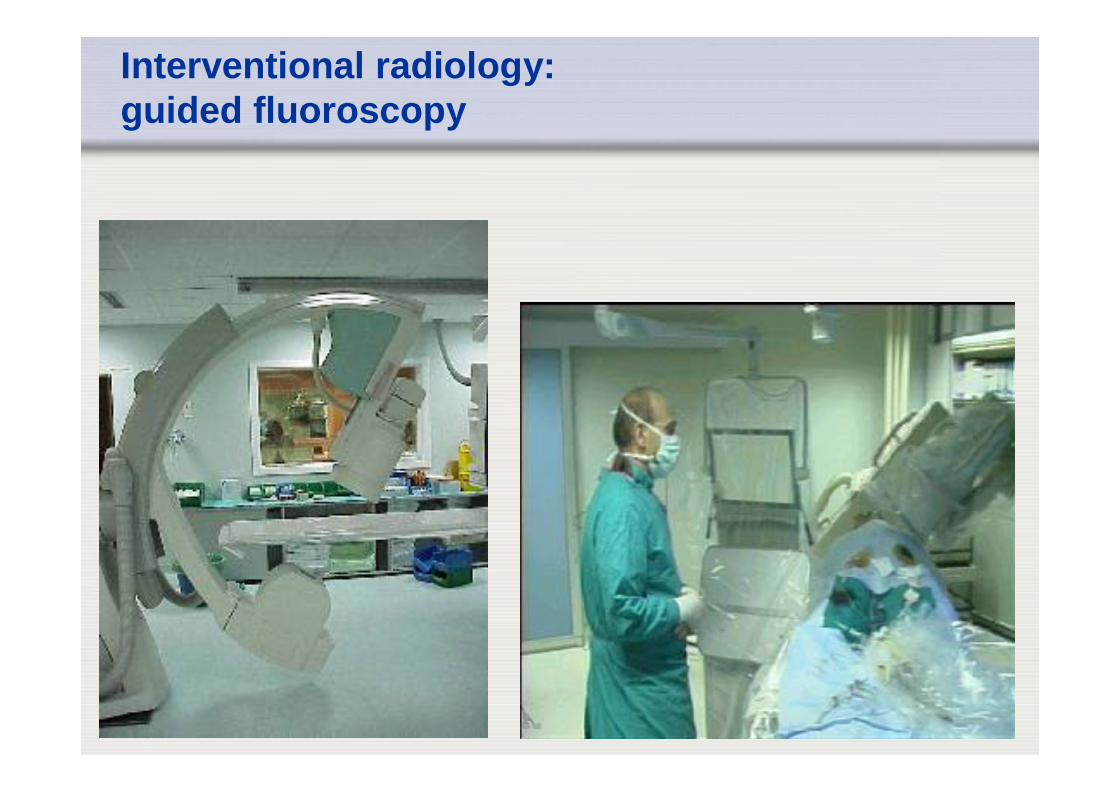
Interventional radiology: guided fluoroscopy
IAEA 5
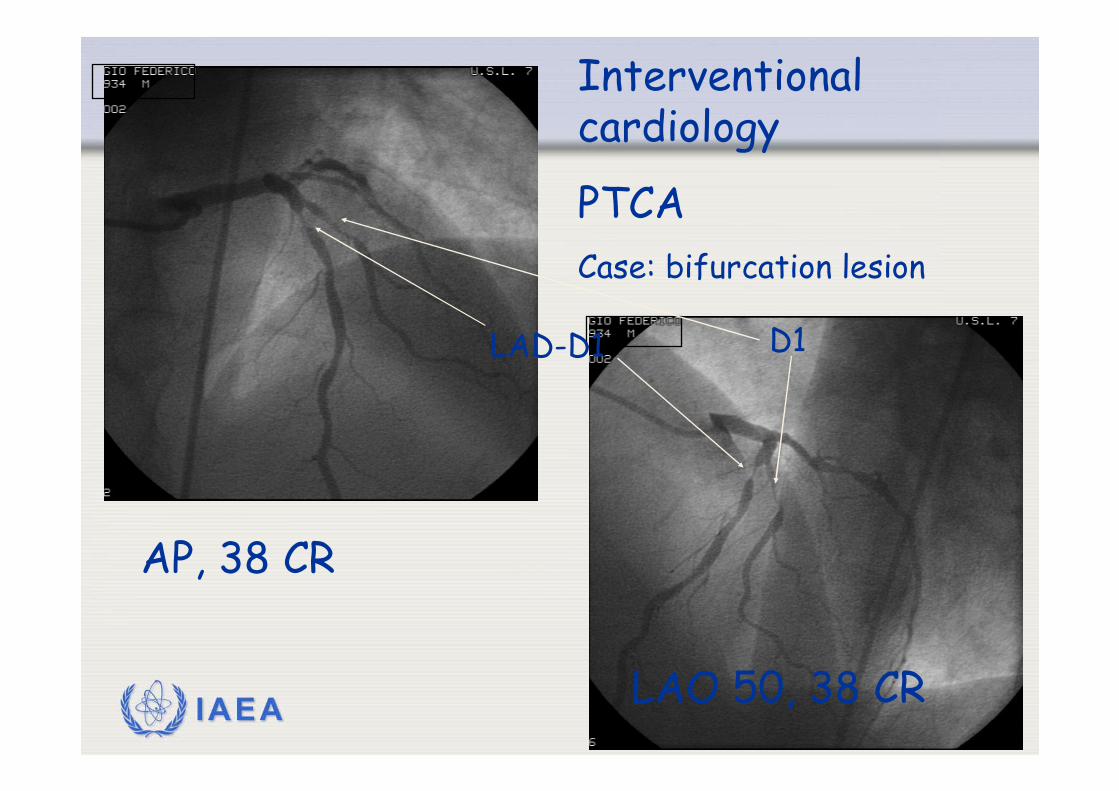
Interventional cardiology
PTCACase: bifurcation lesion
AP, 38 CR
LAD-D1
LAO 50, 38 CR
D1
IAEA 6
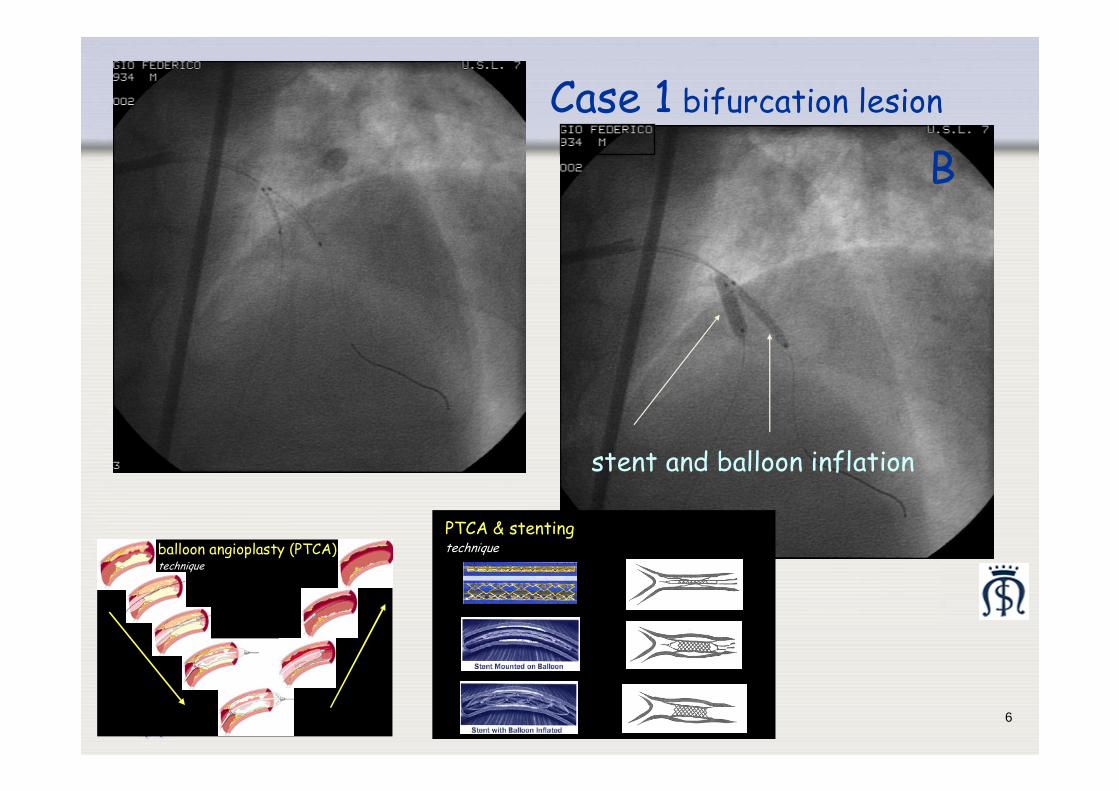
Case 1 bifurcation lesion
A
stent and balloon inflation
B
balloon angioplasty (PTCA)technique
PTCA & stentingtechnique
IAEA 7
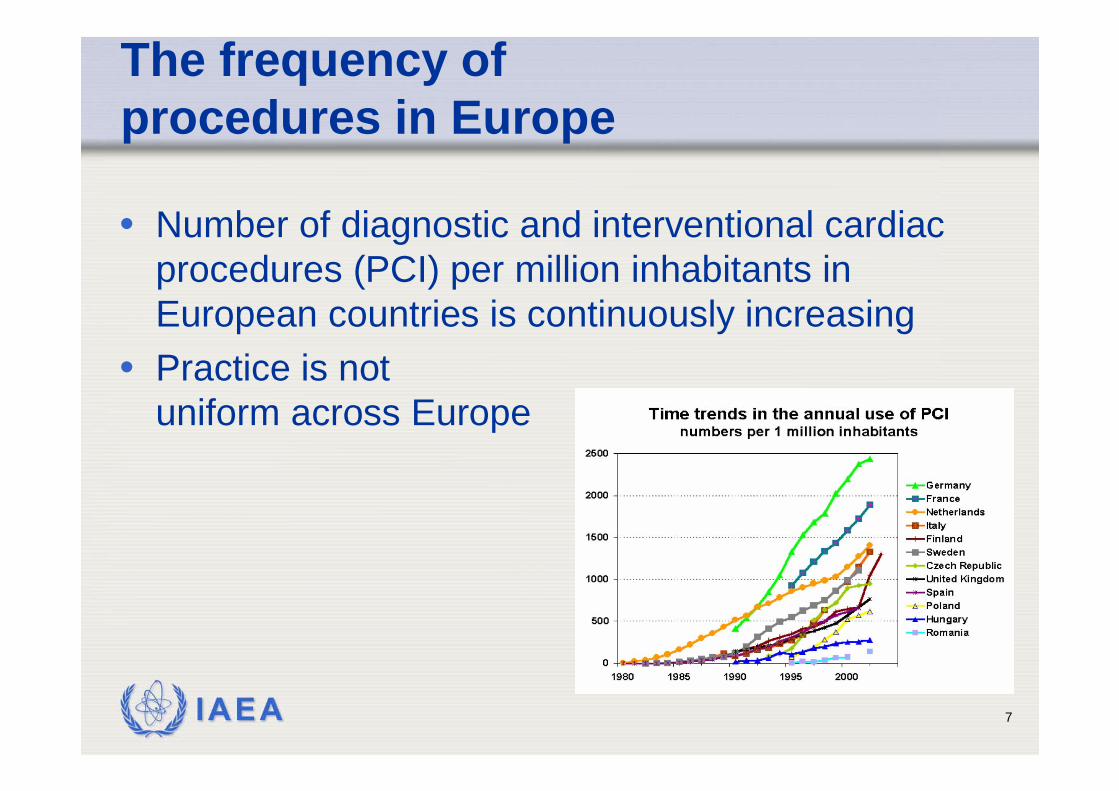
The frequency of procedures in Europe
• Number of diagnostic and interventional cardiac procedures (PCI) per million inhabitants in European countries is continuously increasing
• Practice is not uniform across Europe
IAEA 8
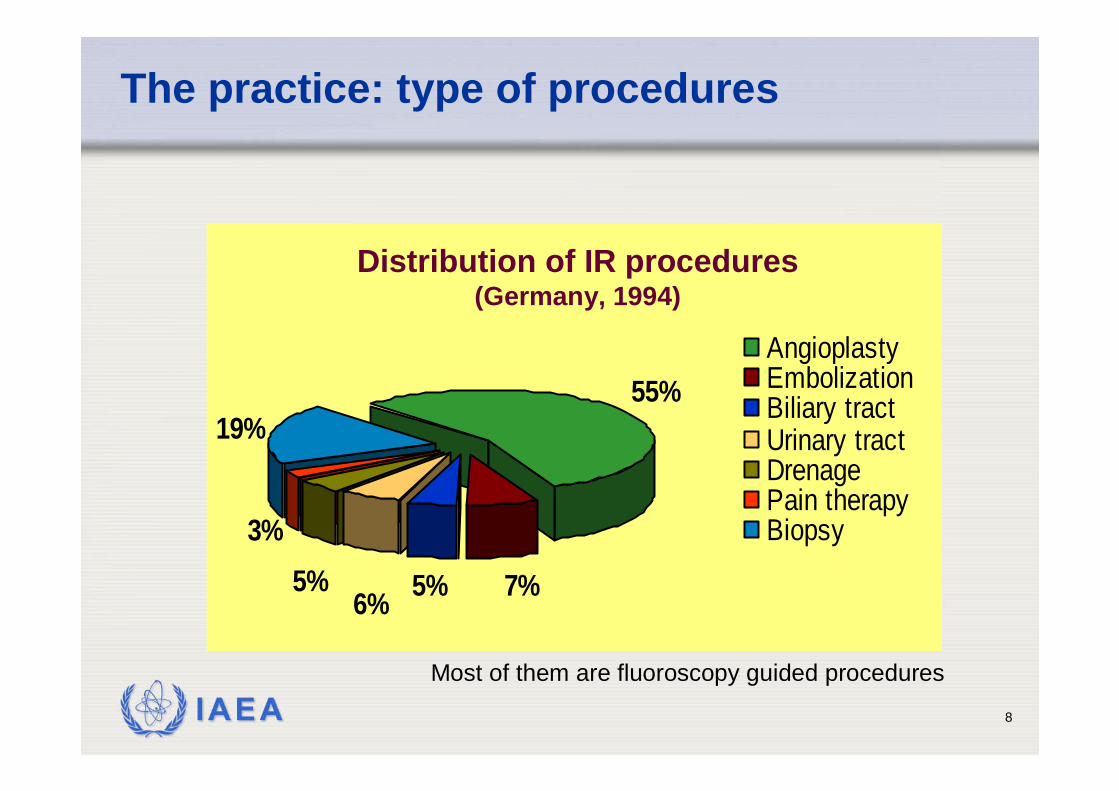
The practice: type of procedures
55%
7%5%
19%
3%
6%5%
AngioplastyEmbolizationBiliary tractUrinary tractDrenagePain therapyBiopsy
Distribution of IR procedures (Germany, 1994)
Most of them are fluoroscopy guided procedures
IAEA 9
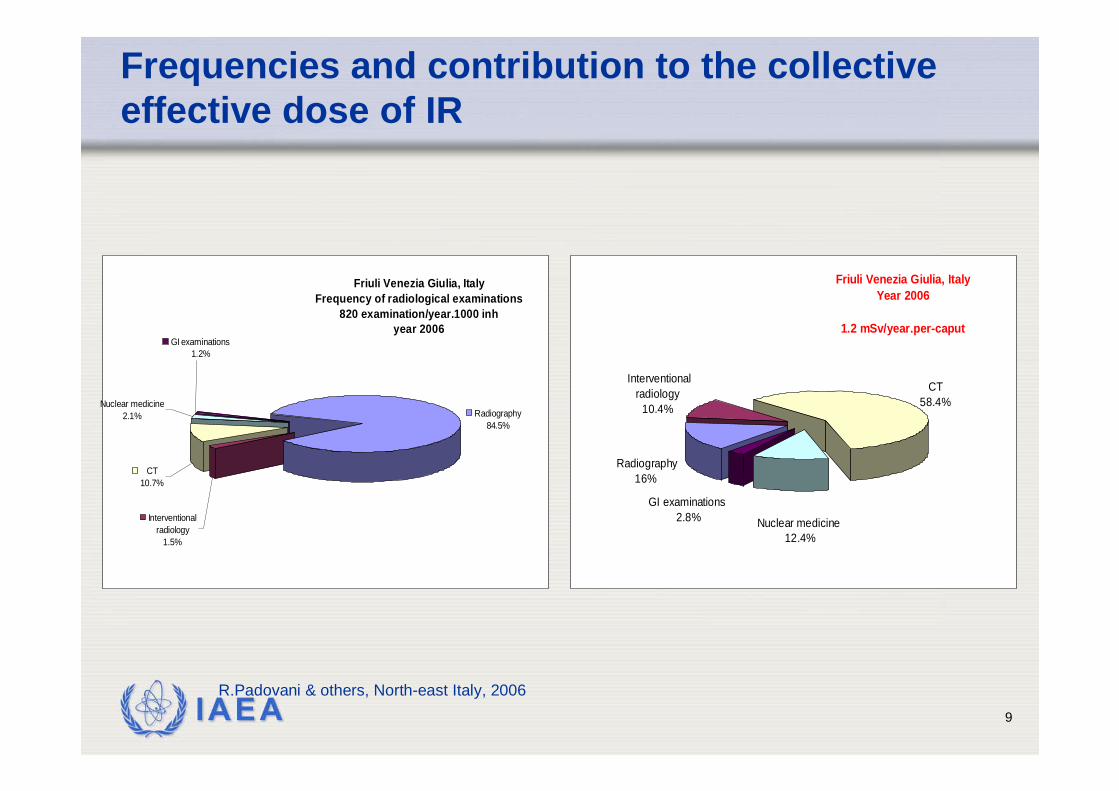
Frequencies and contribution to the collective effective dose of IR
GI examinations1.2%
Nuclear medicine2.1%
CT10.7%
Interventional radiology
1.5%
Radiography84.5%
Friuli Venezia Giulia, ItalyFrequency of radiological examinations
820 examination/year.1000 inhyear 2006
R.Padovani & others, North-east Italy, 2006
GI examinations 2.8% Nuclear medicine
12.4%
Interventional radiology
10.4%
Radiography16%
CT58.4%
Friuli Venezia Giulia, ItalyYear 2006
1.2 mSv/year.per-caput
IAEA 10
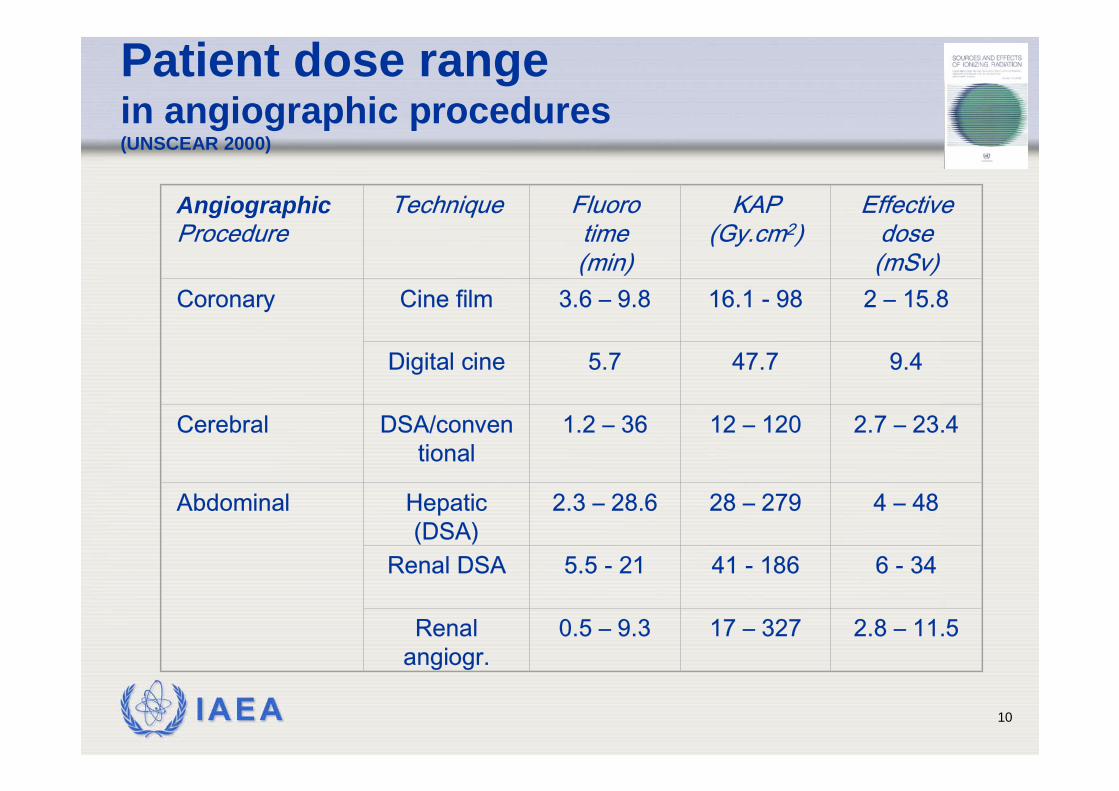
Patient dose rangein angiographic procedures (UNSCEAR 2000)
Angiographic Procedure
Technique Fluorotime (min)
KAP (Gy.cm2)
Effective dose (mSv)
Coronary Cine film 3.6 – 9.8 16.1 - 98 2 – 15.8
Digital cine 5.7 47.7 9.4
Cerebral DSA/conventional
1.2 – 36 12 – 120 2.7 – 23.4
Abdominal Hepatic(DSA)
2.3 – 28.6 28 – 279 4 – 48
Renal DSA 5.5 - 21 41 - 186 6 - 34
Renalangiogr.
0.5 – 9.3 17 – 327 2.8 – 11.5
IAEA 11
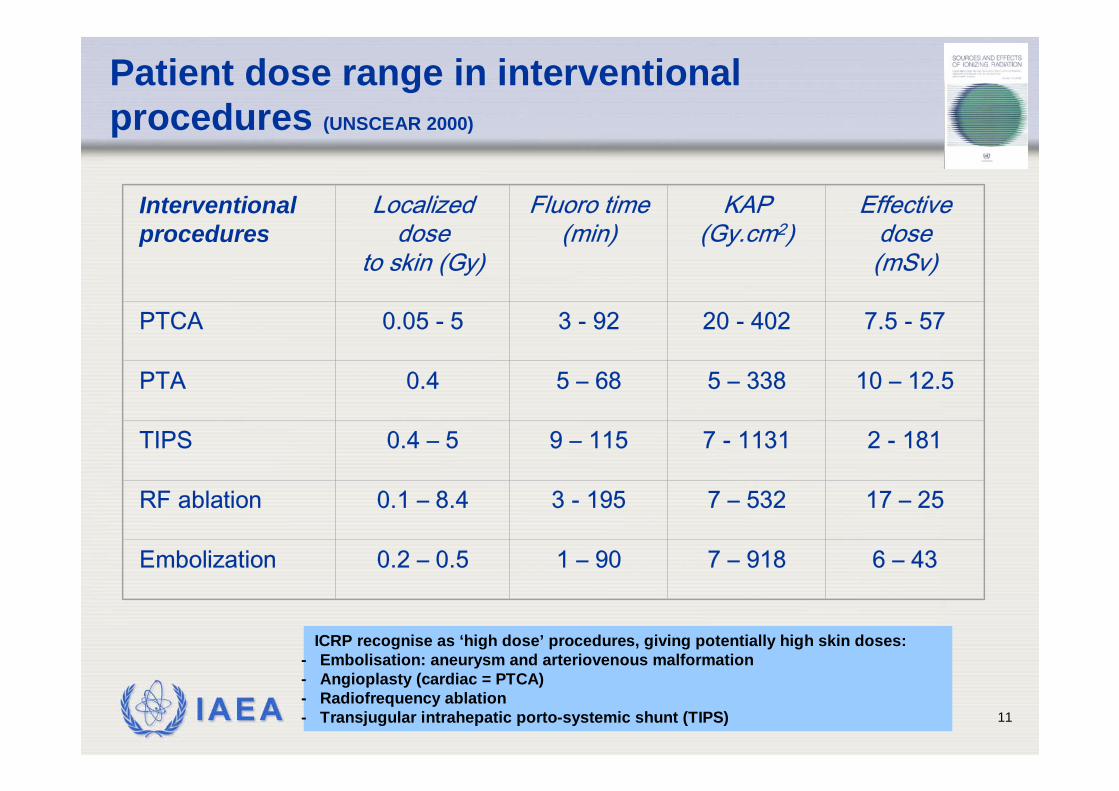
Patient dose range in interventional procedures (UNSCEAR 2000)
Interventionalprocedures
Localized dose
to skin (Gy)
Fluoro time (min)
KAP (Gy.cm2)
Effective dose (mSv)
PTCA 0.05 - 5 3 - 92 20 - 402 7.5 - 57
PTA 0.4 5 – 68 5 – 338 10 – 12.5
TIPS 0.4 – 5 9 – 115 7 - 1131 2 - 181
RF ablation 0.1 – 8.4 3 - 195 7 – 532 17 – 25
Embolization 0.2 – 0.5 1 – 90 7 – 918 6 – 43
ICRP recognise as ‘high dose’ procedures, giving potentially high skin doses:- Embolisation: aneurysm and arteriovenous malformation- Angioplasty (cardiac = PTCA)- Radiofrequency ablation- Transjugular intrahepatic porto-systemic shunt (TIPS)
IAEA 12
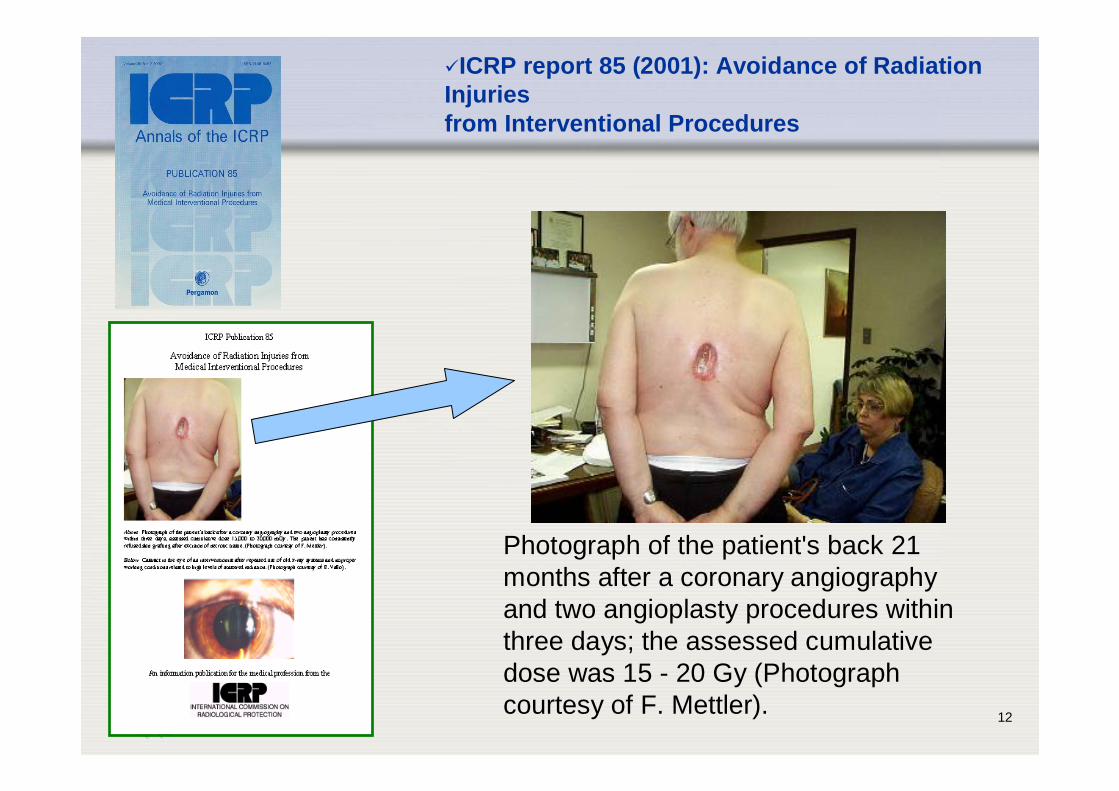
ICRP report 85 (2001): Avoidance of RadiationInjuriesfrom Interventional Procedures
Photograph of the patient's back 21 months after a coronary angiography and two angioplasty procedures within three days; the assessed cumulative dose was 15 - 20 Gy (Photograph courtesy of F. Mettler).
IAEA 13
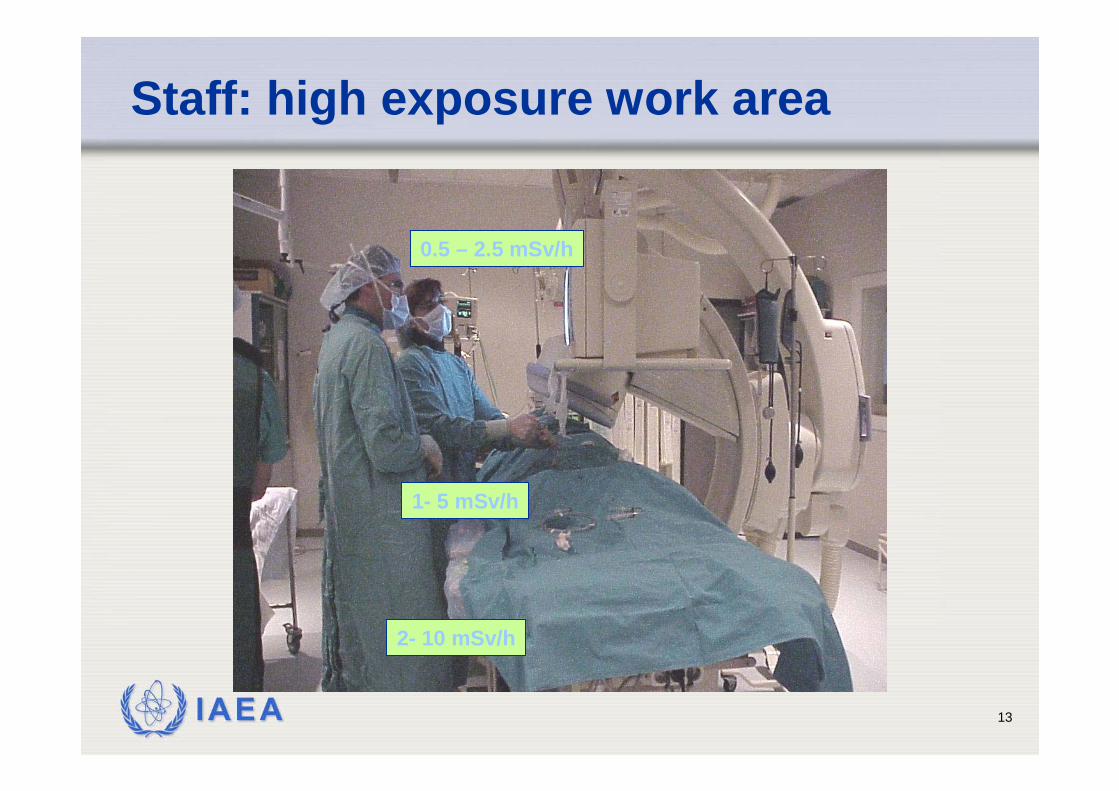
1- 5 mSv/h
0.5 – 2.5 mSv/h
2- 10 mSv/h
Staff: high exposure work area
IAEA 14
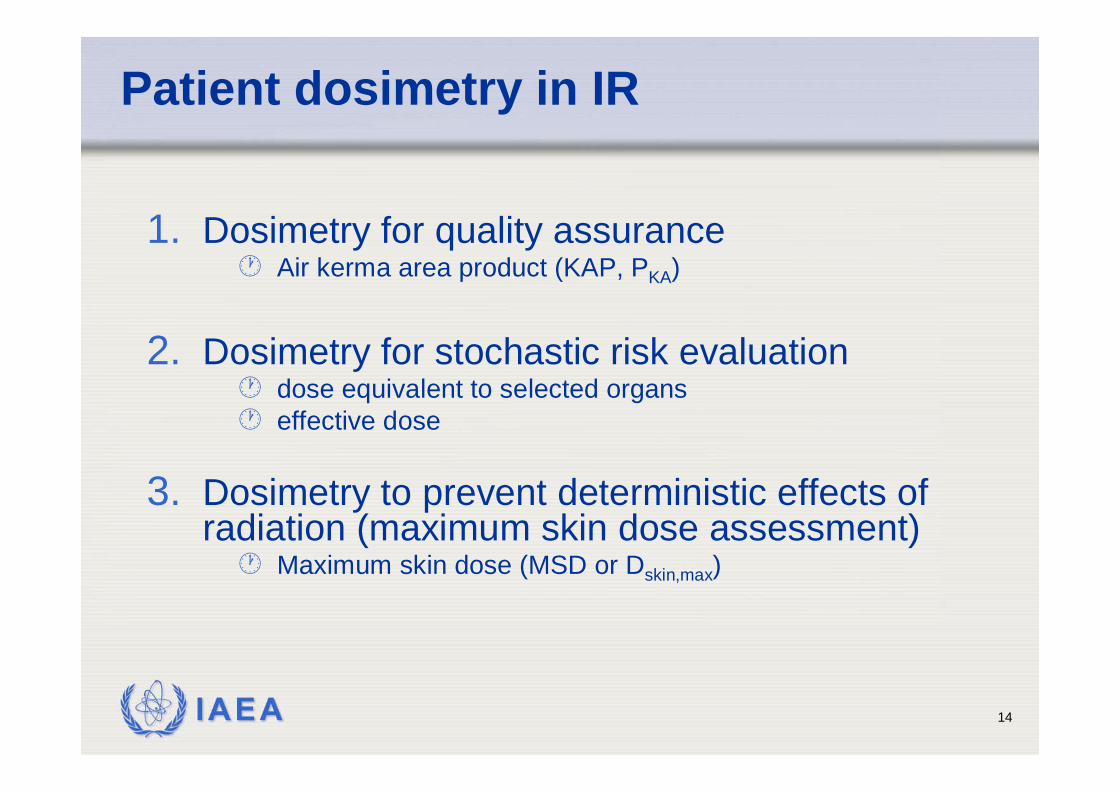
Patient dosimetry in IR
1. Dosimetry for quality assuranceAir kerma area product (KAP, PKA)
2. Dosimetry for stochastic risk evaluationdose equivalent to selected organseffective dose
3. Dosimetry to prevent deterministic effects of radiation (maximum skin dose assessment)
Maximum skin dose (MSD or Dskin,max)
IAEA 15
Code of Practice
(8.5 Fluoroscopy) • Since no standardized method exists,
recommendations on how to measure the maximum entrance surface air kerma in interventional procedures will not be given in thisCode of Practice.
(Appendix VI)• Deterministic effects only occur in diagnostic
radiology in special circumstances when the localdose is very high. The most important example isthe high skin dose which can arise duringinterventional procedures using X rays.
IAEA 16
Code of Practice (cont.)
• The assessment of absorbed dose to the most exposedarea of the skin is essential in complex interventionalprocedures
• Knowledge during the procedure of the skin dose isnecessary to avoid deterministic effects or to reduce theirseverity
• Knowledge after the procedure of the skin dose isnecessary in order to decide which patients require follow-up
• The determination of the skin dose to the most exposedarea is not easy since exposure parameters and projectionangle change during the procedure
• The most exposed area cannot be predicted in most cases
IAEA 17
Code of Practice (Appendix VII)
• In fluoroscopy guided interventionalprocedures, the air kerma–area product, PKA, offers a convenient quantity formonitoring patient exposure.
• In order to estimate the peak skin absorbeddose it is necessary to have a detector thatregisters the skin dose at many points
IAEA 18
Code of Practice (Appendix VII)
• Real time measurements are possible with detectorslocated on or near the skin but these cannot generallyprovide complete dose mapping
• Two alternative approaches to estimate the maximumpossible incident air kerma:• Measurements at a Interventional Reference Point (IEC-60601-2-
43) as a point on the central ray of the X ray beam which is 150 mm from the isocentre of the radiological equipment in the direction of the X ray tube. The cumulative air kerma at the IRP mayoverestimate the maximum incident air kerma
• Measurements of PKA can provide an indication of the maximumpossible incident air kerma if the focus to skin distance and fieldarea are recorded
IAEA 19
Interventional Radiology Point (IRP)
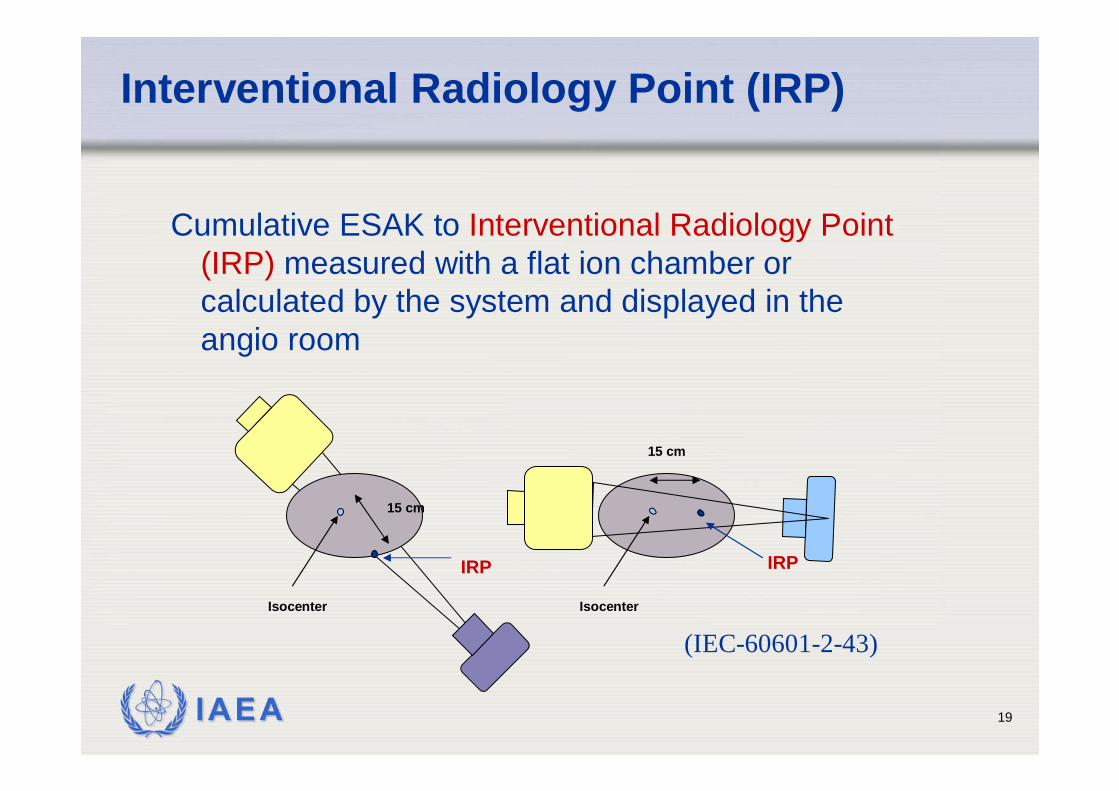
Cumulative ESAK to Interventional Radiology Point (IRP) measured with a flat ion chamber or calculated by the system and displayed in the angio room
15 cm
Isocenter
IRP
15 cm
Isocenter
IRP
(IEC-60601-2-43)
IAEA 20
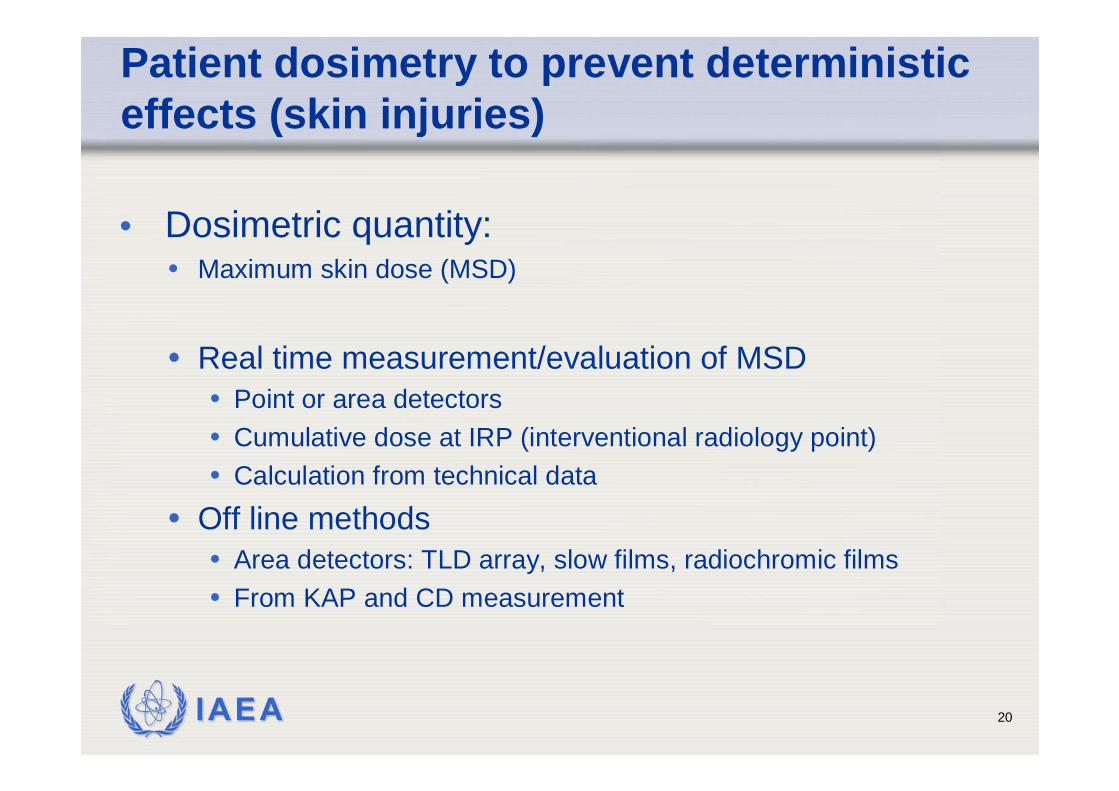
Patient dosimetry to prevent deterministic effects (skin injuries)
• Dosimetric quantity:• Maximum skin dose (MSD)
• Real time measurement/evaluation of MSD• Point or area detectors • Cumulative dose at IRP (interventional radiology point)• Calculation from technical data
• Off line methods• Area detectors: TLD array, slow films, radiochromic films• From KAP and CD measurement
IAEA 21
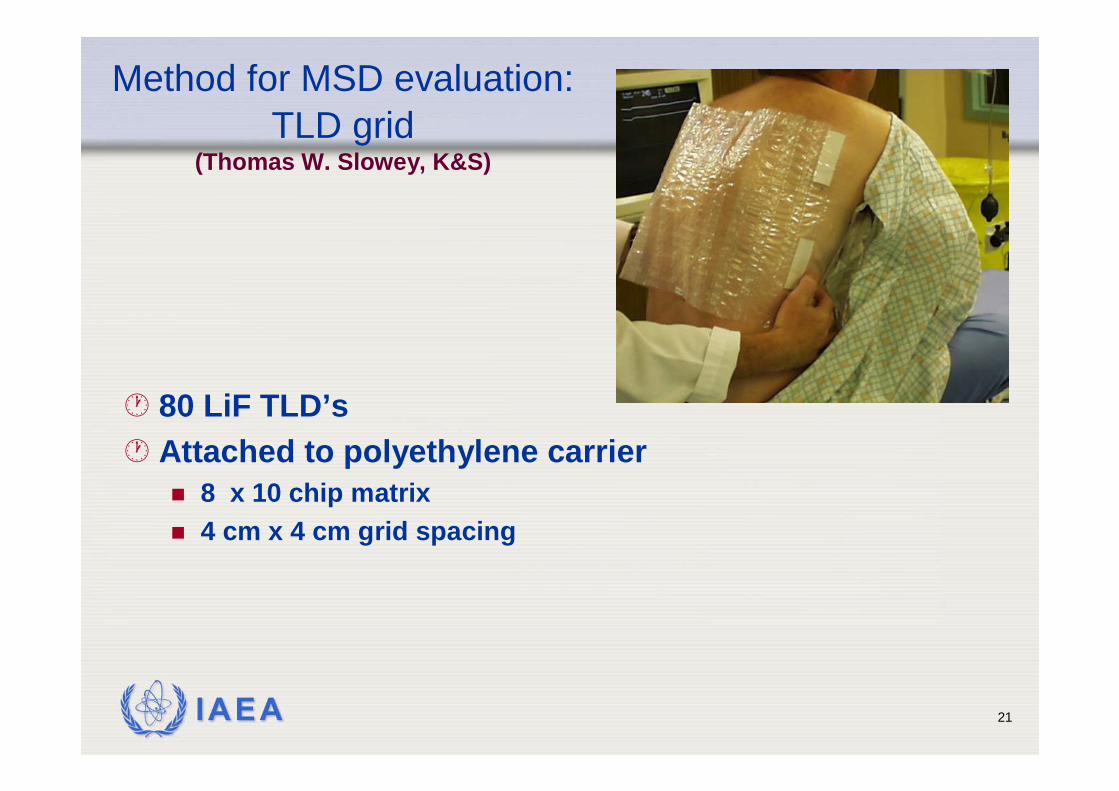
Method for MSD evaluation:TLD grid
(Thomas W. Slowey, K&S)
80 LiF TLD’sAttached to polyethylene carrier
8 x 10 chip matrix4 cm x 4 cm grid spacing
IAEA 22
Pt Left B C D E F G H J Pt Right
Top
4 cm
8 cm
12 cm
16 cm
20 cm
24 cm
28 cmdose (cGy)
belt width (cm)
Diagnostic
40.0-45.035.0-40.030.0-35.025.0-30.020.0-25.015.0-20.010.0-15.05.0-10.00.0-5.0
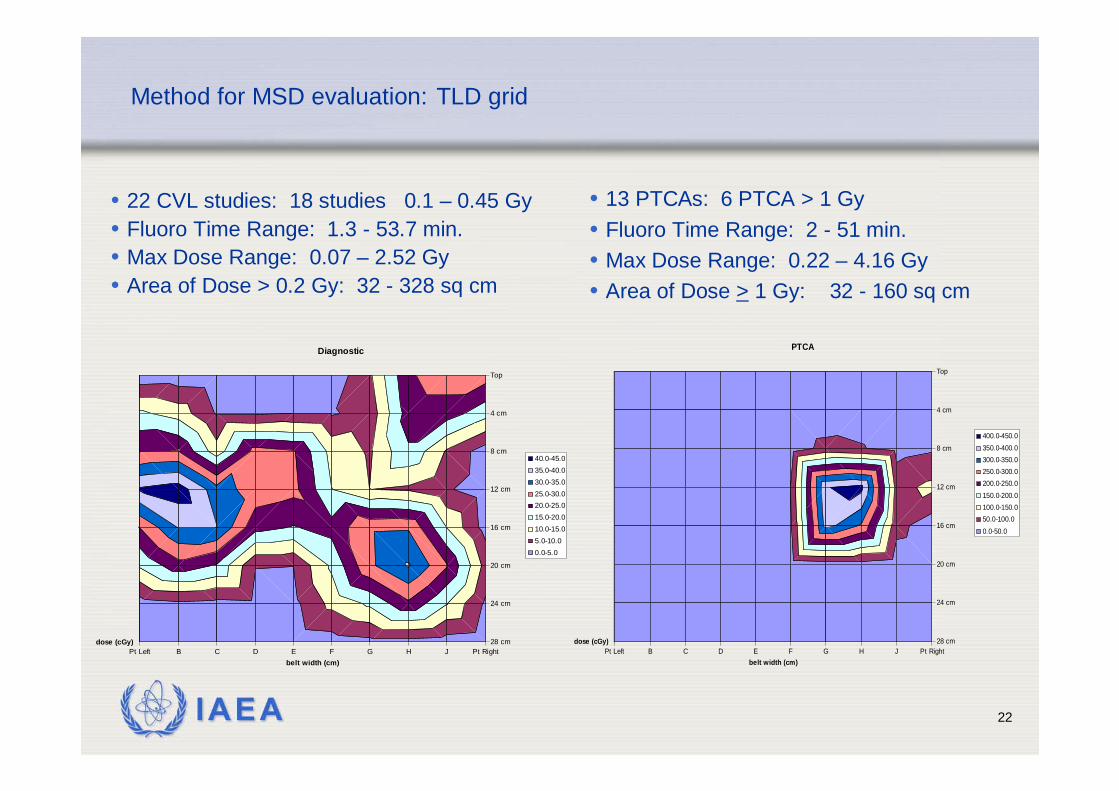
Method for MSD evaluation: TLD grid
• 22 CVL studies: 18 studies 0.1 – 0.45 Gy• Fluoro Time Range: 1.3 - 53.7 min.• Max Dose Range: 0.07 – 2.52 Gy• Area of Dose > 0.2 Gy: 32 - 328 sq cm
Pt Left B C D E F G H J Pt Right
Top
4 cm
8 cm
12 cm
16 cm
20 cm
24 cm
28 cmdose (cGy)
belt width (cm)
PTCA
400.0-450.0350.0-400.0300.0-350.0250.0-300.0200.0-250.0150.0-200.0100.0-150.050.0-100.00.0-50.0
• 13 PTCAs: 6 PTCA > 1 Gy• Fluoro Time Range: 2 - 51 min.• Max Dose Range: 0.22 – 4.16 Gy• Area of Dose > 1 Gy: 32 - 160 sq cm
IAEA 23
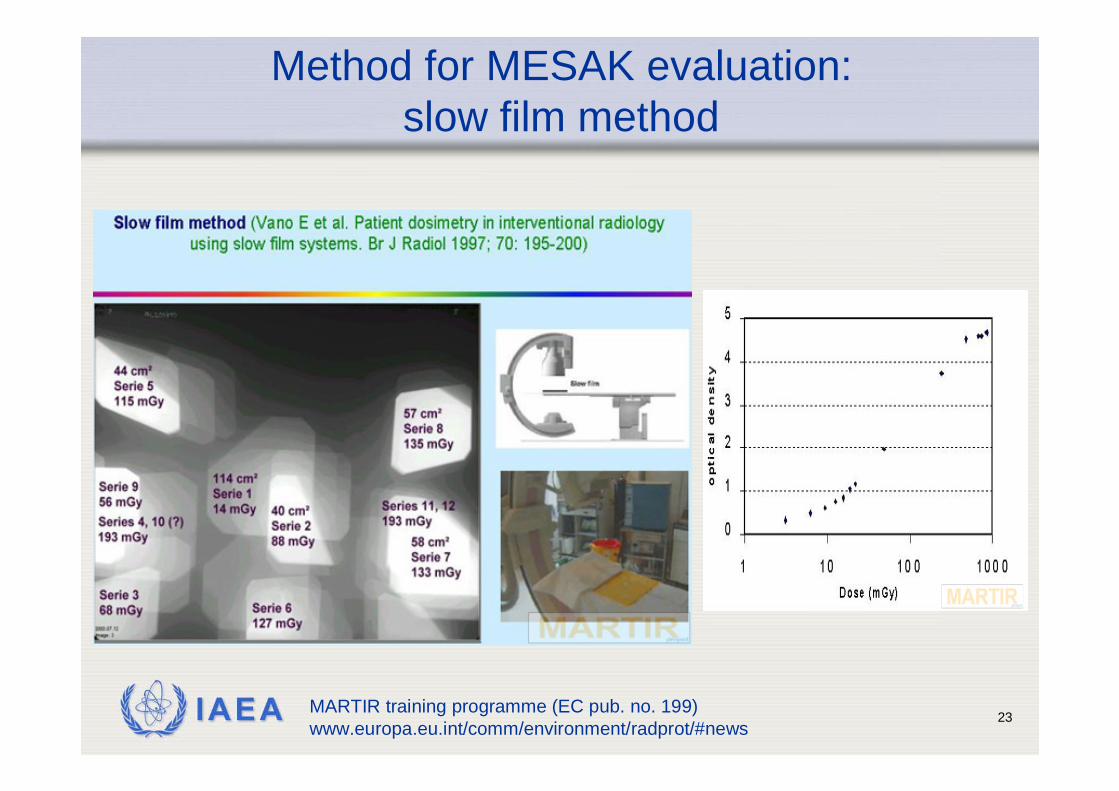
Method for MESAK evaluation:slow film method
MARTIR training programme (EC pub. no. 199) www.europa.eu.int/comm/environment/radprot/#news
IAEA 24
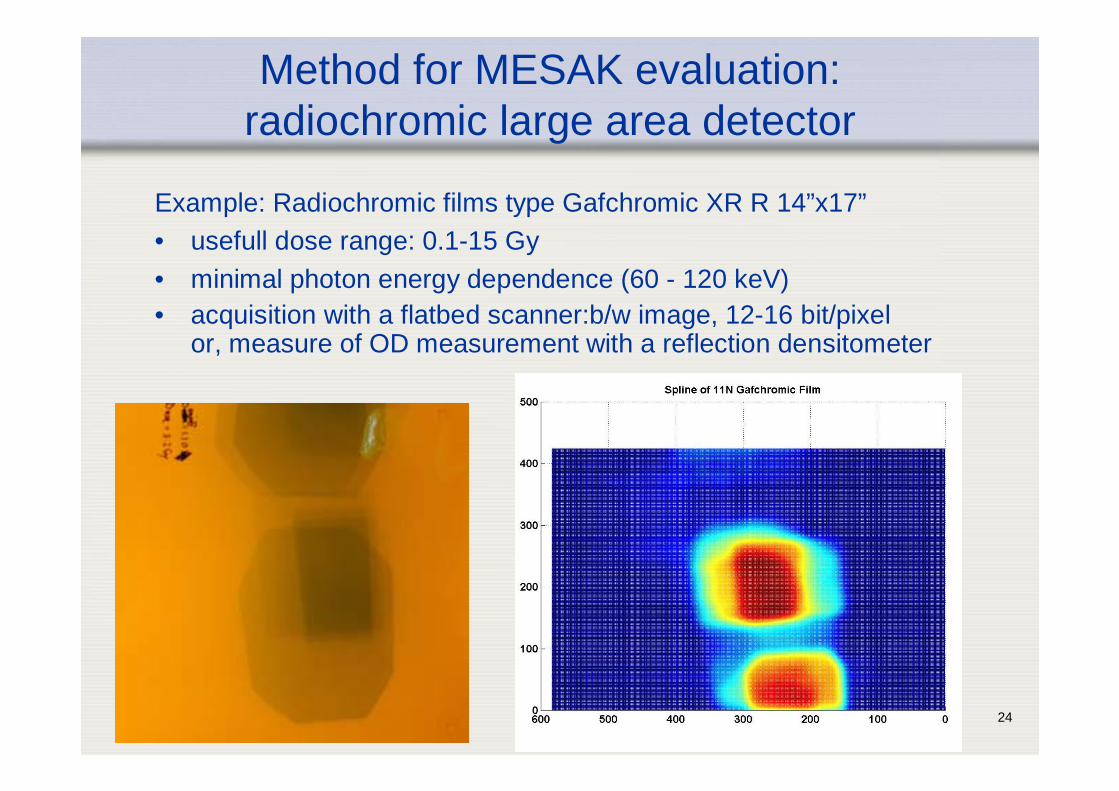
Method for MESAK evaluation:radiochromic large area detector
Example: Radiochromic films type Gafchromic XR R 14”x17”• usefull dose range: 0.1-15 Gy• minimal photon energy dependence (60 - 120 keV)• acquisition with a flatbed scanner:b/w image, 12-16 bit/pixel
or, measure of OD measurement with a reflection densitometer
IAEA 25
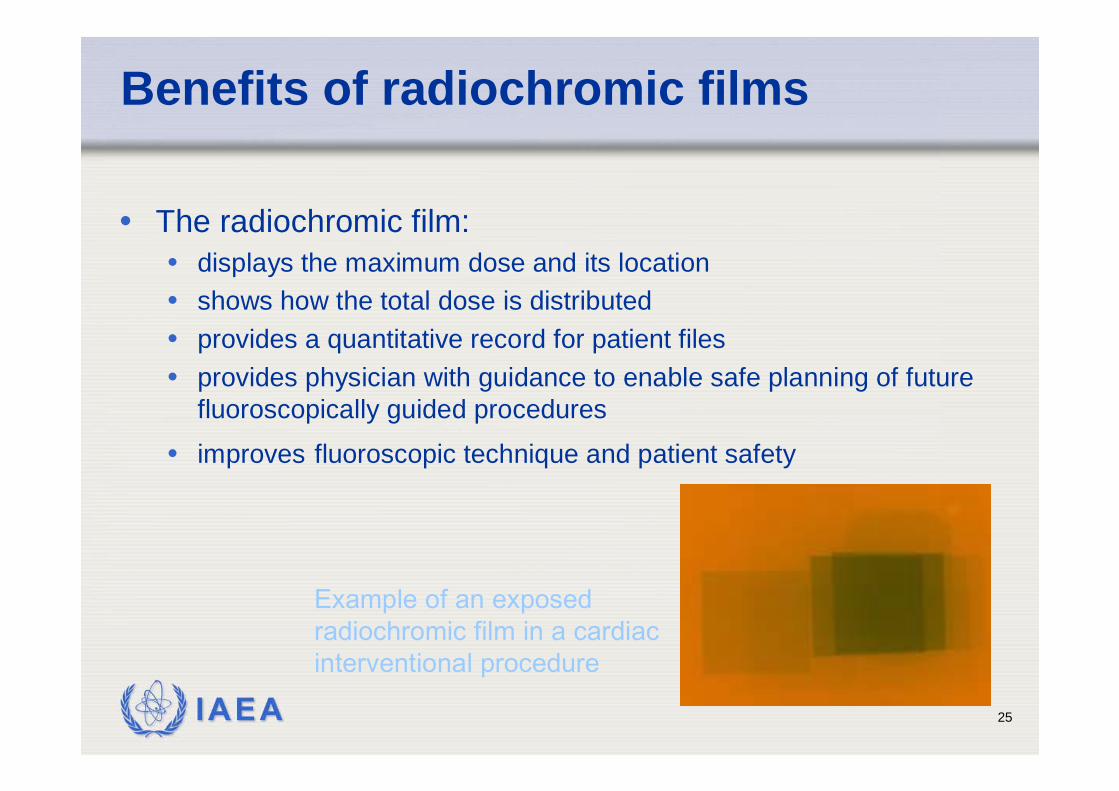
Benefits of radiochromic films
• The radiochromic film:• displays the maximum dose and its location• shows how the total dose is distributed• provides a quantitative record for patient files• provides physician with guidance to enable safe planning of future
fluoroscopically guided procedures
• improves fluoroscopic technique and patient safety
Example of an exposed radiochromic film in a cardiac interventional procedure
IAEA 26
Evaluation methods of radiochromic
1. Rapid semi-quantitative evaluation with comparison chart
2. Quantitative measurements with:a. Densitometer (point measurements)b. Digital flat bed scanner
IAEA 27
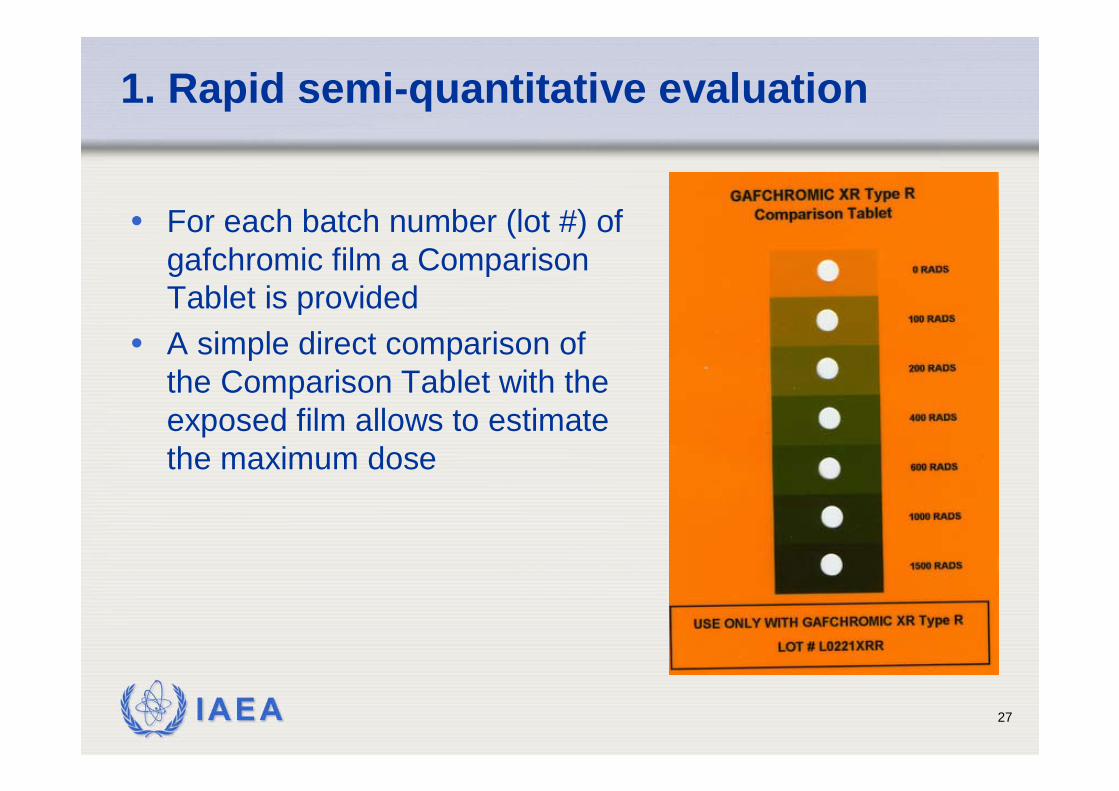
1. Rapid semi-quantitative evaluation
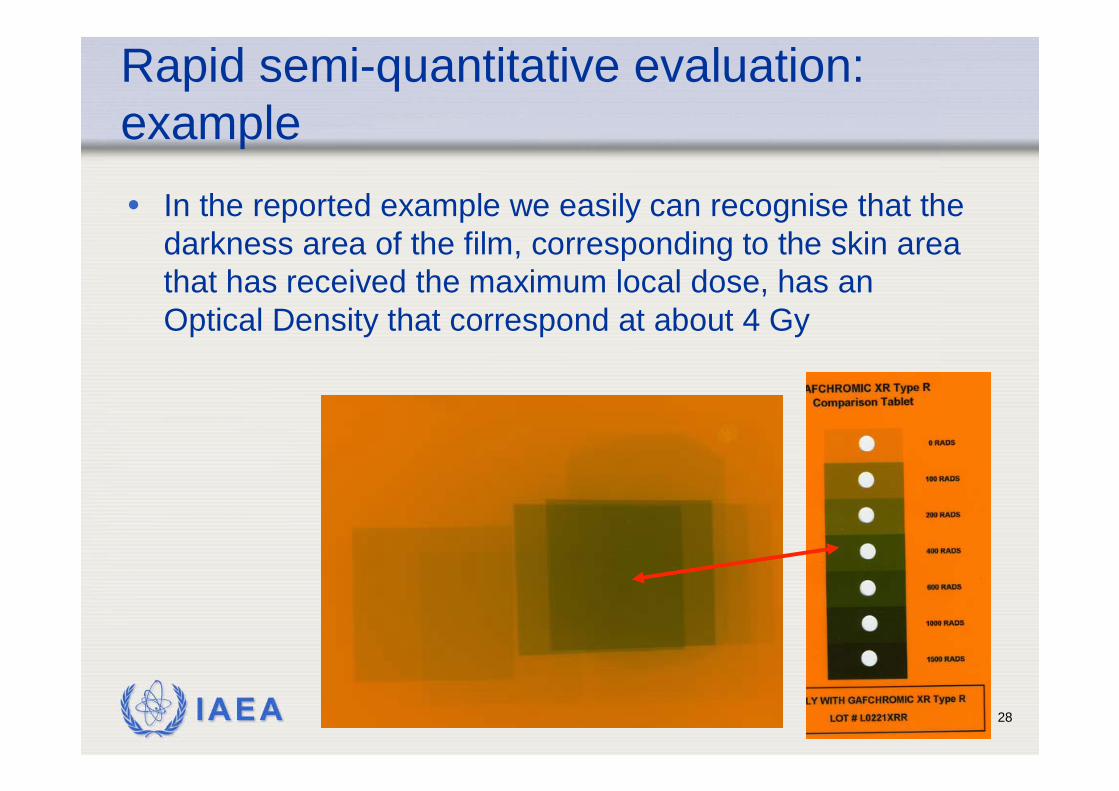
• For each batch number (lot #) of gafchromic film a Comparison Tablet is provided
• A simple direct comparison of the Comparison Tablet with the exposed film allows to estimate the maximum dose
IAEA 28
Rapid semi-quantitative evaluation: example• In the reported example we easily can recognise that the
darkness area of the film, corresponding to the skin area that has received the maximum local dose, has an Optical Density that correspond at about 4 Gy
IAEA 29
2.a - Quantitative measurements with spot densitometer
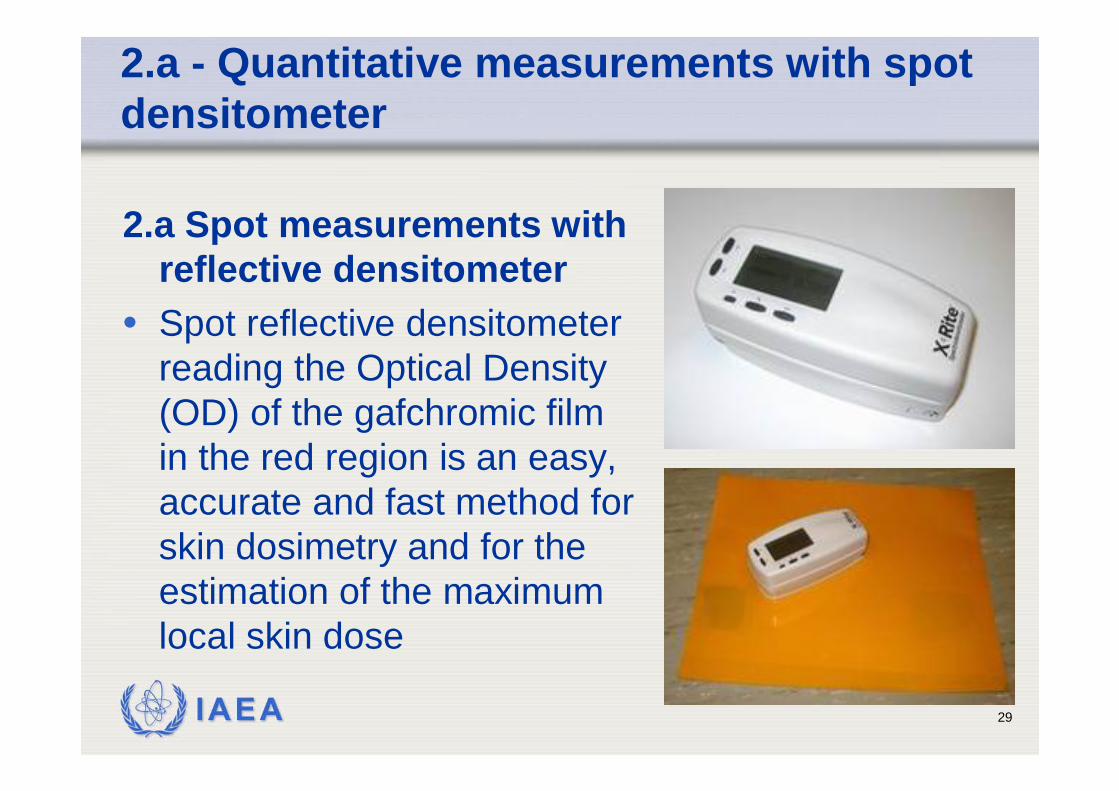
2.a Spot measurements with reflective densitometer
• Spot reflective densitometer reading the Optical Density (OD) of the gafchromic film in the red region is an easy, accurate and fast method for skin dosimetry and for the estimation of the maximum local skin dose
IAEA 30
Calibration procedure for radiochromic film
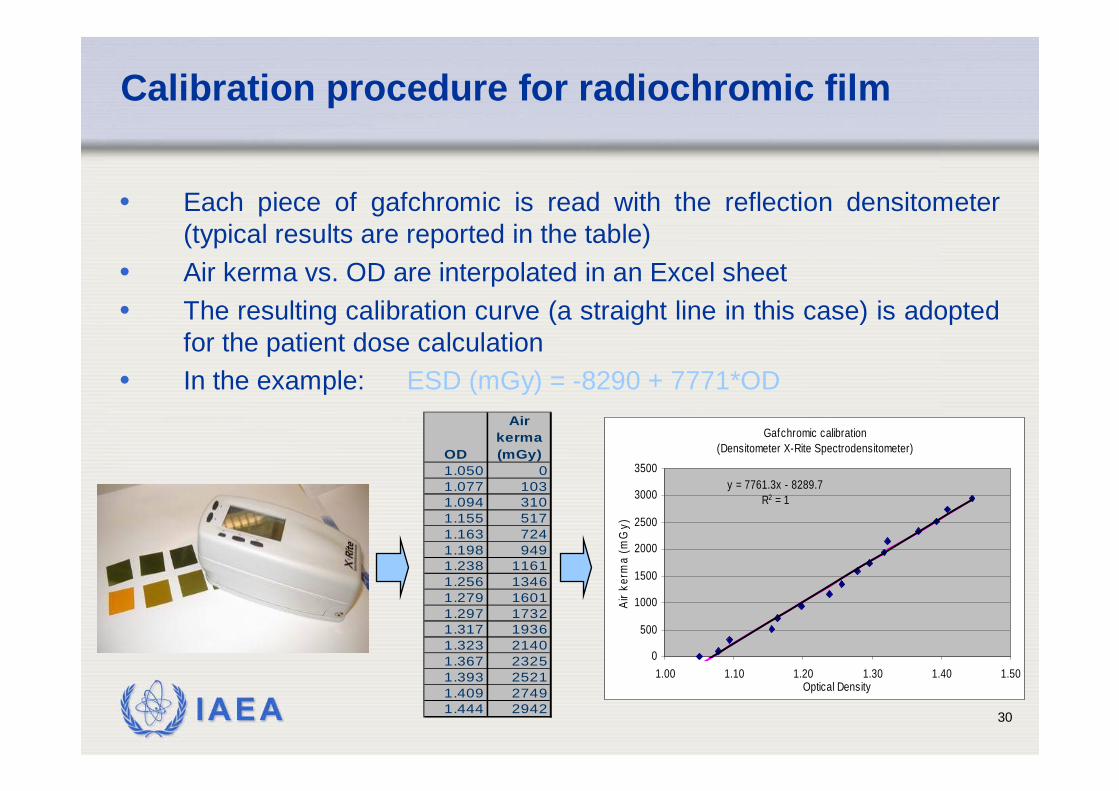
• Each piece of gafchromic is read with the reflection densitometer (typical results are reported in the table)
• Air kerma vs. OD are interpolated in an Excel sheet• The resulting calibration curve (a straight line in this case) is adopted
for the patient dose calculation• In the example: ESD (mGy) = -8290 + 7771*OD
Gafchromic calibration (Densitometer X-Rite Spectrodensitometer)
y = 7761.3x - 8289.7R2 = 1
0
500
1000
1500
2000
2500
3000
3500
1.00 1.10 1.20 1.30 1.40 1.50Optical Density
Air k
erm
a (m
Gy)
OD
Air kerma (mGy)
1.050 01.077 1031.094 3101.155 5171.163 7241.198 9491.238 11611.256 13461.279 16011.297 17321.317 19361.323 21401.367 23251.393 25211.409 27491.444 2942
IAEA 31
2. Quantitative measurements with flat bedscanner
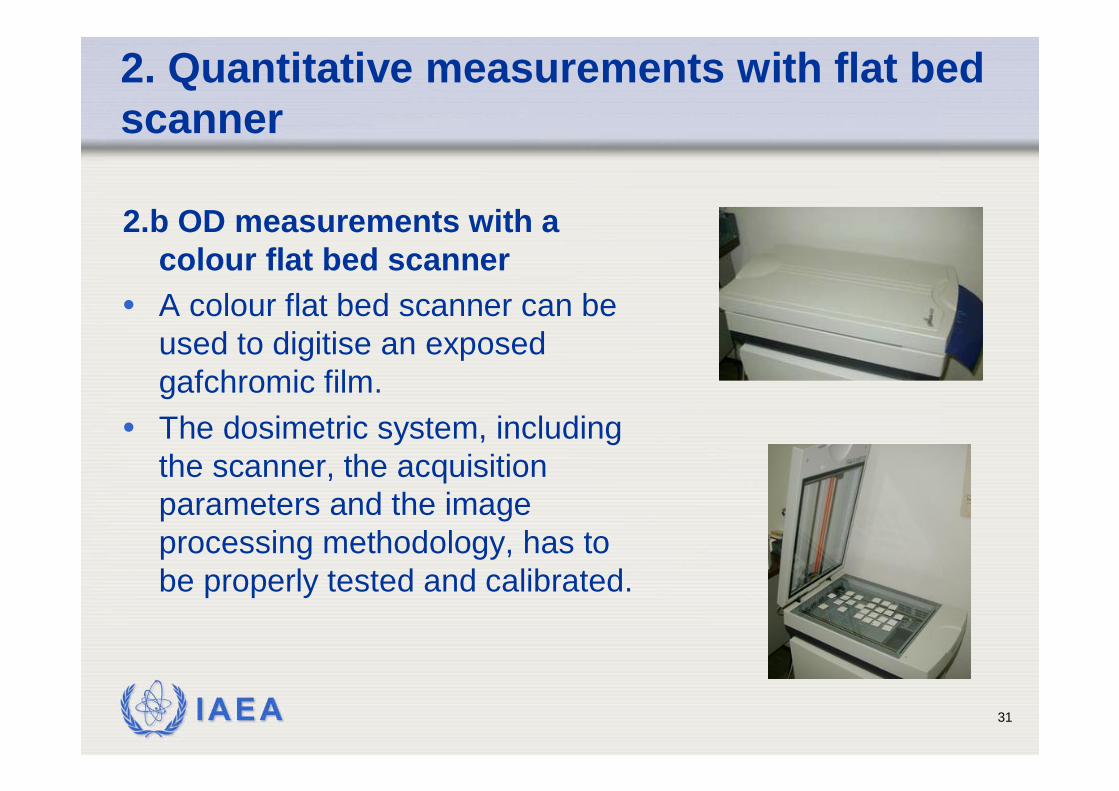
2.b OD measurements with a colour flat bed scanner
• A colour flat bed scanner can be used to digitise an exposed gafchromic film.
• The dosimetric system, including the scanner, the acquisition parameters and the image processing methodology, has to be properly tested and calibrated.
IAEA 32
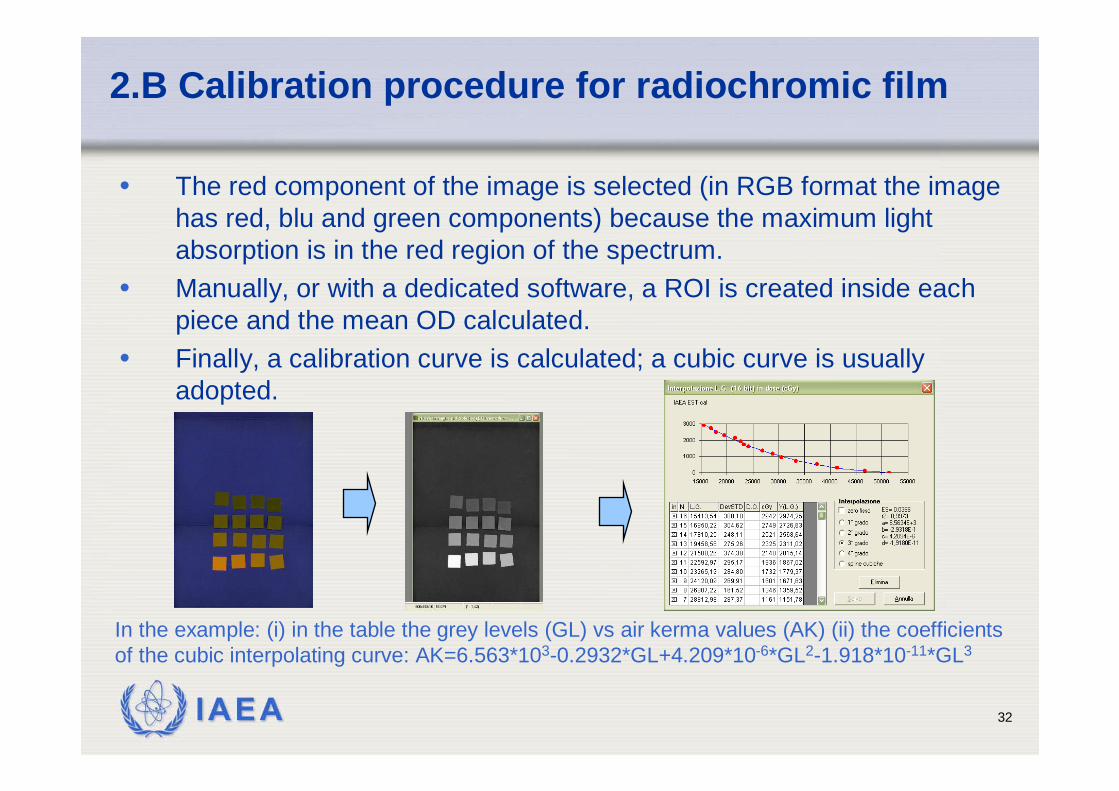
2.B Calibration procedure for radiochromic film
• The red component of the image is selected (in RGB format the image has red, blu and green components) because the maximum light absorption is in the red region of the spectrum.
• Manually, or with a dedicated software, a ROI is created inside each piece and the mean OD calculated.
• Finally, a calibration curve is calculated; a cubic curve is usuallyadopted.
In the example: (i) in the table the grey levels (GL) vs air kerma values (AK) (ii) the coefficientsof the cubic interpolating curve: AK=6.563*103-0.2932*GL+4.209*10-6*GL2-1.918*10-11*GL3
IAEA 33
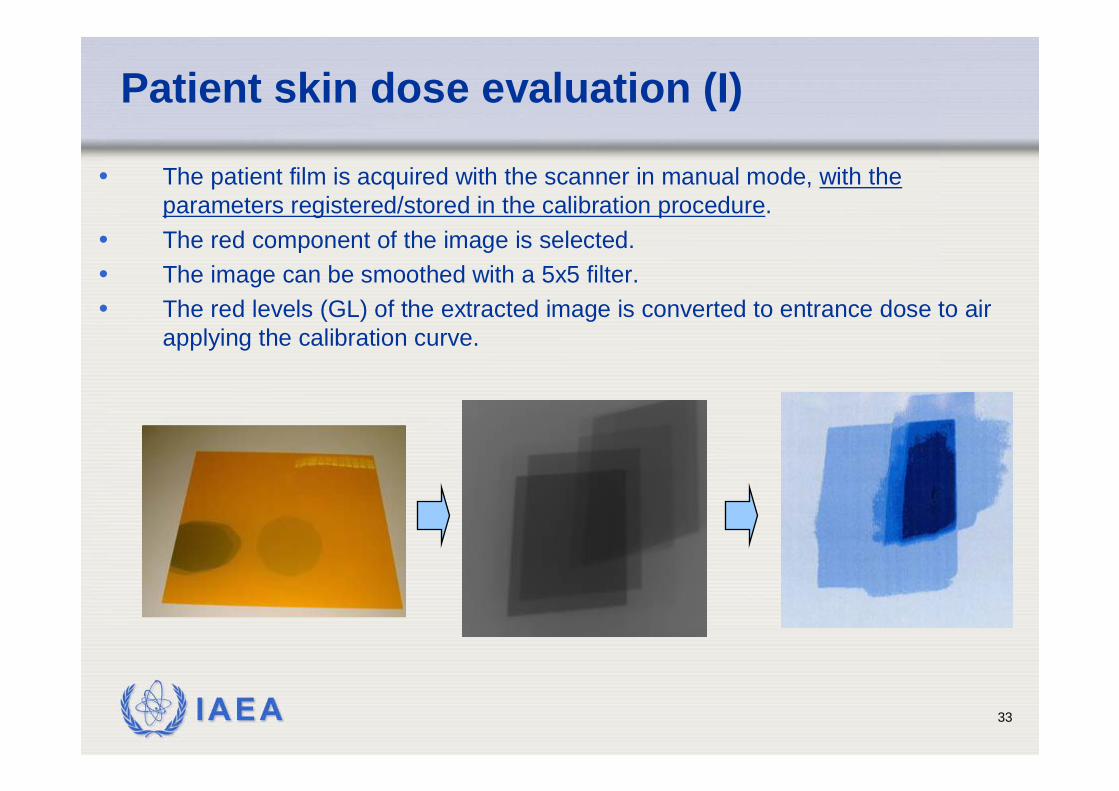
Patient skin dose evaluation (I)
• The patient film is acquired with the scanner in manual mode, with the parameters registered/stored in the calibration procedure.
• The red component of the image is selected. • The image can be smoothed with a 5x5 filter.• The red levels (GL) of the extracted image is converted to entrance dose to air
applying the calibration curve.
IAEA 34
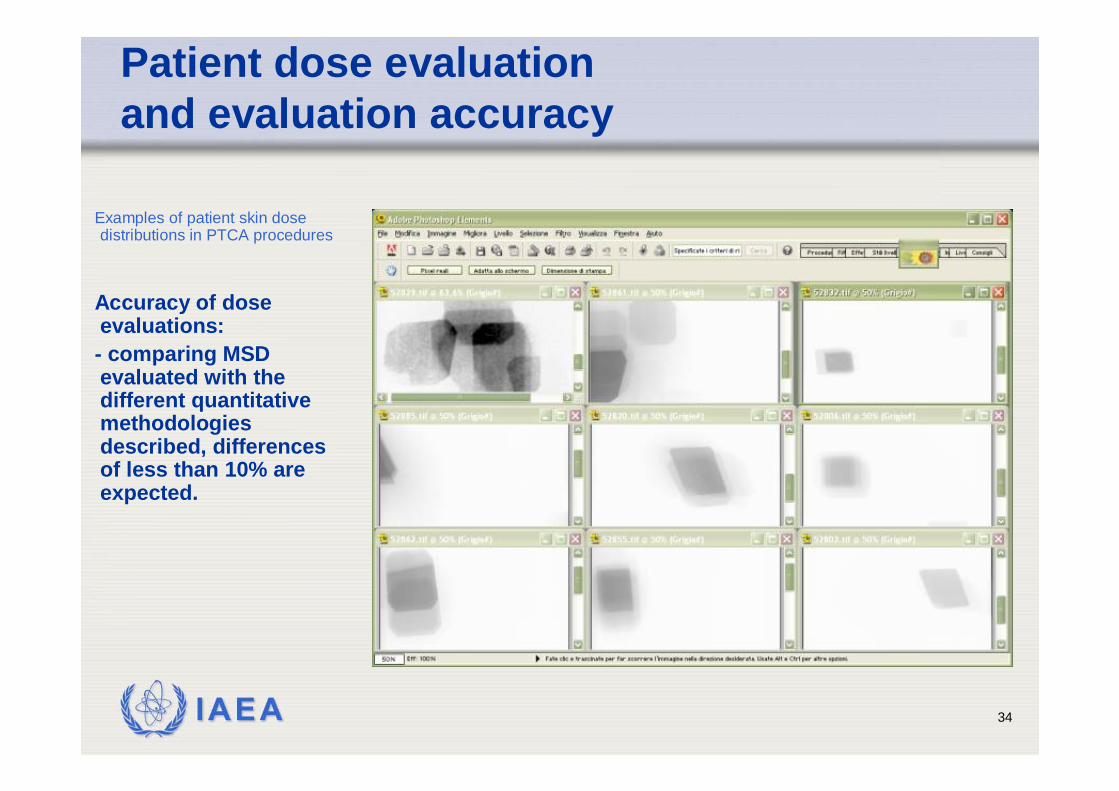
Patient dose evaluationand evaluation accuracy
Examples of patient skin dose distributions in PTCA procedures
Accuracy of dose evaluations:- comparing MSD evaluated with the different quantitative methodologiesdescribed, differencesof less than 10% are expected.
IAEA 35
Monitoring of skin dose in high dose procedures (IAEA survey)
• Radiochromic films used to measure patient skin dose in a sample of 392 interventional procedures in a IAEA international study
• In 52 procedures (7.4%) the PSK > 2 Gy, 15 proc. > 4 Gy
• maximum PSK 6.6 Gy; 38 PTCA, 6 RF ablation, 1 neuro and 6 hepatic embolisations
• 39 occurred at two hospitals !
IAEA 36
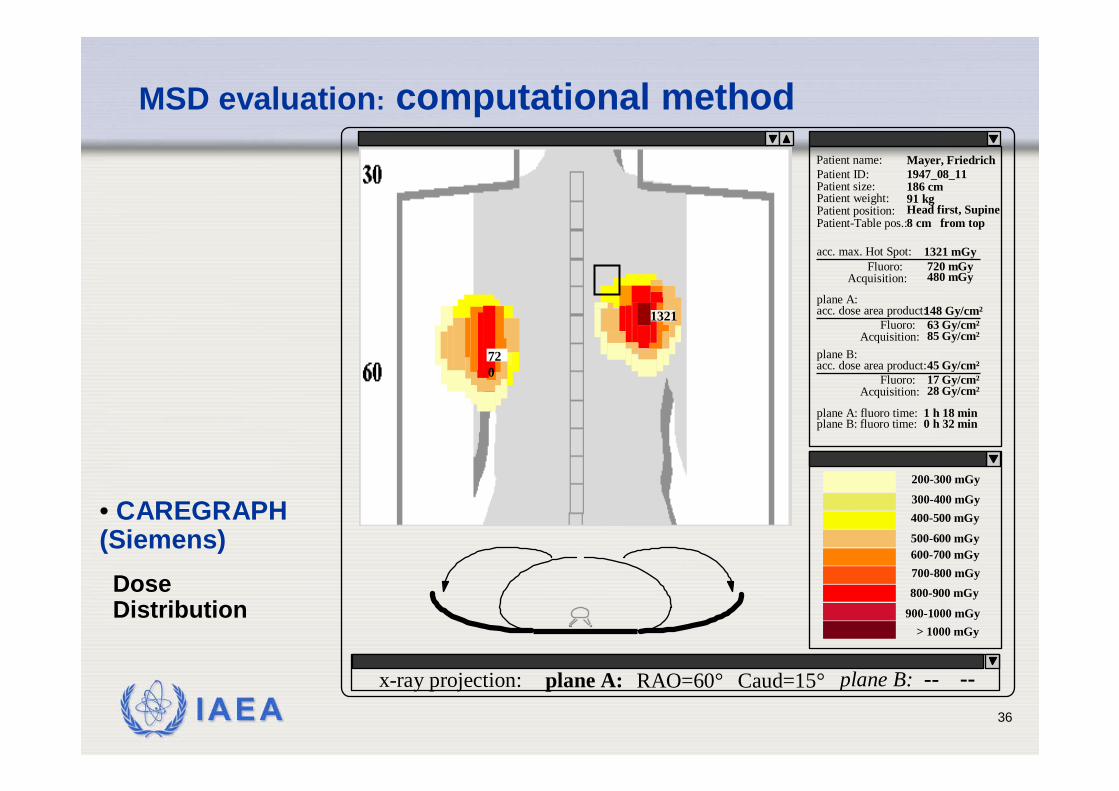
Acquisition:
Patient position:
Patient size: 186 cmPatient ID:Patient name: Mayer, Friedrich
Patient weight: 91 kgHead first, Supine
Patient-Table pos.:8 cm from top
acc. max. Hot Spot:Fluoro:
1321 mGy720 mGy480 mGy
Acquisition:
acc. dose area product:Fluoro:
148 Gy/cm²63 Gy/cm²85 Gy/cm²
plane A:
Acquisition:
acc. dose area product:Fluoro:
45 Gy/cm²17 Gy/cm²28 Gy/cm²
plane B:
plane A: fluoro time:plane B: fluoro time:
1 h 18 min0 h 32 min
1947_08_11
> 1000 mGy900-1000 mGy
800-900 mGy700-800 mGy600-700 mGy500-600 mGy
400-500 mGy300-400 mGy
200-300 mGy
x-ray projection: plane A: plane B: -- --RAO=60° Caud=15°
720
1321
• CAREGRAPH (Siemens)
Dose Distribution
MSD evaluation: computational method
IAEA 37
Method for MSD evaluation: MSD/KAP factors
• Skin doses in IR and IC• Measurements of dose rates for different type of
procedures, field size, orientation, continous/pulsed fluorosocpy• Extended assessment of KAP/ESD factors for
different procedures/field size/orientations• Possible use of ESD/KAP factor to estimate skin
dose, in alternative to more direct methods of skin dose measurements
P.J.Marsden, Y.Washington, J.Diskin
IAEA 38
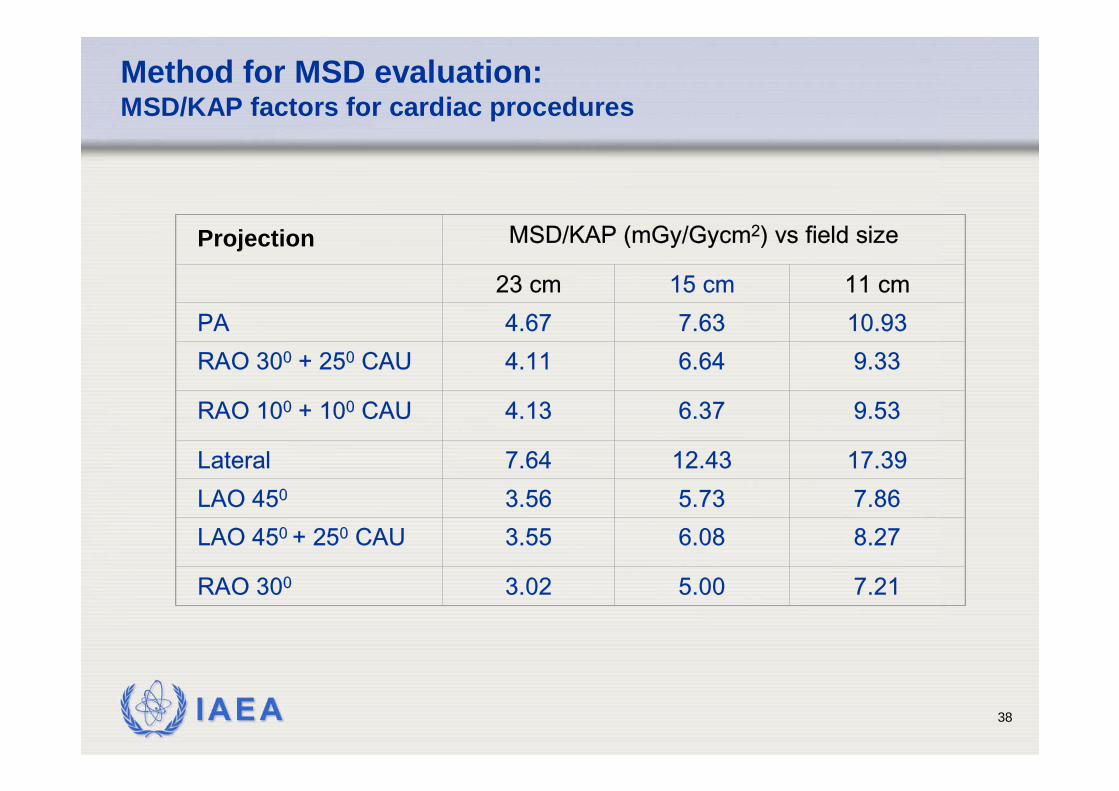
Method for MSD evaluation:MSD/KAP factors for cardiac procedures
Projection MSD/KAP (mGy/Gycm2) vs field size
23 cm 15 cm 11 cmPA 4.67 7.63 10.93RAO 300 + 250 CAU 4.11 6.64 9.33
RAO 100 + 100 CAU 4.13 6.37 9.53
Lateral 7.64 12.43 17.39LAO 450 3.56 5.73 7.86LAO 450 + 250 CAU 3.55 6.08 8.27
RAO 300 3.02 5.00 7.21
IAEA 39
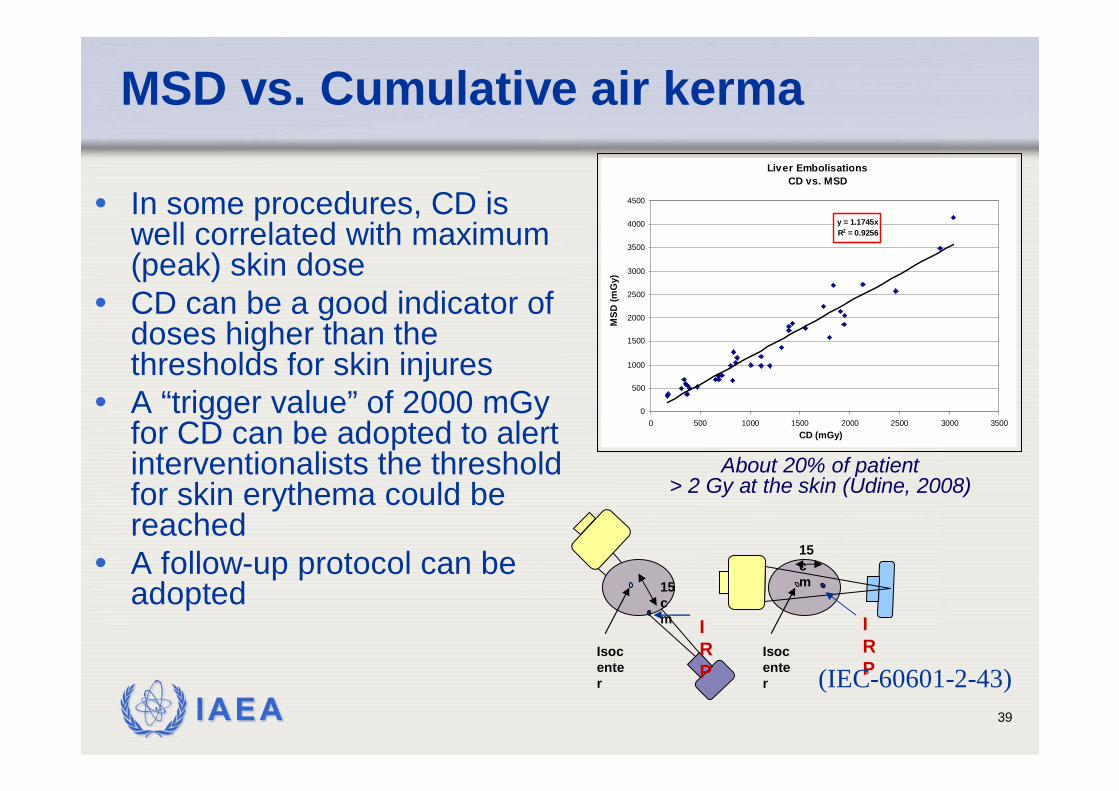
MSD vs. Cumulative air kerma
• In some procedures, CD is well correlated with maximum (peak) skin dose
• CD can be a good indicator of doses higher than the thresholds for skin injures
• A “trigger value” of 2000 mGy for CD can be adopted to alert interventionalists the threshold for skin erythema could be reached
• A follow-up protocol can be adopted
Liver EmbolisationsCD vs. MSD
y = 1.1745xR2 = 0.9256
0
500
1000
1500
2000
2500
3000
3500
4000
4500
0 500 1000 1500 2000 2500 3000 3500CD (mGy)
MSD
(mG
y)
About 20% of patient > 2 Gy at the skin (Udine, 2008)
15 cm
Isocenter
IRP
15 cm
Isocenter
IRP(IEC-60601-2-43)
IAEA 40
Recommendations to reduce the probability of skin injuries in IR
• Periodic monitoring of skin doses on high dose procedures
• A “trigger value” in term of KAP or CD to IRP should be adopted to alert interventionalist
• A follow-up protocol should be introduced for patients could have received high skin doses

IAEA 41
Friuli-Venezia Giulia region
Mandi!
Thank you!Udine