Embed Size (px)
Citation preview

2033-12
Joint ICTP/IAEA Advanced School on Dosimetry in DiagnosticRadiology and its Clinical Implementation
Mario de Denaro
11 - 15 May 2009
Ospedale MaggioreTrieste
Italy
Dosimetry for CT 2: Multi Slice Technology

DOSIMETRY FOR CT :Multi slice technology
Joint ICTP-IAEA Advanced School on Dosimetry in Diagnostic Radiology: and its Clinical Implementation
11 11 –– 15 15 MayMay 2009 2009 -- MiramareMiramare, Trieste, , Trieste, ItalyItaly
Mario de DenaroMario de DenaroMedical Physics Department, Maggiore Hospital, Trieste, Italy
Azienda Ospedaliero Universitaria “Ospedali Riuniti” di Triesteemail: [email protected]
ACCREDITED FOR ORGANIZATION BY JOINT COMMISSION INTERNATIONALOspedali Riuniti di Trieste

Introduction : C, P CTDI, DLP
For a large number of years, Computed Tomography Dose Index (CTDI) hasbeen used. Recent publications point out the experimental difficulty in
determining the dose to air, especially in the vicinity of an interface, and that, in reality, the the quantityquantity measuredmeasured byby instrumentsinstruments isis air air kermakerma.
For these reasons recent publications recommend the use of air kerma ratherthan absorbed dose to air, and consequently,
ComputedComputed TomographyTomography Dose Dose IndexIndex (CTDI) (CTDI) isis toto bebe replacedreplaced in future in future bybythe the ComputedComputed TomographyTomography Air Air KermaKerma IndexIndex ((CCaa).).
However, most publications still use quantities in terms of CTDI. The use of the new quantity does not change the method to determine organ
doses from the conversion coefficients, nor their numerical values.

Dose values displayed on the CT consoleCTDI (C) DLP (P) CTDI (C) DLP (P) ZZ--axisaxis
GeometricGeometric EfficencyEfficency

Dose in Multislice Scanner
?????? Dose ?????? Dose increaseincrease or or decreasedecrease ????????????
DecrementDecrement Introduction of dose reduction algorithmCurrent modulation techniques
IncrementIncrement Geometric parametersGeometric efficencyIntroduction of new clinical applicationsCardio CT, Functional perfusion, Trauma, ..

Dose in Multislice Scanner
?????? ?????? MeasurmentMeasurment isis stillstill reliablereliable ????????????
CTDIw MEASUREMENT :
The increment of the beam width makethe pencil chamber lenght inadequate
David J. Brenner:Is it time to retire the CTDI for CT quality assurance and dose
optimization?Medical Physics, Vol. 32, No. 10, October 2005

Multi slice technologyIncreasingly collimation width

Dose profile
DOSE PROFILE
Measured
-10 -8 -6 -4 -2 0 2 4 6 8 10
couch Z coordinate
Dos
e
Dose

Multi slice technologyGeometric parameters affecting the dose
X ray beam width
Overbeaming
Overranging

X ray beam width
Single slice thickness = T Total number of slices = N
Acquisition Slice Thickness Total nominal beam width
Nominal beam width = Nominal beam width = NN··TT
Single slice technology Slice thichness
Multi slice technologyAcquisition Slice Thicknessaffect the dose to the patient
Reconstructed Slice Thicknessdo not affect the dose to the patient

PITCH =Couch movement per rotation
Slice thickness
PITCH d =(Helical pitch) Slice thickness (d)
Couch movement per rotation
PITCH x=Couch movement per rotation
Nominal beam width (x)
Multi slice technologyPitch and volume CTDI

HelicalHelical (volume) (volume) acquisitionacquisition
Multi slice technologyPitch and volume CTDI
From : www.impactscan.org

Single slice scan Helical scan
Volume CTDI
CTDIvol = CTDIw / Pitch
CTDICTDIvolvol = = CTDICTDIww·· NN··TT
Pitch = 1 Pitch = 2Pitch = 0.5
llwherel = couch increment per rotation and N·T = nominal beam width (B)
Multi slice technologyPitch and volume CTDI

Overbeaming
Penumbra effect
The actual width of X ray beam > nominal width

Z-axis geometric efficiency
Penumbra effect
In multislice CT, due to penumbra effect, the dose profile must be 2-3 mm larger then the
nominal slice thiknessOVERBEAMING

Z-axis geometric efficiency
Z-axis geometric efficiency = Area under dose profile within active detectors
Area under total dose profile
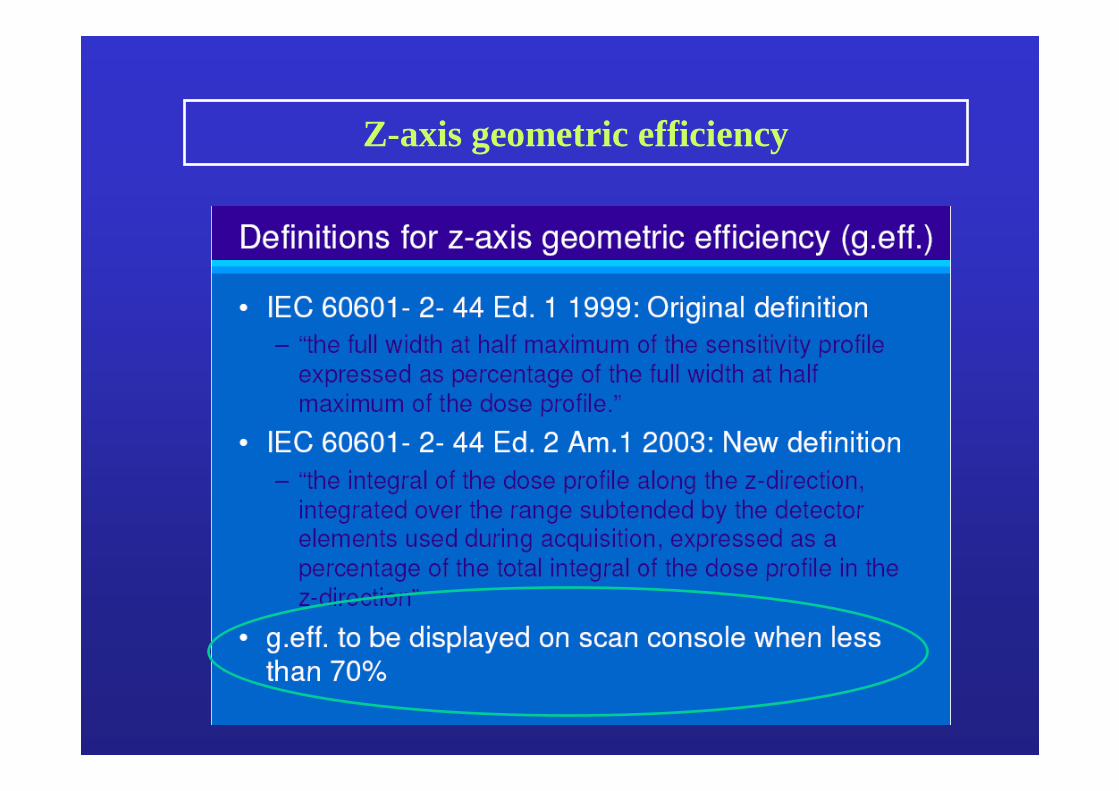
Z-axis geometric efficiency

Z-axis geometric efficiency - Measurement
Kodak Ready Pack X-OmatV Gafchromic XRQA
Material (film) :Polistirene
support
Multislice CT Toshiba Aquilion 16

Dose profile
Ready Pack film (whole profile : 30 cm)
Gafchromic film (central area : 3.5x2 cm)

Z-axis geometric efficiency measurement
Overbeaming effect is more evident for small thikness.
Total thikness 2 mmZ-Efficiency = 32.1%
Total thikness 4 mmZ-Efficiency = 50.9 %
Total thikness 8 mmZ-Efficiency = 69.7 %

Overranging (or overscanning)
Due to image reconstruction algorithms based on interpolation, the actual scan range exceed the
nominal range planned by the consolle.

Overbeaming and Overranging
Gafchromic
Ran
ge
MSCT - 64 slices and 16 slices acquisition
EXPERIMENTAL SET-UP
• Rando Alderson phantom
• Gafchromic strip 36x1 cm
• Same range
• Same mAs
• Different collimation

Overbeaming and OverrangingMSCT - 64 slices and 16 slices acquisition
Dose superficiale - Toshiba Aquilion 64 strati
0.00
20.00
40.00
60.00
80.00
100.00
120.00
140.00
0 40 80 120 160 200 240 280 320 360
mm
mG
y
range : 195 mm
Dose superficiale - Toshiba Aquilion 16 strati
0.00
20.00
40.00
60.00
80.00
100.00
120.00
140.00
0 40 80 120 160 200 240 280 320 360
mm
mG
y
range : 196 mm
SettingNominal range : 195 mmCollimation : 0.5x64 mm - Pitch : 0.828CTDIvol : 65.8 mGy - DLP : 1.66 Gy*cmGafchromic measurementActual range : 258 mm (+32%)Mean surface dose : 92.2 mGyIntegral surface dose : 2.44 Gy*cm
SettingNominal range : 196 mmCollimation : 0.5x16 mm - Pitch : 0.938CTDIvol : 76 mGy - DLP : 1.64 Gy*cmGafchromic measurementActual range : 217 mm (+11%)Mean surface dose : 100.0 mGyIntegral surface dose : 2.18 Gy*cm

Perspex phantom:Cilinder 16 cm diameter(head) thikness 14 cmCilinder 32 cm diameter(body) thikness 14 cm
C = Central positionP = Peripheral position (1 cm from the edge)
Weighted CTDI (CTDIw)
CTDIw=1/3 CTDIcenter + 2/3 CTDIperiphery
CTDI Measurement ( CTDIw )
Must be displayed in the consolle of the scanner !!

CTDIw measurement in Multi Slice
0
20
40
60
80
100
120
-250 -200 -150 -100 -50 0 50 100 150 200 250
mm
Dos
e %
Pencil chamber : 100 mm
Collimation : 32 mm
Gafchromic : 480 mm

CTDI measurement in Multi Slice
0
20
40
60
80
100
120
-300 -200 -100 0 100 200 300
mm
Dos
e %
Body PhantomHead PhantomAir

Phantom factors PH or B
As a practical alternative, estimates of CTDIw for the head or body CT dosimetry phantom may be derived from simpler measurements of CTDI made free-in-air (CTDIair) under similar conditions of exposure
CTDIw = CTDIair •PH or B (mGy cm)(H = head, B = body)
where
PH =
PB =
( nCTDIw )H
( nCTDIw )B
nCTDIair
nCTDIair
Head Phantom factor
Body Phantom factor

Phantom factors PH or B
Manufacturer Model nCTDIair
mGy /mAs
PMMA Head phantom(16 cm diameter)
PMMA Bodyphantom (32 cm diameter)
nCTDIwmGy/mAs
PH nCTDIwmGy/mAs
PB
Siemens AR.HP 0.335 0.252 0.75 0.128 0.38
Hi Q 0.195 0.161 0.83 0.093 0.48
Plus S 0.128 0.110 0.86 0.062 0.48
0.161 - - 0.082 0.51
GE Pace 0.344 0.200 0.58 0.094 0.27
Max 640 0.258 0.158 0.61 0.064 0.25
9800 0.204 0.143 0.70 0.063 0.31
Philips LX 0.200 0.160 0.80 0.081 0.41
CX/Q 0.172 0.149 0.87 0.070 0.41
SR 0.204 0.152 0.75 0.082 0.40
EUROPEAN GUIDELINES ON QUALITY CRITERIA FOR COMPUTED TOMOGRAPHY (EUR 16262 EN) : Chapter 2; APPENDIX I
PH or B = nCTDIw / nCTDIair

Dose reduction algorithmCurrent modulation in XY plane (Angular modulation)
Patient anatomy is highly asymmetric, so X-rays are much lessattenuated in the anteriorposterior direction than in the lateral direction
The automatic current modulation require the knowledge of the attenuation characteristic of the patient; it can be obtained in two way:
1. data from the scanogram to evaluate the lateral dimension of the patient;
2. data “online” by using projection data that lag 180° from the x-ray generation angle

Dose reduction algorithmCurrent modulation along Z axis (z-Axis modulation)
The current is modulated depending on the thikness of the different sections of the patient(es. neck correspond to a very small section compared to abdomen).
The informations for the automatic reduction are available from the scanogram.
Z-Axis modulation is an attempt to render all images withsimilar noise, independent of patient size and anatomy

Total scan parameters
Parametersrelated tocurrent
modulation

Dose reduction evaluationFrom: “ImPACT Report 05016 : CT scanner automatic xposure control systems “

EFFECTIVE DOSE IN COMPUTED TOMOGRAPHY
Dose index
CTDI, DLP
Risk estimate
EFFECTIVE DOSE? ?
ICRP publication N.103
……. The assessment and interpretation of effective dose from medical exposure of patients is very problematic when organs and tissues receive only partial exposure or a very heterogeneous exposure which is the case especially with x-ray diagnostics.

Measurement byTLD
Simulation byMontecarlo code
Mathematics phantom( Adam )
Antropomorphic phantomRando Alderson
Evaluation byconversion factors
Conversion factortables
Evaluation of effective doseMain evaluation methods

Evaluation of effective dose in CT basedon published conversion factors
∑ +
−⋅=
z
zzfpF )(/1
Z-, Z+ = scan limitsp = pitch
Da: Hidajat N, Schröder RJ, Vogel T e Coll : Dosisreduktion beim Patienten in der Computertomographie Fortschr Röntgenstr 165: 462-466, 1996.

Mean values fmean for the conversion factor (in mSv/mGy·cm)(Da: Hidajat N, Schröder RJ, Vogel T e Coll : Dosisreduktion beim Patienten in der Computertomographie Fortschr
Röntgenstr 165: 462-466, 1996.)
CTmeanair kfDLPE ⋅⋅=E = Effective DoseDLPair = Dose Lengh Product in ariakCT = Scanner factor ( da: NRPB-R249, 1991 )
Evaluation of effective dose in CT basedon published conversion factors

Measurement by TLD
Thermoluminescence detectors LiF (TLD 100) size1x1x6 mm
•Intestine
•Kidney
•Pancreas
•Uterus
•Pelvis
•Skin
•Bladder
•Ovaries
•Testes

Evaluation of effective dose in CT based on Montecarlo code
Input
• Scanner model (database)
• Acquisition parameters(Kv, mA, sec, pitch, ….)
• Scan range (interactive)
• CTDI in air
Download dal sito : www.mta.au.dkDeveloped by: National Institute of Radiation Hygiene - Denmark
Program CT Dose

Examination Coliche Mode: Slice scanningusing scanner: Philips Model: Tomoscan 1998Monte Carlo Dose Data derived from: Philips Tomoscan AV
Scan plans:Comment: COLICHE 3 IN 5kV:120 mAs:250,00 Slices:60 CTDI (mGy/mAs): 0,1678Slice Width (mm):3,0 Table feed per slice(mm): 5,0 nCTDIw (Head) (µGy/mAs): 127,7 +/- 1,9 %Scan Start (cm): 35,0 Scan End (cm): 5,2 nCTDIw (Body) (µGy/mAs): 67,1 +/- 1,9 %
Prime Organs Equivalent Dose Error Other Organs Equivalent Dose ErrorLungs 0,28 mGy 3% Pelvis 26 mGy 2%Stomach Wall 6,8 mGy 2% Spine 6,2 mGy 2%Urinary Bladder Wall 11 mGy 2% Skull Cranium 0 mGy 0%Breasts 0,10 mGy 6% Skull Facial 1,9 µGy 50%Liver 4,8 mGy 2% Rib Cage 1,5 mGy 2%Esophagus 0,14 mGy 10% Clavicles 23 µGy 40%Thyroid 2,6 µGy 10% Eye Lenses 0 mGy 0%Skin 2,7 mGy 1% Gall Bladder Wall 10 mGy 2%Bone Surface 4,5 mGy 2% Heart 0,30 mGy 5%Red bone marrow 4,0 mGy 2%Testes (Gonads) 0,95 mGy 4%Ovaries (Gonads) 11 mGy 2%LLI Wall (Colon) 8,9 mGy 2%
Remainder Organs Equivalent Dose Error Marrow Doses Equivalent Dose ErrorMuscle 3,7 mGy 1% Pelvis 9,6 mGy 2%Adrenals 1,5 mGy 7% Spine 2,3 mGy 2%Brain 0 mGy 0% Skull Cranium+Facial 0,17 µGy 50%Small Intestine 12 mGy 2% Rib cage 0,48 mGy 2%ULI Wall 12 mGy 2% Clavicles 6,5 µGy 40%Kidneys 11 mGy 2% Scapulae 33 µGy 10%Pancreas 3,4 mGy 3% Upper Part of Legs 0,36 mGy 2%Spleen 4,6 mGy 2% Upper Part of Arms 21 µGy 10%Thymus 92 µGy 30%Uterus 11 mGy 2%
DLP (head phantom) 0,57 Gy cm +/- 2%Effective Dose (ICRP 60) 4,9 mSv +/- 2% DLP (body phantom) 0,30 Gy cm +/- 2%
From: National Institute of Radiation Hygiene - Denmark

Thank you for your attention.