Embed Size (px)
Citation preview

Dose enhancing behavior of hydrothermally grown Eu-doped SnO2 nanoparticlesR. Sánchez Zeferino, U. Pal, R. Meléndrez, H. A. Durán-Muñoz, and M. Barboza Flores Citation: Journal of Applied Physics 113, 064306 (2013); doi: 10.1063/1.4790486 View online: http://dx.doi.org/10.1063/1.4790486 View Table of Contents: http://scitation.aip.org/content/aip/journal/jap/113/6?ver=pdfcov Published by the AIP Publishing
[This article is copyrighted as indicated in the article. Reuse of AIP content is subject to the terms at: http://scitation.aip.org/termsconditions. Downloaded to ] IP:
148.228.149.137 On: Sat, 04 Jan 2014 21:27:57

Dose enhancing behavior of hydrothermally grown Eu-doped SnO2
nanoparticles
R. S�anchez Zeferino,1 U. Pal,1,a) R. Mel�endrez,2 H. A. Dur�an-Mu~noz,3
and M. Barboza Flores2
1Instituto de F�ısica, Universidad Aut�onoma de Puebla, Apdo. Postal J-48, 72570 Puebla, Mexico2Centro de Investigaci�on en F�ısica, Universidad de Sonora, Apartado Postal 5-088, Hermosillo, 83190 Sonora,Mexico3Departamento de Investigaci�on en Pol�ımeros y Materiales, Universidad de Sonora, Apartado Postal 5-088,Hermosillo, 83190 Sonora, Mexico
(Received 11 November 2012; accepted 22 January 2013; published online 11 February 2013)
Hydrothermally grown SnO2 and SnO2:Eu nanoparticles of 4–11 nm size range were analyzed by
photoluminescence (PL) and therrmoluminescence (TL) spectroscopy to study the effect of Eu-
doping on their emission behaviors. It has been observed that most of the incorporated Eu3þ ions
remain at the interstitial sites of SnO2 lattice. High Eu-contents in the nanoparticles generate lattice
deformation, formation of Eu3þ/Eu0 clusters at interstitial sites, or segregation to their surfaces.
Formation of Eu clusters at interstitial sites enhances electronic defect density in the crystal lattice,
reorganizes carrier trapping centers, and modifies their activation energies. Room temperature PL
emission and beta-irradiated TL dose response of SnO2 nanoparticles enhance significantly when
doped with 0.5 and 1.0 mol. % nominal of Eu3þ, respectively, opening up their possibilities
of applications in bio-imaging and radiation therapy. Possible mechanisms of enhanced PL and TL
responses of the samples have been discussed. VC 2013 American Institute of Physics.
[http://dx.doi.org/10.1063/1.4790486]
I. INTRODUCTION
Intrinsically n-type, wide band gap (3.6 eV, at room tem-
perature) semiconductor SnO2 has been successfully utilized
for gas sensing,1 solar cell fabrication,2 as transparent con-
ductive electrode,3 light emitting diode,4 and biological imag-
ing.5 For biological applications, SnO2 nanoparticles have
been doped with rare-earth (RE) ions like Eu3þ, Tb3þ, Er3þ
to improve their emission efficiency through energy transfer
processes between the RE ions and the host lattice.6–9 Incor-
poration of Eu3þ ions in SnO2 has been extensively studied in
the literature10–13 and it has seen to be most effective for this
purpose due to their high stability in oxide matrices and high
quantum yield. However, the emission behaviors of Eu3þ
incorporated metal-oxide nanostructures strongly depend on
the location of Eu3þ ions in host lattice, which needs a special
attention for their biological applications. SnO2 nanoparticles
of 2–100 nm size range have been synthesized utilizing
sol-gel,14 hydrothermal,15–17 chemical vapor deposition
(CVD),18 microwave irradiation,19 and other techniques.
Effects of RE ion doping in them have been studied utilizing
cathodoluminescence (CL),20 photoluminescence (PL),12 and
other spectroscopic techniques.21 However, the mechanism
of Eu3þ incorporation, specially their location in the host lat-
tice and its effect on the emission behaviors of metal-oxide
nanostructures, has not been conclusive.
Nowadays, nanoparticles are of particular importance
for biological applications since most of the biological and
cellular processes occur at nanoscale. Nanoparticles of dif-
ferent materials are currently under clinical investigation for
utilization as drug-delivery vehicles, contrast agents, and
diagnostic devices to get approval by the Food and Drug
Administration.22 In medical applications like drug carriers,
photothermal agents, contrast agents, and radiosensitizers,
the most studied nanostructures include carbon nanotubes,
gold nanoparticles, and cadmium selenide quantum dots.23
Nanoparticles have high concentration of surface atoms and
defects at multiple nano-grain boundaries which can create a
large number of surface defects like charge-carrier trapping
centers at different energy depths. The quantum size effect
in nanostructured systems is responsible for luminescence
enhancement due to the high probability of radiative
electron-hole recombination after exposing them to ionizing
and non-ionizing radiations. For radiation detection and do-
simetry, novel nanophosphors like CaSO4:Dy, BaSO4:Eu,
Al2O3, ZnO, YAG, LiF:Mg, Cu, P, K2Ca2(SO4)3:Eu, and
Ba0.97Ca0.03SO4:Eu have been found to be promising in high
dose radiation fields due to their characteristic radiation re-
sistance properties.24
Thermally stimulated luminescence, commonly called
as thermoluminescence (TL), is the emission of light after
thermal stimulation of previously irradiated material. The
integrated TL emission response of dosimetric materials is a
function of the radiation dose. However, it has been observed
that the TL emission intensity of all the above mentioned
nanophosphors is lower than their bulk counterparts, while
their dose saturation occurs at higher doses in comparison to
conventional (bulk) specimen. TL sensitivity and high dose
saturation in nanoparticles seem to depend on their size.
Though the size effect has been observed very frequently, no
clear explanation for the distinct TL characteristics of these
nanoparticles is currently available.a)Electronic mail: [email protected].
0021-8979/2013/113(6)/064306/6/$30.00 VC 2013 American Institute of Physics113, 064306-1
JOURNAL OF APPLIED PHYSICS 113, 064306 (2013)
[This article is copyrighted as indicated in the article. Reuse of AIP content is subject to the terms at: http://scitation.aip.org/termsconditions. Downloaded to ] IP:
148.228.149.137 On: Sat, 04 Jan 2014 21:27:57

In this communication, we report on the PL and TL studies
of hydrothermally grown well crystalline SnO2 and SnO2:Eu
nanoparticles of uniform sizes to have an idea on the distribu-
tion of Eu3þ ions and its effects on their emission behaviors.
Effects of Eu3þ doping at different concentrations on the opti-
cal properties of SnO2 nanoparticles have been studied using
diffuse reflectance spectroscopy (DRS) and micro-Raman spec-
troscopy techniques. Useful properties like photo- and ther-
mally stimulated luminescence enhancement in SnO2:Eu
nanoparticles, which are of extreme importance when dealing
with their biomedical applications, are reported and discussed.
II. EXPERIMENTAL
SnO2:Eu nanoparticles were synthesized using hydro-
thermal method. In brief, an aqueous solution of NaOH (J. T.
Baker, 98.15%) prepared by dissolving 0.75 mol (3.0 g) of
NaOH in 30 ml of deionized water was added drop-wise to a
10 ml of SnCl4•5H2O (Sigma-Aldrich, 98%) solution con-
taining 0.015 mol (5.25 g) in 10 ml of water under magnetic
stirring until the pH of the mixture solution reaches close to
7.0. After 30 min of stirring, 45.0 ml of absolute anhydrous
ethanol (J. T. Baker, 99.8%) was added to the mixture. The
final pH of the mixture was adjusted to 7.0 by further addi-
tion of the NaOH solution. For preparing Eu-doped SnO2
samples, EuCl3•XH2O (Alfa Aesar, 99.9%) of different
amounts were added to the reaction mixture under vigorous
stirring before adjusting their final pH value. Eu3þ ion
contents in the solution were adjusted to maintain their nomi-
nal concentrations at 0.5, 1.0, and 2.0 mol. %. The final mix-
ture was homogenized for 10 min and then transferred into a
Teflon-lined stainless steel autoclave, which was placed in
an oven and heated at 190 �C for 24 h. The resulting white
precipitate was centrifuged, washed with water and ethanol
several times, and dried at 60 �C for 2 h. Some of the
obtained powders were air annealed at 700 �C for 2 h.
Transmission electron microscopic (TEM) observation
on the samples was performed in a Philips Tecnai F30 micro-
scope operating at 300 keV after dispersing colloidal samples
over carbon coated copper grids and drying at room tempera-
ture. Optical properties of the nanoparticles were studied
using micro-Raman spectroscopy (Horiba JOBIN-YVON
spectrophotometer), room temperature PL, and UV-Vis opti-
cal absorption spectroscopy (SHIMADZU UV-3101PC) in
the 200–800 nm spectral range. The 325 emission line of a
He-Cd laser (Melles Griot) of 15 mW power was utilized for
the excitation of the samples. TL glow curves of the samples
were recorded using a TL/OSL-DA-20 Ris� system
equipped with a 90Sr/90Y beta radiation source (5 Gy min�1).
The TL response was measured in between RT and 650 K in
nitrogen atmosphere, using a heating rate of 5 �C/s.
III. RESULTS AND DISCUSSION
High resolution TEM (HRTEM) images of the doped
and undoped samples (Fig. 1) revealed the formation of
FIG. 1. Typical HRTEM images of
SnO2 nanoparticles doped with (a) 0.0,
(b) 0.5, (c) 1.0, and (d) 2.0 mol. % (nom-
inal) of Eu3þ. Insets show corresponding
particle size distribution histograms.
064306-2 Zeferino et al. J. Appl. Phys. 113, 064306 (2013)
[This article is copyrighted as indicated in the article. Reuse of AIP content is subject to the terms at: http://scitation.aip.org/termsconditions. Downloaded to ] IP:
148.228.149.137 On: Sat, 04 Jan 2014 21:27:57

aggregated quasi-spherical nanoparticles in the range of
4–11 nm. It should be noted that no surface modifier or sur-
factant was utilized in our synthesis. From the size distribu-
tion histograms, the average size of the particles was
estimated to be 6.6, 8.6, 8.8, and 9.2 nm for the samples
doped with 0.0, 0.5, 1.0, and 2.0 mol. % (nominal) of Eu3þ,
respectively. As we can see, increase in Eu3þ content causes
a gradual increase in the size of SnO2 nanoparticles.
The interplaner spacings calculated from the HRTEM
images of the undoped sample were 0.33 and 0.26 nm, which
correspond to the (110) and (101) lattice planes of rutile
SnO2, respectively. For the case of 1.0 and 2.0 mol. % Eu3þ
doped samples, the interplanar spacing of the (110) plane
increased to 0.34 nm, probably due to a lattice expansion
caused by the incorporation of Eu3þ ions in the nanoparticles.
SnO2, which crystallizes in tetragonal rutile structure,
belongs to the point group D14h4.25 According to group theory,
the normal lattice vibrations at the U point of the Brillouin
zone are as follows:26
U ¼ 1A1g þ 1A2g þ 1A2u þ 1B1g þ 1B2g þ 2B1u
þ 1Eg þ 3Eu: (1)
While the B1g, Eg, A1g, and B2g modes of SnO2 are Raman
active, A2u and Eu are infrared (IR) active, and A2g and B1u
are inactive in both Raman and IR.
Raman spectra of all the samples (Fig. 2) revealed three
prominent dispersion peaks at about 476, 632, and 777 cm�1,
which could be assigned to the Eg, A1g, and B2g fundamental
modes of rutile SnO2, respectively.27 On the other hand,
there appeared two weak Raman peaks located at about 310
and 358 cm�1, which could be associated with the surface
modes of SnO2 nanostructures.28
Furthermore, there appeared a broad dispersion band at
about 580 cm�1 (S1), which has been reported as the charac-
teristic Raman band of SnO2 nanostructures by several
research groups.29,30 The intensity of this particular band has
been associated with the size of SnO2 particles, which gener-
ally decreases as the size of the nanoparticles increases. In
fact, Patra et al.31 have detected a similar Raman peak in
between 570 and 577 cm�1 for their SnO2 nanoparticles
and nanorods and associated with the surface-related defects
in these high surface area nanostructures. In general, the
intensity of all the Raman peaks decreased on increasing the
concentration of Eu3þ ions. The decrease of peak intensity
might be due to the incorporation of structural disorder or a
loss of crystallinity of the nanoparticles on incorporating
Eu3þ ions.
Band gap energies of the doped and undoped samples
(Fig. 3) were estimated from their diffuse reflectance spectra
utilizing Kubelka-Munk treatment32
K
S¼ ð1� R1Þ2
2R1� FðR1Þ: (2)
FðR1Þ is the so-called remission or Kubelka-Munk function,
where R1¼Rsample=Rreference, K is the absorption coefficient,
and S is the scattering coefficient. The band gap energy of
the nanoparticles was found to vary in between 3.80 and
3.90 eV with the variation of Eu3þ contents. A blue shift of
absorption edge was observed on incorporating Eu3þ ions in
SnO2 particles. As can be noted, the estimated band gap
energy of all the samples is higher than the band gap energy
value of bulk SnO2 (3.6 eV), probably due to the quantum
confinement effect of charge carries in these small particles.
The PL spectrum of the undoped sample (Fig. 4) exhib-
ited weak emission, revealing a broad emission band in
400–800 nm range, with maximum at around 580 nm (inset).
This visible emission has been frequently designated as yel-
low emission (�580 nm), assigned to the structural defects
such as oxygen vacancies (Vo) and interstitial Sn (Sni) in
SnO2 lattice.33,34 The PL spectra of all the Eu-doped samples
revealed characteristic PL bands associated with the 5D0
! 7F1 (588-599 nm), 5D0! 7F2 (608-633 nm), and 5D0! 7F3
(652-661 nm) interband transitions of Eu3þ ions along with the
weak yellow emission of undoped SnO2. While the nanopar-
ticles nominally doped with 0.5 mol. % of Eu3þ ions revealed
strongest emissions associated with the RE ions, doping at
1.0 mol. % and higher caused a luminescence quenching. How-
ever, the extent of PL quenching was not same for all the
transitions.
As we know, on irradiating an Eu3þ ion doped semicon-
ductor with high energy photons, electrons of its conduction
band get excited to the 7F2 level of the RE ion and then
FIG. 2. Raman spectra of SnO2 and SnO2:Eu nanoparticles annealed at
700 �C.
FIG. 3. Diffuse reflectance spectra of the SnO2 and SnO2:Eu nanoparticles.
The inset shows the ½FðR1Þ eV�2 vs photon energy (Kubelka-Munk) plots
of the samples.
064306-3 Zeferino et al. J. Appl. Phys. 113, 064306 (2013)
[This article is copyrighted as indicated in the article. Reuse of AIP content is subject to the terms at: http://scitation.aip.org/termsconditions. Downloaded to ] IP:
148.228.149.137 On: Sat, 04 Jan 2014 21:27:57

decay to 5D2 level (7F2! 5D2), and subsequently to the 5D0
level through nonradiative transition processes. However,
photons are emitted for the radiative transitions 5D0 ! 7FJ
(J¼ 0, 1, 2, 3, 4).
As the 5D0 ! 7F1 transitions are magnetic dipole
allowed, they are not affected by structural changes in the
vicinity of Eu3þ ions. On the other hand, the 5D0 ! 7F2
transitions are electrical dipole allowed (DJ � 2), and very
much sensitive to the local crystal filed of Eu3þ ions. To get
an idea of local distribution of Eu3þ ions in the SnO2 lattice,
we estimated the intensity ratio of the emissions (5D0
! 7F2 / 5D0 ! 7F1) associated with these two transitions,
which could be designated as asymmetric ratio.35 An
increase in the asymmetric ratio value would mean that most
of the Eu3þ ions are located at the distorted sites of SnO2 lat-
tice. On the other hand, a decrease or this ratio would indi-
cate that the Eu3þ ions are not located at distorted sites;
rather they are segregated to the surface of the SnO2 nano-
particles. Estimated asymmetric ratios were 0.40, 0.43, and
0.50 for our 0.5, 1.0, and 2.0 mol. % Eu-doped samples,
respectively. Such an increase in asymmetric ratio indicates
that on increasing the nominal concentration of Eu in the
reaction mixture, a higher number of Eu3þ ions incorporate
into the distorted lattice sites of SnO2 nanoparticles. As the
ionic radius of Eu3þ (0.112 nm) is much bigger than the ionic
radius of Sn4þ (0.071 nm), it is difficult for them to be
accommodated at the lattice sites of Sn4þ ions of SnO2 lattice.
Therefore, most of the Eu3þ ions get incorporated at the inter-
stitial sites of SnO2, though a fraction of them could also be
segregated to the surface of the nanoparticles. The energy dis-
persive spectroscopy (EDS) analysis of the samples (Table I)
revealed only about 0.09, 0.2, and 0.26 at. % of Eu in the
SnO2 particles prepared with nominal 0.5, 1.0, and 2.0 mol. %
of Eu3þ ions in the reaction mixture, respectively. On the
other hand, at. % of Sn did not vary significantly on increasing
the concentration of Eu. The observations suggest the incorpo-
ration of Eu3þ ions at interstitial sites, rather than substituting
Sn4þ ions.
Structural defects in the form of oxygen vacancies (Vo)
and interstitial Sn (Sni) in the SnO2:Eu3þ lattice act as trap-
ping level for electrons and holes. Trapping levels in a semi-
conducting system can be investigated by TL spectroscopy,
which is a highly sensitive technique to establish the pres-
ence and nature of localized states and recombination centers
that are responsible for the emission of light after thermal
stimulation of a previously irradiated specimen.36
The TL behaviors of the Eu-doped nanoparticles were
investigated by measuring their TL response in between RT
and 650 K. The TL response of the as-grown nanoparticles
was observed to vary from one TL run to another due to the
presence of adsorbed water at their surfaces, and a change in
their crystallinity during TL measurements. To eliminate
these problems, all the samples were air-annealed at 700 �Cfor 2 h before recording their TL glow curves again.
The TL glow curves of the undoped and Eu-doped nano-
particles after irradiating with 1638 Gy of b-rays (Fig. 5)
revealed three clear emission bands of varied intensities at
about 375, 459, and 580 K. For the 1.0% and 2.0% Eu-doped
samples, the position of the TL band near 459 K shifted to
FIG. 4. Room temperature PL spectra of the SnO2 nanoparticles doped with
(a) 0.5, (b) 1.0, and (c) 2.0 mol. % (nominal) of Eu3þ ions. The inset shows
the PL spectrum of undoped SnO2 sample.
TABLE I. EDS estimated composition of the SnO2 and SnO2:Eu nanopar-
ticles after annealing at 700 �C.
Elements (at. %)
Sample O Sn Eu
SnO2 80.77 19.23 …
SnO2:Eu (0.5%) 76.47 23.44 0.09
SnO2:Eu (1.0%) 78.27 21.53 0.2
SnO2:Eu (2.0%) 80.86 18.88 0.26
FIG. 5. TL glow curves for the undoped and Eu-doped SnO2 nanoparticles
exposed to 1638 Gy b-radiation and their deconvoluted TL peaks.
064306-4 Zeferino et al. J. Appl. Phys. 113, 064306 (2013)
[This article is copyrighted as indicated in the article. Reuse of AIP content is subject to the terms at: http://scitation.aip.org/termsconditions. Downloaded to ] IP:
148.228.149.137 On: Sat, 04 Jan 2014 21:27:57
higher temperatures (20 and 24 K, respectively), while the
intensity of all the emissions varied with the variation of
Eu3þ ion content. Although the overall intensity of the TL
emission increased drastically on incorporating a nominal
1.0% of Eu3þ ions, incorporation of Eu3þ ions in higher con-
centrations quenches the TL response of the nanoparticles.
Site distortions have significant effects on both PL and TL.
Changes in the TL peak temperatures indicate differences in
the trapping level energies, perhaps due to lattice expansion
and stress caused by dopant incorporation. Therefore, since
the TL signals are related to defects, shifts in a glow peak
temperature are expected with any alteration in the lattice.
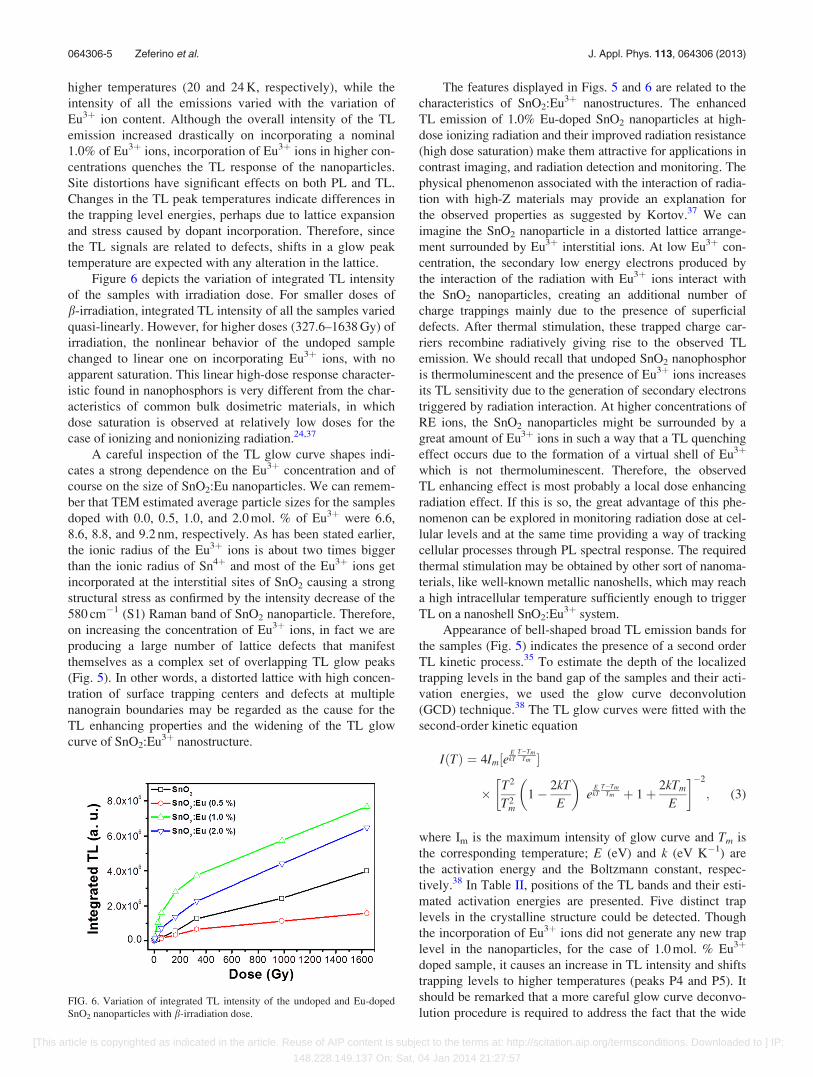
Figure 6 depicts the variation of integrated TL intensity
of the samples with irradiation dose. For smaller doses of
b-irradiation, integrated TL intensity of all the samples varied
quasi-linearly. However, for higher doses (327.6–1638 Gy) of
irradiation, the nonlinear behavior of the undoped sample
changed to linear one on incorporating Eu3þ ions, with no
apparent saturation. This linear high-dose response character-
istic found in nanophosphors is very different from the char-
acteristics of common bulk dosimetric materials, in which
dose saturation is observed at relatively low doses for the
case of ionizing and nonionizing radiation.24,37
A careful inspection of the TL glow curve shapes indi-
cates a strong dependence on the Eu3þ concentration and of
course on the size of SnO2:Eu nanoparticles. We can remem-
ber that TEM estimated average particle sizes for the samples
doped with 0.0, 0.5, 1.0, and 2.0 mol. % of Eu3þ were 6.6,
8.6, 8.8, and 9.2 nm, respectively. As has been stated earlier,
the ionic radius of the Eu3þ ions is about two times bigger
than the ionic radius of Sn4þ and most of the Eu3þ ions get
incorporated at the interstitial sites of SnO2 causing a strong
structural stress as confirmed by the intensity decrease of the
580 cm�1 (S1) Raman band of SnO2 nanoparticle. Therefore,
on increasing the concentration of Eu3þ ions, in fact we are
producing a large number of lattice defects that manifest
themselves as a complex set of overlapping TL glow peaks
(Fig. 5). In other words, a distorted lattice with high concen-
tration of surface trapping centers and defects at multiple
nanograin boundaries may be regarded as the cause for the
TL enhancing properties and the widening of the TL glow
curve of SnO2:Eu3þ nanostructure.
The features displayed in Figs. 5 and 6 are related to the
characteristics of SnO2:Eu3þ nanostructures. The enhanced
TL emission of 1.0% Eu-doped SnO2 nanoparticles at high-
dose ionizing radiation and their improved radiation resistance
(high dose saturation) make them attractive for applications in
contrast imaging, and radiation detection and monitoring. The
physical phenomenon associated with the interaction of radia-
tion with high-Z materials may provide an explanation for
the observed properties as suggested by Kortov.37 We can
imagine the SnO2 nanoparticle in a distorted lattice arrange-
ment surrounded by Eu3þ interstitial ions. At low Eu3þ con-
centration, the secondary low energy electrons produced by
the interaction of the radiation with Eu3þ ions interact with
the SnO2 nanoparticles, creating an additional number of
charge trappings mainly due to the presence of superficial
defects. After thermal stimulation, these trapped charge car-
riers recombine radiatively giving rise to the observed TL
emission. We should recall that undoped SnO2 nanophosphor
is thermoluminescent and the presence of Eu3þ ions increases
its TL sensitivity due to the generation of secondary electrons
triggered by radiation interaction. At higher concentrations of
RE ions, the SnO2 nanoparticles might be surrounded by a
great amount of Eu3þ ions in such a way that a TL quenching
effect occurs due to the formation of a virtual shell of Eu3þ
which is not thermoluminescent. Therefore, the observed
TL enhancing effect is most probably a local dose enhancing
radiation effect. If this is so, the great advantage of this phe-
nomenon can be explored in monitoring radiation dose at cel-
lular levels and at the same time providing a way of tracking
cellular processes through PL spectral response. The required
thermal stimulation may be obtained by other sort of nanoma-
terials, like well-known metallic nanoshells, which may reach
a high intracellular temperature sufficiently enough to trigger
TL on a nanoshell SnO2:Eu3þ system.
Appearance of bell-shaped broad TL emission bands for
the samples (Fig. 5) indicates the presence of a second order
TL kinetic process.35 To estimate the depth of the localized
trapping levels in the band gap of the samples and their acti-
vation energies, we used the glow curve deconvolution
(GCD) technique.38 The TL glow curves were fitted with the
second-order kinetic equation
IðTÞ ¼ 4Im½eEkT
T�TmTm �
� T2
T2m
1� 2kT
E
� �e
EkT
T�TmTm þ 1þ 2kTm
E
� ��2
; (3)
where Im is the maximum intensity of glow curve and Tm is
the corresponding temperature; E (eV) and k (eV K�1) are
the activation energy and the Boltzmann constant, respec-
tively.38 In Table II, positions of the TL bands and their esti-
mated activation energies are presented. Five distinct trap
levels in the crystalline structure could be detected. Though
the incorporation of Eu3þ ions did not generate any new trap
level in the nanoparticles, for the case of 1.0 mol. % Eu3þ
doped sample, it causes an increase in TL intensity and shifts
trapping levels to higher temperatures (peaks P4 and P5). It
should be remarked that a more careful glow curve deconvo-
lution procedure is required to address the fact that the wideFIG. 6. Variation of integrated TL intensity of the undoped and Eu-doped
SnO2 nanoparticles with b-irradiation dose.
064306-5 Zeferino et al. J. Appl. Phys. 113, 064306 (2013)
[This article is copyrighted as indicated in the article. Reuse of AIP content is subject to the terms at: http://scitation.aip.org/termsconditions. Downloaded to ] IP:
148.228.149.137 On: Sat, 04 Jan 2014 21:27:57

TL glow curve is formed by several overlapped TL peaks.
Physically, it means that we are in the case of a nanophosphor
with a complex continuous trap distribution that may result in
successive trapping and detrapping during the excitation and
recombination processes. A work on this line is in progress.
As argued earlier, the presence of the Eu3þ ions at inter-
stitial sites is probably responsible for the dose enhancing and
linear behavior of the SnO2 nanoparticles as observed in Figs.
5 and 6. Enhanced radiation effects involving interaction of
radiation with tissues in contact with high atomic number (Z)
materials are well known, but just recently enhancement of
radiation effects using high Z nanoparticles like silver, plati-
num, and gold has been explored.39 As we just mentioned,
enhanced radiation effect in our 1.0% Eu-doped SnO2 nano-
particles is encouraging for their therapeutic applications in
biological tissues. On the other hand, enhanced PL emission
of lightly doped SnO2:Eu nanoparticles opens the possibility
of their use for biological imaging under UV excitations.
IV. CONCLUSIONS
In summary, incorporation of Eu3þ ions in SnO2 nano-
particles drastically modifies their emission behaviors. Up to
a certain concentration, the incorporated Eu3þ ions remain at
interstitial lattice sites and enhance the characteristic PL emis-
sions of the RE ions. Incorporation of Eu3þ ions in higher
concentrations probably causes the formation of Eu3þ/Eu0
clusters at the interstitial sites and at the surface of the
nanoparticles, quenching their PL emission due to enhanced
recombination of photogenerated charge carriers. Incorpo-
rated Eu3þ ions drastically modify the charge trapping and
radiative recombination efficiencies of SnO2 nanoparticles,
producing significant TL and dose enhancing effects for
1.0 mol. % Eu3þ doped sample. No apparent dose saturation
up to kGy could be observed. The high Z value of Eu and
very small sizes of the formed Eu3þ or Eu0 clusters seem to
play main role on the observed TL dose enhancement effect
stimulated by the production of low energy secondary elec-
trons through the interaction of the radiation with the high-Z
Eu3þ ions. Studies are being carried out for different dopants
and hosts to verify this effect further. Functionalized nano-
structures with dose enhancing properties are of great impor-
tance for applications in radiotherapy, since they allow to
deliver a given radiation dose directly to a tumor while pre-
serving its surrounding tissues.
ACKNOWLEDGMENTS
The authors are thankful to VIEP-BUAP (Grant # VIEP/
EXC/2012), and CONACyT (Grant # 151767), Mexico for
their financial supports.
1J. G. Partridge, M. R. Field, J. L. Peng, A. Sadek, Z. Kalantar-zadeh, J. Du
Plessis, and D. G. McCulloch, Nanotecnology 19, 125504 (2008).2K. Hara, T. Horiguchi, T. Kinoshita, K. Sayama, H. Sugihara, and H. Ara-
kawa, Sol. Energy Mater. Sol. Cells 64, 115 (2000).3C. Wang, A. J. Appleby, and F. E. Little, Solid State Ionics 147, 13 (2002).4G. Shen, P.-C. Chen, K. M. Ryu, and C. W. Zhou, J. Mater. Chem. 19, 828
(2009).5R. R. Goncalves, M. Ferrari, A. Chiasera, M. Montagna, E. A. Morais,
L. V. A. Scalvi, C. V. Santilli, Y. Messaddeq, and S. J. L. Ribeiro, J. Meta-
stable Nanocryst. Mater. 14, 107 (2002).6E. E. Nyein, U. H€ommerich, J. Heikenfeld, D. S. Lee, A. J. Steckl, and
J. M. Zavada, Appl. Phys. Lett. 82, 1655 (2003).7N. Hamelin, P. G. Kik, J. F Suyver, K. Kikoin, A. Polman, A. Sch€onecker,
and F. W. Saris, J. Appl. Phys. 88, 5381 (2000).8M. Nogami, A. Ohno, and H. You, Phys. Rev. B 68, 104204 (2003).9M. Nogami, T. Enomoto, and T. Hayakawa, J. Lumin. 97, 147 (2002).
10T. Moon, S.-T. Hwang, D.-R. Jung, D. Son, C. Kim, J. Kim, M. Kang, and
B. Park, J. Phys. Chem. C 111, 4164 (2007).11X. Fu, H. Zhang, S. Niu, and Q. Xin, J. Solid State Chem. 178, 603 (2005).12A. C. Yanes, J. Del Castillo, M. Torres, J. Peraza, V. D. Rodr�ıguez, and
J. M�endez-Ramos, Appl. Phys. Lett. 85, 2343 (2004).13P. S. Chowdhury, S. Saha, and A. Patra, Solid State Commun. 131, 785 (2004).14S. Gnanam and V. Rajendran, J. Sol-Gel Sci. Technol. 53, 555 (2010).15H. Zhu, D. Yang, G. Yu, H. Zhang, and K. Yao, Nanotechnology 17, 2386
(2006).16U. Pal, A. C. P�erez, and M. H. Zald�ıvar, J. Appl. Phys. 103, 064301 (2008).17U. Pal, M. Pal, and R. S. Zeferino, J. Nanopart. Res. 14, 969 (2012).18Y. Liu, E. Koep, and M. A. Liu, Chem. Mater. 17, 3997 (2005).19A. Kar and A. Patra, J. Phys. Chem. C 113, 4375 (2009).20D. F. Crabtree, J. Phys. D: Appl. Phys. 7(1), L17 (1974).21H. V. Fajardo, E. Longo, L. F. D. Probst, A. Valentini, N. L. V. Carre~no, M.
R. Nunes, A. P. Maciel, and E. R. Leite, Nanoscale Res. Lett. 3, 194 (2008).22B. Y. S. Kim, J. T. Rutka, and W. C. W. Chan, N. Engl. J. Med. 363, 2434
(2010).23S. Jain, D. G. Hirst, and J. M. O’Sullivan, Br. J. Radiol. 85, 101 (2012).24N. Salah, Radiat. Phys. Chem. 80, 1 (2011).25S. H. Sun, G. W. Meng, G. X. Zhang, T. Gao, B. Y. Geng, L. D. Zhang,
and J. Zuo, Chem. Phys. Lett. 376, 103 (2003).26S. P. S. Porto, P. A. Fleury, and T. C. Damen, Phys. Rev. 154, 522 (1967).27P. S. Peercy and B. Morosin, Phys. Rev. B 7, 2779 (1973).28J. Zuo, C. Xu, X. Liu, C. Wang, Y. Hu, and Y. Qian, J. Appl. Phys. 75,
1835 (1994).29W. Chen, D. Ghosh, and S. Chen, J. Mater. Sci. 43, 5291 (2008).30A. Di�eguez, A. R. Rodr�ıguez, A. Vil�a, and J. R. Morante, J. Appl. Phys.
90, 1550 (2001).31A. Kar, S. Kundu, and A. Patra, J. Phys. Chem. C 115, 118 (2011).32A. E. Morales, E. S. Mora, and U. Pal, Rev. Mex. Fis. S 53, 18 (2007).33X. Xiang, X. T. Zu, S. Zhu, L. M. Wang, V. Shutthanandan, P. Nachimu-
thu, and Y. Zhang, J. Phys. D: Appl. Phys. 41, 225102 (2008).34B. Wang, Y. H. Yang, C. X. Wang, N. S. Xu, and G. W. Yang, J. Appl.
Phys. 98, 124303 (2005).35R. S. Ningthoujam, V. Sudarsan, and S. K. Kulshreshtha, J. Lumin. 127,
747 (2007).36R. Chen and S. W. S. McKeever, Theory of Thermoluminescence and
Related Phenomena (World Scientific, Singapore, 1997), p. 3.37V. S. Kortov, Radiat. Meas. 45, 512 (2010).38G. Kitis, J. M. G. Ros, and J. W. N. Tuy, J. Phys. D: Appl. Phys. 31, 2636
(1998).39J. F. Hainfeld, F. A. Dilmanian, Z. Zhong, D. N. Slatkin, J. A. Kalef-Ezra,
and H. M. Smilowitz, Phys. Med. Biol. 55, 3045 (2010).
TABLE II. TL peak positions (in absolute temperature, K) and activation
energies (in eV) of the carrier trap levels in undoped and Eu-doped SnO2
nanoparticles.
Peaks
Sample Parameters P1 P2 P3 P4 P5
SnO2 T 372 384 420 458 554
E 1.09 1.08 1.15 1.25 1.38
SnO2:Eu T 372 382 424 459 523
(0.5%) E 1.08 1.01 1.42 1.31 1.58
SnO2:Eu T 372 399 472 496 576
(1.0%) E 1.05 1.01 1.10 1.61 1.59
SnO2:Eu T 368 400 475 488 576
(2.0%) E 1.01 0.88 1.16 1.92 1.60
064306-6 Zeferino et al. J. Appl. Phys. 113, 064306 (2013)
[This article is copyrighted as indicated in the article. Reuse of AIP content is subject to the terms at: http://scitation.aip.org/termsconditions. Downloaded to ] IP:
148.228.149.137 On: Sat, 04 Jan 2014 21:27:57